Chapter 2
Economic and Fiscal Profile
COVID-19 in Canada
The COVID-19 pandemic is a global crisis that poses an unprecedented threat to our health. There is no effective treatment or vaccine. The virus is highly contagious–contagious even in asymptomatic and presymptomatic people–and infection can result in severe and fatal outcomes, particularly in older adults and people with underlying medical conditions. This disease is spreading rapidly around the world, with now over 11,000,000 cases worldwide, but actions by public health authorities in Canada have been able to control the spread at home.
In early March, as an exponential rise in cases was reported, governments across Canada took wide-ranging steps to mitigate and contain the spread of COVID-19. Restrictive public health containment measures were put in place such as closing schools, businesses, spaces of worship, and other gathering places, and cancelling mass gatherings. Across Canada, governments put in place, travel restrictions and stay-at-home policies.
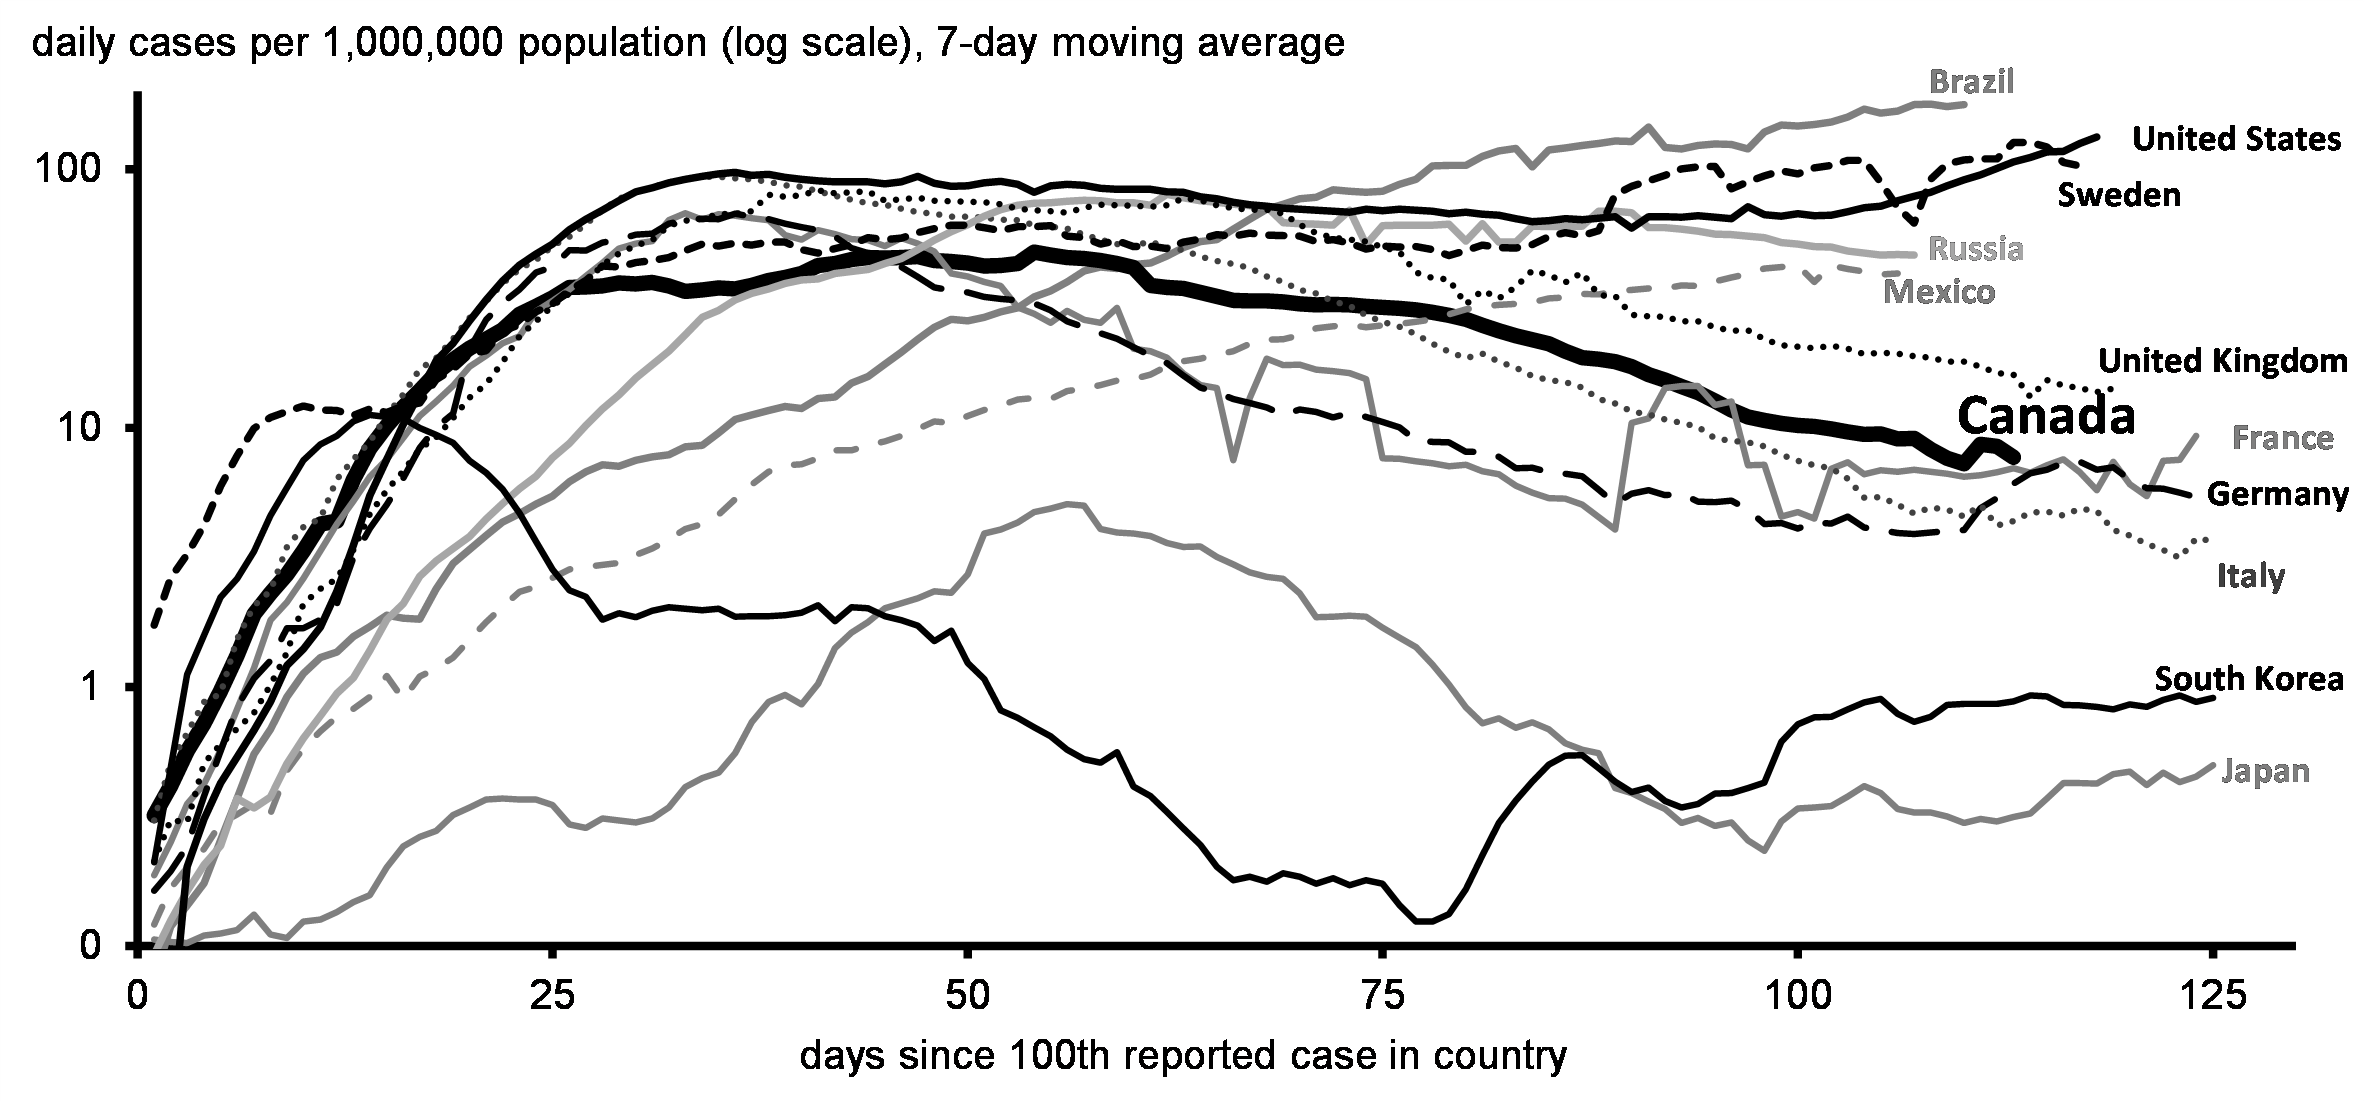
Canadian expertise, informed in part by the experiences of other countries in controlling the virus, allowed Canada to act decisively and deliver support where it was needed the most. While Canada flattened the curve sooner than a number of countries, other jurisdictions have demonstrated stronger epidemic control to drive case counts down more rapidly (Chart 2.1) and Canada will need to continue to be vigilant. This is an ongoing effort, requiring sustained public health measures to avoid resurgent transmission.
Chart 2.1
(population adjusted)
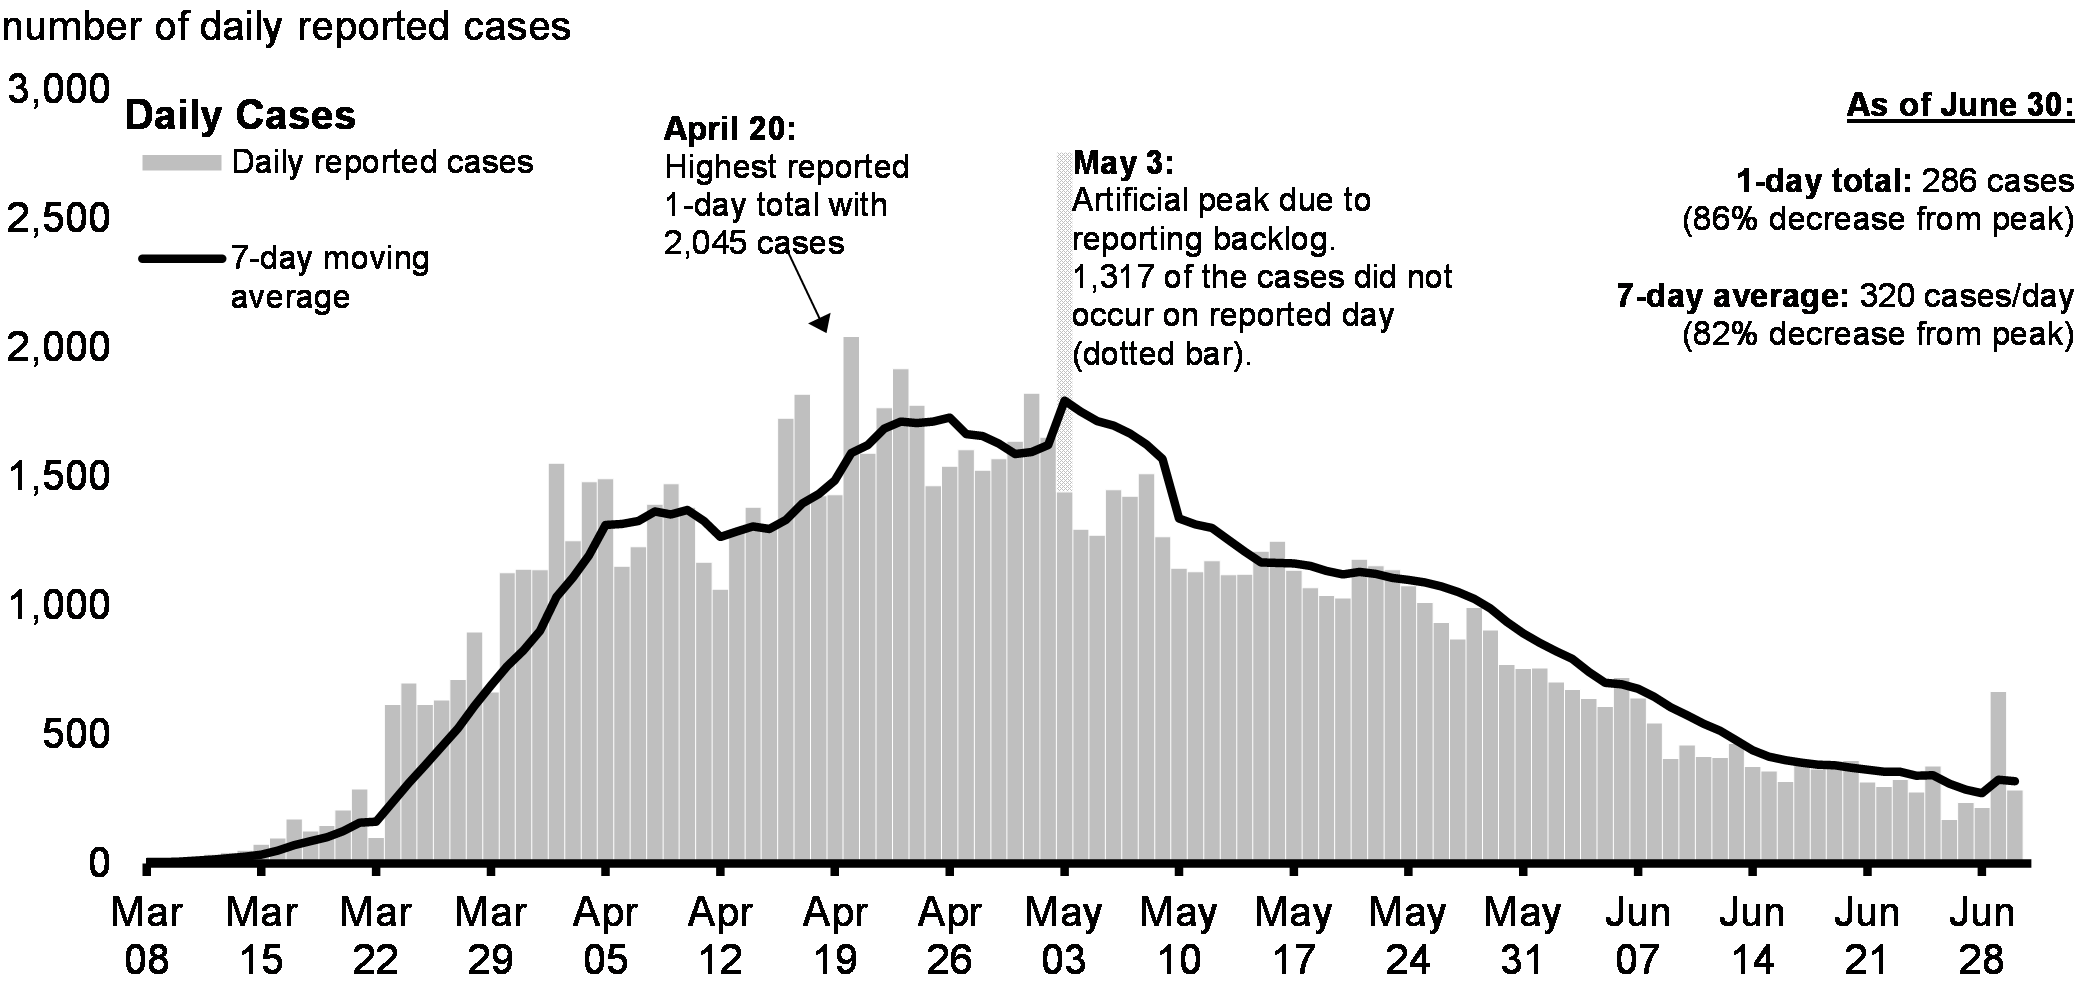
Since March, Canada has made significant progress in bringing the epidemic under control. The coordinated public health approach, supported by strong federal-provincial-territorial collaboration and the cooperation and commitment of Canadians, has significantly reduced the transmission rate of the virus. As of June 21, the 7-day incidence in daily new cases in Canada has declined by about 80 per cent from a plateau of about 1,730 new cases per day on April 26 (Chart 2.2) – a dramatic improvement compared to the potential epidemic trajectory suggested by its rapid increase in March.
Chart 2.2
(data as of June 30, 2020)
The initial wave of transmission has passed its peak, but the pandemic is far from over. In fact, as governments lift the more restrictive public health containment measures (for example, closing businesses) to minimize the associated economic and societal harms, it becomes important to double down on other essential public health controls, including improving case detection and isolation, contact tracing and quarantine, mask-wearing and adherence to physical distancing, to compensate and maintain epidemic control. And, as outlined in the Shared Public Health Approach to Support Restarting the Economy[1], the relaxation of some public health containment measures as provinces and territories have reopened has been coupled with strengthened protections for vulnerable populations, including seniors in long-term care facilities.
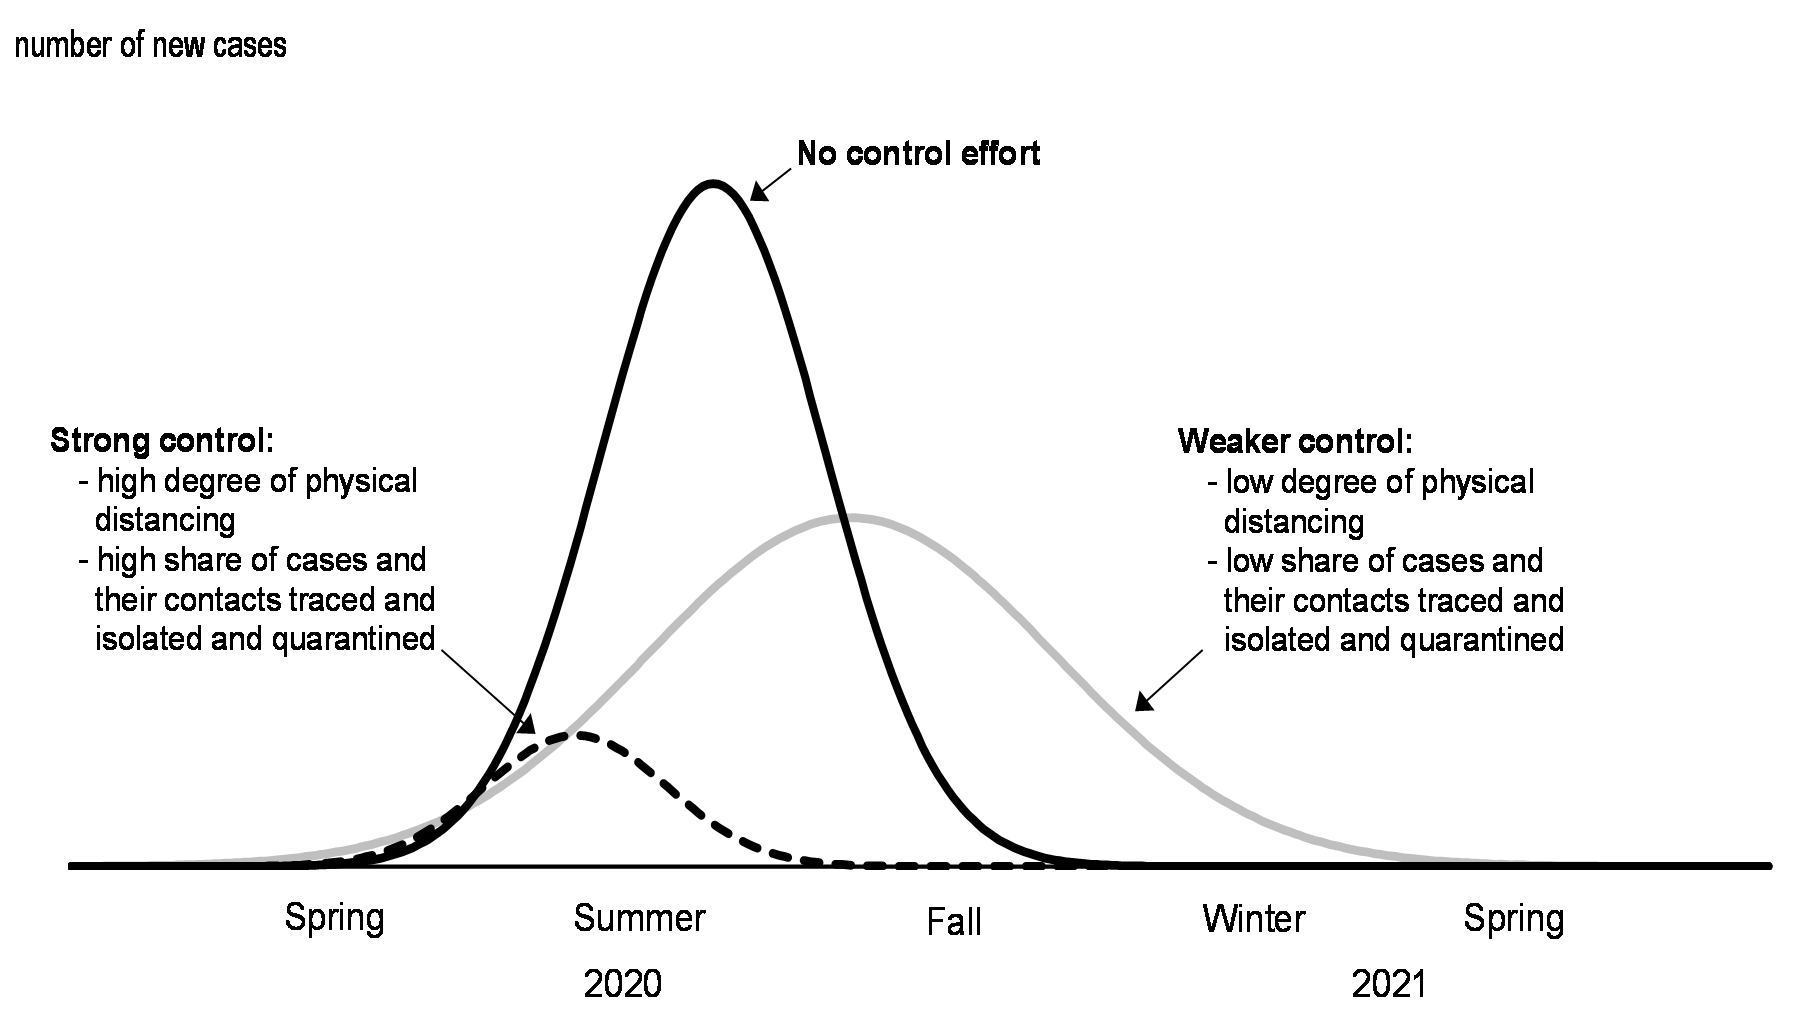
Modelled scenarios by the Public Health Agency of Canada reveal the critical role that public health measures have played, and will continue to play, in controlling the epidemic. They reveal that, without these controls, the impacts of the epidemic would have been orders of magnitude greater than has been the case to date (Chart 2.3).
Chart 2.3
As the provinces and territories begin to safely restart their economies, the federal government is investing in testing, tracing and health system capacity to mitigate and manage a possible resurgence. It is also investing in critical social services to ensure a fair and strong restart. Jurisdictions across Canada have released plans and frameworks for safe reopening of their economies that reflect their own specific experiences and needs. They have all been guided by public health considerations and follow a set of shared objectives and principles agreed upon by First Ministers in a joint statement on April 28, 2020.
Re-opening plans aim to manage the direct risk of COVID-19 while minimizing the unintended health, economic, and social harms of restrictive public health measures. They also aim to instill confidence in individuals and businesses as Canadians learn how to navigate their everyday lives while the virus is still circulating in Canada, even if at reduced levels. These plans are incremental, allowing certain activities to begin under safe conditions and modestly increasing the size of permitted gatherings. These plans are flexible, moving through phases based on careful monitoring of indicators such as the number of new cases and the rate of transmission (Table 2.1)
| Criteria | Indicators | ||
|---|---|---|---|
| 1 | COVID-19 transmission is controlled | check mark | Weekly number of cases |
| check mark | Weekly number of deaths | ||
| check mark | Transmission rate | ||
| 2 | Sufficient public health capacity is in place to test, trace and isolate all cases | check mark | Number of people tested per week |
| check mark | Per cent of positive tests per week | ||
| check mark | Proportion of cases acquired locally for which the source of exposure is unknown | ||
| 3 | Expanded health care capacity exists | check mark | Weekly number of ICU beds occupied by COVID-19 patients |
| check mark | Weekly per cent of total ventilators used by COVID-19 patients | ||
| 4 | Supports are in place for vulnerable groups/communities and key populations | check mark | Percentage of all deaths that occur within long-term care facilities and retirement residences |
| 5 | Workplace preventive measures are established to reduce risk | check mark | Top-3 settings with highest occurrence of outbreaks |
| 6 | Avoiding risk of importation of cases | check mark | Number of cases who had travelled internationally, and number of cases who had a contact with an international traveler |
| Source: Recommendations from the FPT Special Advisory Committee on COVID-19. | |||
Restarting the Canadian economy is a complex process. Health models show that when lockdown measures are lifted, other virus containment measures must be strictly followed in order to control the spread of the virus. Other measures, including physical distancing, increased capacity for testing and tracing, quarantine of contacts, and managing risk of transmission from international travel are more essential than ever. Data also show that some segments of the population have been particularly affected and may require additional support in order to ensure that every Canadian can participate in the economic recovery.
The government is committed to working with provinces and territories to ensure the appropriate supports are in place for all Canadians. As announced by the Prime Minister on June 5, the government will invest approximately $14 billion to support provinces and territories in the safe reopening of the country’s economies over the next 6 – 8 months.
These investments will ensure that provinces and territories not only have the assistance they need to support their economic reopening, but it also ensures they are prepared for the possibility of a future resurgence of the virus. This funding will drive critical health outcomes such as achieving the government’s goal of having the capacity in place to perform 200,000 tests per day nationally. Federal support in these areas will lead to real outcomes that protect and support all Canadians. The government is continuing discussions with provincial and territorial counterparts on each of these areas, and will report publicly on progress towards a Safe Restart Agreement as it is made.
| Priority Stream | Objectives | ||
|---|---|---|---|
| 1 | Testing and contact tracing | check mark | Increasing testing capacity to 200,000 tests per day |
| check mark | Federal-Provincial and Territorial partnership on the procurement of testing supplies and equipment and data sharing on testing inventory | ||
| check mark | Helping provinces and territories scale up contact tracing capacity | ||
| check mark | Contribute to improved and modern pan-Canadian data management to share disaggregated data | ||
| 2 | Health care capacity | check mark | Helping provinces and territories prepare for a potential second wave of COVID-19 |
| check mark | Supporting people experiencing mental health and problematic substance use challenges | ||
| 3 | Personal Protective Equipment (PPE) | check mark | Ensuring health and non-health workers have access to a PPE procurement service, and access to an emergency PPE Reserve |
| 4 | Vulnerable populations | check mark | Addressing immediate needs and gaps in supportive care (i.e. home care, long-term care, and palliative care) |
| check mark | Providing health and social supports for other vulnerable groups | ||
| 5 | Child care | check mark | Ensuring that a safe, sufficient and adequate supply of child care is available to support the gradual return to work of parents |
| check mark | Support the needs of staff, including through training, extra salary costs, and proper equipment (including PPE) to keep children and staff safe | ||
| 6 | Sick leave | check mark | Establishing a temporary income support program that provides workers with access to up to 10 days of paid sick leave related to COVID-19 who do not have access to other paid sick leave |
| 7 | Municipalities | check mark | Supporting municipalities through the fiscal impacts of COVID-19 including the increasing costs associated with a safe re-opening of the economy |
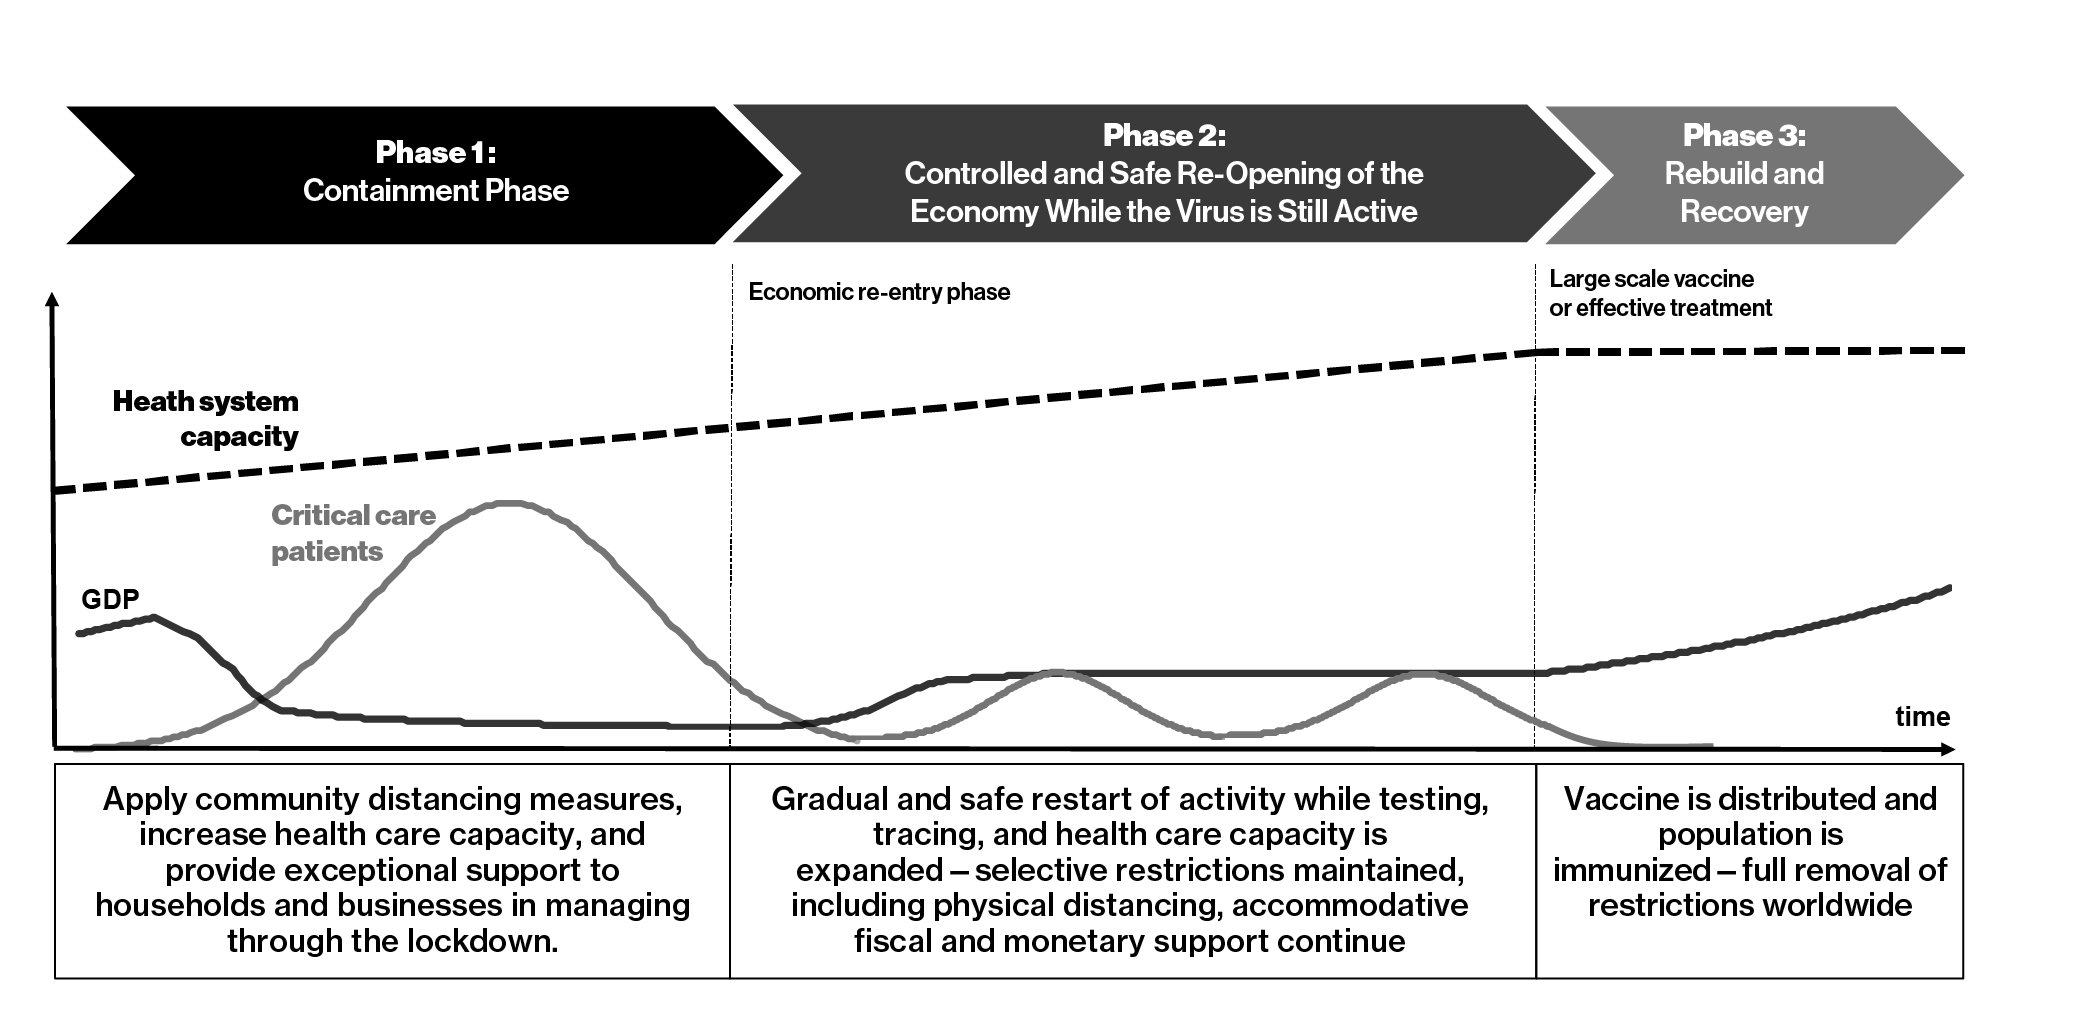
Living with COVID-19: Phases of the Pandemic and the Economic Recovery
Broadly speaking, the pandemic and its economic impacts can be characterized in terms of three phases. These phases are for illustrative purposes and the exact shape of each phase in reality would depend on the magnitude of successive viral transmissions and our ability to contain them. For example, a scenario with a series of repetitive peaks of similar size would suggest a longer period of phase 2 while a scenario with a larger peak would mean a resurgence of the containment phase following a brief period of phase 2.
Phase 1 – Containment Phase
Canada and many other countries went through a virus-containment phase in which comprehensive public health measures were taken to slow the spread of the virus. These measures had devastating impacts on the economy. By stepping in and providing rapid and substantial support to Canadians and businesses to help them get through the crisis, Canada’s COVID-19 Economic Response Plan has limited the severity of the decline in economic activity.
Phase 2 – Controlled Safe Re-opening of the Economy While the Virus is Still Active
In this phase, the economy will start to recover lost ground as the most stringent public health restrictions are relaxed. Activity in sectors or regions where risk of viral transmission is lowest will be among those first to rebound. Meanwhile, for the most exposed sectors, such as entertainment and travel, a full recovery may take much longer as restrictions are likely to stay in place or demand could take longer to fully return. The Canadian economy is likely to require ongoing policy support. Continued vigilance will be needed to avoid setbacks.
Phase 3 – Rebuild and Recovery
Only once a widely available vaccine or effective treatment becomes available can the economy fully bounce back. However, once the spread of infection is no longer active, the economy is expected to enter a faster re-building and recovery phase. Even when the pandemic is over, lasting consequences may cast a long-term shadow over economic developments, for example via more indebted businesses and households, persistent unemployment and substantial structural changes in the economy that have been accelerated through the crisis. In the coming months and as needed the government will announce measures to support the recovery.
Figure 2.1
Economic Situation
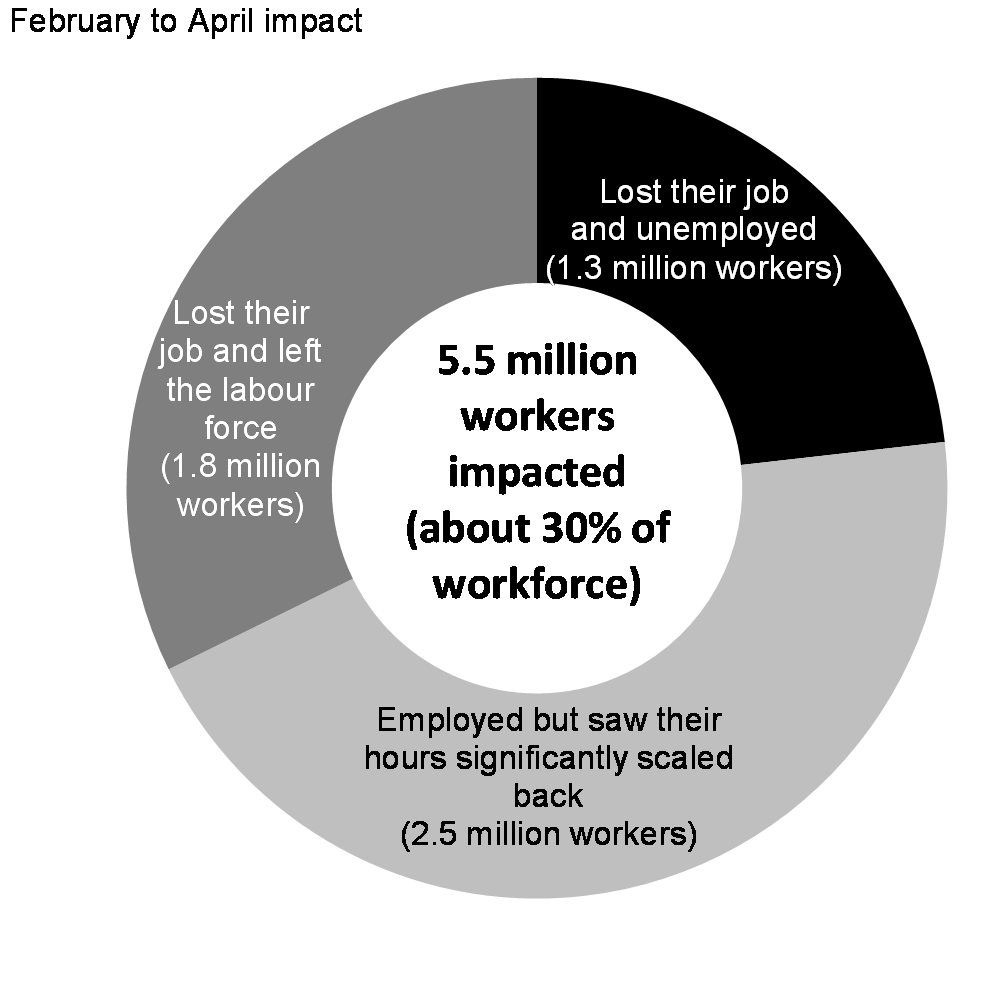
With unprecedented speed and breadth, the COVID-19 pandemic has affected nearly all aspects of life. Public health containment measures led to large segments of the economy coming to an abrupt stop, with activity in some industries driven to near zero. Workplaces and schools were closed, travel restricted, and public gatherings banned, resulting in drastic impacts on many aspects of Canadians’ lives. Over March and April, 5.5 million Canadians either lost their jobs or saw their hours significantly scaled back – a stark indicator of the cost to the Canadian economy. The employment rate (the share of Canadians with a job) fell to its lowest level on record (Chart 2.4). The toll on the broader economy in 2020 is expected to be the largest and most sudden economic contraction since the Great Depression.
The Government of Canada’s rapid and substantial economic support measures have helped protect Canadians from a far worse economic outcome, prevented more layoffs, and have laid a foundation for a faster and stronger recovery.
Chart 2.4

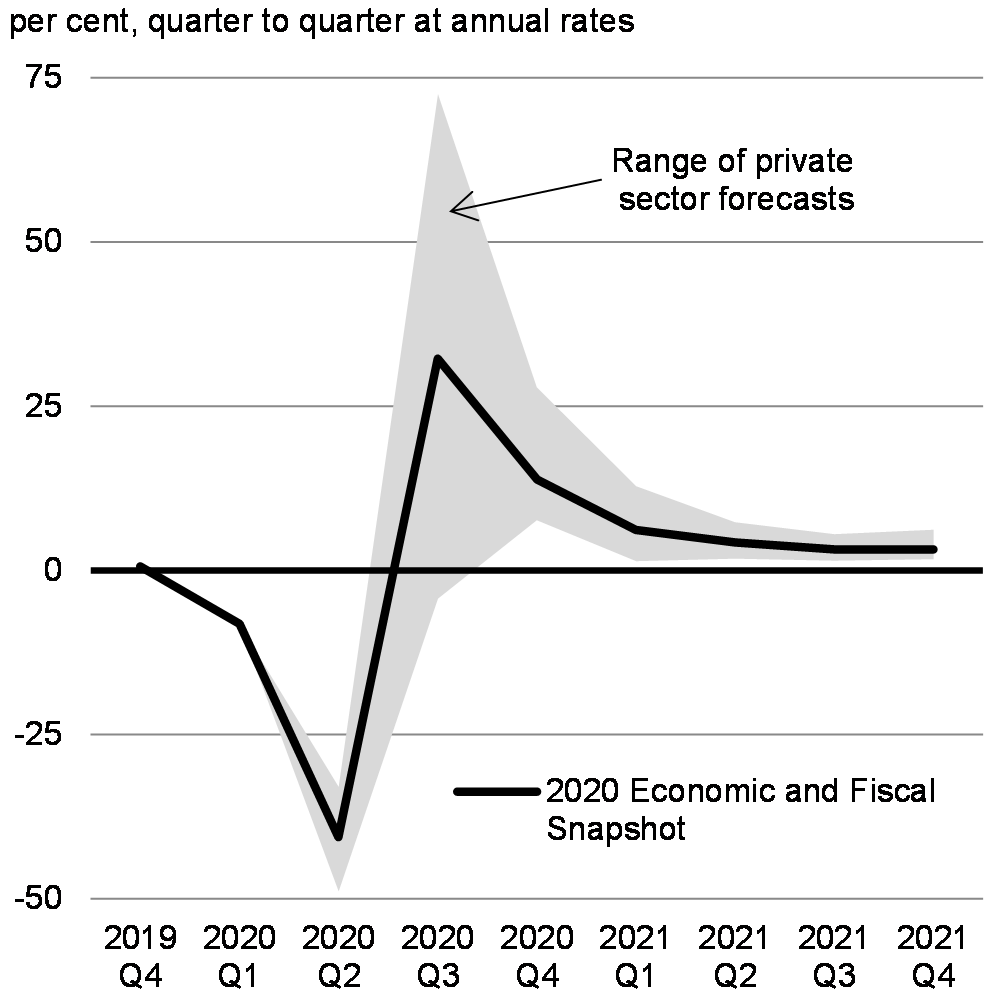
The drop in real GDP is expected to be at its deepest in the second quarter of 2020. The average of private sector views suggest a 41 per cent decline on an annualized basis (Chart 2.5). Beyond the second quarter, views become increasingly divergent about the pace of recovery, illustrating the extreme uncertainty associated with the economic outlook.
Given the unprecedented nature of this crisis, and the unknowns surrounding the virus, any forecast should be considered with caution. In recent recessions, economies have tended to return to pre-crisis activity levels in a matter of quarters, depending on their depth, as businesses and consumers regain confidence, and the economy gains strength. However, the current recovery could be interrupted by a resurgence in uncontrolled community transmission of the virus within a region, or more broadly, and a need to reinstate some stringent public health measures. That is why the government is taking significant steps to prepare for and achieve a safe and gradual restart of the economy, while investing in testing, tracing and health system capacity to mitigate and manage a possible resurgence of the virus. The best economic policy is containing the spread of the virus.
A challenging environment for forecasting
Uncertainty is inherent in any forecast. However, in the current context, uncertainty is magnified to unprecedented levels. In addition to recovery being driven by public health outcomes, it may not follow historical patterns – crises can have a profound impact on economies that lead to permanent change. For example, the supply effects from COVID-19 will mean that the economy may not be able to produce the same level of goods and services, even if demand returns to pre-crisis levels. For example, fewer tables at a restaurant because of continued physical distancing may mean fewer jobs and lower activity levels even if a restaurant is able to adjust its operations by incorporating take-away service. Additionally, travel restrictions and fear of the virus may also lead to lower levels of immigration in the short-term, limiting workforce growth.
The demand effects also remain unclear as consumer and business behaviour in the wake of lockdown measures is difficult to predict. Some households may become concerned about the possibility of an uncertain future and respond by putting off major purchases, increasing their savings, or paying down debt, even if their overall income has been unaffected by the crisis. Others, who have lost jobs and income in this crisis will face challenging circumstances until it is clear what will happen in the long term. Some may simply have saved up during the lockdown phase and will return to their pre-crisis spending patterns once they are able to do so. Businesses could also remain reluctant to invest and hire until they manage to improve their balance sheets and regain confidence about demand prospects. These are important factors that weigh on any forecast and reinforce the important role of the extraordinary set of actions taken by the government to stabilize the economy.
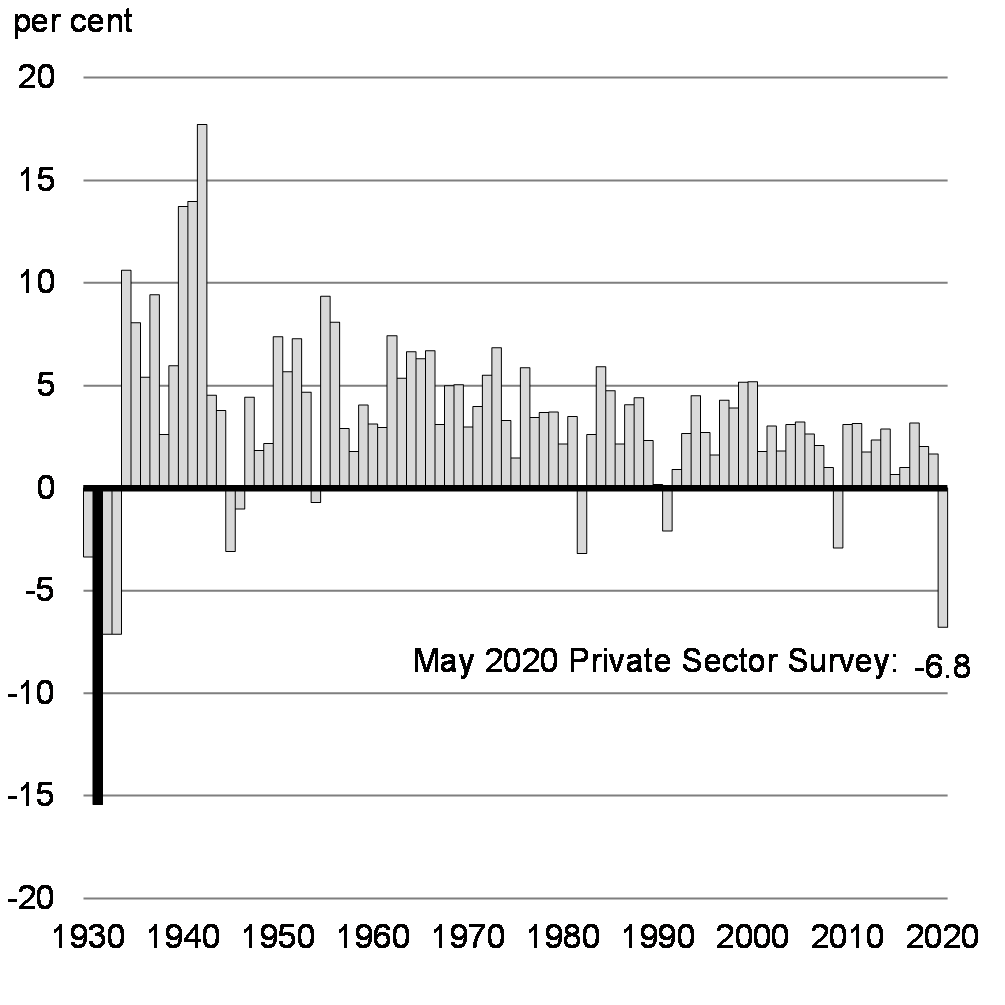
Every forecast includes a potential range of error and uncertainty. As the pandemic has unfolded in recent months forecasters have experienced wide fluctuations in their own estimates as new data has been released and incorporated. Estimates of the rate of real GDP growth have shifted dramatically over the last two months; for example, at the time the Department of Finance Canada surveyed the group of private sector economists in mid-March, they were expecting virtually no growth in economic activity for 2020 as a whole. Two months later, in the May survey, they revised significantly down their forecasts to a decline of about 7 per cent for 2020.
In light of this uncertainty, the 2020 Economic and Fiscal Snapshot provides a range of estimates to help Canadians understand the different economic outcomes that may be possible as the coming months unfold. This includes both the range of variation in estimates received from the Department of Finance Canada May survey of private sector economists, as well as the Department’s own additional scenarios based on alternative paths of COVID-19 transmission and economic recovery.
Currently, the average of private sector forecasts, which factors in the economic impact of government’s decisive fiscal support, outlines a faster rebound in real GDP than in the past three recessions. While Canada has made progress in controlling the COVID-19 epidemic and ensuring sufficient health system capacity, there is a risk that certain sectors of the economy will face greater difficulties in the months ahead as they contend with new health and safety regulations, changing consumer preferences and an uncertain global recovery. This unevenness across sectors of the economy could lead to a more gradual recovery scenario and divergence between regions. Further, a possible uncontrolled resurgence of the virus and any consequent tightening of public health measures could also lead to an even slower recovery scenario. Overall, the recovery path is uncertain and fundamentally linked to the equally uncertain health outcomes.
Chart 2.5


Economic Developments and Prospects
COVID-19 has had unprecedented impacts across the Canadian economy
Public health measures have saved lives and protected the Canadian economy from worse outcomes in the long-term. However, they have also had large negative disruptions to the Canadian economy. The closure of non-essential businesses, schools and child care services, combined with stay-at-home policies and restrictions on gatherings and travel led to sudden and significant shutdowns across Canada from the middle of March.
While all Canadians have felt the economic impacts of the pandemic, rapid and substantial federal action has stabilized the Canadian economy and limited the potential severity of economic disruptions. The Plan has prevented higher unemployment levels by protecting jobs—in early May, about one in four private sector workers was covered by the Canada Emergency Wage Subsidy (CEWS). Income support measures have helped Canadians cover their bills and have prevented mortgage defaults. Furthermore, support measures to businesses have alleviated some of the severe cash-flow pressures, creating a bridge through the crisis and averting costly business failures. The Government of Canada’s actions have prevented longer term damage to the economy and better positioned Canada for recovery.
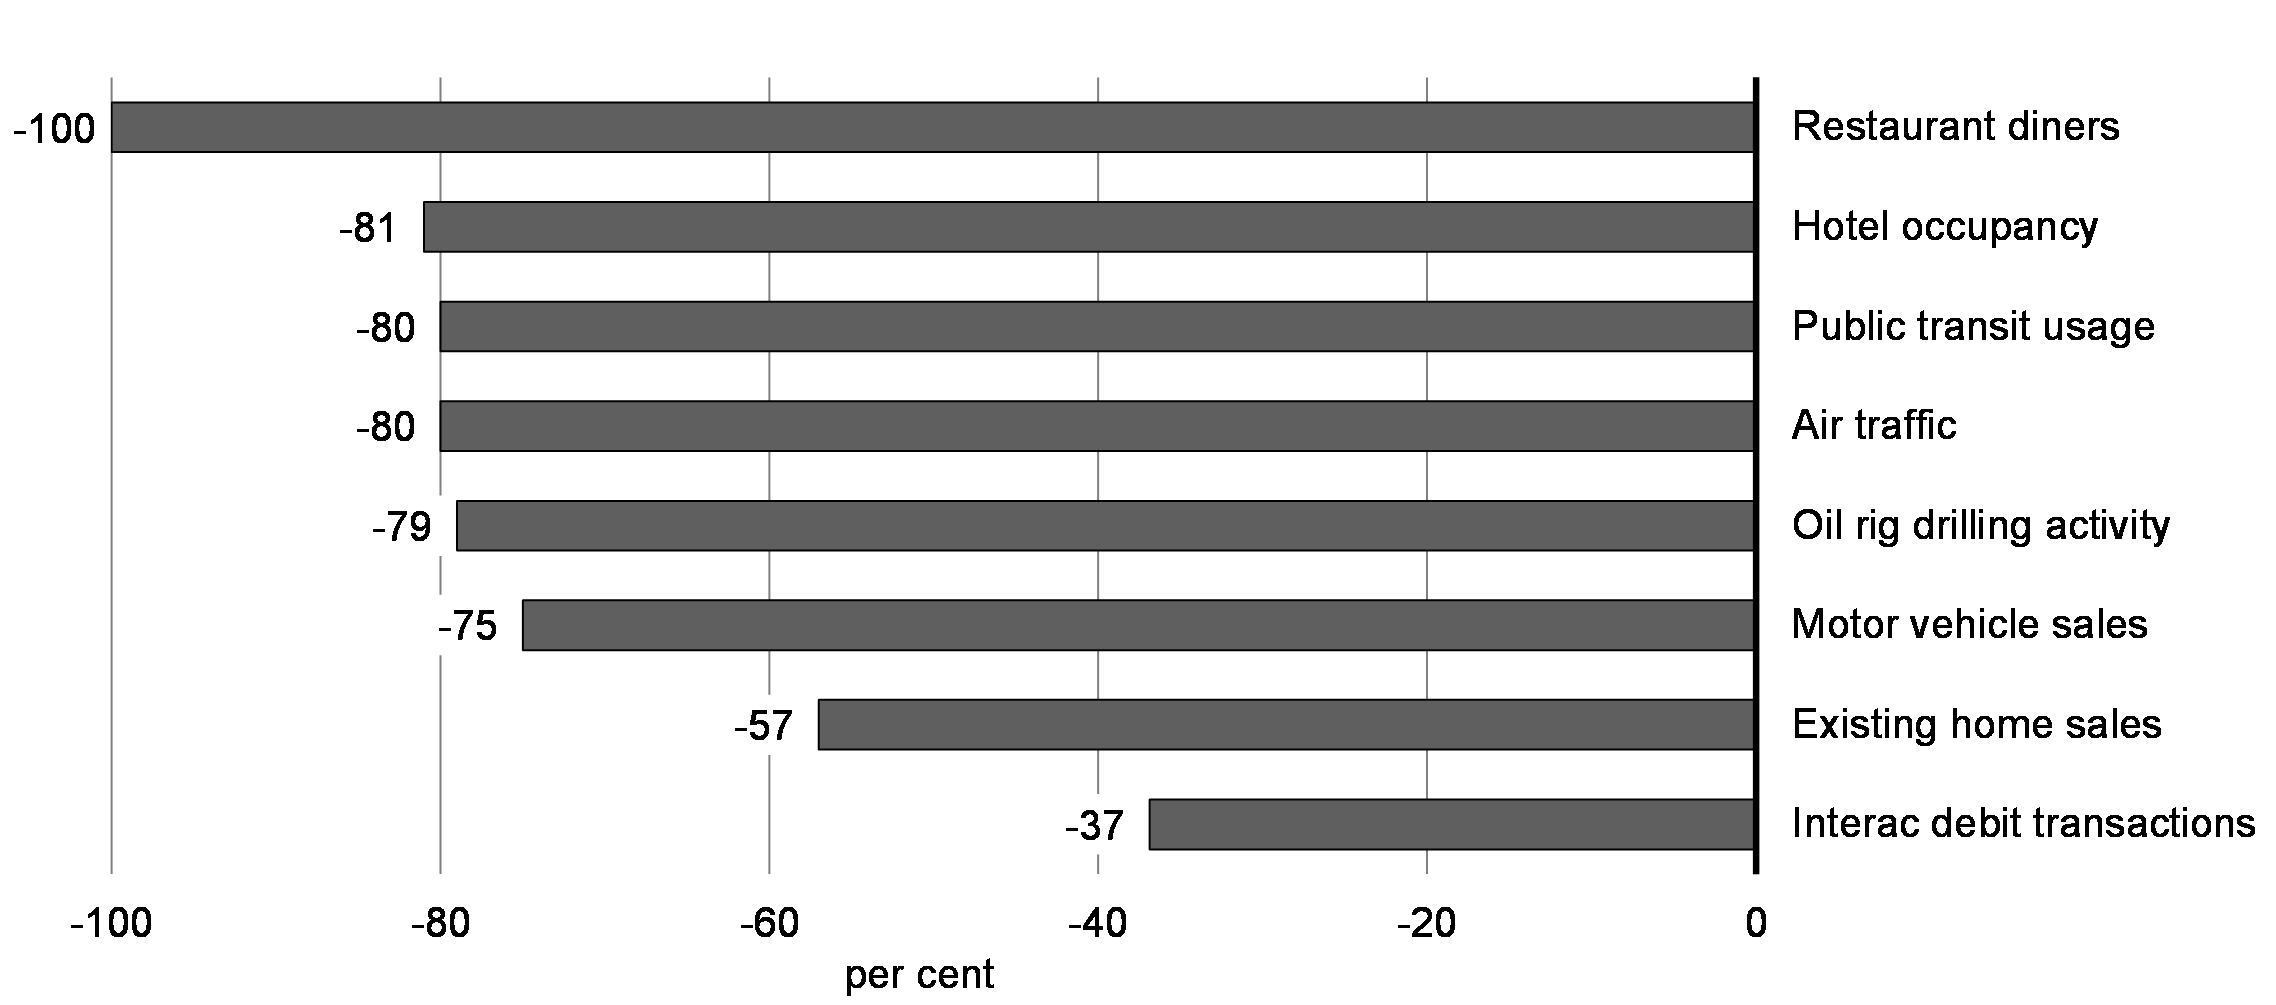
Businesses that rely on physical presence and interaction such as retail trade, travel, entertainment, hospitality and tourism, some of which employ a greater proportion of low-wage workers, visible minorities and women, will continue to feel the impacts acutely—businesses like restaurants, hotels, and sports and cultural venues (Chart 2.6). Additionally, Canadians put major purchases on hold, causing an unprecedented decline in sales of motor vehicles and homes. At the same time, non-discretionary spending surged in March, driven by massive purchases of basic necessities such as food, medication, and toiletries.
Chart 2.6
Businesses drastically reduced investment and overall costs in response to large revenue losses and high uncertainty, but government supports like CEWS have enabled many businesses to keep their workers. Small and medium-sized enterprises (SMEs), particularly in the service sectors, have been most directly affected by lockdowns, having limited financial buffers to mitigate the impact. Imports and exports also declined, as the effects of the lockdown in China in the early days of the pandemic took a sudden toll on foreign demand and began to impact global supply chains.
Combined with demand and confidence weakening abruptly, this drove an 8.2 per cent decline in real GDP in the first quarter of 2020 (expressed at annual rates), despite the restrictive public health containment measures only being in place for half of one month (Chart 2.7). The full impact of the containment measures is expected to result in a much larger decline in real GDP in the second quarter, with the level of activity down by about 20 per cent at peak of the lockdown in April. With activities gradually resuming in May, output across several industrial sectors increased slightly in the month but remains well below pre-pandemic levels.
Key labour market metrics underscore the economic impacts of Canadians’ efforts to contain the spread of COVID-19. A combination of job losses and sharp reductions in hours worked affected roughly 5.5 million Canadians from February to April – about 30 per cent of the workforce. The most significant impacts were concentrated in the service sector, particularly in areas affected by closure of non-essential activities, and where physical distancing and alternative work arrangements are more difficult or not possible, such as eat-in restaurants. Women have experienced slightly larger reduction in hours worked and lost their jobs earlier than men, reflecting their greater share of employment in some of the hardest-hit service industries. Differentiated sectoral impacts has also meant that low-wage workers, youth and very recent immigrants faced more significant job losses and reduced hours worked during the COVID-19 pandemic.
Chart 2.7

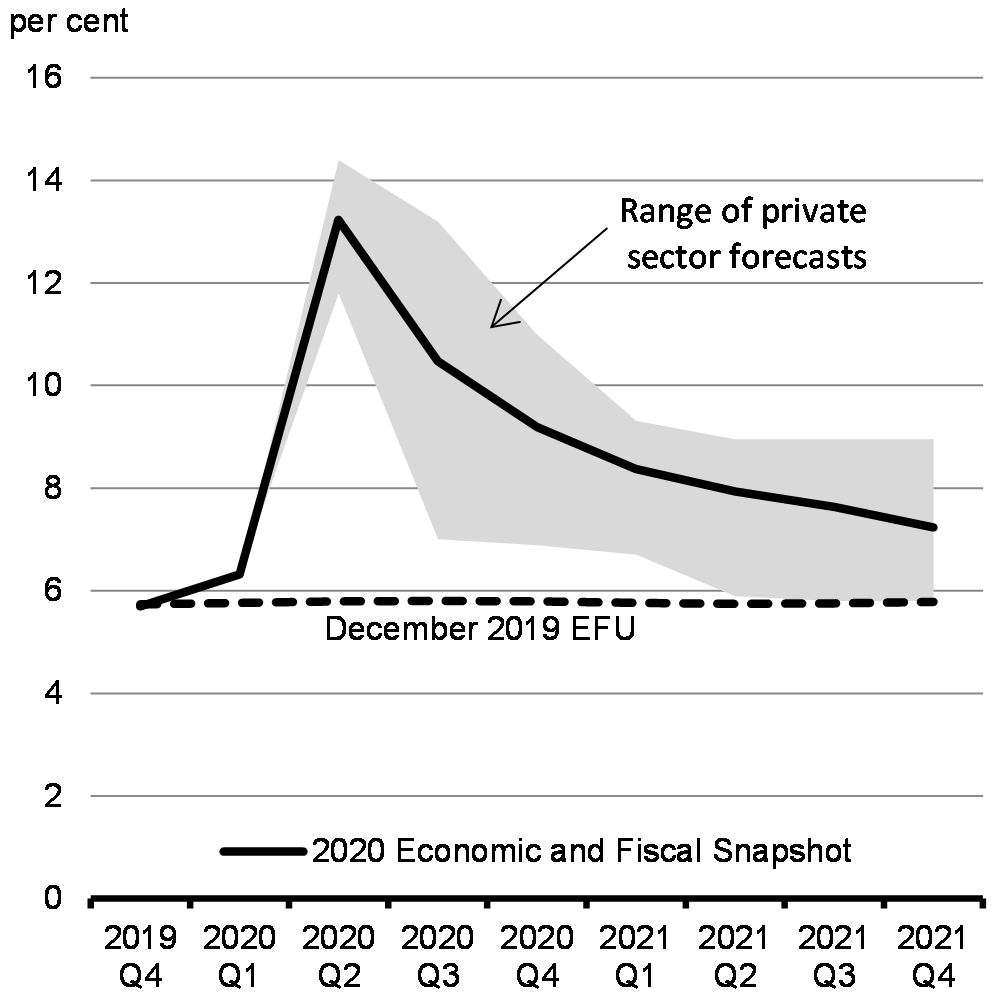
The unemployment rate rose to 13.7 per cent in May, its highest level on record, from a pre-crisis historical low of 5.5 per cent in January. Because many laid off individuals were not available or searching for work, given the circumstances, they are not among the officially unemployed looking for jobs and therefore not counted in the labour force. This contributed to the labour force participation rate dropping to its lowest level on record at the worst of the crisis. Millions of Canadian workers have been able to stay employed or return to work because of support received through the CEWS. This has prevented unemployment from rising higher and ensured that Canadians are able to stay connected to their jobs even if they are on furlough.
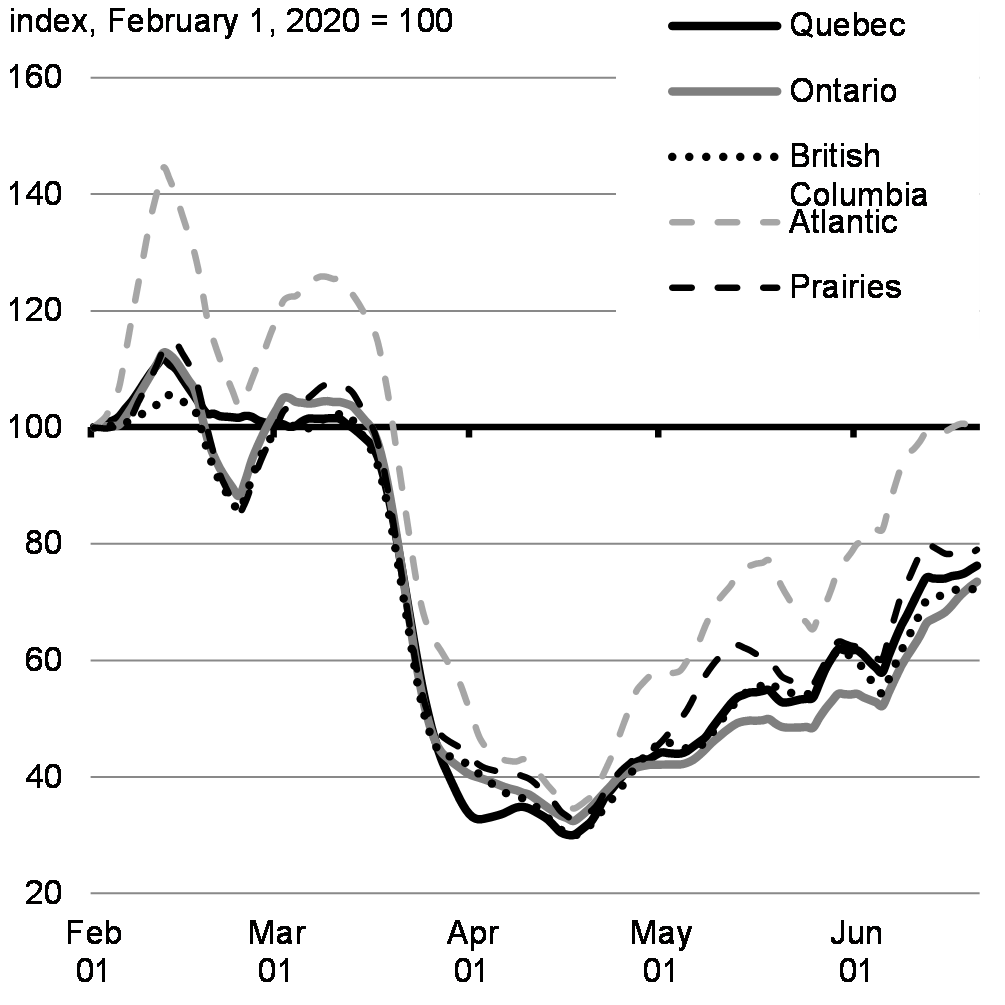
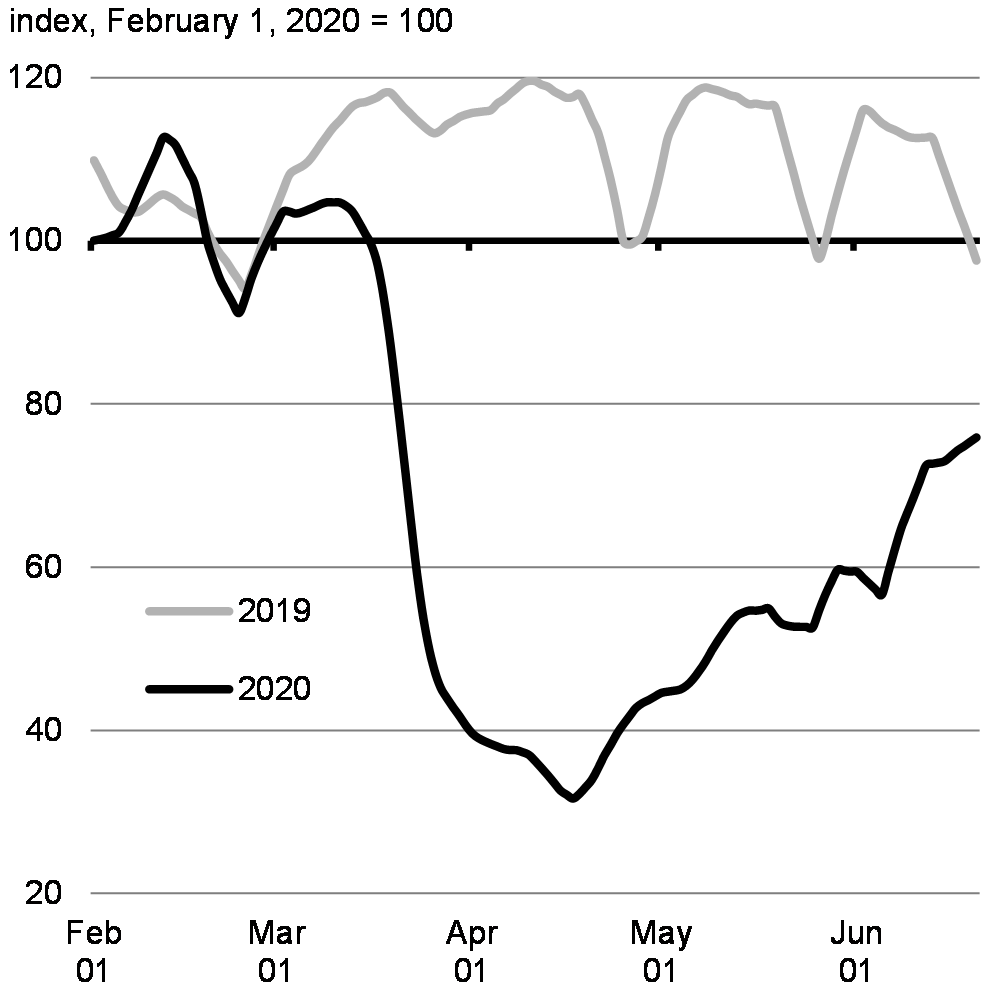
After two months, the labour market started showing some encouraging signs in May as the gradual re-opening of the economy began to take effect. The number of Canadians who worked less than half their usual hours dropped by close to 300,000 and about 290,000 laid-off workers were able to find a job. Moreover, job postings have been increasing since reaching a trough in mid-April, particularly in provinces less affected by the pandemic, although they remain at low levels compared to previous years (Chart 2.8).
Chart 2.8
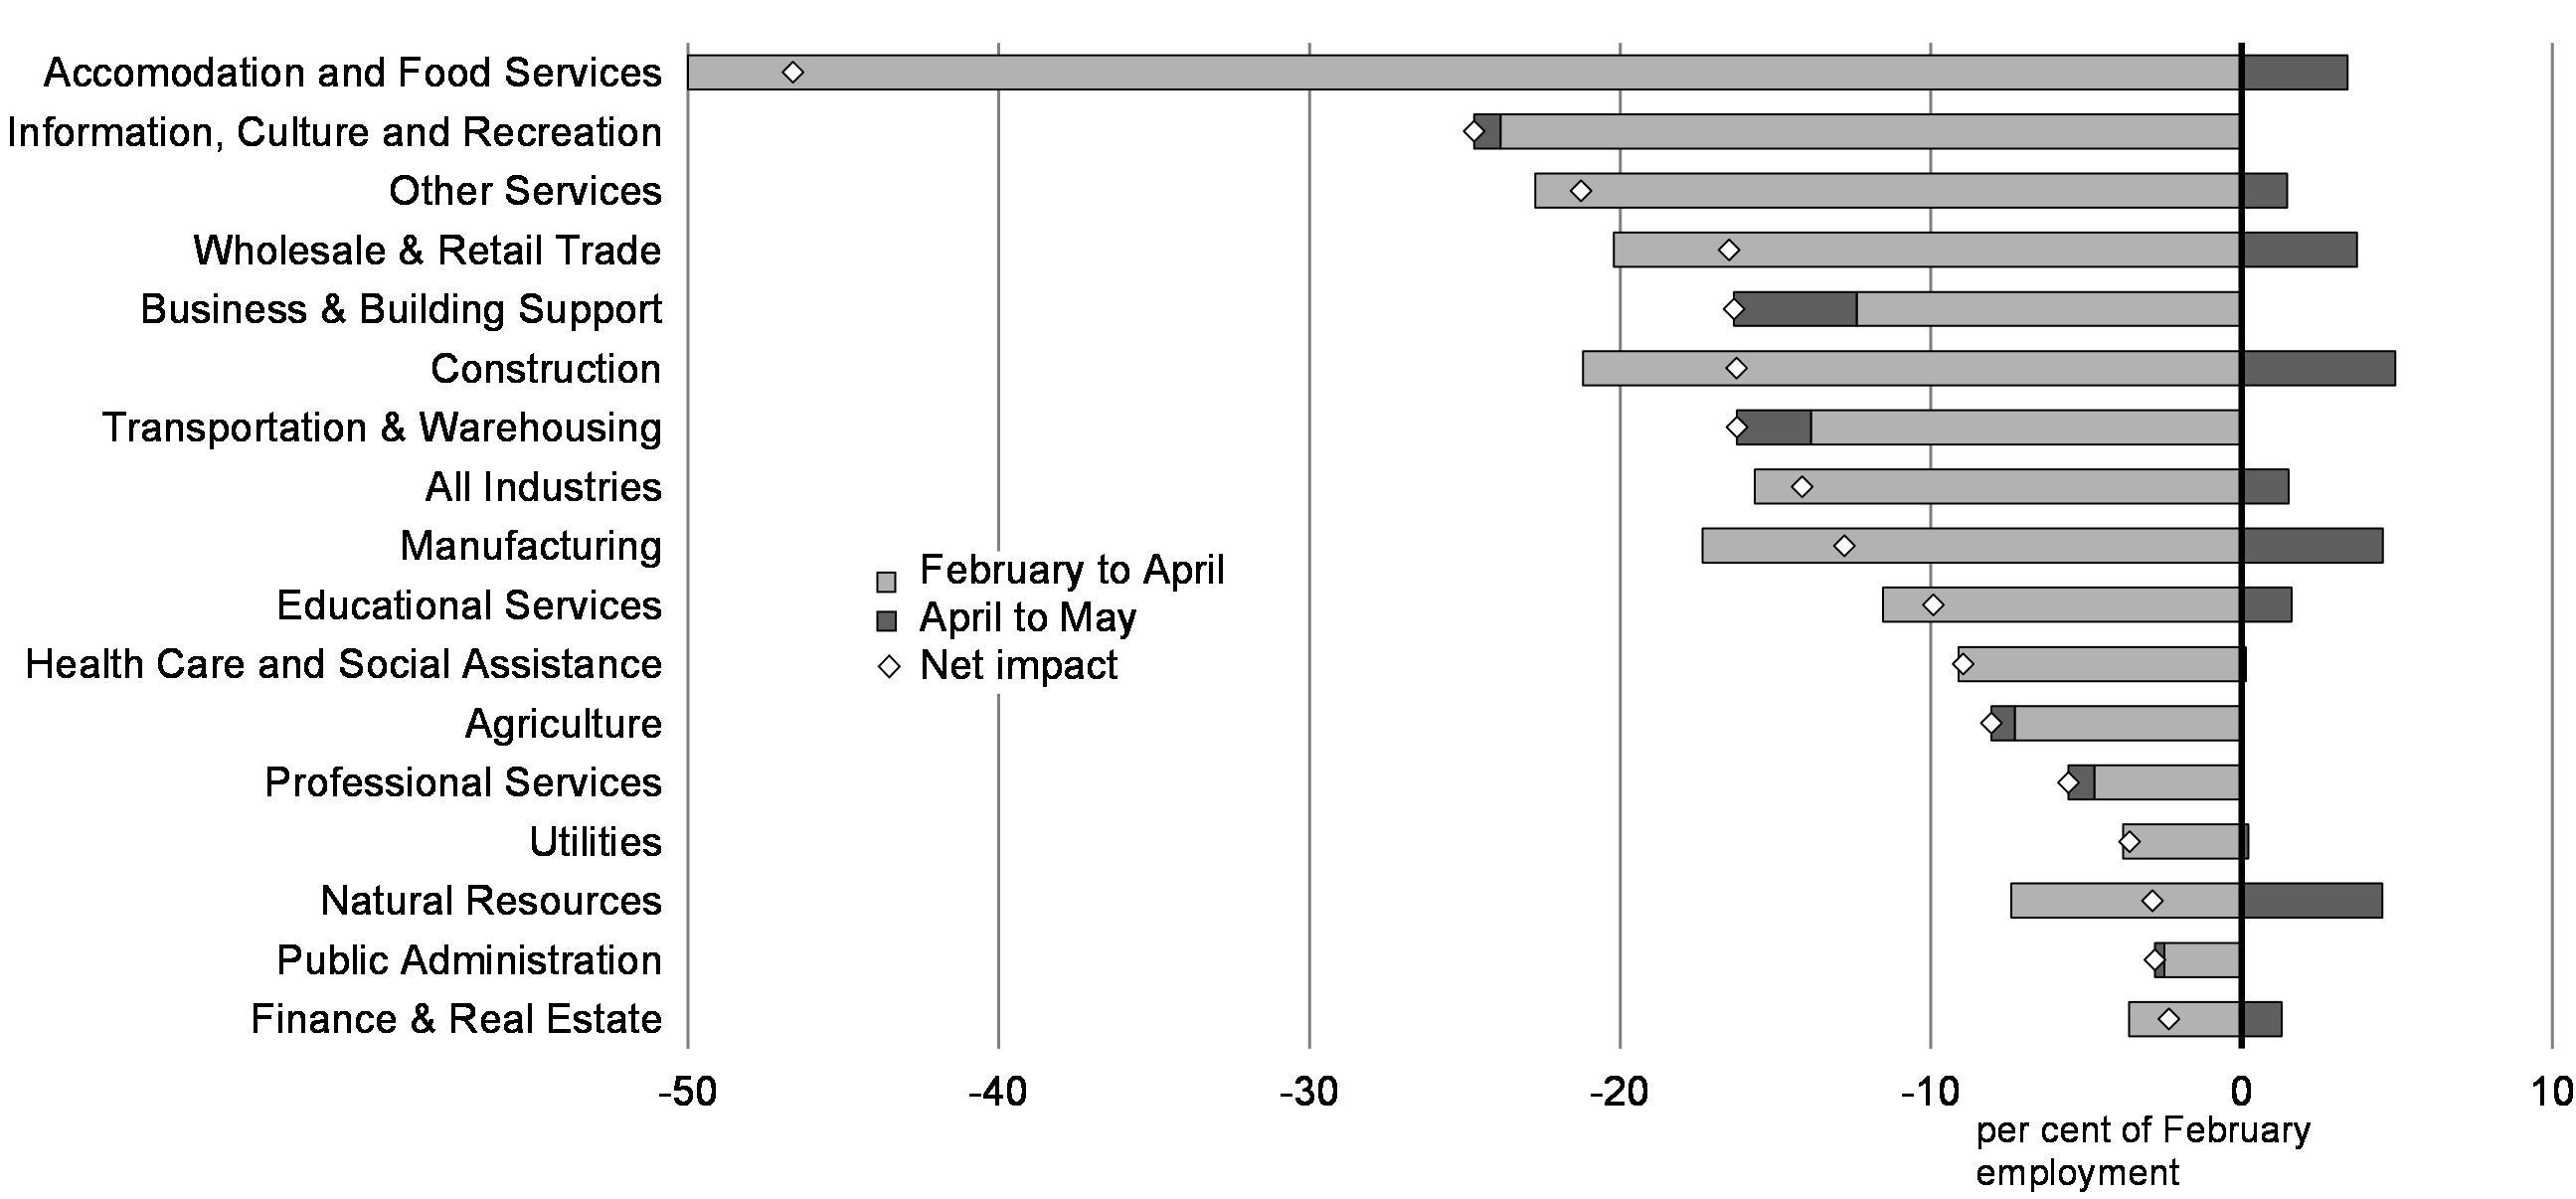
However, the employment and labour force participation rates remain far below their pre-crisis level and there remains considerable ground to recover for many Canadians who are working less than their regular hours. Job losses remain acute in many lower-wage industries (Chart 2.9) and fewer women were able to get back to work as the economy began to recover in May. In particular, the working hours of mothers of young children fell proportionally more than for fathers and mothers of older kids, reflecting the unpaid care work in the home that is disproportionately carried out by women. This underscores the important role of gender equality and child care in helping Canadians return to work.
Chart 2.9
Overall, more than 8 million Canadians had applied to the Canada Emergency Response Benefit (CERB). New weekly claims peaked during early April, around the same time job postings were at their lowest across all regions of Canada. Encouragingly, continuing CERB claims have since been declining while opportunities for job seekers have started to improve. In fact, it is estimated that close to 1.2 million Canadians have ceased requesting income support via the CERB as of the end of May. In addition, the CEWS is easing cash-flow pressures and providing support for employers to keep more Canadians at work, helping to prevent further job losses and ensuring businesses and workers can more easily resume operations as the economy reopens (Chart 2.10).
Chart 2.10
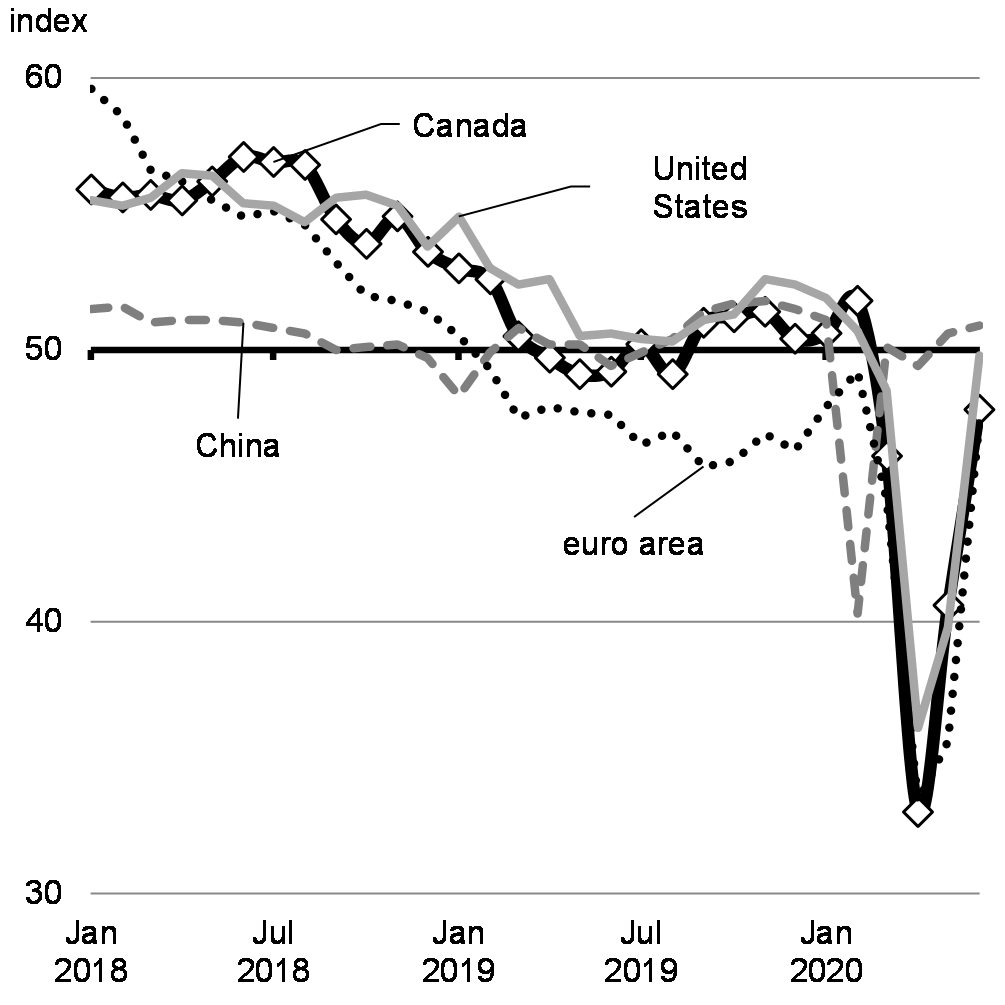
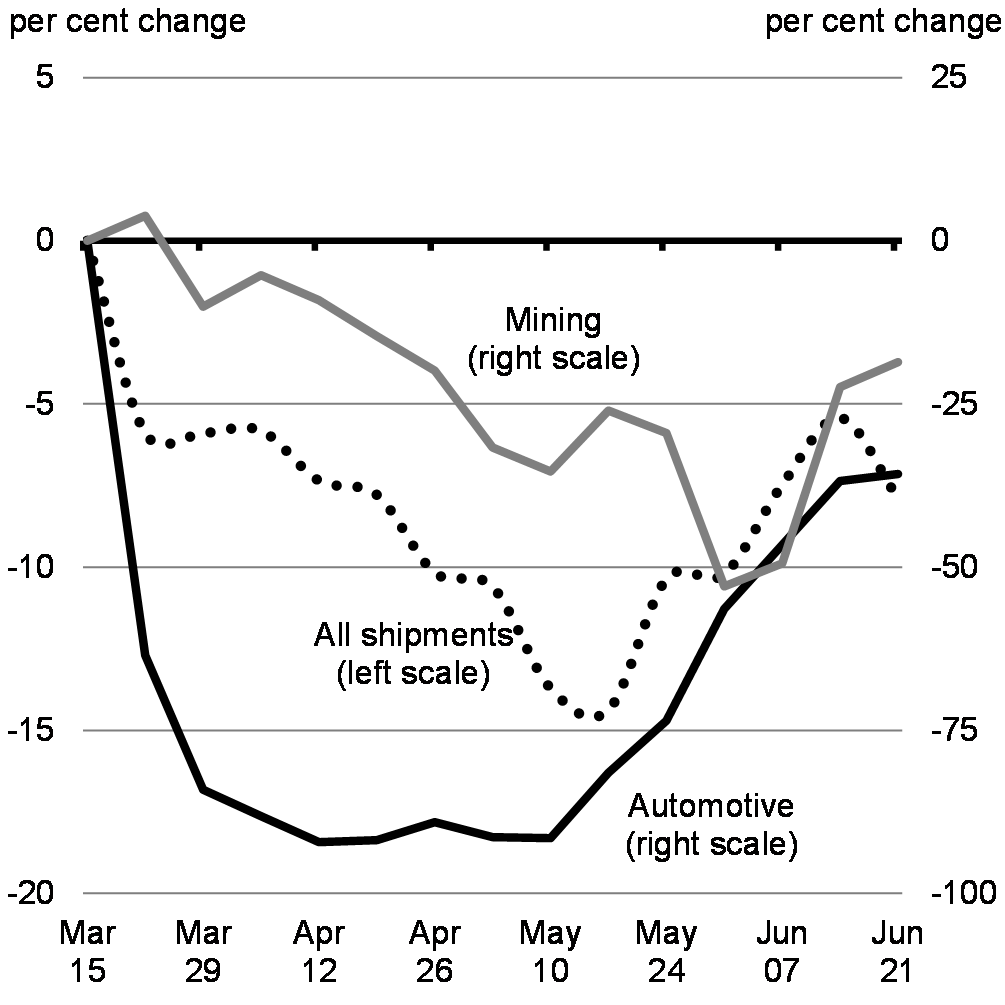
The services sector is the epicenter of the downturn and layoffs, led by acute drops in output and employment in air travel and hospitality industries. Accommodation and food services have experienced particularly severe job losses. This is important from an equity perspective, given that women and Canadians identifying as visible minorities are represented in greater numbers in this sector than among the population as a whole. However, losses have also been severe in the goods sector as manufacturing and construction industries have had to deal with severe drops in both domestic and foreign demand as well as some government-ordered restrictions on activity. Canadian businesses that rely on parts or other supplies from abroad or are suppliers to global partners themselves have seen disruptions to production as global output fell during the spring before stabilizing at low levels more recently (Chart 2.11). Meanwhile, weekly data from Canadian railways reveal dramatic declines in shipments across a number of major goods through mid-May, including automobiles, where North American production was shuttered for two months and sales collapsed.
Chart 2.11
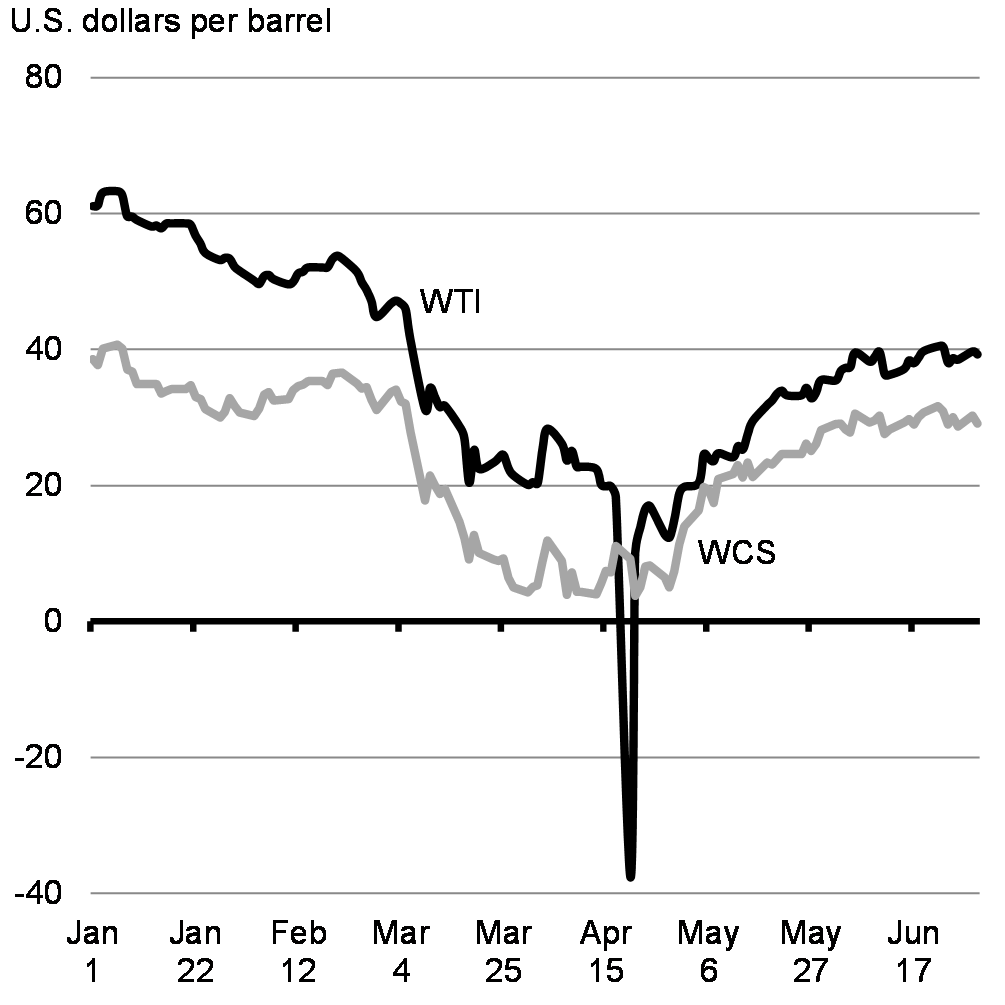
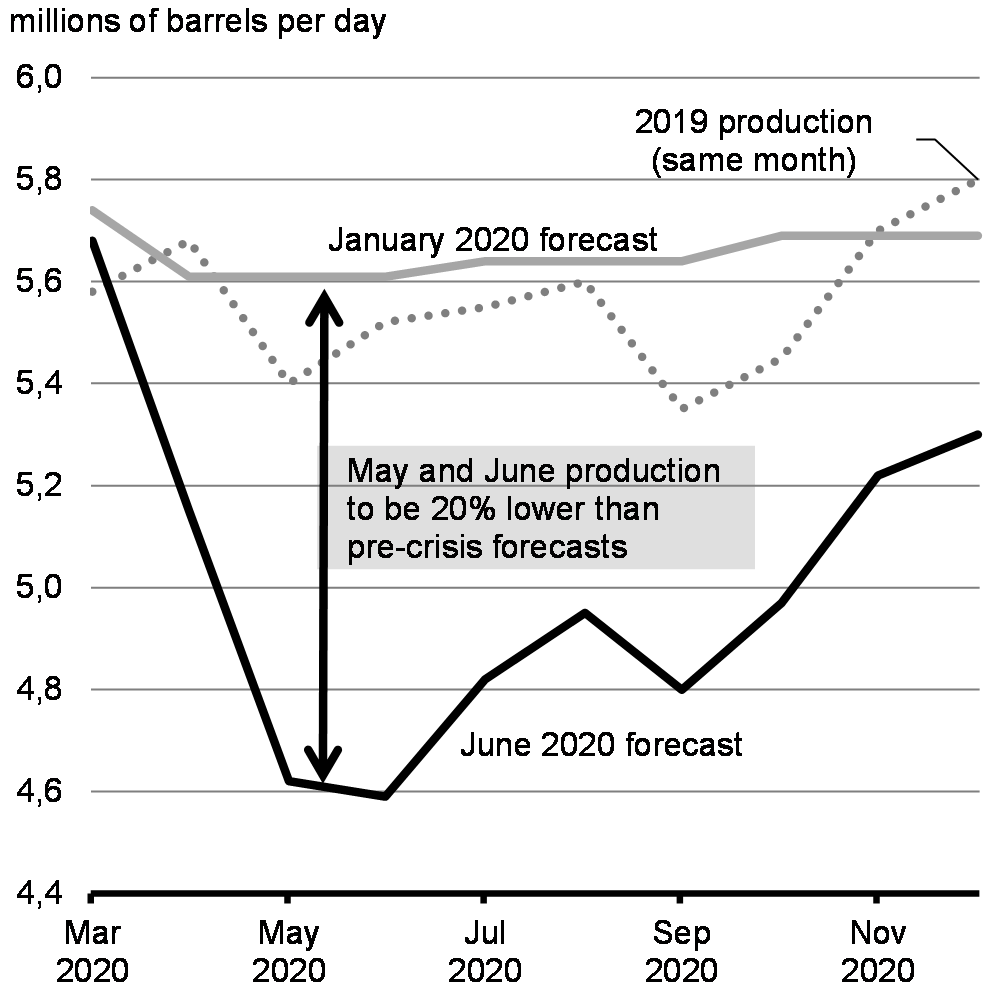
Canada’s oil-producing regions are coping with the additional challenge of drastically lower global crude oil prices, driven by sharply lower demand prospects due to the pandemic and higher supplies from OPEC+ producers, resulting in a rapid build-up in global oil inventories. In April, these conditions contributed to record lows for many benchmarks, with some prices even turning briefly negative (Chart 2.12). Canadian producers, facing lasting oversupply conditions, have responded with significant cuts in production, and reductions in investment and hiring. In particular, employment in mining and oil and gas support services fell by over 15 per cent between February and May. Oil prices, although showing some signs of improvement in recent weeks, remain well below pre-crisis levels.
In April, the Government of Canada announced $1.72 billion for the governments of Alberta, Saskatchewan, and British Columbia and for the Alberta Orphan Well Association, to clean up orphan and inactive oil and gas wells. This will help maintain approximately 5,300 jobs in Alberta alone. In addition, the $750-million Emissions Reduction Fund will provide conventional and offshore oil and gas companies with repayable contributions to support investment to reduce greenhouse gas emissions and conduct research and development.
Chart 2.12
The worst is behind us, but recovery will be gradual and uneven
There are growing signs that the worst of the economic shock is behind the Canadian and global economies. Across Canada, all orders of government are working together to gradually and safely re-open the economy, guided by health considerations. The recession likely reached its lowest point in late April, although a large share of the economy still remains idled. In May, prompted by signs that COVID-19 transmission is increasingly mitigated and sufficient public health measures are in place to detect and manage pockets of emerging transmission, jurisdictions across Canada began taking steps to safely open previously restricted aspects of the economy. Encouragingly, an increasing number of businesses across sectors like retail, manufacturing and construction report now being fully open.
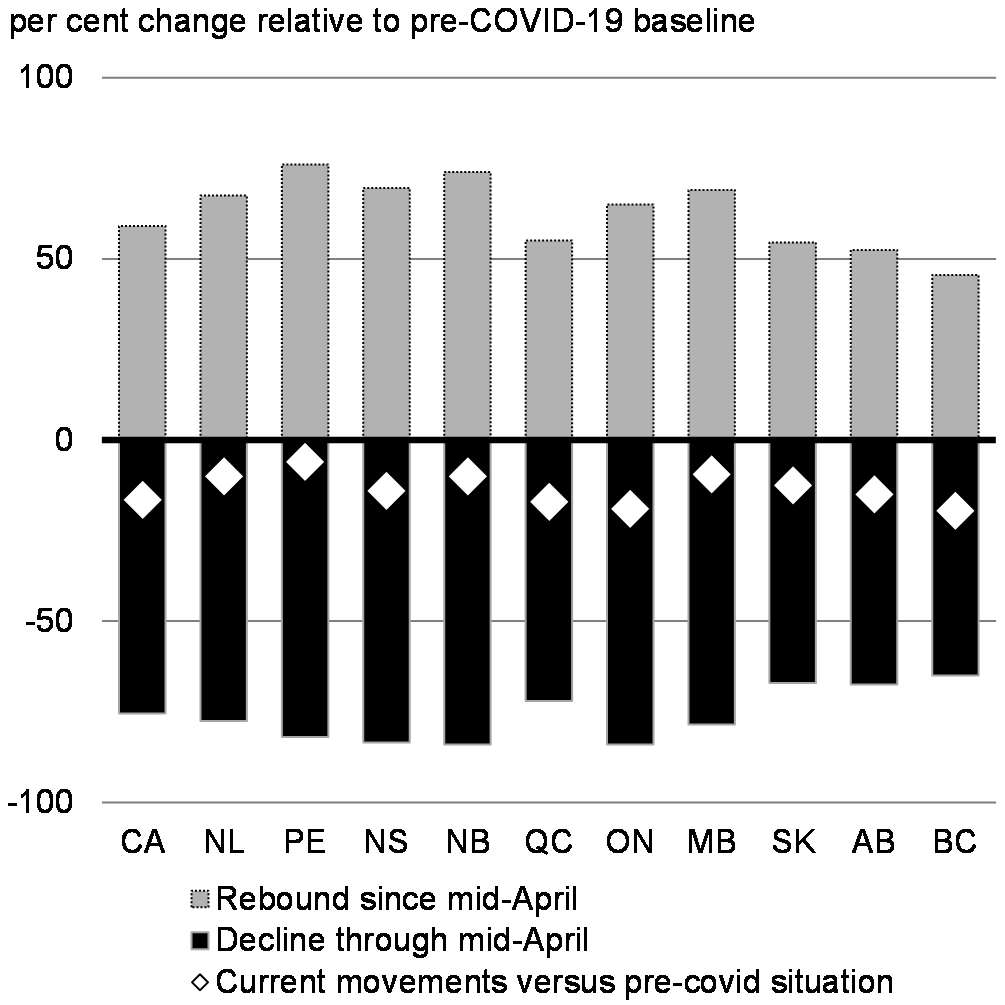
This has translated into a soft rebound in measures of mobility and workplace attendance across the country (Chart 2.13). Weekly credit and debit card spending data suggest that sales started picking up from the middle of April. Home sales and listings have also seen a partial bounce back in recent weeks. Mortgage payment deferrals and income support measures, such as CEWS and CERB, have helped avoid a rise in distressed sales, keeping house prices relatively stable so far, and prevented longer term damage to the economy.
Strong action from the government, like the CEWS and CERB, has helped maintain consumer purchasing power and provided greater confidence to households that they have the support needed to meet their needs. As economic activity increases and sectors reopen, higher economic output, stemming from increased spending, will translate into large rebounds in real GDP growth. Beyond these initial rebounds, the pace of economic growth is likely to remain soft as some containment measures, such as travel restrictions, will remain for some time. Further, the extent to which these public health measures may need to be adjusted given the evolution of the epidemic adds uncertainty around the pace of economic growth over the recovery.
Chart 2.13
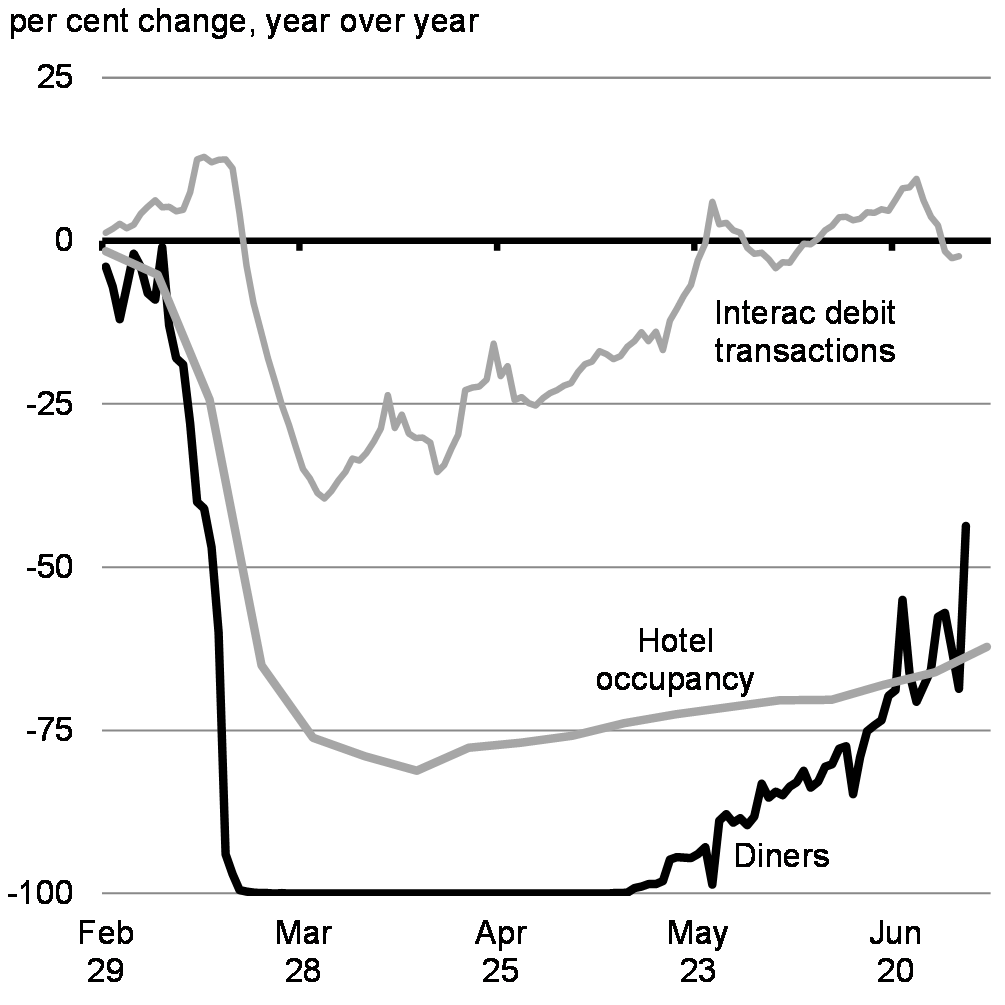
Meanwhile, current indicators like air travel, in-person restaurant dining and hotel visits show that many services are still running at a fraction of previous levels despite the lifting of some restrictions. Declines in rail carloadings also suggest trade volumes could continue to fall in May, despite the initial reopening across the country, with latest data pointing to some improvement in June.
These initial steps, along with strong public policy response, have coincided with some improvement in consumer and business confidence. For most advanced economies, business activity readings improved in May and June – from their April trough – although the levels of activity remain depressed, as only parts of their respective economies have started to re-open. In Canada, the latest readings on the Conference Board’s Indexes of Consumer and Business Confidence have notably improved, but they remain at weak levels historically. And, while recent readings for small businesses have shown some encouraging signs of improvement, many firms continue to report operating below half the normal capacity amid ongoing demand weakness and health-related restrictions (Chart 2.14).
Chart 2.14


Figure 2.2
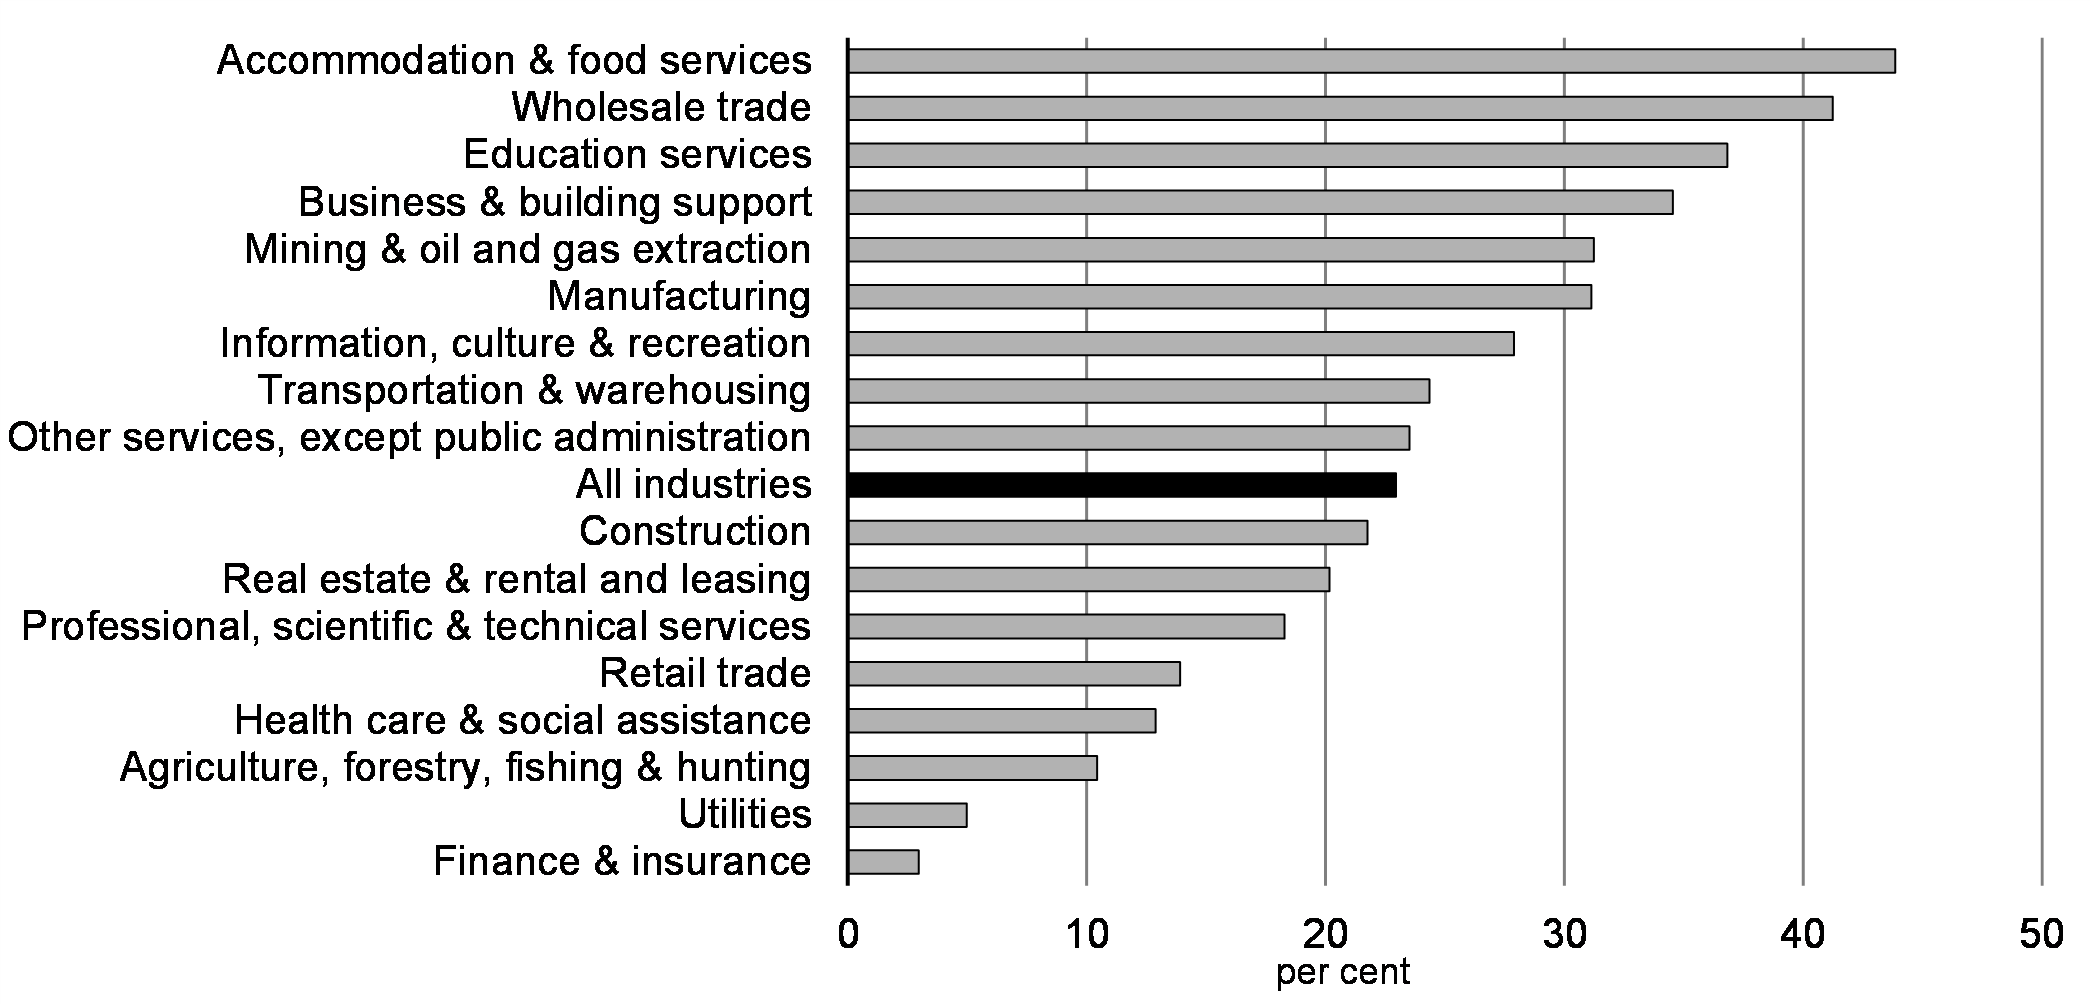
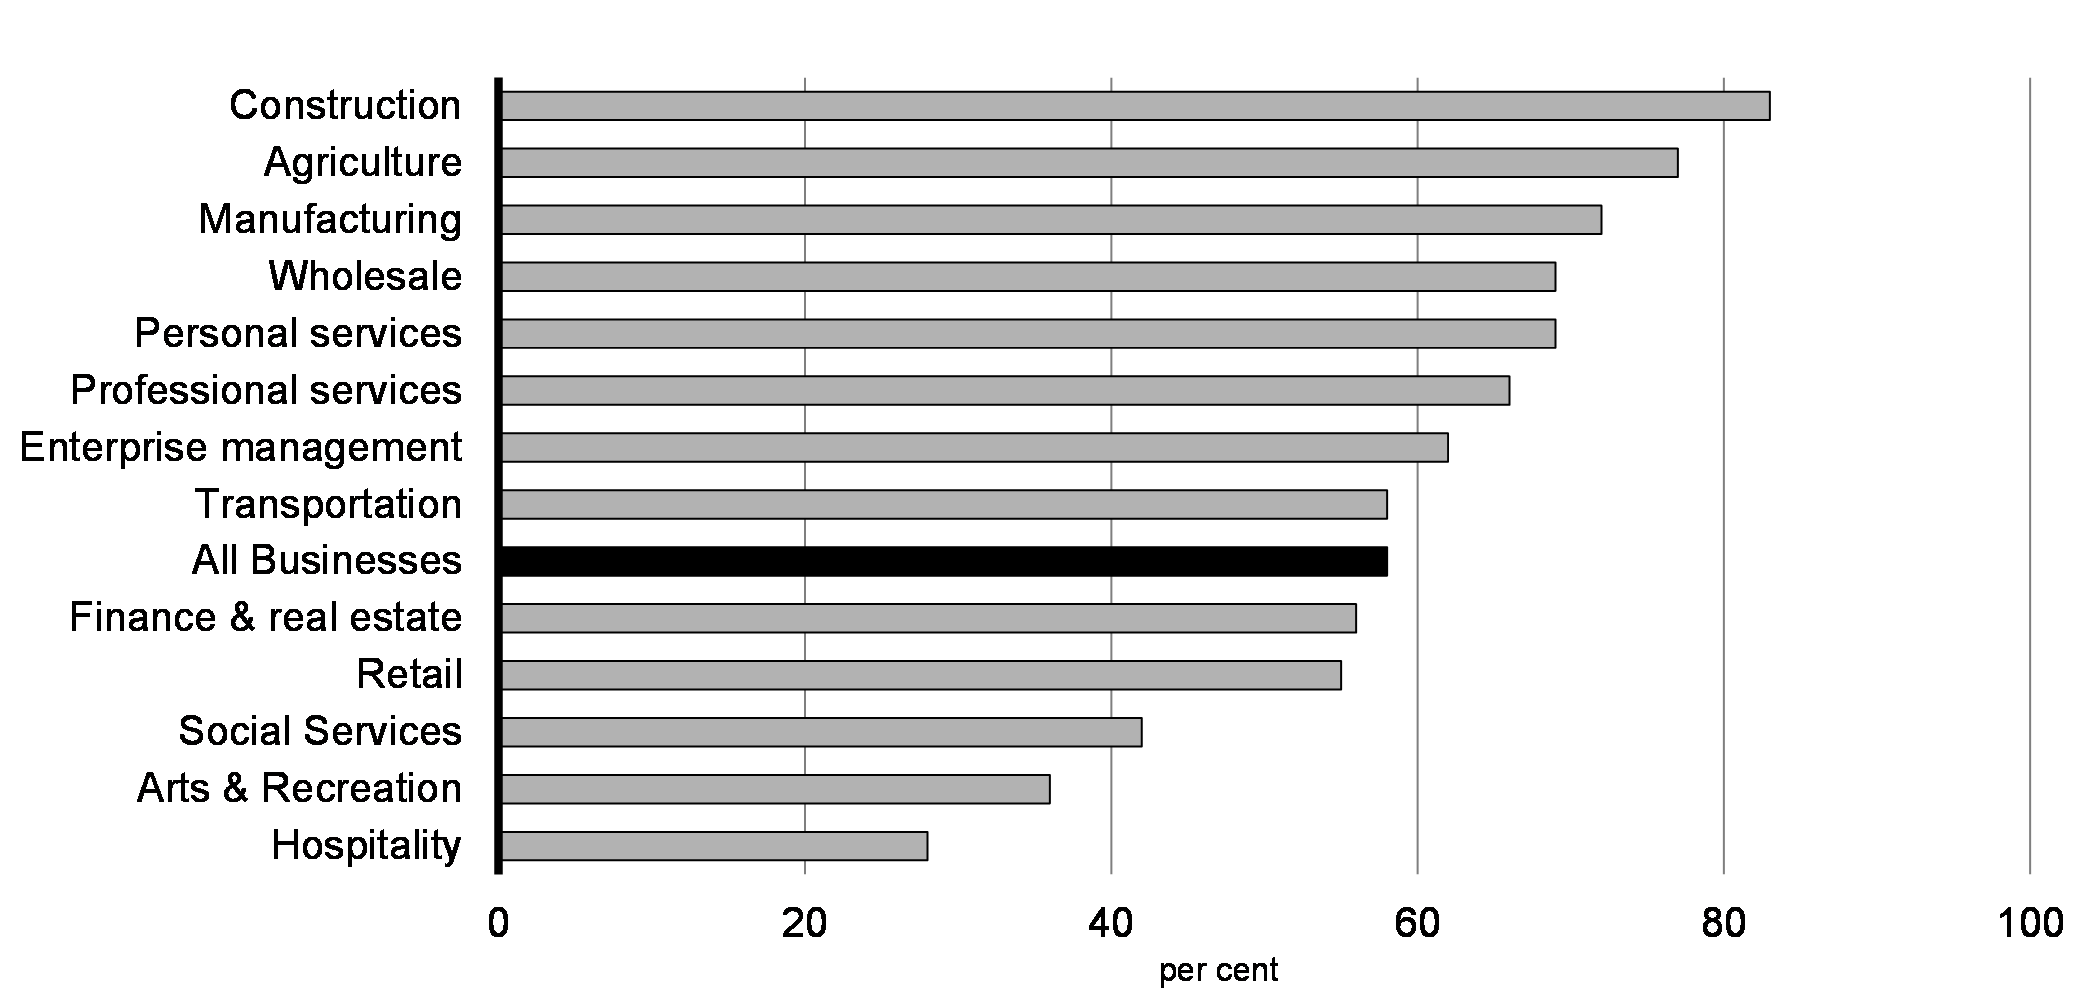
COVID-19 and the measures to contain its spread have sharply reduced revenues and put a large strain on businesses’ cash flow, resulting in acute financial stress for many. Declines in business revenue were widespread but the greatest impact occurred in accommodation and food services, as well as in the arts, entertainment, and recreation industry. SMEs have also been particularly affected – only 58 per cent have fully reopened as of June 30th – with some sectors struggling to re-open at all and only about 23 per cent of all SMEs surveyed earning their usual sales (Chart 2.15).
Chart 2.15
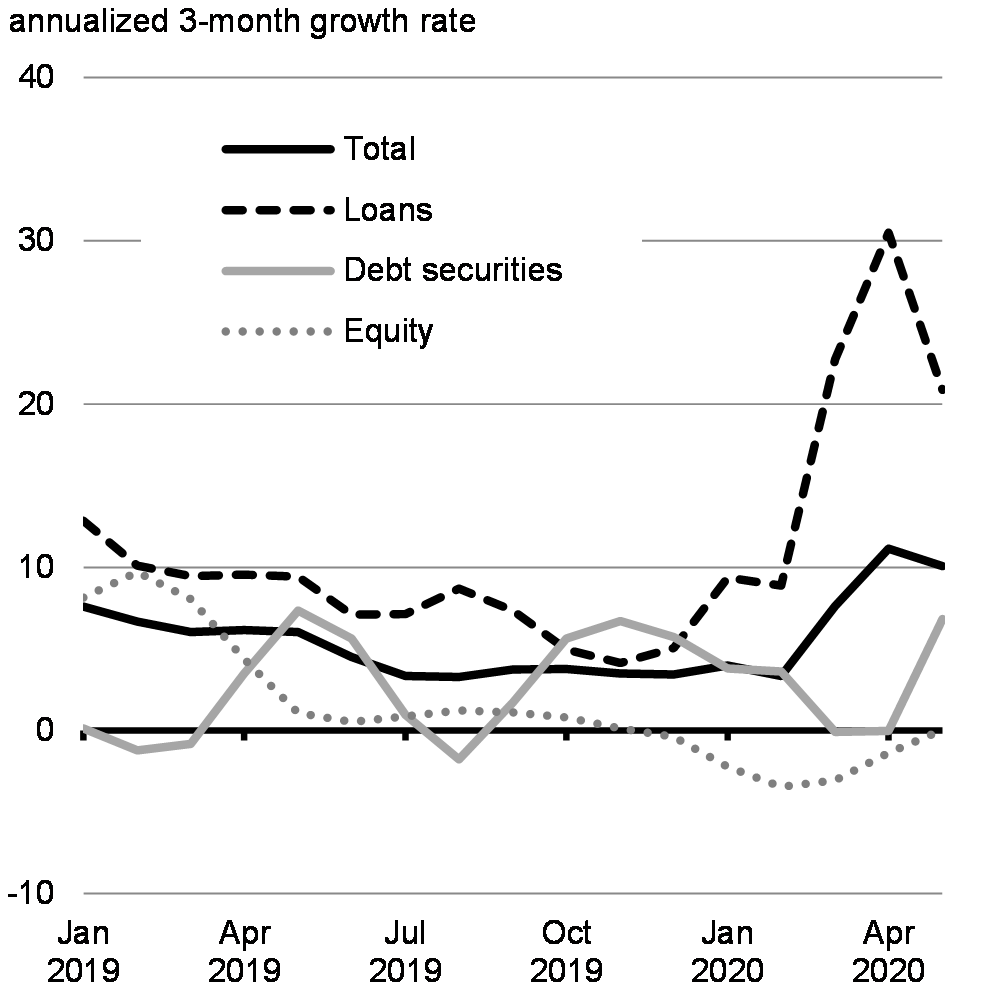
Broad support provided through the Plan is helping businesses to cover their fixed costs and bridge cash shortfalls through the most difficult months of the crisis. To date, bankruptcies and arrears remain low. Businesses have improved their cash positions by making use of deferrals on financial obligations and rent relief, seeking direct financial support, and drawing down on bank credit lines. Credit authorizations from financial institutions and business credit growth have increased since March 2020, suggesting an increased availability and use of credit (Chart 2.16), though some firms have reportedly been more reluctant to add to their already high debt levels given the economic uncertainty. For these firms, grants and payment deferrals have been important to ease cash flow constraints. In particular, Canada’s Emergency Wage Subsidy is helping businesses to pay workers affected by the pandemic, and the government’s suite of business credit availability programs are there to help firms bridge to the other side of the crisis.
Chart 2.16
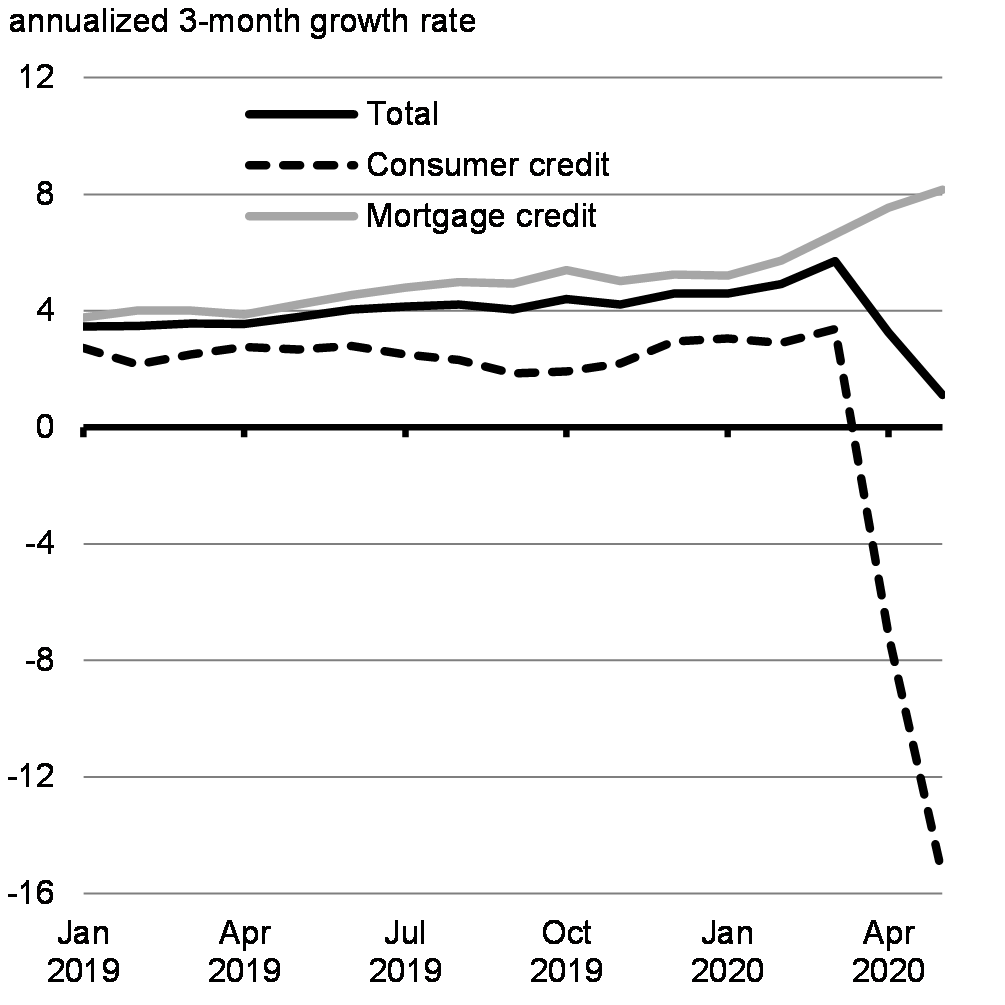
-
Text version
Total Consumer credit Mortgage credit January 2019 3.5 2.7 3.8 February 2019 3.5 2.2 4.0 March 2019 3.6 2.5 4.0 April 2019 3.6 2.8 3.9 May 2019 3.8 2.7 4.2 June 2019 4.0 2.8 4.5 July 2019 4.1 2.5 4.8 August 2019 4.2 2.3 5.0 September 2019 4.0 1.8 4.9 October 2019 4.4 1.9 5.4 November 2019 4.2 2.2 5.0 December 2019 4.6 3.0 5.2 January 2020 4.6 3.1 5.2 February 2020 4.9 2.9 5.7 March 2020 5.7 3.4 6.6 April 2020 3.3 -7.1 7.5 May 2020 1.1 -15.4 8.2
-
Text version - Business Credit Growth (annualized 3-month growth rate)
Total Loans Debt securities Equity January 2019 7.6 12.8 0.1 8.1 February 2019 6.7 10.1 -1.2 9.7 March 2019 6.0 9.4 -0.9 8.0 April 2019 6.1 9.6 3.5 4.4 May 2019 6.0 9.4 7.4 1.1 June 2019 4.5 7.1 5.6 0.5 July 2019 3.3 7.1 0.9 0.9 August 2019 3.3 8.7 -1.8 1.2 September 2019 3.7 7.3 1.7 1.1 October 2019 3.8 5.0 5.6 0.8 November 2019 3.5 4.1 6.7 0.1 December 2019 3.4 5.0 5.7 -0.4 January 2020 4.0 9.4 3.8 -2.2 February 2020 3.3 8.9 3.6 -3.5 March 2020 7.6 22.7 -0.1 -3.1 April 2020 11.1 30.5 -0.1 -1.4 May 2020 10.1 20.9 6.8 0.0
As businesses reopen, they will have to navigate a challenging new environment. Restrictions vary by province and change rapidly. Many firms will be challenged by the sheer size of the shock to domestic and foreign demand over the recovery, as well as any lasting changes to consumer spending and saving behaviour. Canadian exports are expected to begin recovering as the economies of our key trade partners’ economies progressively reopen. The path is expected to be uneven and protracted, with countries recovering at different paces. This will carry added costs for businesses, particularly for those that are part of complex supply chains crossing many regions. Further, trade tensions could add a layer of uncertainty and weigh on business investment decisions. These conditions will likely weigh on demand for credit and investment plans in the near term until businesses are able to see a path to profitability.
Despite clear challenges individual households may be facing, overall Canadians’ household finances appear to be holding up well so far. Millions of Canadians have been supported through the government’s emergency measures and consumer insolvencies and debt arrears remain low. Consumer credit growth plunged to the lowest on record in April, with credit card debt going down, suggesting many consumers did not need to take on additional debt to help make ends meet in the early days of the pandemic. These consumers have been able to deleverage, are saving more and are well positioned for the recovery. Important income supports from governments, like CEWS and CERB, have played a critical role in stabilizing household income and bolstering consumer spending.
Indeed, Department of Finance estimates show that CERB and other direct Government supports to individuals have, on aggregate, replaced the labour income lost by Canadians during the containment phase of the pandemic (Chart 2.17). In addition, payment deferrals and interest rate relief from financial institutions on both mortgage and non-mortgage debt have provided some support to borrowers. Households have also reduced their spending during the pandemic, particularly on big-ticket purchases such as cars, which has reduced the need for additional borrowing. Going forward, the health of household finances will depend on how quickly firms begin to rehire in the coming months as social-distancing measures ease and the debt deferrals wind down.
Chart 2.17
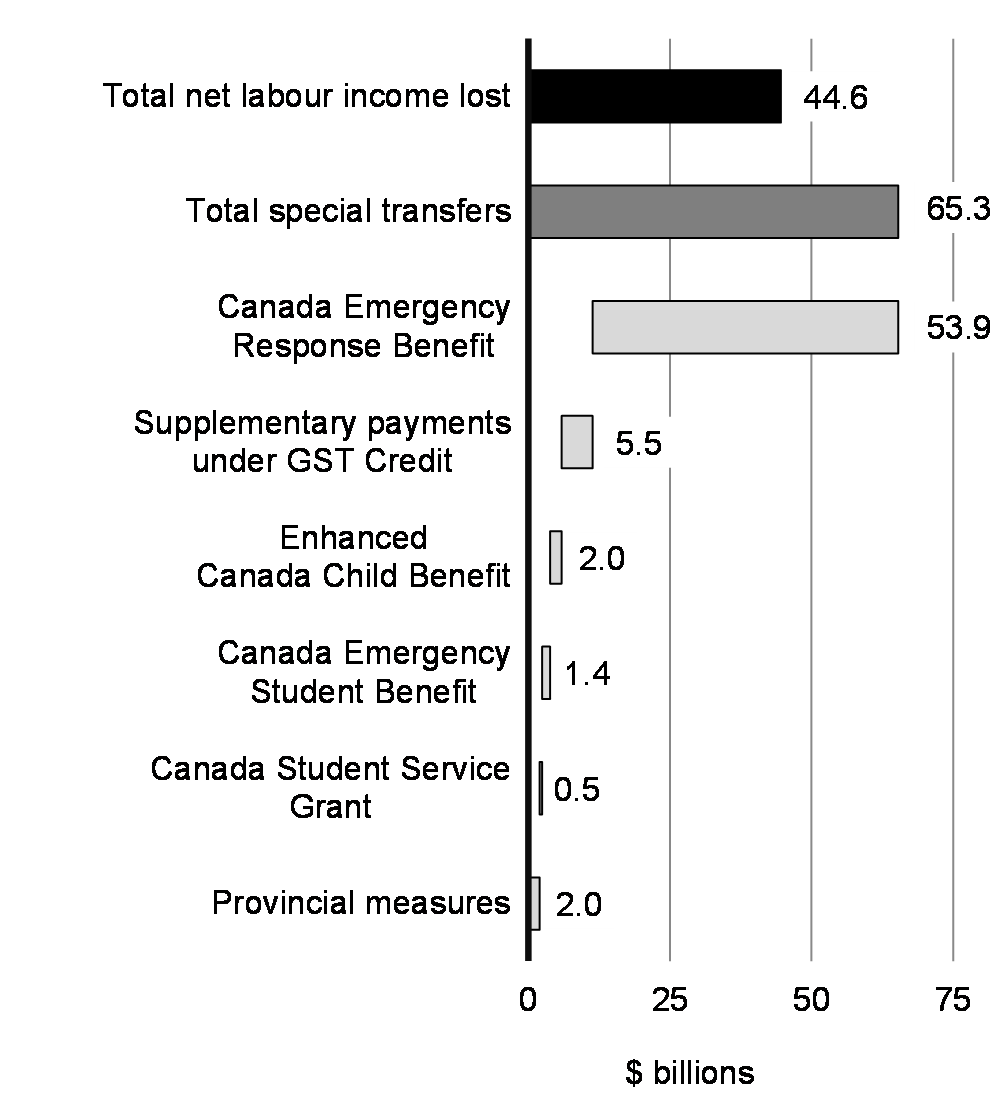
-
Text version
billions Total net labour income lost 44.6 Total special transfers 65.3 Canada Emergency Response Benefit 53.9 Supplementary payments under GST Credit 5.5 Enhanced Canada Child Benefit 2.0 Canada Emergency Student Benefit 1.4 Canada Student Service Grant 0.5 Provincial measures 2.0
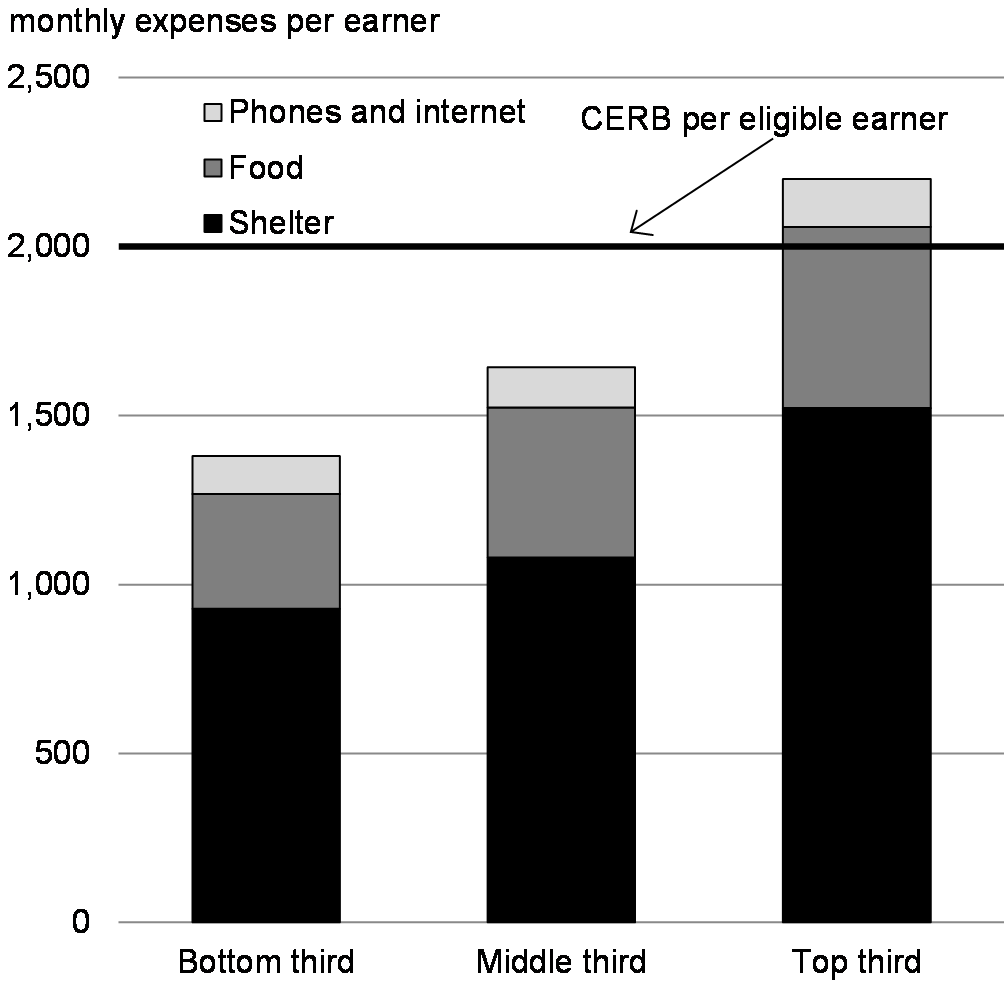
-
Text version - Core Monthly Expenses of Households with Mortgages (monthly expenses per earner)
Shelter Food Phones and internet Bottom third 928 340 112 Middle third 1,081 443 120 Top third 1,523 536 142
Canadian Economic Outlook
The average of private sector economic forecasts has been used as the basis for fiscal planning since 1994; this approach introduces an element of independence into the Government's fiscal forecast. The Department of Finance Canada surveyed a group of private sector economists in the third week of May.
Private sector economists expect real GDP to decline 6.8 per cent in 2020 (Table 2.2 below), before rebounding by 5.5 per cent in 2021 (see Annex 2 for full details). In the second quarter of 2020, there was an unprecedented decline in activity, with real GDP expected to fall by 41 per cent on an annualized basis (Chart 2.18).
Currently, the average of private sector forecasts, which factors in the economic impact of government’s decisive fiscal support, outlines a faster rebound in real GDP than in the past three recessions. While private sector views are relatively aligned on the magnitude of the second quarter decline, their third quarter growth forecasts diverge widely, reflecting tremendous uncertainty around, for example, the pace of rehiring and investment, rebound in consumer activity, etc. The Department of Finance will continue to actively engage with private sector economists to gauge the pace of the recovery over the second half of 2020.
Chart 2.18
-
Text version
2019
Q42020
Q12020
Q22020
Q32020
Q42021
Q12021
Q22021
Q32021
Q4Lower 0.560227 -8.17282 -48.8557 -4.34116 7.659254 1.39844 1.779096 1.468113 1.654746 Range 0 0 15.89642 76.81485 20.19068 11.40156 5.511033 4.031887 4.545254 2020 Economic and Fiscal Snapshot 0.560227 -8.17282 -40.645 32.24049 13.8011 6.124013 4.234416 3.179897 3.15682
-
Text version - Unemployment Rate (per cent)
2019
Q42020
Q12020
Q22020
Q32020
Q42021
Q12021
Q22021
Q32021
Q42020 Economic and Fiscal Snapshot 5.7 6.3 13.2 10.5 9.2 8.4 7.9 7.6 7.2 Lower 6.3 11.8 7.0 6.9 6.7 5.9 5.8 5.8 Range 0.0 2.6 6.2 4.1 2.6 3.1 3.2 3.2 December 2019 EFU 5.7 5.8 5.8 5.8 5.8 5.8 5.7 5.8 5.8
Several outlook scenarios possible in the wake of the pandemic
The results of the private sector survey indicate that the expected contraction in Canadian real GDP is much worse than experienced during the 2008-2009 financial crisis. Still, the survey results are most consistent with slow, steady and relatively low levels of ongoing community transmission of the virus. As a result, risks around this outlook are elevated and tilted to the downside.
The prospect of a further resurgence of the virus and another potential wave of public health measures to contain it in Canada or in key global economies would severely hamper the economic recovery. Acknowledging the great uncertainty over future health outcomes, modelling done by the Public Health Agency of Canada suggests future waves of the virus could equal or surpass the initial spread of COVID-19 in terms of the number of infections. A resurgence of the virus could be less economically damaging than the initial spread. However, with increased investment and experience with work from home, protocols and guidance on maintaining physical distancing in the workplace, and scaled up testing and tracing, it is possible to maintain confidence that the economy can continue to operate with less disruption.
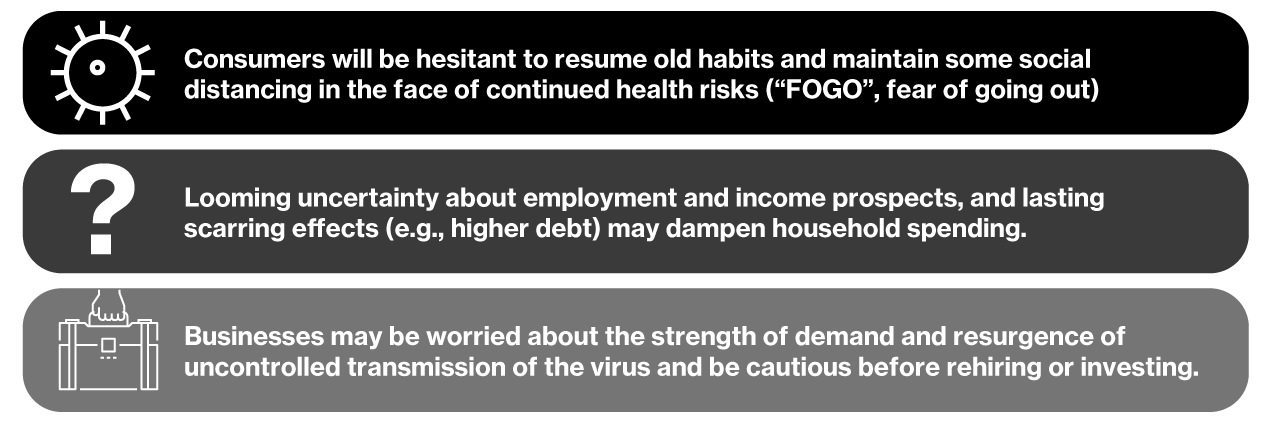
However, even without resurgence of uncontrolled transmission, global uncertainty is likely to remain for some time. In the face of this, businesses have to decide when to start hiring and investing again. There is a risk that this process could be prolonged until there is more certainty that the virus is no longer a threat and that the global economic recovery is solidly underway. In the interim, many businesses will have to follow strict physical distancing protocols and will be operating at greatly reduced capacity.
Canadians are likely to remain cautious until they are assured that risks from the virus are low, potentially delaying a return to work. Parents’ return to work could also be delayed by childcare responsibilities, most likely to impact mothers’ employment status. Canadians may also choose to delay major purchases such as cars or houses until signs that hiring and the recovery is well underway.
Reduced global trade and supply chain disruptions remain a vulnerability given Canada’s dependence on international trade. However, supply-chain reconfiguration is also likely, whether it be to secure supplies of medical equipment and personal protection equipment via domestic production, or whether firms choose to diversify their suppliers to guard against the next major disruption. Ultimately, these shifts will make supply chains more durable going forward, but the size of the costs, and who bears them, has important implications over the recovery for both households and businesses.
Potential Economic Impacts Should Public Health and Recovery Conditions Change
To illustrate the consequences of different health outcomes and the associated responses of households and businesses, the Department of Finance has considered two alternative scenarios to the projections of the private sector economists. Given the high degree of uncertainty as to how public health and economic conditions will evolve over the coming months, these are presented simply to indicate the extent to which the published forecast could deviate and how this could change the fiscal outlook overall.
Uneven and Gradual Recovery
The first scenario assumes a slower pace of return to normal activity for households and businesses and thus a slower recovery in the third quarter of 2020. Under this scenario, households remain cautious due to repetitive peaks of viral transmission of the virus and continue to avoid most public spaces, including restaurants, local travel and non-essential shopping. Activity in the business sector creeps back up but does not fully rebound as businesses have to maintain stringent containment measures such as limiting the number of people in stores and enhanced cleaning protocols. Many businesses continue to operate below capacity with some deciding not to re-open given the significant costs of operating in this environment and still low levels of demand.
Some sectors have more difficulties re-opening as public fear of going out makes certain activities impractical. Prolonged shutdowns increasingly distance some workers from the labour market, resulting in more permanent job losses. The effect this has is an even more uneven recovery across Canada with activity in certain sectors and provinces lagging behind. Overall, real GDP in 2020 declines by 9.6 per cent under this scenario, a more pronounced drop than projected by the private sector survey.
With the pace of business resumption still uncertain it is unknown whether this scenario will come to pass or not, but it illustrates the potential downside risks that could still exist.
Virus Resurgence Scenario
As the search for a vaccine remains underway, the other downside scenario considers a resurgence of uncontrolled transmission of the virus later this year followed by a series of smaller waves in 2021. In this scenario, new cases of COVID-19 start to accelerate again at an exponential rate.
The resurgence coincides with the annual flu season, putting high enough demands on the health care system that another round of public health containment measures, including some extent of renewed shutdowns of social and economic spaces, is implemented. The result is another decline in economic activity. However, the drop in activity this time is expected to be less than the first wave. Scaled-up testing and tracing operations and robust public adoption of mask-wearing and use of other personal protective equipment make it possible to control the virus much more quickly.
More workers are able to effectively work from home during this episode since investments in tools and equipment were already made during the first wave. Nevertheless, the economic damage from a resurgence of uncontrolled transmission is large. Businesses that are still recovering are hit again by renewed shutdowns. Households, particularly those in lower-income and other vulnerable groups, are hit hard by another round of layoffs as unemployment is still likely to be high. Further declines in consumer and business confidence also weigh on spending.
Overall, this translates into a deeper and longer-lasting negative impact on the economy, with a decline of 11.2 per cent in real GDP in 2020 and the level of real GDP remaining below that of even the most pessimistic private sector forecast by the end of 2021.
| 2020Q1 | 2020Q2 | 2020Q3 | 2020Q4 | 2020 | 2021 | |
|---|---|---|---|---|---|---|
| Real GDP Growth1 | ||||||
| Economic and Fiscal Update 2019 | 1.6 | 1.6 | 1.7 | 1.6 | 1.6 | 1.8 |
| 2020 Economic and Fiscal Snapshot | -8.2 | -40.6 | 32.2 | 13.8 | -6.8 | 5.5 |
| GDP Inflation1 | ||||||
| Economic and Fiscal Update 2019 | 2.1 | 2.1 | 2.1 | 1.9 | 2.0 | 2.0 |
| 2020 Economic and Fiscal Snapshot | 1.8 | -8.3 | 3.7 | 4.3 | 0.5 | 2.2 |
| Nominal GDP Growth1 | ||||||
| Economic and Fiscal Update 2019 | 3.7 | 3.8 | 3.9 | 3.6 | 3.7 | 3.8 |
| 2020 Economic and Fiscal Snapshot | -6.5 | -45.5 | 37.1 | 18.6 | -6.3 | 7.9 |
| Nominal GDP Level ($ billions)1 | ||||||
| Economic and Fiscal Update 2019 | 2,390 | 2,481 | ||||
| 2020 Economic and Fiscal Snapshot | 2,158 | 2,328 | ||||
| Difference with Economic and Fiscal Update 2019 |
||||||
| 2020 Economic and Fiscal Snapshot | -231 | -153 | ||||
| 3-month Treasury Bill Rate | ||||||
| Economic and Fiscal Update 2019 | 1.5 | 1.5 | 1.5 | 1.5 | 1.5 | 1.6 |
| 2020 Economic and Fiscal Snapshot | 1.2 | 0.3 | 0.3 | 0.2 | 0.5 | 0.3 |
| 10-Year Government Bond Rate | ||||||
| Economic and Fiscal Update 2019 | 1.4 | 1.6 | 1.7 | 1.8 | 1.6 | 2.0 |
| 2020 Economic and Fiscal Snapshot | 1.1 | 0.6 | 0.7 | 0.7 | 0.8 | 1.0 |
| 1 Figures have been restated to reflect the historical revisions in the Canadian System of
National Accounts. Sources: Statistics Canada; For Economic and Fiscal Update 2019, Department of Finance Canada September 2019 survey of private sector economists; for 2020 Economic and Fiscal Snapshot, Department of Finance Canada May 2020 survey of private sector economists. |
||||||
Fiscal Situation
Canada entered this crisis in a strong fiscal position enabling the government to take decisive action to protect Canadians and businesses from the impacts of the pandemic. Canada’s COVID-19 Economic Response Plan (the Plan) includes more than $230 billion in measures to protect the health and safety of Canadians and provide direct support to Canadian workers and businesses. It also includes a further $85 billion in tax and customs duty payment deferrals to meet liquidity needs of businesses and households and to help stabilize the Canadian economy. Combined, these measures represent nearly 14 per cent of Canada’s GDP, making Canada’s plan one of the most generous response plans in the world.
The decisive and substantial support provided by the government helped prevent further damage to the economy this year by replacing lost income and avoiding higher unemployment (Chart 2.19).
Department of Finance estimates suggest that real GDP could have fallen by over 10 per cent in 2020 without this support, with the unemployment rate rising by a further two percentage points.
Chart 2.19
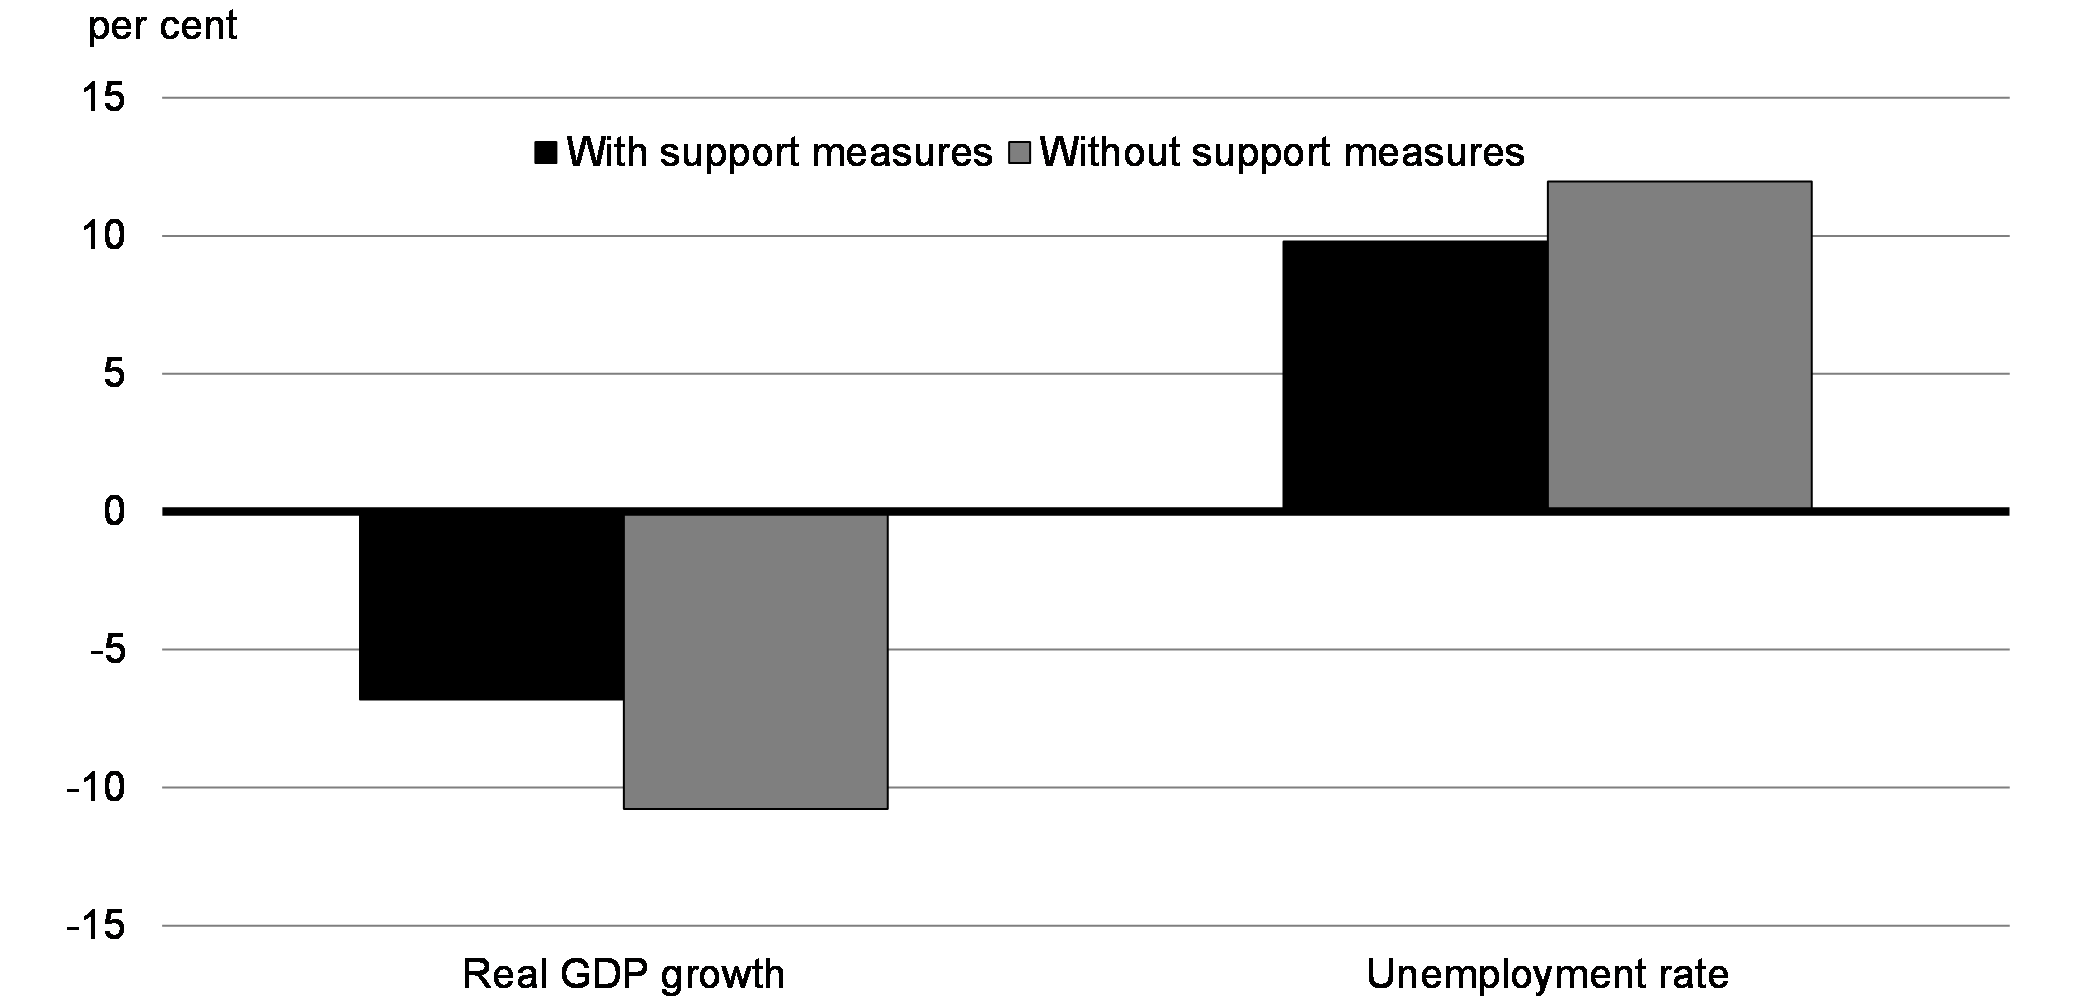
Beyond the important and immediate requirement to stabilize household and business finances during the shutdown and recovery phases of the COVID-19 crisis, Canada’s response will have longer-lasting positive impacts for the Canadian economy during the recovery. By acting quickly and extensively, Canada avoided a deeper, more prolonged and costly downturn, which would have had detrimental impacts not only on the jobs and incomes of individual Canadians, but also on federal and provincial government finances. Absent actions taken by the government to offset the impact of the COVID-19 crisis, the federal deficit and debt-to-GDP ratio would have risen substantially, due to the deeper and more prolonged impact of the COVID-19 crisis on Canadian workers and businesses. Provincial governments would have faced similar impacts.
The fiscal results in this report reflect the estimated impact of the Plan as outlined to date. Given the current level of volatility, this plan will continue to evolve as needed, to respond to this unprecedented crisis, and its impact on Canadians. Reflecting the uncertainty surrounding the evolving situation, the fiscal results in this report extend only to the current fiscal year, which is itself subject to a much higher-than-normal degree of uncertainty and represents a best estimate, among a wide range of possible outcomes. As the situation stabilizes, the government will provide an update in the fall with a longer forecast horizon.
Changes to the Fiscal Outlook
There is a high level of uncertainty surrounding the fiscal outlook in the current economic environment, as the unprecedented severity and suddenness of the shock to employment and income levels mean the standard relationships between economic and fiscal variables may no longer apply. Further, as discussed, the government has launched a number of support measures with an estimated fiscal cost of $236 billion to date. These investments have protected the Canadian economy. However, cost estimates for many of these programs have been difficult to establish, given that they are brand new programs, launched in a highly volatile economic environment. Estimates for these measures will be refined as data on program usage and costs becomes available.
In addition to spending, the fiscal outlook is also greatly affected by the underlying changes in nominal GDP. Without any spending at all, the simple decline in economic activity will worsen the overall fiscal environment as tax revenues decline and the relative size of the deficit and debt increase in proportion to lower levels of output in the economy. As shown in Table 2.4 below, economic and fiscal developments are estimated to have added $81.3 billion to the deficit in 2020-21 before the fiscal impact of the COVID-19 Economic Response Plan.
The temporary measures implemented through the government’s economic response plan will have a significant impact on the federal deficit (Table 2.4). Coupled with the severe deterioration in the economic outlook, these result in a projected deficit of $343.2 billion in 2020-21. By comparison, this spending level is on par with but lower than the peak deficit (as a per cent of GDP) experienced by Canada during the Second World War. This is truly the challenge of our lifetime. As temporary investment measures come to an end and GDP recovers over time, deficits are expected to retreat.
Due to the unprecedented degree of uncertainty clouding the economic outlook, providing a fiscal forecast beyond the current fiscal year with an appropriate degree of confidence is not possible at this time, and would potentially be misleading. As a result this snapshot provides an update of the current economic and fiscal outlook to the end of 2020-21.
|
2018– |
2019– |
2020– |
|
|---|---|---|---|
| EFU 2019 budgetary balance | -14.0 | -26.6 | -28.1 |
| Adjustment for risk from EFU 2019 | 1.5 | 3.0 | |
| EFU 2019 budgetary balance (without risk adjustment) |
-14.0 | -25.1 | -25.1 |
| Economic and fiscal developments since EFU 2019 |
0.1 | -81.3 | |
| Revised budgetary balance before policy actions and investments | -25.0 | -106.4 | |
| Policy actions since EFU 2019 | -1.3 | -9.0 | |
| Canada’s COVID-19 Economic Response Plan | -8.1 | -227.9 | |
| Protecting Health and Safety | -0.6 | -18.4 | |
| Support to Individuals | -7.5 | -181.1 | |
| Of which: Canada Emergency Response Benefit | -7.4 | -73.1 | |
| Canada Emergency Wage Subsidy | -82.3 | ||
| Support to Businesses | 0.0 | -21.3 | |
| Other Support Measures | 0.0 | -7.1 | |
| Budgetary balance | -14.0 | -34.4 | -343.2 |
| Budgetary balance (per cent GDP) | -0.6 | -1.5 | -15.9 |
| Federal debt (per cent of GDP) | 30.8 | 31.1 | 49.1 |
| Totals may not add due to rounding. | |||
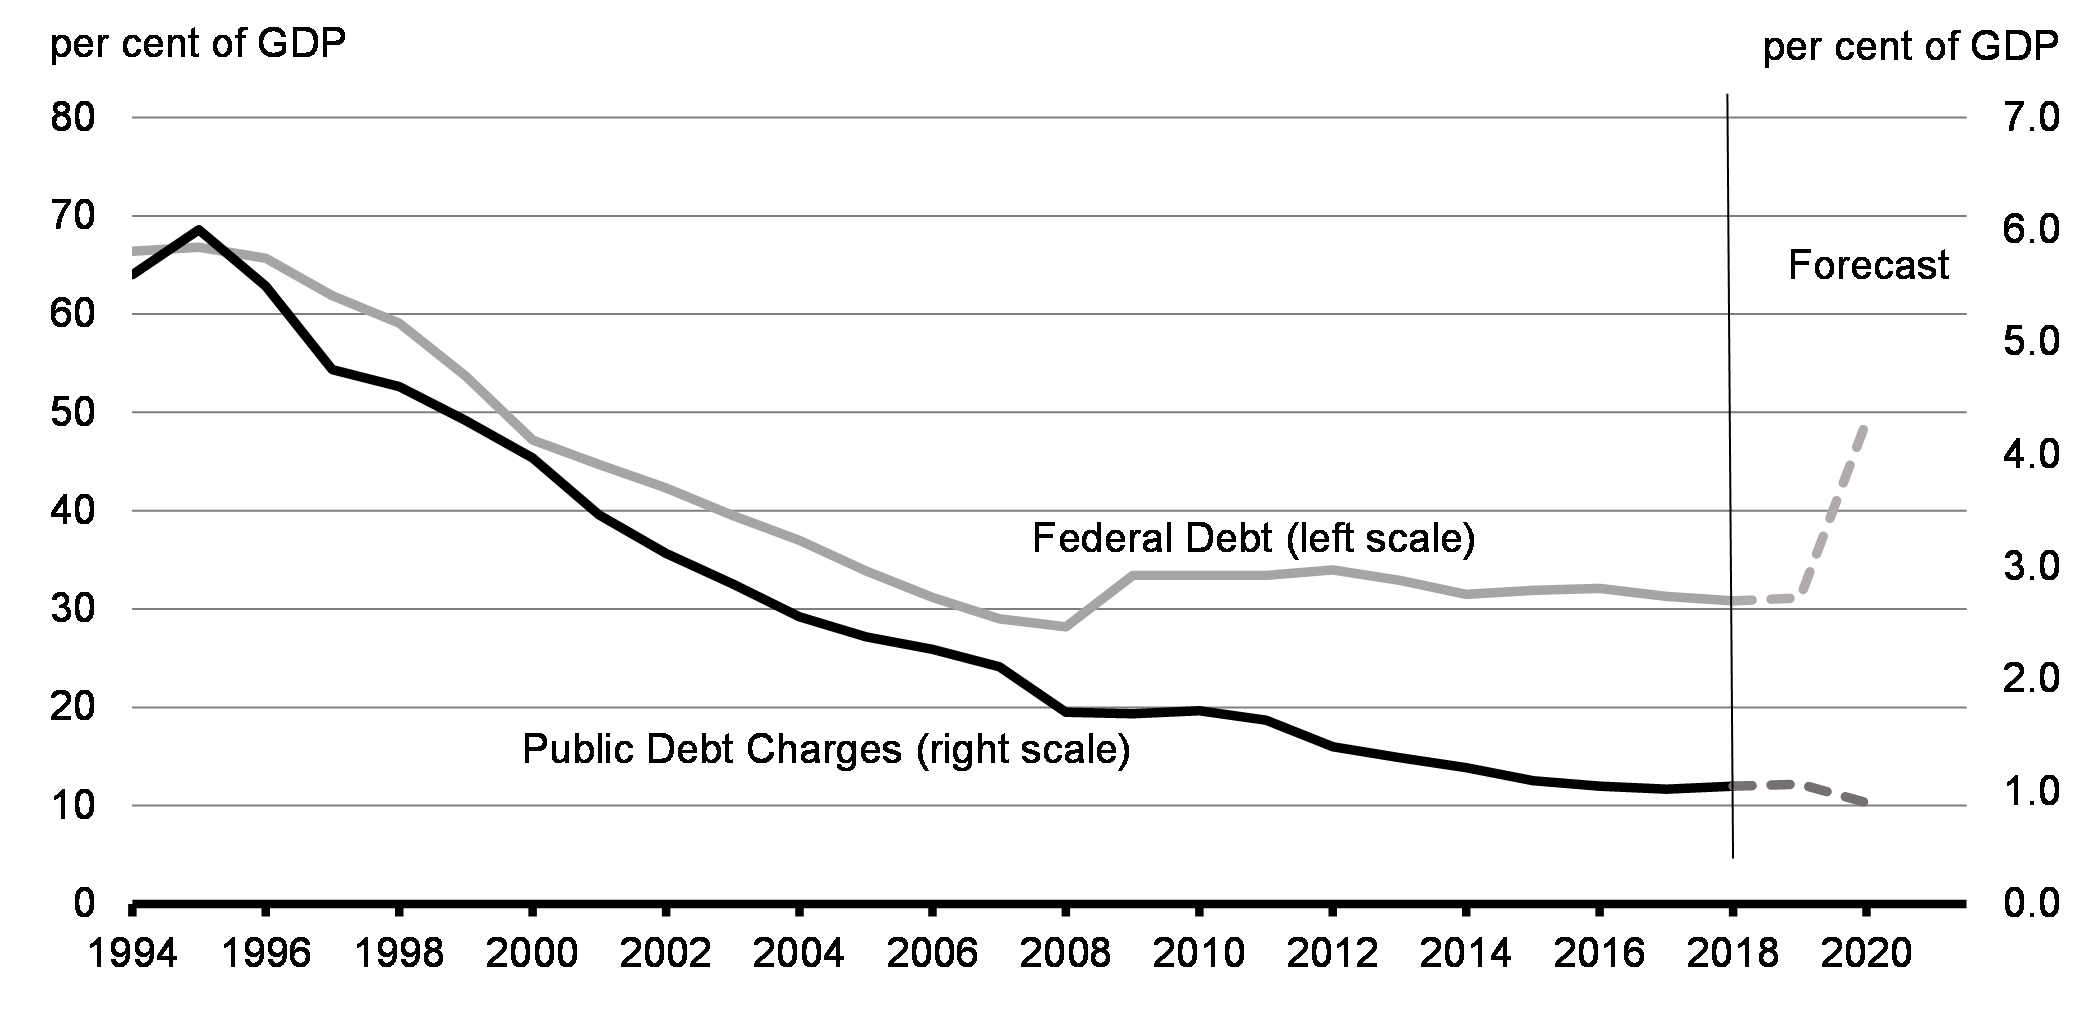
Taking into account the projected decline in nominal GDP, the federal debt-to-GDP ratio is projected to rise to 49.1 per cent in 2020-21. However, record low interest rates have made Canada’s debt significantly more affordable (Chart 2.20). Market rates at which the federal government can refinance existing debt or finance new debt are at historical lows of less than 0.8 per cent for maturities up to 10 years. As a consequence of these developments, the government will save over $4 billion in public debt charges in 2020-21 compared to the forecast presented in the 2019 Economic and Fiscal Update in December 2019. This is despite a significant increase in total borrowing due to the COVID-19 response.
The government is taking advantage of the robust market demand for Government of Canada bonds by issuing more longer term debt (see Annex 3). This will ensure that much of Canada’s outstanding debt is less vulnerable to interest rate increases in the future, which will help to maintain Canada’s debt sustainability for generations to come.
Despite the necessary increase in federal borrowings, public debt charges are expected to fall in 2020-21, from 2019-20 levels.
Chart 2.20
While this year’s deficit estimate is elevated, it is in line with the fiscal response deployed by Canada’s peer countries and was necessary in order to avoid a more significant economic impact and prolonged economic and fiscal challenges. In the wake of the crisis, governments around the world were forced to deploy massive fiscal supports to rescue their economies, representing an unprecedented increase in global public debt levels.
Canada continues to be among the most highly rated G7 countries and its strong credit rating is also contributing to its low cost of borrowing. The federal government’s strong fiscal position heading into this crisis meant Canada had the room to borrow to protect the Canadian economy. Government actions taken during the temporary shutdown of the Canadian economy prevented individual Canadians from having to take on unsustainable levels of debt, ensuring a stronger recovery and avoiding longer-term damage to the economy.
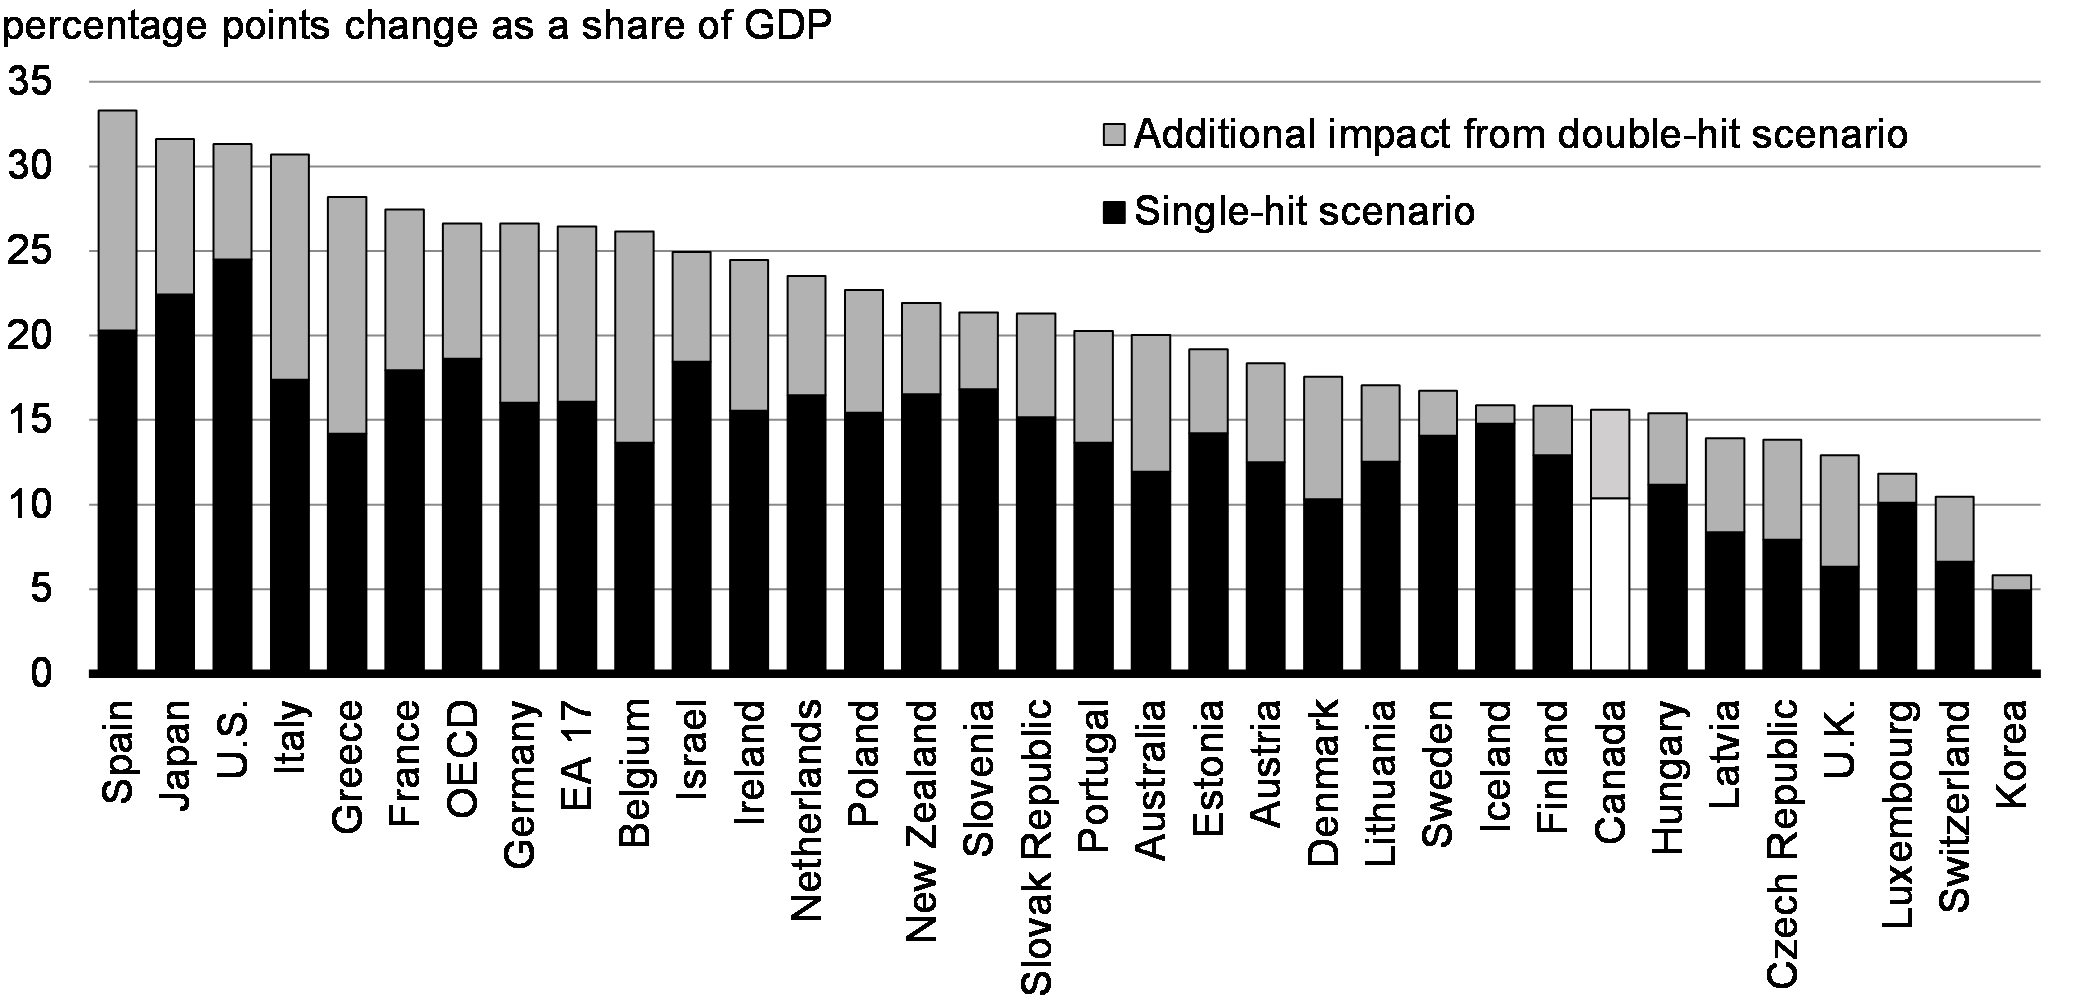
Coming out of the crisis, Canada is expected to maintain its low-debt advantage (Chart 2.21) among G7 countries. The government’s commitment to maintaining this advantage will help ensure borrowing costs remain low and that future generations are not burdened with COVID-19 related debt overhang.
Chart 2.21
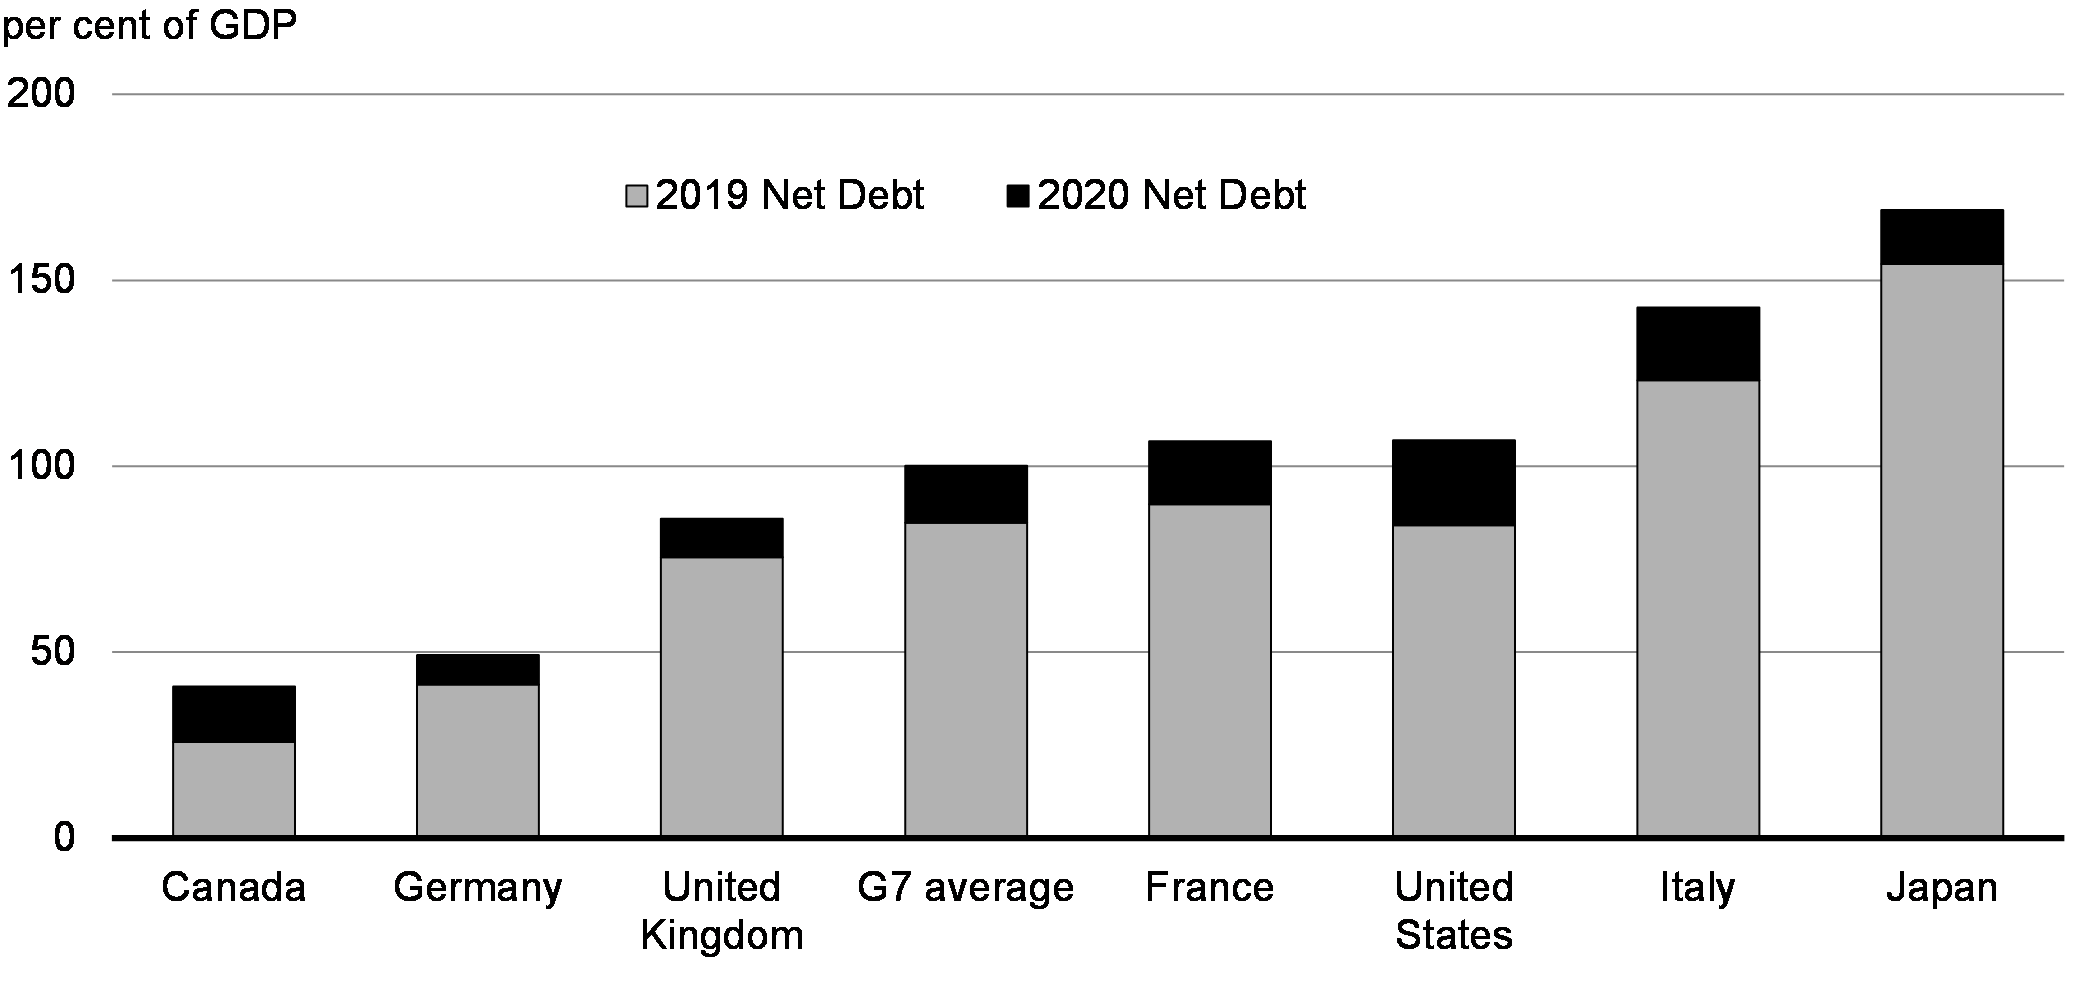
As a result of responsible fiscal management in the years leading up to the crisis, Canada’s debt levels are projected by international organizations such as the International Monetary Fund (IMF) and the Organization for Economic Cooperation and Development (OECD) to remain well below many of its peers. The OECD projects that Canada’s debt levels will rise less than those of many advanced economies, even in the event of a more pessimistic scenario where there is a resurgence of the virus (Chart 2.22).
Chart 2.22