
Archived - Report on Federal Tax Expenditures - Concepts, Estimates and Evaluations 2016: part 8
In Budget 2007, the Government introduced the Working Income Tax Benefit (WITB), a refundable tax credit that supplements the earnings of low-income workers. The WITB helps to reduce the "welfare wall" by ensuring that individuals are in a better financial position when they secure employment. The WITB was subsequently enhanced in Budget 2009 by $580 million, effectively doubling the total tax relief that it provides. Up to 1.5 million families received tax assistance through the WITB in 2013, at a total estimated cost of $1.2 billion.
This paper uses administrative data for the four years since the enhancement of the WITB (2009 through 2012, inclusive) to analyze the profile of families claiming the benefit in one or more years. It also provides early evidence on the year-over-year persistence of WITB claims among workers. This analysis provides a better understanding of the population benefiting from income support through the WITB.
An empirical assessment of the labour supply impact of the WITB is outside the scope of this paper, but there is substantial existing research demonstrating increased labour participation resulting from the United States' Earned Income Tax Credit (a tax credit with a design similar to the WITB, and likely the best studied example of an earnings supplement), particularly among single parents.[1]
Some salient points that arise from the present analysis include:
- Unattached workers (i.e., workers without a spouse or common-law partner or an eligible dependant) make up the majority of the WITB claimant population, and represent a very high share of younger claimants (under age 30). Among workers aged 30 and over, who constitute a majority of WITB claimants, the unattached represent just under half of the claimant population.
- A majority of WITB claimants of all family types have sufficient net income that the benefit is partially reduced on the basis of income.
- The largest part of working income consists of employment income reported on a T4 slip by an employer; however, self-employment income makes up an important part of working income, particularly for claimants over age 30.
- There is significant movement in and out of WITB qualification, with about half of WITB claimants in 2009 through 2011 no longer claiming the benefit in the subsequent year.
- Among 2011 WITB claimants who no longer received the benefit in 2012, more than half had net income that had risen above the qualification range, while about 20% had earnings too low to qualify. The remainder did not file or became ineligible for other reasons, such as engaging in full-time studies.
- Around 20% of WITB claimants received the benefit in all years between 2009 and 2012 inclusive.
This paper is organized as follows. The next section describes the WITB, including eligibility criteria and the benefit schedules for unattached individuals and other family types. The third section provides a summary of WITB data, including a discussion of take-up among eligible workers with reported income in the WITB qualification range. The fourth section provides a profile of WITB claimants, including demographic information and sources of earnings and other income. The fifth section discusses preliminary evidence on the persistence of WITB receipt among claimants over the period 2009 to 2012. The final section presents the conclusions of the review.
To be eligible for the WITB, an individual must be resident in Canada throughout the taxation year. Unattached workers must be 19 years of age or older. Except where an individual has an eligible dependant, a student enrolled full-time for more than 13 weeks in a taxation year is not eligible for the WITB.
The amount of the WITB payment for an eligible individual increases proportionately with family working income above a defined phase-in threshold up to a specified maximum benefit level, and declines proportionately with adjusted family net income above a defined phase-out threshold.
- The family's working income for a taxation year includes total income from employment, including tax-exempt income earned on a reserve or as an emergency service volunteer; the taxable portion of scholarship income; and net self-employment income.
- Adjusted family net income for a taxation year includes net income for tax purposes, plus the tax-exempt part of income earned or received on a reserve (less deductions related to that income) and any allowances received as an emergency service volunteer, less any Universal Child Care Benefit and Registered Disability Savings Plan income.
The maximum benefit level and the phase-out threshold differ for unattached individuals relative to other recipient types (i.e., couples and families with children) and are indexed annually to account for inflation.
Chart 1 shows how the WITB benefits an eligible couple or family with children in 2015. It provides a refundable tax credit of 25% of each dollar of working income in excess of $3,000, reaching a maximum benefit of $1,844 at $10,375 of working income. Once net income exceeds $15,915, the benefit is reduced at a rate of 15% of each additional dollar, until the benefit is fully phased out at an income of $28,209. Individuals who are also eligible for the Disability Tax Credit may receive a WITB disability supplement of up to $508.
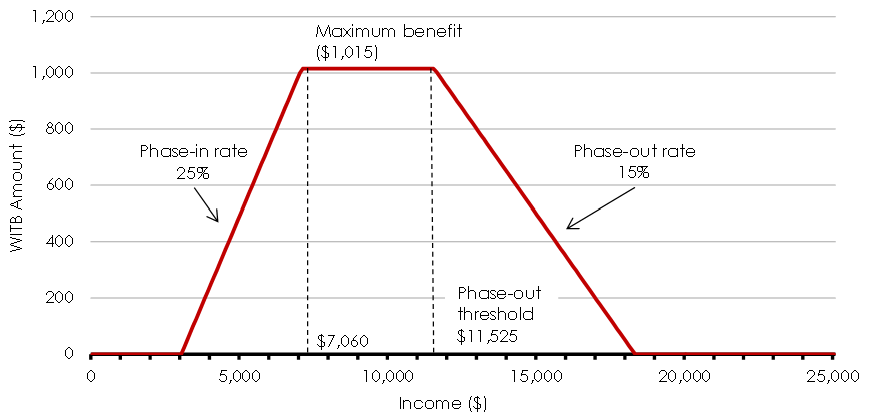
The WITB design for unattached individuals in 2015 (Chart 2) reaches a maximum benefit of $1,015 at $7,060 of working income, beginning to phase out at a net income of $11,525, and phasing out completely at an income of $18,292.
Chart 1
WITB Design for Couples and Families With Children—2015 Taxation Year
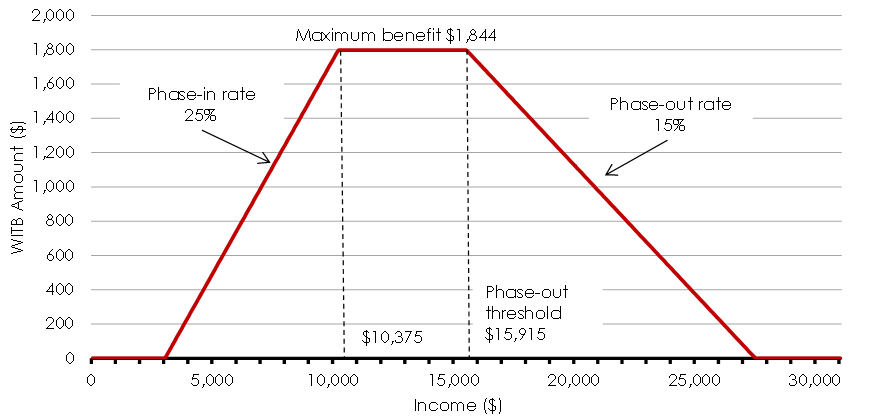
Chart 2
WITB Design for Unattached Individuals—2015 Taxation Year
Given the important role played by provinces and territories in providing basic income support, the Government of Canada has harmonized benefits where possible to further improve work incentives for low-income Canadians, including making province- or territory-specific changes to the design of the WITB. To date, four jurisdictions (Quebec, Alberta, British Columbia and Nunavut) have signed reconfiguration agreements with the federal government to customize the parameters of the WITB delivered in these jurisdictions.
Eligible individuals must apply for the WITB by completing Schedule 6 to the T1 General Income Tax and Benefit Return. Only one individual within a couple may generally apply. A worker who is married or in a common-law relationship and who is eligible for the disability supplement should generally claim the WITB on behalf of the couple; in cases where both partners are eligible for the disability supplement, both must complete a separate Schedule 6.
Eligible individuals also have the option to apply for WITB advance payments. The WITB advance payments correspond to a maximum of 50% of the WITB refundable tax credit (including the disability supplement, if applicable) that the tax filer expects to claim on his or her return for the year.
3.1 Data and Summary Statistics
The data used for the analysis are drawn from data comprising the universe of all tax filers in the years 2009–2012, including those who filed up to 18 months after the end of the taxation year in question. Data reflect information as provided by tax filers in receipt of the WITB on Schedule 6 for these years.[2] Although the WITB was introduced in 2007, this analysis focuses on 2009 and later years, given the significant expansion of the WITB in 2009.
The number of WITB recipients has remained roughly stable since 2009, while total benefits have grown by about 5% (Table 1). The average benefit per recipient has risen from about $740 in 2009 to $780 in 2012.
Table 1
WITB Summary Statistics, 2009–2012
| 2009 | 2010 | 2011 | 2012 | |
|---|---|---|---|---|
| Number of claimants (thousands) | 1,405 | 1,434 | 1,434 | 1,428 |
| Number claiming disability supplement (thousands) | 19 | 21 | 23 | 22 |
| Total value of benefits ($ millions) | 1,035 | 1,065 | 1,085 | 1,105 |
3.2 WITB Take-up
Based on information available from the T1 General Income Tax and Benefit Return, as well as other tax and benefit information, take-up of the WITB among eligible tax filers is estimated at approximately 85% in 2012.[3],[4] The remaining 15% did not complete Schedule 6, but their reported income suggests they may have been eligible.
Take-up varies most significantly across filing method, as shown in Table 2. In particular, filers who appeared to be eligible for the WITB who filed their tax returns on paper forms in 2012 had a take-up rate that was significantly lower than among the broader eligible population, at 49%. Individuals filing by other means (e.g., using tax preparation software or professional tax preparation agents) had an estimated take-up rate above 90%.
This suggests that paper filing creates a barrier to claiming the WITB. Individuals filing through the use of tax software or with the assistance of an agent are typically prompted to claim the WITB if other information they provide suggests that they would be eligible for the credit, and the necessary calculations are performed on their behalf. Lack of awareness or understanding of the WITB would not generally be a barrier to individuals filing through these means. By contrast, individuals filing on paper must be aware of, and willing and able to complete, the necessary schedule to their tax return.
Table 2
WITB Take-up and Distributions by Filing Method, 2012
| Paper | Tax software | Agent | Total | |
|---|---|---|---|---|
| Estimated take-up among WITB-eligible filers | 49% | 86% | 94% | 85% |
| Share of: | ||||
| WITB-eligible filers | 13% | 30% | 57% | 100% |
| WITB-eligible non-claimants | 47% | 28% | 25% | 100% |
| WITB claimants | 8% | 30% | 62% | 100% |
Another reason for incomplete take-up may relate to the WITB amount for which an individual or family is eligible compared to the transaction and information costs involved in claiming the benefit. Some limited evidence that the benefit side of this equation matters can be seen in the relationship between the take-up rate and the amount to which families appear to be eligible, as shown in Table 3.
Table 3
WITB Take-up by Actual or Estimated Benefit Amount, 2012
| Less than $20 | $20 - $99 | $100 - $599 | $600 or more | Total | |
|---|---|---|---|---|---|
| Paper filers | 40% | 42% | 47% | 51% | 49% |
| Other filers | 88% | 89% | 90% | 92% | 91% |
Among paper filers, take-up of the WITB increases from 40% for those receiving or estimated to be eligible for a benefit amount of less than $20 to 51% for those receiving or estimated to be eligible for a benefit of $600 or more. This trend is also evident, but weaker, among those filing by other methods. All told, lower take-up among those with smaller estimated benefits explains only a negligible portion of overall WITB non-take-up since few of those eligible for the WITB are eligible for small amounts, and the take-up rate is only slightly higher than average among those eligible for larger amounts.
4.1 Profile by Family Type
This section presents demographic characteristics of WITB claimants who completed Schedule 6. Claimants are categorized by their family type on the basis of whether they reported an eligible spouse and/or an eligible dependant (which determine the applicable WITB schedule for the claimant).
This yields four WITB family types for the purpose of our analysis (unattached, single parents, couples with no children, and couples with children). However, WITB family types may not always reflect individuals' actual family circumstances. For example, a couple consisting of a worker and a full-time student (who is therefore not an eligible spouse) is categorized as "unattached" for the purpose of this analysis.[5]
Because our unit of analysis is the WITB claimant, and only one member of each couple may generally claim the WITB, these statistics reflect couples' choice of claimant. Moreover, summary statistics place equal weight on single claimants and on the individual claiming the benefit on behalf of a couple. In the aggregate analysis, this therefore places more weight on single workers than would be the case were non-claiming spouses/common-law partners included in the recipient population used as the unit of analysis. This should be borne in mind when interpreting statistics. For example, a younger population on average will in part reflect this weighting of single workers. Where appropriate, the analysis provides a comparison with the tax filer population on a comparable basis (tax filing families) and alternative statistics with adult WITB beneficiaries (including both members in a couple) as the unit of analysis.
Chart 3 shows that about 63% of WITB claimants in 2012 were unattached individuals. Single parents made up an additional 16%, while couples with and without children made up 10% each. Compared to the population of tax filing families with at least one member of working age (18–64), WITB claimants are more likely to be unattached or single parents, and are less likely to be part of a couple (with or without children).
Chart 3
Family Type of WITB Claimants Relative to Tax Filing Families, 2012 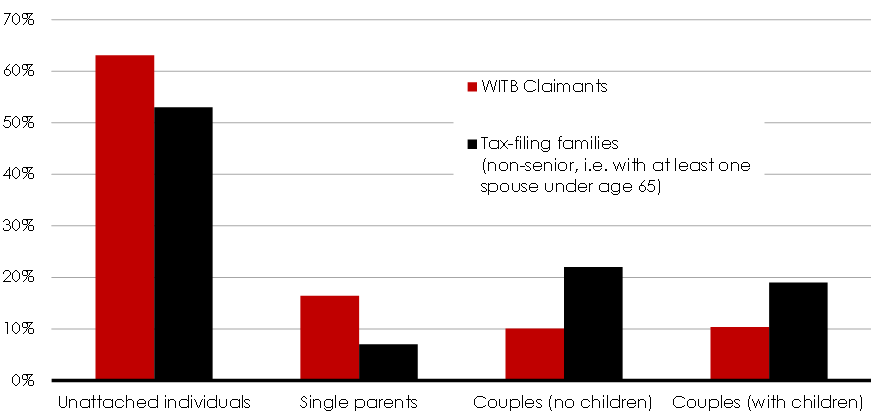
The agreement entered into with the Government of Quebec to reconfigure the WITB to target childless families raises the overall share of these families in the WITB population. This reconfiguration design was adopted to better complement Quebec's work premium and other provincial programs that provide greater support for families with children. In particular, unattached workers made up 74% of WITB recipients in Quebec in 2012, compared to 60%, on average, in other provinces and territories (Chart 4).
Chart 4
FFamily Type of WITB Claimants, by Province or Territory, 2012 (% of Claimants) 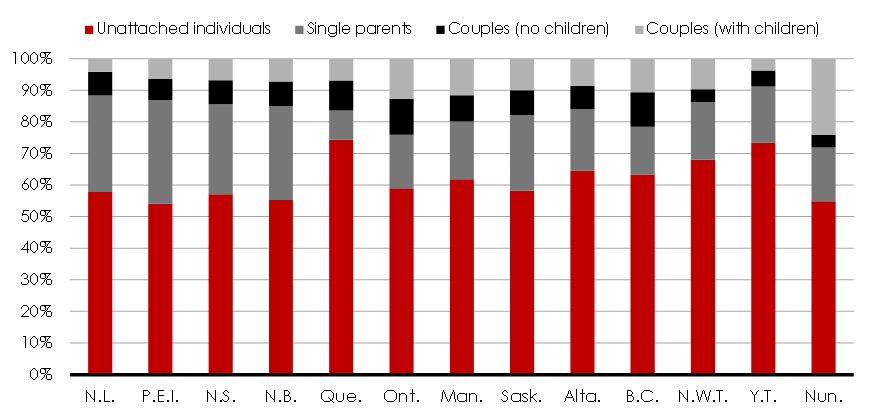
4.2 Age and Post-Secondary Education Participation
As shown in Table 4, in 2012 most WITB recipients were over the age of 30. However, relative to the broader tax filing population, WITB recipients tend to be young. About 42% of WITB claimants were under the age of 30, and the average age of claimants was 34.[6] This is consistent with WITB claimants being predominantly unattached individuals, as young tax filers are more likely to be single and are less likely to have children, compared to the overall working-age tax filing population. Of unattached WITB claimants, 57% were under the age of 30.
A younger WITB population is also consistent with the fact that wages tend to increase with experience. That is, many young workers and new labour market entrants are also low-wage workers and therefore within the WITB target range.
Table 4
Number of WITB Claimants by Family Type and Age, 2012 (thousands)
| Unattached individuals | Single parents | Couples (no children) | Couples (with children) | Total | |
|---|---|---|---|---|---|
| Under 30 | 512 (57%) | 59 (25%) | 13 (9%) | 19 (13%) | 603 (42%) |
| 30-54 | 295 (33%) | 171 (73%) | 64 (45%) | 122 (82%) | 652 (46%) |
| 55 or older | 94 (10%) | 5 (2%) | 66 (46%) | 8 (5%) | 173 (12%) |
| Total | 901 | 235 | 144 | 149 | 1,428 |
| Average age | 33 | 36 | 50 | 40 | 34 |
Thus while young, unattached workers make up an important share of the WITB claimant population, many of these workers are in transition. Workers aged 30 and over, who make up the majority of WITB claimants, tend to qualify for the WITB on a more persistent basis, as demonstrated in a subsequent section.
As shown in Table 5, while full-time students are not eligible to claim the WITB, a significant number of WITB recipients recently completed post-secondary education or occupational training.[7] About 8% of WITB claimants in 2012 were full-time students for more than three months of 2011. Unattached individuals claiming the WITB are significantly more likely to have been students in the prior year (10%) than are other family types (1% -7%). Looking at a slightly longer time horizon, nearly 19% of unattached individuals claiming the WITB in 2012 were full-time students in one of the three preceding years (2009 to 2011), compared with around 13% of single parents and 7% and 3% of couples with and without children, respectively.
Table 5
Number of WITB Claimants by Family Type and Recent Post-Secondary Education or Occupational Training, 2012 (thousands)
| Unattached individuals | Single parents | Couples (no children) | Couples (with children) | Total | |
|---|---|---|---|---|---|
| All WITB claimants | 901 | 235 | 144 | 149 | 1,428 |
| Full-time student in 2011 | 92 (10%) | 17 (7%) | 2 (1%) | 7 (4%) | 117 (8%) |
| Full-time student in 2009, 2010 and/or 2011 | 168 (19%) | 29 (13%) | 4 (3%) | 10 (7%) | 212 (15%) |
4.3 Gender of WITB Claimants
Table 6 shows the gender distribution of WITB claimants. Somewhat more than half (55%) of unattached claimants were men, while about 90% of single parents claiming the WITB were women. Only one member within each couple may claim the WITB, and in 2012, this was most often a man by a margin of more than two to one. Overall, 50% of claimants were women; however, if both spouses in a couple, regardless of who claims the WITB, are presumed to benefit from it, more than half of adult beneficiaries are women.
Table 6
Number of WITB Claimants by Family Type and Gender, 2012 (thousands)
| Unattached individuals | Single parents | Couples (no children) | Couples (with children) | Total | |
|---|---|---|---|---|---|
| Men | 493 (55%) | 23 (10%) | 93 (65%) | 107 (72%) | 717 (50%) |
| Women | 408 (45%) | 212 (90%) | 51 (35%) | 41 (28%) | 711 (50%) |
| Total | 901 | 235 | 144 | 149 | 1,428 |
4.4 Earnings and Other Income
As illustrated earlier in Charts 1 and 2, the WITB has a three-stage structure: the phase-in stage, the "plateau" stage (where the benefit is at its maximum), and the phase-out stage.
Table 7 provides a distribution of WITB recipients across these different WITB stages (phase-in, plateau and phase-out, as well as phase-in and phase-out), as determined by their earnings and other income. Note that these ranges differ between unattached individuals and other families. Because the benefit phases in with working income and phases out with net income, some workers (about 6% of WITB claimants) with significant income from other sources may be simultaneously on the phase-in and phase-out portions of the WITB schedule.
Table 7
Number of WITB Claimants by Family Type and Working Income/Net Income Range, 2012 (thousands)
| Unattached individuals | Single parents | Couples (no children) |
Couples (with children) |
Total | |
|---|---|---|---|---|---|
| Phase-in | 222 (25%) | 65 (27%) | 27 (19%) | 28 (19%) | 342 (24%) |
| Full WITB ("plateau") | 172 (19%) |
36 (15%) |
19 (13%) |
24 (16%) |
251 (18%) |
| Phase-out | 466 (52%) |
118 (50%) |
85 (59%) |
87 (58%) |
756 (53%) |
| Phase-in and phase-out | 42 (5%) |
16 (7%) |
13 (9%) |
10 (7%) |
80 (6%) |
| Total | 901 | 235 | 144 | 149 | 1,428 |
For all family types, at least half of recipients are situated strictly on the phase-out portion of the WITB schedule, which is to say that their total net income is sufficiently high that the benefit has been partially reduced. Around a quarter of unattached individuals and just under 20% of couples are strictly within the phase-in range where increased earnings are matched by an increased WITB. Between 13% (couples with no children) and 19% (unattached individuals) are situated in the plateau range of the WITB where the maximum benefit is provided.
Table 8 shows the breakdown of working income of WITB recipients for 2012 from a number of sources: employment income reported on a T4 slip by an employer, other employment income (e.g., tips and gratuities), self-employment, and certain other sources that are included for the purpose of determining the WITB (tax-exempt income earned on a reserve, tax-exempt income earned as an emergency services volunteer, and taxable scholarship income).
The greater part of WITB recipients' working income (around 75% for unattached individuals and around 55% for couples) is reported on a T4 slip by the claimants' employer(s). This is largely wage income, but may also include certain other amounts such as vacation pay, bonuses and taxable non-wage benefits. A small share (5% or less) comes from other employment income, such as tips and gratuities or other earnings not reported on a T4 slip. Finally, around 20% of unattached individuals' working income and close to 40% of couples' working income comes from self-employment.
The higher share of earnings derived from self-employment among couples, relative to unattached workers, can largely be explained by the age distribution of these groups. As shown earlier in Table 4, more than half of unattached WITB claimants are under the age of 30, compared to around 10% of couples, and self-employment income is found to be much less important, across all family types, for workers under the age of 30. For WITB claimants between ages 30 and 54, self-employment income as a share of total family earnings is 36% for unattached individuals compared to 39% and 34% for couples with and without children, respectively. However, self-employment income for single parents remains a lower share of working income in this age group (23%).
Table 8
Sources of Working Income of WITB Recipients by Family Type, 2012
| Unattached individuals | Single parents | Couples (no children) | Couples (with children) | Total | |
|---|---|---|---|---|---|
| Employment (T4 slip) | 75% | 78% | 56% | 55% | 71% |
| Other employment | 3% | 2% | 5% | 4% | 3% |
| Self-employment1 | 21% | 17% | 38% | 39% | 24% |
| Tax-exempt earnings and taxable scholarships | 1% | 3% | 1% | 2% | 2% |
Receipt of Social Assistance and Employment Insurance
In addition to their working income, many WITB recipients have significant income from other sources that enters into the calculation of family net income. The most important such sources are social assistance and employment insurance benefits.
Table 9 shows that 10% of WITB recipients in 2012 received social assistance in that year. Some 2012 WITB claimants who did not receive social assistance in 2012 did receive it in 2011, such that 13% of 2012 WITB claimants received social assistance in 2011 and/or 2012. These shares vary across family types, with single parent claimants being most likely to receive (or to have recently received) social assistance, and couples without children being least likely.[8]
Limiting our consideration to WITB recipients on the phase-in portion of the WITB schedule (i.e., those with the lowest incomes and therefore the greatest likelihood of receiving social assistance), the share of WITB claimant families reporting social assistance is higher, ranging from about 10% of couples without children to about 30% of single parents in 2012.
Table 9
Number of WITB Claimants in 2012 in Receipt of Social Assistance, by Family Type (thousands)
| Unattached individuals | Single parents | Couples (no children) |
Couples (with children) | Total | |
|---|---|---|---|---|---|
| All WITB claimants | 901 | 235 | 144 | 149 | 1,428 |
| Received social assistance in 2012 | 77 (9%) | 42 (18%) | 8 (6%) | 15 (10%) | 142 (10%) |
| Received social assistance in 2011 and/or 2012 |
99 (11%) | 57 (24%) | 10 (7%) | 20 (13%) | 186 (13%) |
Table 10
Number of WITB Claimants in 2012 in Receipt of Employment Insurance, by Family Type (thousands)
| Unattached individuals | Single parents | Couple (no children) | Couple (with children) | Total | |
|---|---|---|---|---|---|
| All WITB claimants | 901 | 235 | 144 | 149 | 1,428 |
| Received any Employment Insurance in 2012 | 89 (10%) | 55 (23%) | 21 (14%) | 26 (17%) | 190 (13%) |
| Received regular Employment Insurance in 2012 | 71 (8%) | 31 (13%) | 17 (12%) | 14 (9%) | 132 (9%) |
As illustrated in Table 10, approximately 13% of WITB claimants in 2012 also reported income from Employment Insurance benefits. Among single parents, the share of WITB recipients reporting Employment Insurance is nearly twice as high, at 23%. This disparity may reflect the importance of Employment Insurance special benefits, such as maternity and parental benefits, for families with children.
Limiting our analysis to Employment Insurance regular benefits (i.e., income replacement benefits to individuals who lose their jobs through no fault of their own and are available for and able to work but cannot find a job), the share of WITB recipients is more consistent across family types, ranging between 8% for unattached individuals to 13% for single parents.
5.1 WITB Claims in the Immediately Subsequent Year
Table 11 shows the share of WITB claimants in each of 2009 through 2011 who also received the benefit in the subsequent year.[9] For example, 46.3% of unattached WITB claimants in 2009 also received the benefit in 2010.
Table 11
Percentage of Claimants Who Also Claimed the WITB in the Subsequent Year
| Unattached individuals | Single parents | Couples (no children) | Couples (with children) | Total | |
|---|---|---|---|---|---|
| 2009 | 46.3 | 58.1 | 53.9 | 55.9 | 50.1 |
| 2010 | 45.6 | 58.4 | 54.6 | 56.0 | 49.7 |
| 2011 | 45.7 | 58.9 | 54.6 | 56.5 | 49.9 |
The persistence of WITB receipt has been very stable over the time period examined. In any given year, half of WITB claimants have gone on to claim the benefit again in the subsequent year.
Among 2011 claimants who did not claim the WITB in 2012, the majority exited due to an increase in net income that placed them above the qualification range of the benefit (Table 12). This was especially likely to be the case for couples with or without children.
Table 12
Reasons for Exit From the WITB in 2012, by Family Type (%)
| Unattached individuals | Single parents | Couples (no children) | Couples (with children) | Total | |
|---|---|---|---|---|---|
| Did not file | 11.6 | 5.1 | 7.6 | 5.9 | 9.8 |
| Earnings too low | 17.6 | 29.9 | 21.5 | 17.0 | 19.6 |
| Net income too high | 53.4 | 59.0 | 65.1 | 71.8 | 56.9 |
| Other | 17.4 | 6.1 | 5.8 | 5.3 | 13.7 |
Roughly 20% of 2011 claimants no longer eligible for the WITB in 2012 were ineligible due to earnings below the minimum threshold for qualification ($3,000 in provinces and territories without reconfiguration agreements), and many of the roughly 10% of 2011 claimants who did not file a tax return in 2012 likely had earnings below the minimum threshold. Single parents were more likely than other family types to leave WITB qualification due to insufficient earnings in 2012.
In the remaining cases (about 17% for unattached individuals and 5-6% for other family types), the WITB exit was due to other reasons. The most important such reason, explaining the relatively high figure for unattached individuals, was 2011 claimants becoming full-time students in 2012 and thus ineligible for the WITB.[10] Other possible explanations include:
- Increases in income that is tax-exempt but included in the WITB calculation, pushing an individual's net income above the WITB qualification range.[11]
- A change in other eligibility factors for the WITB (e.g., an individual is incarcerated for at least 90 days or becomes a non-resident during the taxation year).
- An eligible claimant chooses not to claim, or fails to claim, the WITB in the second year.[12]
WITB receipt is also observed to be more persistent for couples and families with children than for unattached individuals. This may partly be explained by the propensity of such claimants to enrol in full-time post-secondary education, but there is also some evidence that it results in part from the narrower income qualification range of unattached individuals relative to other family types (who are primarily one-earner households[13]).
- In 2012, an unattached individual in Ontario ceased to receive the WITB with net income above $17,478, compared to $26,952 for a single parent. Persistence rates for these family types in Ontario were 47.5% and 62.5% respectively between 2011 and 2012.
- By contrast, an unattached individual under the reconfigured Quebec WITB design ceased to receive WITB for net income above $18,457, compared to $15,221 for a single parent. Persistence rates for these groups in Quebec were 46.8% and 46.6% respectively between 2011 and 2012.
That is, with a similar eligibility range, single parents and unattached individuals had similar persistence rates in Quebec.
The lower average age of unattached WITB recipients may also play a role in the lower persistence of unattached individuals. Workers with low earnings due to limited work experience would be expected to see more rapid earnings growth than those with persistently low earnings due to a lack of marketable skills or other barriers to employment. Table 13 shows persistence is lowest for claimants under the age of 30 across all family types, with generally higher persistence for workers over the age of 55 than for those between the ages of 30 and 54.
Table 13
WITB Claim Persistence Between 2011 and 2012, by Family Type and Age Group of Claimant
| Unattached individuals | Single parents | Couples (no children) | Couples (with children) | Total | |
|---|---|---|---|---|---|
| Under 30 | 42.0 | 56.3 | 42.2 | 49.5 | 43.6 |
| 30-54 | 49.5 | 59.9 | 54.7 | 57.3 | 54.2 |
| 55 or older | 54.6 | 57.8 | 57.1 | 62.2 | 56.0 |
It is noteworthy that there is almost no difference by age group in persistence for single parents, and persistence actually falls slightly for single parents over the age of 55 compared to those in the 30-54 age bracket. However, the number of parents in this highest age range is small.
5.2 Multi-Year Persistence
Examining persistence over a somewhat longer time frame, Table 14 shows the share of 2009 WITB claimants who also claimed in any subsequent year. This broader concept of persistence raises the overall rate of persistence from 50% (two-year persistence between 2009 and 2010, from Table 11) to 63.4%. Put differently, about 27% of 2009 claimants who did not claim in 2010 re-qualified in 2011 or 2012.
Table 14 shows as well the share of 2009 claimants who also received the benefit in each of the subsequent three years (i.e., who received the WITB for all four years between 2009 and 2012 inclusive). The data indicate that about 20% of WITB claimants in 2009 made persistent use of the transfer in the subsequent years (15.8% for unattached individuals and 24-27% for other family types).
Table 14
Percentage of 2009 Claimants Who Also Claimed the WITB in Any or All Subsequent Years Through 2012, by Family Type
| Unattached individuals | Single parents | Couples (no children) | Couples (with children) | Total | |
|---|---|---|---|---|---|
| 2009 and any subsequent year | 59.8 | 71.5 | 66.1 | 69.3 | 63.4 |
| 2009 and all subsequent years | 15.8 | 26.3 | 23.7 | 26.7 | 19.6 |
Table 15 shows that four-year persistence, like two-year persistence, was significantly higher for 2009 claimants over the age of 30 than for younger claimants.
Table 15
WITB Claim Persistence Between 2009 and 2012 for 2009 Claimants, by Family Type and Age Group of Claimant
| Unattached individuals | Single parents | Couples (no children) | Couples (with children) | Total | |
|---|---|---|---|---|---|
| Under 30 | 11.4 | 21.7 | 13.1 | 17.4 | 12.7 |
| 30-54 | 21.3 | 27.9 | 25.2 | 27.9 | 24.7 |
| 55 or older | 24.0 | 23.7 | 24.6 | 32.4 | 24.6 |
The tax system represents an administratively efficient manner to deliver targeted support to low-income workers. The WITB provides such support in a way that increases the returns to work and encourages participation in the labour force.
Take-up of the benefit has been strong, but not universal, among eligible workers with reported income in the WITB qualification range. The evidence from the first four years since the 2009 expansion of the WITB suggests the benefit is providing transitional support for some groups with temporarily low incomes—such as young workers just beginning to gain experience in the work force or couples in which one partner is temporarily out of work—as well as to a population of workers with persistently low incomes or who fall into low income on a recurring basis.
* The empirical analysis presented in this study was prepared by Stephanie Andrews, Senior Economist, Tax Policy Branch, Department of Finance Canada and Mark Maxson, Senior Economist, Tax Policy Branch, Department of Finance Canada. Enquiries regarding Department of Finance Canada publications can be sent to finpub@canada.ca.
1 For a recent survey of evidence on the Earned Income Tax Credit, see, for example, Nichols, A. and J. Rothstein (2015). "The Earned Income Tax Credit (EITC)," NBER Working Paper No. 21211.
2 Schedule 6 information is not available for analysis that considers WITB claimants in years they did not claim the WITB. In these cases, analysis reflects a matching of individuals to their tax record in that year, to the extent that they filed a return. It does not capture information about those who did not file a return.
3 Note that eligibility cannot be determined with certainty because certain exempt income sources included in the WITB definition of income, such as income earned on reserve, are found only on Schedule 6, which is not completed by non-claimants.
4 In 2012, only about 500 WITB claimants made use of the advance payment provision to receive part of their payment before the end of the taxation year.
5 The data suggest that around 15,000 tax filers claiming the WITB as unattached workers (1.7% of such claimants) may have had spouses or common-law partners in the 2012 taxation year.
6 About 37% of adult WITB beneficiaries (including both members in couples) were under the age of 30. This is significantly higher than the 20% share of all tax filers under the age of 30.
7 Recent graduates are defined as those having an Education Tax Credit amount consistent with four or more months of enrolment in a qualifying educational program in a prior year.
8 Here, and in all subsequent calculations considering WITB claimants' tax records over multiple years, the tax information of a claimant's spouse or common-law partner is included only in years that the claimant filed a return. As a result, shares across multiple years may represent slight under-estimates.
9 A claimant in a year is considered to have also received the WITB in the subsequent year if the claimant or the claimant's spouse or common-law partner claimed the WITB in that subsequent year.
10 This set of facts will primarily apply to unattached claimants, since those with eligible dependants may still claim the WITB while attending school full time, and working spouses of full-time students may claim the WITB as an individual. Full-time students who previously claimed the WITB, and whose spouses continue to claim the WITB as an unattached individual, are not considered to have exited from the WITB in our analysis.
11 Tax-exempt income is not reported on the T1 return. While it is reported on Schedule 6, this schedule is not completed by those who do not claim the WITB and therefore tax-exempt income is not included in our calculation of net income for those exiting the WITB.
12 While overall take-up of the WITB amongst seemingly eligible tax filers was around 85% in 2012, the take-up rate is expected to be higher among prior-year claimants who, on average, would have greater awareness and have demonstrated an ability to claim the benefit. Nonetheless, some may have received assistance in claiming in 2011 that was not available to them in 2012.
13 Almost two thirds of couples claiming the WITB can be classified as one-earner couples, defined here as couples wherein one partner reports less than $1,000 in working income in the year.