
Archived - Report on Federal Tax Expenditures - Concepts, Estimates and Evaluations 2016: part 9
Governments in Canada provide significant assistance to charities through direct grants and contributions as well as by way of a number of tax incentives to encourage charitable donations. In particular, Canadians who give to registered charities and other qualified donees may claim a non-refundable tax credit with respect to their charitable donations on both their federal and provincial[1] personal income tax returns, and capital gains associated with the donation of certain types of assets are fully exempt from income tax. These tax incentives lower the after-tax cost of giving with the aim of encouraging people to donate more to charities.
An evaluation of the federal Charitable Donation Tax Credit was published in the 2014 edition of this report. One of the main conclusions of the study was that more empirical evidence was required before any firm conclusion could be reached about the effectiveness of the tax incentives for charitable donations in Canada. One important piece of evidence that is instrumental in assessing effectiveness is the degree to which people respond to such tax-based incentives. This response is summarized by the price elasticity of charitable donations, which represents the percentage change in donations resulting from a 1% change in the after-tax price of giving.[2] In general, the case for providing tax incentives for charitable donations is stronger when decisions to donate are more responsive to such incentives, because a stronger response provides more indirect funding to charities for the same financial cost for governments.
Empirical studies of the determinants of charitable donations support the general conclusion that charitable donation tax incentives have a positive impact on charitable giving, although the precise magnitude is still open to debate and studies based on Canadian data are few. As such, these studies do not provide sufficiently strong evidence to draw firm conclusions about the response of Canadians to tax incentives for charitable donations. This study contributes to this literature by estimating the response of Canadian donors to changes in tax incentives for charitable donations using a panel of income tax filers, spanning the period from 1997 to 2012. The analysis takes advantage of differences in the timing and scope of changes in the after-tax price of giving across provinces to estimate the price elasticity of charitable donations. In particular, the study examines the responsiveness of individuals to changes in provincial tax incentives when provinces adopted a tax-on-taxable-income system in the early 2000s and other specific changes to provincial tax incentives, including a significant increase in Alberta's charitable donation tax credit rate for donations in excess of $200, to 21% from 12.75%, starting in 2007. This difference-in-difference approach allows us to better account for unobservable factors that might have affected charitable giving behaviours over the same period. The results suggest that individuals responded significantly to changes in the tax incentives for charitable donations implemented between 1997 and 2012.
This study is organized as follows. Section 2 provides background information on the federal and provincial tax incentives for charitable donations. Section 3 introduces the statistical model used to estimate the price elasticity of charitable donations in Canada and presents the results from this analysis. Section 4 concludes the analysis.
This section reviews the key income tax measures intended to encourage charitable donations by individuals, namely the charitable donation tax credits and the capital gains tax exemptions for donating certain types of assets. The charitable sector also benefits from other tax incentives, notably the income tax exemption for registered charities and other qualified donees and the deductibility of charitable donations by corporations in calculating their corporate taxable income. These tax measures fall outside the scope of this analysis and are thus not discussed below. Tax incentives introduced after 2012[3] are also not discussed given that their introduction falls outside the period covered by the sample used in this study.
Federal and Provincial Charitable Donation Tax Credits
In Canada, tax incentives for charitable giving mainly take the form of non-refundable tax credits provided by the federal and provincial governments. These non-refundable income tax credits are generally calculated by applying the lowest personal income tax rate to the first $200 of donations reported in a given year and the highest personal income tax rate to donations in excess of $200.[4] Table 1 presents the federal and provincial charitable donation tax credit rates that applied in the first and last year covered by our estimation sample.
In general, charitable donation tax credits may be claimed on donations totalling up to 75% of net income in a given year. The income limit does not apply to certain gifts of cultural property or ecologically sensitive land and in certain other circumstances, such as a gift made in the taxpayer's year of death. Donations made in a given year do not have to be included in the income tax return of the same year and may be carried forward and claimed within the next five years.[5]
Table 1
Effective Charitable Donation Tax Credit Rates, 1 by Province, 1997 and 2012
(%)
| 1997 | 2012 | |||
|---|---|---|---|---|
|
|
|
|||
| First $200 of Donations |
Donations in Excess of $200 |
First $200 of Donations |
Donations in Excess of $200 |
|
| Federal2 | 17.5-18.4 | 29.9-31.3 | 15.0 | 29.0 |
| Newfoundland and Labrador | 11.7-12.9 | 20.0-22.0 | 7.7 | 13.3 |
| Prince Edward Island | 10.1-11.1 | 17.3-19.0 | 9.8-10.8 | 16.7-18.4 |
| Nova Scotia | 9.9-10.9 | 17.0-18.7 | 8.8 | 21.0 |
| New Brunswick | 10.7-11.6 | 18.3-19.7 | 9.1 | 18.0 |
| Quebec | 20.0-22.0 | 20.0-22.0 | 20.0 | 24.0 |
| Ontario | 8.2-11.9 | 13.9-20.3 | 5.1-7.9 | 11.2-17.4 |
| Manitoba | 8.8 | 15.1 | 10.8 | 17.4 |
| Saskatchewan | 9.4-10.6 | 16.0-18.1 | 11.0 | 15.0 |
| Alberta | 7.7-8.4 | 13.2-14.3 | 10.0 | 21.0 |
| British Columbia | 8.7-13.4 | 14.8-22.9 | 5.1 | 14.7 |
| 1 A range is presented for jurisdictions imposing a surtax calculated on income taxes. The charitable donation tax credit is relatively more beneficial in the presence of such surtaxes, given that the credit reduces the amount of income tax on which the surtax is calculated. 2 The credit rate available to Quebec residents must be adjusted for the 16.5% Quebec Abatement. Source: Department of Finance Canada calculations. |
||||
Capital Gains Tax Exemptions
Individuals donating certain assets that have appreciated in value are eligible for a tax exemption with respect to the capital gains realized on the donated assets. Assets eligible for a capital gains tax exemption include publicly listed securities and certain exchangeable shares, certified cultural property and ecologically sensitive land. These exemptions, which are also available for provincial income tax purposes, further reduce the after-tax cost of donating such assets.
The current full capital gains tax exemption for donations of publicly listed securities and ecologically sensitive land was announced in Budget 2006 (effective May 2, 2006). Prior to that, donations of publicly listed securities and ecologically sensitive land benefited from an inclusion rate equivalent to half the normal inclusion rate.[6] Also, donations to private foundations only became eligible for the capital gains tax exemption starting on March 19, 2007.
Federal Charitable Donation Personal Income Tax Expenditures
Table 2 provides a breakdown of the charitable donations reported on federal income tax returns in 2012, the last year covered by our estimation sample, and the associated tax expenditures. The fiscal cost associated with federal charitable donation personal income tax expenditures totalled approximately $2.4 billion in that year. The federal tax-based assistance associated with donations not eligible for the capital gains tax exemption represented 91% (or $2.2 billion) of the total federal tax-based assistance to charitable donations claimed by individuals in 2012. The tax assistance for donations eligible for the capital gains tax exemption accounted for the remaining 9% (or $212 million); of that amount, the non-taxation of capital gains accounted for about 2% of the overall assistance (or $52 million).
Table 2
Charitable Donations Claimed by Individuals and Associated Federal Tax Expenditures, by Type of Donation, Estimates for 2012
($ millions)
| Amount of Donations | Charitable Donation Tax Credit | Non-Taxation of Capital Gains | Total Tax Expenditures | |
|---|---|---|---|---|
| Total charitable donations | 8,585 | 2,350 | 52 | 2,402 |
| Type of Donation: | ||||
| Non-eligible for the capital gains exemption | 8,025 | 2,190 | – | 2,190 |
| Eligible for the capital gains exemption: | 560 | 160 | 52 | 212 |
| Publicly listed securities | 435 | 125 | 40 | 165 |
| Ecologically sensitive land | 25 | 5 | 2 | 7 |
| Cultural property | 100 | 30 | 10 | 40 |
Recent Trends
Charitable donations reported by individuals claiming the federal Charitable Donation Tax Credit totalled $8.6 billion in 2012, as reported above. This is about 6% lower in real terms than the peak observed in 2007, with most of the decline taking place during the last economic recession. The same pattern was observed in the early 2000s when total charitable donations decreased with the economic slowdown and increased during the following period of economic recovery (see Chart 1).
Between 1997 and 2012, the total amount of charitable donations (in constant 2012 dollars) reported on income tax returns grew at an annual rate of 2.4%. The total amount of charitable donations grew at an annual rate of 5.1% between 1997 and the peak of 2007, after which it remained fairly stable except for the dip observed during the last economic recession. The increase in donations between 1997 and 2012 is mainly associated with variations in the average value of donations, as the number of claimants only grew by an annual rate of 0.6% over the full sample period (including an annual growth rate of 0.9% between 1997 and 2007).
Chart 1
Charitable Donations by Individuals Claimed for Purposes of the Federal Charitable Donation Tax Credit
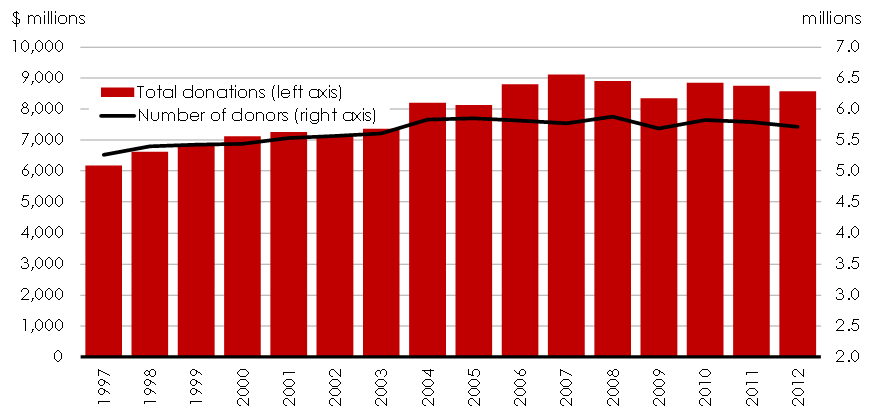
Sources: T1 return data; Department of Finance Canada calculations.
Notes: Excludes donations made as part of tax shelter arrangements or claimed within a trust. Includes donations made in the year of death.
Recent Estimates [7]
There is a general consensus in the public policy literature that tax incentives have a positive impact on charitable donations, although the magnitude of that impact is still open to debate given the many challenges associated with estimating the price elasticity of charitable donations. A fundamental difficulty is distinguishing the causal effect of price on charitable donations from the effects of income and other determinants, including those that are unobserved in the data. In recognition of this difficulty, the literature on the price elasticity of charitable donations has progressed by making use of increasingly sophisticated econometric methods.
A selection of recent estimates of the price elasticity of giving is presented on Table 3. These studies have reported estimates of the price elasticity of charitable donations in the range of -0.6 to -2.7. This means that a 1% reduction in the price of giving, through an increase in the rate of the charitable donation tax credit for example, is generally estimated to increase charitable donations by 0.6% to 2.7%. However, many of these studies have limited applicability to Canada given, for example, that the structure of the tax systems and the charitable donation incentives in other countries can be significantly different from those in Canada. Only a few studies have considered the price elasticity of charitable donations using Canadian data. Among the more recent ones, Hossain and Lamb (2012), using cross-sectional survey data for the year 2007, estimated an overall price elasticity of -1.7 with a range from -0.8 for donations to religious charities to -2.2 for donations to charities involved in international development. Overall, the median price elasticity of charitable donations found in the recent literature is -1.2. However, only the study by Hossain and Lamb (2012) is based on Canadian data and some of these studies are based on limited information. Moreover, cross-sectional studies are generally found to lead to estimates of the price elasticity of charitable donations that are overstated due to the difficulty of controlling for unobserved determinants of charitable donations, such as altruism and social networks.
Table 3
Summary of Recent Estimates of Price Elasticity of Charitable Donations
| Study | Elasticity | Country | Years | Type of Data |
|---|---|---|---|---|
| Brooks (2007) | -2.7 | United States | 2001 | Cross-section/survey |
| Fack and Landais (2010) | -1.2 | France | 1998 to 2006 | Repeated cross-sections/administrative |
| Bakija and Heim (2011) | -1.1 | United States | 1979 to 2006 | Panel/administrative |
| Bönke et al. (2013) | -1.2 | Germany | 1998, 2001 and 2004 | Repeated cross-sections/administrative |
| Adena (2014) | -0.6 | Germany | 2001 to 2006 | Panel/administrative |
| Hossain and Lamb (2012) | -1.7 | Canada | 2007 | Cross-section/survey |
| Median price elasticity | -1.2 |
In order to complement the few Canadian studies on the price elasticity of charitable donations, this study uses a panel of income tax returns that tracks the same individuals for up to 16 years from 1997 to 2012. The main data source is a longitudinal dataset based on a random sample of 10% of all individual tax returns obtained from the Canada Revenue Agency. The size of this dataset makes it representative of the overall population of donors. This dataset was augmented for the purpose of the analysis with spousal income tax return data and information returns filed by charities (T3010 – Registered Charity Information Return) that were also obtained from the Canada Revenue Agency.
This study adopts the standard approach of measuring the change in charitable donations resulting from variations in the price of giving, while controlling for other determinants of charitable donations. The price of giving is defined as one minus the marginal tax assistance on a dollar of charitable donations.[8] This tax assistance on the next dollar of charitable donation generally corresponds to the lowest income tax credit rate for those giving less than the $200 threshold (including those who do not give) and the top income tax credit rate for those giving more than $200. For individuals donating assets qualifying for the capital gains tax exemptions, the marginal after-tax price of giving is further reduced by the marginal tax rate that would apply to the next dollar of taxable capital gain (prorated for the value of the capital gain as a share of total donations). The effective marginal tax assistance rates were calculated for each individual in the sample and include the charitable donation tax credits and capital gains tax exemptions at both the federal and provincial levels.
The price of giving is endogenously related to charitable giving because larger charitable donations are associated with lower prices (higher credits) given the two-tier structure of the charitable donation tax credits. As a result of this "reverse causation," standard econometric techniques will in general be biased in estimating the causal relationship of interest given the difficulty of disentangling one relationship from the other. Our empirical strategy must therefore be able to distinguish the "reverse causal" relationship between price and donations that is due to the structure of the credit from the causal relationship between donations and the price of charitable donations that is due to people giving more (less) because the price of giving is low (high). In addition, a large number of individuals report zero charitable donations in any given year, whether because they did not make any donations, they were not taxable, or they are pooling or saving up donations. Also, since charitable donations cannot be negative, the relationship between donations and the other explanatory variables (including the price of donations) is not linear. Our empirical strategy relies on grouping the observations in the estimation sample into cohorts in order to address these methodological issues. The section "Empirical Model" in the annex provides more details on the selected estimation strategy.
Description of the Estimation Sample
Our final estimation sample includes about 11 million observations for the 1997 to 2012 period. These observations account for about 80% of the total amount of charitable donations reported in the original sample obtained from the Canada Revenue Agency. Most of the excluded donors are low-income individuals, as individuals who earned less than $40,000 of adjusted income, on average, over the sample period were excluded.[9] The main reason for this exclusion is that we generally do not observe charitable donations of non-taxable individuals in the tax data, even if such donations occur, because the tax credit is non-refundable.[10]
Table 4 presents descriptive statistics of key variables calculated on this estimation sample (all figures are in 2012 dollars). Three numbers are reported for each variable: the mean, the median and the standard deviation. The average amount of charitable donations is $910 for individuals in the estimation sample. About 62.5% of the households in the estimation sample claim the charitable donation tax credit in a given year. The average donation for those who give is therefore about $1,455—which is in line with what is observed in the original sample. There are, however, large variations in the amount given by each individual, as illustrated by the median amount of charitable donations of $55 and the standard deviation of roughly $24,000.[11] This large variation is due to the fact that a relatively small number of donors make very large donations every year. As an illustration, the top 1% and 10% of donors represent respectively about 40% and 80% of the total amount of charitable donations in the estimation sample.
Table 4
Descriptive Statistics From the Estimation Sample (2012 dollars)
| Variable | Mean | Median | Standard Deviation |
|---|---|---|---|
| Individual charitable donations | $910 | $55 | $23,570 |
| Marginal after-tax price of a $1 donation | $0.67 | $0.67 | $0.11 |
| Adjusted individual income | $67,375 | $55,400 | $102,875 |
| Age | 48.3 | 48.0 | 14.0 |
| Provincial unemployment rate | 7.2% | 7.2% | 1.9% |
| Share of government contributions in total revenues of charities | 67.6% | 68.1% | 4.3% |
| Share of filers reporting charitable donations | 62.5% | – | – |
| Share of filers with dependent children | 33.8% | – | – |
| Share of filers that are separated, divorced or widowed | 10.8% | – | – |
The adjusted income of individuals included in the estimation sample is on average about $67,000, with a median of about $55,000 and a standard variation of roughly $100,000. The average tax filer is about 48 years old. The sample includes control variables to better isolate the causal relationship between charitable donations and the price of giving. These variables are the provincial unemployment rate, the provincial share of government contributions in total revenues of charities, the year, the province, and dummy variables indicating whether or not the tax filer reported dependent children or is either separated, divorced or widowed.[12]
Chart 2 shows the trends in the marginal after-tax price of donations by region[13] for individuals in the estimation sample. This chart illustrates that Canadians have experienced different marginal after-tax prices of charitable donations over the sample period depending on their province of residence. For example, most Canadians experienced an increase in the after-tax price of donations before 2002, while it remained fairly stable for individuals living in Manitoba and Saskatchewan during the same period. After 2002, the marginal after-tax price remained fairly stable in most provinces, with two notable exceptions: Quebec and Alberta. In 2006, Quebec harmonized with the rest of Canada the threshold above which the higher rate of the provincial tax credit starts to apply by reducing it to $200 from $2,000. This effectively increased the generosity of the provincial tax credit for annual donations between $200 and $2,000. In 2007, Alberta increased the rate of the charitable donation tax credit on donations exceeding $200 to 21% from 12.75%.
For all the years included in the estimation sample, Quebec is the province for which, on average, the marginal after-tax price of a $1 donation is the lowest among Canadian provinces.[14] This reflects the fact that individuals residing in Quebec benefit from the highest charitable donation tax credit rate on the first $200 of donations, which has an impact on the marginal after-tax price of donors giving less than $200 (including non-donors) and one of the highest charitable donation tax credit rates on donations exceeding $200 on a federal-provincial basis.[15] At the opposite end, British Columbia had the highest average marginal after-tax price of charitable donations in recent years. This is mainly due to the relatively low tax credit rate (5%) for donations below the $200 threshold.
Chart 2
Average Marginal After-Tax Price of a $1 Donation, Full Estimation Sample, Average by Region, 1997–2012

Note: The average marginal after-tax price represents the simple average of all observations. Sources: T1 return data; Department of Finance Canada calculations.
Our estimate of the price elasticity of charitable donations relies on these differences in provincial trends to disentangle the impact of changes to tax incentives on charitable donations from other determinants of charitable donations, such as changes in real income. Provincial variation in the marginal after-tax price of a $1 donation is essential to our analysis, given that changes to federal tax incentives generally affect Canadians residing in different provinces in a similar way and are thus difficult to evaluate empirically.
Our model expresses charitable donations as a function of the price of donations and other explanatory variables. Given that it is usually beneficial for married or common-law partners to combine charitable donations and claim them on one tax return in order to benefit from the higher tax credit rate on charitable donations in excess of the $200 threshold, charitable donations from both partners have been combined and divided by 2 to calculate the average charitable donations per adult in the household. Charitable donations are expected to increase with wealth and income, but given that wealth information is missing from our database, income is also used as a proxy for wealth. These income figures are, however, adjusted to account for the fact that households of different sizes may have different needs.[16] We also control for the pro-cyclicality of private donations, and the potential for government contributions to crowd out private donations,[17] by including in our model the provincial unemployment rate and the share of governments' contributions in the total revenues of charities. The model also includes a set of dummy variables to account for regional differences in giving behaviours and yearly shocks that might have affected Canadians living in different provinces similarly.
Estimates of the Price Elasticity of Charitable Donations
The coefficients of this model are estimated using an ordinary least square regression.[18] The coefficient on the price of donations is expected to be negative, meaning that charitable donations are expected to decrease when the price of giving increases. The results from this analysis suggest that Canadians responded significantly to changes in the tax incentives provided for charitable donations between 1997 and 2012. As shown in Table 5, the point estimate of the price elasticity of charitable donations calculated on the full estimation sample is -1.1. In other words, based on this analysis, a 1% reduction in the after-tax price of giving is expected to increase charitable donations by 1.1%.
Table 5 also presents a range of possible estimates based on a 95% confidence interval. This represents the margin of error for which we expect estimates to vary if we were to resample the same population. As such, this interval is an indication of the range within which the true price elasticity for the Canadian population, and not a sample-based estimation of it, should be 95% of the time. This confidence interval, ranging from
-0.7 to -1.5, falls within the lower range of recent estimates on the same subject.
Table 5
Estimates of the Price Elasticity of Charitable Donations
| Estimation Sample | Lower Response | Estimate | Higher Response |
|---|---|---|---|
| Department of Finance Canada (2016)1 | -0.7 | -1.1 | -1.5 |
| Recent studies2 | -0.6 | -1.2 | -2.7 |
| 1 The range of price elasticities for the Department of Finance Canada (2016) reflects the 95% confidence interval. 2 These numbers correspond respectively to the minimum, median and maximum price elasticities presented in Table 3. Source: Department of Finance Canada calculations. |
|||
This study uses econometric techniques on a panel of income tax filers, covering the period from the year 1997 to 2012, to estimate the response of Canadian donors to federal and provincial tax incentives for giving. This response is summarized by the price elasticity of charitable donations, which represents the percentage change in charitable donations resulting from a 1% change in the price of giving. Using a sample of about 11 million observations, we estimate an average price elasticity of charitable giving of -1.1.
This result suggests that individuals responded significantly to changes in the tax incentives for charitable donations implemented between 1997 and 2012. However, as discussed in last year's evaluation of the federal Charitable Donation Tax Credit,[19] an overall assessment of the tax-based assistance for charitable donations should factor in additional considerations. For example, a portion of the tax incentives provided for charitable donations likely represents a windfall gain for many donors, since some of these donations would likely occur in the absence of the tax incentives. Other considerations should also be taken into account when evaluating the overall effectiveness of tax incentives for charitable donations, such as the administrative and economic costs associated with administering and collecting tax-based assistance versus funding charities directly.
One should also keep in mind that the estimate presented here represents an average response for various types of donors and charities. Recent estimates, such as those from Hossain and Lamb, indicate that the price elasticity of charitable donations varies greatly according to the type of donation made. For example, their results suggest that donations to religious charities, which represent about a third of the total amount of charitable donations to registered charities,[20] seem to be less responsive to tax incentives relative to other types of charitable donations. Some studies also report price elasticities that vary according to the type of donor.
Therefore, although our analysis addresses limitations from previous studies through the use of a panel of individual tax returns in Canada, other limitations remain. Future work could include estimating different price elasticities for different types of donations or donors or focusing on the extensive growth of charitable donations to better understand how the Government can influence the number of donors instead of the average charitable donations by existing donors.
Sample
The estimation sample includes about 11 million observations. These observations account for about 80% of the total amount of charitable donations found in the original sample received from the Canada Revenue Agency. The analysis is limited to individuals living in a Canadian province (i.e., excluding the territories). It excludes final tax returns for deceased persons, households that never claimed the charitable donation tax credit and individuals who averaged less than $40,000 in adjusted income (in 2012 dollars) over the sample period.
Adjusting Income
For the purpose of this analysis, for couples, average individual income figures were obtained by averaging the income of both spouses or common-law partners. However, these figures have been adjusted to reflect the different needs, but also the economies of scale, associated with living in households of different sizes. For example, households with dependent children have to spend more on basic needs of the family members and thus have less discretionary income to give or spend on non-basic needs. Larger households, however, benefit from the fact that some costs of living, such as housing costs, do not grow proportionally with the number of individuals in a household, leading to economies of scale for such expenditures. In practice, to account for these differences the income figures for married or common-law couples have been divided by the square root of two (1.4), instead of 2 as in the case of charitable donations, if no dependent children were identified by the tax filers. If dependent children were found, the income figures were instead divided by the square root of three (1.7). A relatively similar equivalence scale has been used in recent publications of the Organisation for Economic Co-operation and Development and Statistics Canada.
Empirical Model
The price of giving is endogenously related to charitable giving because larger charitable donations are associated with lower prices (higher credits) given the two-tier structure of the charitable donation tax credits. As a result of this "reverse causation," standard econometric techniques will in general be biased in estimating the causal relationship of interest given the difficulty of disentangling one relationship from the other. Our empirical strategy must therefore be able to distinguish the "reverse causal" relationship between price and donations that is due to the structure of the credit from the causal relationship between donations and the price of charitable donations that is due to people giving more (less) because the price of giving is low (high). This issue is generally addressed in the literature by using instrumental variable methods. Simply stated, these "instruments" are variables that are correlated with the explanatory variable of interest (the price of charitable donations), but do not suffer from the reverse causation that is due to the fact that the explanatory variable of interest is a function of the variable being explained (the amount of charitable donation).
In addition, a large number of individuals report zero charitable donations in any given year, whether because they did not make any donations, they were not taxable, or they are pooling or saving up donations. Also, since charitable donations cannot be negative, the relationship between donations and the other explanatory variables (including the price of donations) is not linear. For example, some non-donors could potentially be induced to donate by lowering the price of giving through an increase in the rate of the charitable donation tax credit. If instead the charitable donation tax credit rate were reduced, such non-donors would not be expected to change their behaviour, because charitable donations cannot be negative. As a result, the impact of a change in the charitable donation tax credit rate is not expected to be linear (i.e., to have a relative impact that is similar) whether this change is an increase in the rate of the tax credit or a decrease.
Our empirical strategy relies on grouping the 11 million observations in the estimation sample into cohorts in order to address the methodological issues identified above. This aggregation has been performed by applying a sequential procedure to create groups of similar size. As a first step, individuals were grouped based on their year of birth and province of residence. Individuals from the Atlantic provinces were then grouped together, as were individuals from Saskatchewan and Manitoba. Some older or younger individuals were also grouped by periods of five years of birth or more to deal with the smaller size of these groups. For example, individuals born on or before 1920 were grouped together within the same region. The resulting data set from the grouping process consists of 3,322 observations.
Deaton (1985) demonstrates that estimation techniques based on the grouping of individual data into cohorts are identical to instrumental variables approaches where the group indicators are used as instruments. The main identifying assumption is that policy changes affecting tax incentives for charitable donations are uncorrelated with unobserved variables that affect individual donations reported on tax returns. This technique also allows us to deal with attrition in the panel and the large number of tax filers reporting no donations every year.
In practice, the model captures the average percentage change in charitable donations caused by a 1% change in the average price of charitable giving. The price of giving is defined as one minus the tax benefits resulting from a one-dollar donation. The tax benefits included in this analysis are the federal and provincial charitable donation tax credits as well as the various capital gains tax exemptions. In addition to the price variable, the model includes a set of control variables to account for differences across cohorts that are correlated with charitable giving such as income, age, marital status, children and geographical location.
The results for various specifications are presented in Table A1. The weighted fixed effects ordinary least square (OLS) regression corresponds to the results presented in Table 5. The "fixed effects" approach allows us to control for unobserved determinants of charitable donations by assuming that this heterogeneity is constant over time. Cohort observations have been weighted based on the average number of individuals in each cohort. Removing the weights from the fixed effects OLS regression does not have a significant impact on the estimated coefficients.
We have also tested a specification where fixed effects were substituted for random effects. In this alternative specification, the cohort averages of all covariates, for example the average amount of donations for a given cohort, were also added to the list of explanatory variables. This allows us to address the potential correlation between covariates and unobserved determinants of charitable donations, which would create a bias in the estimated coefficients of the random effects OLS regression. This correction is, in fact, akin to parametrizing the implicit fixed effects of our basic model. The estimated price elasticity of charitable donations is still significant, but somewhat lower (-0.9) when using this specification. However, the fact that the coefficients estimated for the cohort averages (i.e., the fixed effects) are all significantly different than zero suggests that the fixed effects specification should be preferred.
A pooled OLS regression, which essentially treats the data as being one large cross-section, produced similar coefficients after including the same cohort averages as those in the random effects OLS regression.
Table A1
Detailed Regression Results for the Full Estimation Sample
Dependant variable: log (charitable donations)
| Explanatory Variables | Weighted Fixed Effects OLS | Fixed Effects OLS | Random Effects OLS | Pooled OLS |
|---|---|---|---|---|
| log (price) | -1.08** | -1.11** | -0.90** | -0.96** |
| log (income) | 0.69** | 0.66** | 0.71** | 0.65** |
| age | 0.21** | 0.10** | ||
| separated, divorced or widowed | -2.36** | -2.59** | -1.89** | -2.12** |
| dependent children | 0.93** | 0.97** | 0.92** | 0.94** |
| log (unemployment rate) | -0.01 | -0.01 | -0.05* | -0.02 |
| log (gov. funding) | -0.33** | -0.36** | -0.27** | -0.34** |
| year dummies | Yes | Yes | Yes | Yes |
| provincial dummies | No | No | Yes | Yes |
| cohort averages of covariates | No | No | Yes | Yes |
Adena, Maja (2014). "Tax-Price Elasticity of Charitable Donations: Evidence From the German Taxpayer Panel", WZB Discussion Paper, No. SP II 2014-302.
Bakija, Jon and Bradley T. Heim (2011). "How Does Charitable Giving Respond to Incentives and Income? New Estimates From Panel Data", National Tax Journal, vol. 64 (2, Part 2), pp. 615-650.
Bönke, Timm, Nima Massarrat-Mashhadi and Christian Sielaff (2013). "Charitable Giving in the German Welfare State: Fiscal Incentives and Crowding Out", Public Choice, vol. 154, pp. 39-58.
Brooks, Arthur C. (2007). "Income Tax Policy and Charitable Giving", Journal of Policy Analysis and Management, vol. 26 (3), pp. 599-612.
Deaton, Angus S. (1985). "Panel Data From Time Series of Cross-Sections", Journal of Econometrics, 30, pp. 109–126.
Department of Finance Canada (2015). "Evaluation of the Federal Charitable Donation Tax Credit", Tax Expenditures and Evaluations—2014.
Fack, Gabrielle and Camille Landais (2010). "Are Tax Incentives for Charitable Giving Efficient? Evidence From France", American Economic Journal: Economic Policy, vol. 2 (2), pp. 117-141.
Hossain, Belayet and Laura Lamb (2012). "Price Elasticities of Charitable Giving Across Donation Sectors in Canada: Is the Tax Incentive Effective?", ISRN Economics, vol. 2012, Article ID 421789.
Moffit, Robert (1993). "Identification and Estimation of Dynamic Models With a Time Series of Repeated Cross-Sections", Journal of Econometrics, 59, pp. 99-124.
Mundlak, Yair (1978). "On the Pooling of Time Series and Cross Section Data", Econometrica, vol. 46, No. 1 (January 1978), pp. 69-85.
* The empirical analysis was prepared by Yves Poirier, Senior Economist, Tax Policy Branch, Department of Finance Canada. Enquiries regarding Department of Finance Canada publications can be sent to finpub@canada.ca. We would like to thank Professor Philip Merrigan for his helpful comments and suggestions.
1 References to provinces in this text also include territories unless explicitly stated.
2 The after-tax price of giving is usually defined as one minus the tax assistance on a one-dollar donation. For example, the after-tax price of giving is 0.75 in presence of a 25% charitable donation tax credit.
3 The 2013 federal budget introduced the temporary First-Time Donor's Super Credit. This credit supplements the federal charitable donation tax credit with an additional 25% tax credit for a first-time donor on up to $1,000 of donations. Also, on December 7, 2015, the Government proposed to amend the federal charitable donation tax credit to allow higher-income donors to claim a 33% tax credit on the portion of donations in excess of $200 that is subject to the new 33% marginal tax rate.
4 Some provinces apply rates that differ from either the lowest or highest marginal income tax rates for donations below or above the $200 threshold. For example, Alberta's income tax credit on charitable donations above the $200 threshold has been 21% since 2007, instead of the top marginal income tax rate of 10%. Also, the provincial income tax credit in Quebec was calculated using a higher provincial threshold (for the higher credit rate) of $2,000 instead of $200 prior to 2006.
5 The carry-forward period for donations of ecologically sensitive land was extended to ten years in the 2014 federal budget.
6 Cultural property donations have been exempt from capital gains taxation since 1979.
7 A comprehensive review of the literature on the price elasticity of charitable donations was presented in the 2014 edition of this report. This section only presents a brief review of the recent literature on the subject.
8 The intensive growth of charitable donations (i.e., the growth in average donations) is mainly affected by marginal variations in the price of charitable donations. An analysis of the extensive growth (i.e., the growth in the number of donors) would likely focus on average prices instead. Although our estimation strategy does not differentiate between the intensive and the extensive growth, the focus on marginal prices is largely motivated by the trend observed in Chart 1, where the growth in charitable donations over time has mainly been driven by an increase in average donations.
9 See the section "Adjusting Income" in the annex for more details about how income figures have been adjusted for the purpose of this analysis.
10 See the annex for the list of filters applied to the original sample.
11 The median donation among donors in the sample is $255 with a standard deviation of about $30,000.
12 A dummy variable takes the value of 1 if the filer belongs to a certain category (for example, if the tax filer is a widow) and 0 otherwise. As such, the reported average for these variables represents the share of tax filers belonging to a certain category. Standard deviations are not reported for dummy variables given the less intuitive interpretation of such statistics.
13 These are the regions used in the regression analysis to follow.
14 The average marginal after-tax prices presented for Quebec have been adjusted to reflect the 16.5% Quebec Abatement.
15 The federal-provincial charitable donation tax credit rate on donations exceeding $200 is about 48% in Quebec once the 16.5% Quebec Abatement is taken into account. Individuals in Alberta and Nova Scotia benefit from the highest charitable donation tax credit rate on donations exceeding $200 with a combined federal-provincial tax rate of 50%.
16 See the section "Adjusting Income" in the annex for more details about how income figures have been adjusted for the purpose of this analysis.
17 Government contributions will crowd out private donations if, for example, individuals tend to reduce their charitable donations when there is an increase in government contributions to charities.
18 See the annex for more details on the methodological issues that guided the choice of the empirical model used in this analysis.
19 See Section 4 of Department of Finance Canada (2015).
20 See Chart 6 of Department of Finance Canada (2015).