
Archived - Report on Federal Tax Expenditures - Concepts, Estimates and Evaluations 2017: part 8
The main purpose of tax systems is to raise the revenues required by governments to finance their spending. However, tax systems also often serve as tools to achieve other social and economic policy objectives through the use of targeted tax preferences such as tax exemptions, deductions or credits. These measures are referred to as “tax expenditures” because they are used to achieve policy objectives that deviate from the core function of the tax system, at the cost of lower tax revenues. Tax expenditures also comprise structural tax concessions that serve objectives that are internal to tax systems, such as reducing administration and compliance costs or recognizing non-discretionary expenses.
There were 182 tax expenditures in 2015 in relation to the federal income tax (personal and corporate) and the Goods and Services Tax (GST), and the combined value of these measures was estimated at $117.9 billion or 52% of the revenues from these taxes.
This paper provides a statistical profile of federal tax expenditures using historical data to examine trends in tax expenditures from 1991 to 2015. Following some methodological information, this paper presents information on trends in the number and value of tax expenditures by tax base and objective, and compares tax expenditures to direct government spending. This paper concludes with a high-level examination of the distributional effects of personal income tax expenditures.
Salient points from the analysis include:
- Personal income tax expenditures dominate in number and value, accounting for 71% of the total value of tax expenditures in 2015, compared with 16% for corporate income tax expenditures and 13% for GST expenditures.
- The number of tax expenditures rose from 145 in 1991 to 182 in 2015, for a net increase of 37 measures. Personal income tax expenditures account for 65% of the net increase in the number of tax expenditures over that period.
- The total value of tax expenditures grew by 74% or $50.1 billion between 1991 and 2015 (after adjusting for inflation), equivalent to 2.3% annual growth on average. Over the same period, average annual real gross domestic product (GDP) growth was 2.4%.
- Tax expenditures were equivalent to 52% of tax revenues in both 1991 and 2015.
- The value of tax expenditures is concentrated in a small number of measures, the value of which varies with financial and housing markets. For instance, the 15 largest measures still in effect in 2016 accounted for 77% of the total value in 2015.
- Tax expenditures reduce average tax rates through most of the income distribution relative to the benchmark tax rates, and the relative impact of tax expenditures on average tax rates appears to be greater at the bottom. This means that tax expenditures effectively increase the progressivity of the federal personal income tax system. The decline in average tax rates due to tax expenditures is also relatively large at the very top end of the income distribution, partly offsetting the higher average tax rates for taxpayers in this income group.
This section outlines key methodological concepts employed in this paper. Part 1 of this report provides extensive methodological information about tax expenditures and the calculation of their fiscal cost and should be referenced for more detailed information.
For the present analysis—as for this report as a whole—tax expenditures are defined as any departure from the “benchmark” tax structure, which is characterized by only the most fundamental aspects of the tax system. As a result, some tax measures that may not be considered tax preferences are counted as tax expenditures and included in this analysis, notably structural tax measures that pursue objectives that are internal to the tax system.
The estimates of the values of individual tax expenditures used to conduct the present analysis are taken from the current and past editions of this report.[2] The year 1991 was chosen as the first year for analysis as it marks the introduction of the GST, as well as the full implementation of the tax reforms undertaken in 1987.
A number of methodological caveats apply in interpreting the present analysis:
- Aggregate values presented in this paper should be interpreted with caution. The value of each tax expenditure is measured by estimating the revenue that the federal government forgoes as a result of that measure. This is done independently for each measure, assuming that all other tax provisions remain unchanged. As a result, aggregating the value of tax expenditures may provide a biased estimate of the total cost of tax expenditures, as tax expenditures interact with one another and the income tax rate structure is progressive.[3] To minimize possible estimation biases, the value of GST rebates has been removed from the calculations (but no rebates have been removed from the count of tax expenditures); however, no similar adjustments were made for personal and corporate income tax expenditures. Additional analysis not presented in this report suggests that the fiscal cost of personal income tax expenditures, when estimated jointly, is slightly larger than the sum of individual estimates.
- Multiple changes to the estimation methodology occurred over the period of analysis. Amounts for earlier years have not been re-estimated using the current methodology; as such, methodological changes may account for some of the fluctuation in aggregate value over time.
- As they are estimates of forgone revenues, values of tax expenditures are also affected by changes to the benchmark tax rates, a number of which occurred over the period of analysis. Most notably, the reductions in the general corporate income tax rate (from 28.8% including the surtax in 1991 to 15% in 2012), the GST rate (from 7% in 2006 to 5% in 2008) and personal income tax rates (the introduction of a 26% bracket in 2001 and the lowering of the bottom rate from 17% in 2000 to 15% in 2007) have caused estimates to be lower than they otherwise would have been.
- Estimates are missing for a number of tax expenditures due to a lack of data to support a meaningful estimate or projection. Estimates for measures that have an estimated value of less than $500,000 in a given year also cannot be aggregated, as they are not shown in the report. The value of these measures is thus effectively excluded from the analysis.
- The Canada Child Benefit and its predecessors, the Canada Child Tax Benefit and the refundable Child Tax Credit, are also excluded from the analysis as they are considered to be transfer payments implemented through the tax system.
All values presented in this paper have been adjusted for inflation and are in 2015 dollars. When numbers and values of tax expenditures are reported by tax base, income tax expenditures available to both individuals and corporations have been allocated based on the taxpayer group most likely to use the tax expenditures.
Finally, care should be taken in interpreting the analysis as the revenue gain from eliminating a tax expenditure may not correspond to the estimated value of the tax expenditure, among other reasons because behavioural responses and potential consequential policy changes are not incorporated into the tax expenditure estimates. Differences between estimated values and potential revenue gains are likely to be more important when considering all or large subgroups of tax expenditures, since the likelihood of significant behavioural responses and consequential policy changes should be greater in a scenario where a large number of tax expenditures would be eliminated at once.
3.1 Number and Value, Current and Change Since 1991
There were 182 tax expenditures in force in 2015, 85 of which related to personal income tax, 61 to corporate income tax and 36 to the GST (Chart 1). The estimated value of tax expenditures totalled $117.9 billion in 2015, with measures relating to personal income tax expenditures accounting for 71% of the total, corporate income tax expenditures comprising 16%, and GST expenditures making up 13%.
Chart 1
Value and Number of Tax Expenditures by Tax Base, 2015


There was a net increase of 37 tax expenditures between 1991 and 2015, from 145 to 182.[4] As shown in Chart 2, this growth is primarily due to a rise in measures related to personal income tax, with 24 net measures added; corporate income tax and GST measures accounted for 8 and 5 net additional measures, respectively. Few new tax expenditures were introduced in the 1990s until budget balance was achieved in 1997, and five new measures were added in that year. The number of measures rose slowly in subsequent years, until 12 net new measures were added in 2006 and 2007, primarily in the personal income tax base.
Number of Tax Expenditures by Tax Base, 1991-2015
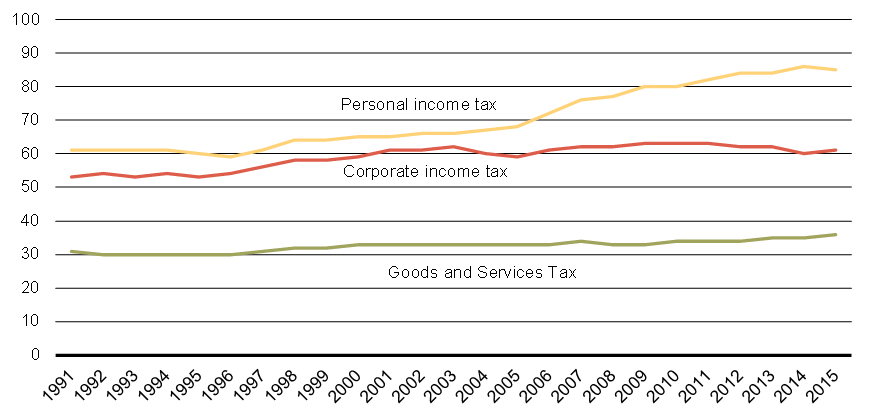
Chart 3 depicts the value of tax expenditures by tax base since 1991. The total value of tax expenditures grew by 74% or $50.1 billion over the period (adjusting for inflation), from $67.9 billion in 1991 to $117.9 billion in 2015. This corresponds to average growth of 2.3% per year, compared to average annual real GDP growth of 2.4% over the same period.
As demonstrated by Chart 3, while the total value of tax expenditures has been quite volatile over time, most of the variation is accounted for by a few large measures whose value varies with financial and housing markets. Among these measures, Registered Pension Plans (RPPs) and Registered Retirement Savings Plans (RRSPs) have dominated the value of tax expenditures over the period, contributing a combined 30% on average of the total value of tax expenditures for years between 1991 and 2015. The value of each of these two measures is comprised of three parts: the deduction for contributions from taxable income; the non-taxation of investment income earned as it accrues in the plan; and the taxation of withdrawals. The increase in value is primarily due to significant growth in the value of non-taxation of investment income. Investment income is closely tied to stock market performance, which has been strong over the period as a whole, with the Toronto Stock Exchange Composite Index increasing by 169% between 1991 and 2015 after adjusting for inflation. Stock market fluctuations can also help to explain the large decrease in the value of RPP and RRSP tax expenditures in 2001 and continuing into 2002, when markets dropped sharply following the September 11, 2001 attacks and further declined in 2002. More fundamentally, the growth in investment income since 1991 also reflects the gradual maturing of the RPP/RRSP system and the associated accumulation of assets within these retirement savings vehicles. Another factor that has contributed to the growth in the RPP/RRSP tax expenditure over this period has been the substantial increase in employer RPP contributions from 2003 to 2015 due to a combination of lower interest rates (which increased pension liabilities) and market shocks (which reduced assets). These factors resulted in substantially higher employer current service contributions and solvency deficiency payments over this period compared to the 1991 to 2002 period.
The partial inclusion of capital gains for both individuals and corporations has also grown in value and relative importance. Like RPPs and RRSPs, the value of this measure is linked to stock market performance, which explains part of the increase. Another contributing factor to the measure’s rise in value was the reduction of the capital gains inclusion rate in 2000 from three-quarters to one-half.
The non-taxation of capital gains on principal residences, the fourth largest expenditure in 2015, has grown in value to $6.2 billion in 2015, reflecting a significant increase in housing prices and wealth in recent years.[5]
The Lifetime Capital Gains Exemption was tightened in 1994, which led to a significant spike in the value of the measure for that year.[6] In recent years, the value of the Lifetime Capital Gains Exemption has increased.
Chart 3
Value of Tax Expenditures by Tax Base, 1991-2015

3.2 Value as a Share of Tax Revenues and GDP
While tax expenditures grew significantly in real value between 1991 and 2015, their value as a share of tax revenues and as a share of GDP changed little over the period (Chart 4).[7] Indeed, tax expenditure growth has only slightly outpaced tax revenue growth since 1991, and as a result tax expenditures represented about half of tax revenues (52%) in both 1991 and 2015. There was, however, significant variation in these ratios during the period. Both ratios declined sharply in the 1990s and early 2000s, reflecting a significant drop in tax expenditures and continued, albeit slower, growth in GDP and tax revenues. This trend reversed in 2001, and these ratios have followed an upward trend since, apart from a drop during the recent financial crisis. Since 2008, tax revenues have grown by 11% while tax expenditures increased 40%. By tax base, tax expenditures as a share of tax revenues in 2015 was highest for personal income tax expenditures, at 58% of personal income tax revenues, followed by GST expenditures, at 46% of GST revenues. Corporate income tax expenditures were equivalent to 39% of corporate income tax revenues.
Because the measures discussed above whose value varies with financial and housing markets drive large variations in the total value of tax expenditures, Chart 4 also displays tax expenditures as a share of GDP and of tax revenues excluding these measures. With volatile measures excluded, the ratio of tax expenditures to tax revenues fell between 1991 and 2003, as growth in value of tax expenditures was relatively constant and tax revenues grew more quickly. In 2006 and 2007 the ratio grew, driven by the introduction of large new measures including the Canada Employment Credit in 2006 and the Child Tax Credit in 2007 (which was eliminated as of 2015), and the rising value of existing tax expenditures. Since 2007 the observed variations in the ratio of tax expenditures to tax revenues are mainly driven by changes in tax revenues, including the spike in 2008 and 2009 which is attributable to the sharp reduction in tax revenues as a result of the financial crisis and the subsequent economic downturn. The ratio of tax expenditures to GDP with volatile measures excluded followed a similar pattern: growth is observed from 2003 to 2007 as tax expenditures increased in value, but the ratio then fell in 2008 and increased in 2009 due to the recession at that time.
Chart 4
Tax Expenditures as a Share of Tax Revenues and GDP, 1991-2015

3.3 Largest Tax Expenditures
Table 1 presents the 15 largest tax expenditures in effect in 2016, based on their value in 2015. The ranking is dominated by the measures discussed above whose value varies with financial and housing markets—RPPs, RRSPs, partial inclusion of capital gains and non-taxation of capital gains on principal residences. For the most part, the largest tax expenditures are longstanding features of the federal tax system.
The 15 largest measures comprised 77% of the total value of tax expenditures. The fact that a large portion of the total value of tax expenditures can be attributed to a handful of measures has been a constant since 1991.
Table 1
Largest Tax Expenditures in Effect in 2016, by Value in 2015
| Measure | Value (2015 $ billion) |
Base | |
|---|---|---|---|
| 1 | Registered Pension Plans | 24.0 | PIT |
| 2 | Registered Retirement Savings Plans | 15.6 | PIT |
| 3 | Partial inclusion of capital gains | 11.6 | PIT/CIT |
| 4 | Non-taxation of capital gains on principal residences | 6.2 | PIT |
| 5 | Exemptions from non-resident withholding tax | 5.2 | CIT |
| 6 | Goods and Services Tax/Harmonized Sales Tax Credit | 4.3 | GST |
| 7 | Zero-rating of basic groceries | 4.1 | GST |
| 8 | Preferential tax rate for small businesses | 3.3 | CIT |
| 9 | Age Credit | 3.1 | PIT |
| 10 | Charitable Donation Tax Credit | 2.7 | PIT |
| 11 | Non-taxation of benefits from private health and dental plans | 2.7 | PIT |
| 12 | Scientific Research and Experimental Development Investment Tax Credit | 2.6 | PIT/CIT |
| 13 | Canada Employment Credit | 2.2 | PIT |
| 14 | Exemption from GST for certain residential rent | 1.8 | GST |
| 15 | Spouse or Common-Law Partner Credit | 1.5 | PIT |
| 15 largest measures—subtotal | 91.0 | ||
| Total value of all measures | 117.9 | ||
| 15 largest measures as share of total | 77% | ||
3.4 Number and Value by Objective
Table 2 classifies measures by their objective. Many different objectives are pursued by structural measures, reflecting the complexity of implementing a tax system that aims to be simultaneously efficient, neutral, simple and fair. While non-structural measures pursue a wide variety of policy objectives, the majority of the value of tax expenditures in 2015 was concentrated in three non-structural objectives—encouraging savings, achieving a social objective, and encouraging or attracting investment—which together accounted for 75% of the total value of tax expenditures.
Tax expenditures intended to encourage savings, primarily tax assistance provided on savings in RPPs, RRSPs and Tax-Free Savings Accounts, comprised $40.5 billion or 34% of the total value of tax expenditures in 2015. Growth in the value of these measures reflects the increasing share of capital income that is exempt from taxation, including because of the gradual accumulation of contribution room in Tax-Free Savings Accounts as the program matures.
Measures intended to achieve a social objective comprised $23.5 billion or 20% of the value of tax expenditures in 2015. Several of the largest tax expenditures in Table 1 fall under this category, including the Charitable Donation Tax Credit, the non-taxation of benefits from private health and dental plans, and the non-taxation of capital gains on principal residences.
Tax expenditures designed to encourage or attract investment doubled in value between 1991 and 2015, rising from 17% to 21% of the total value of tax expenditures. This growth was primarily due to the rising values of the partial inclusion of capital gains and the Scientific Research and Experimental Development Investment Tax Credit.
Table 2
Tax Expenditures by Objective
| Objective | Number in 2015 | Change in number, 1991–2015 | Value in 2015 | Change in value,1991–2015 | |||
|---|---|---|---|---|---|---|---|
|
|
|
||||||
| $ billion | Share of total (%) | $ billion | % | % point change in share of total, 1991–2015 | |||
| Non-Structural Objectives | 124 | 25 | 100.0 | 84.8 | 43.5 | 77 | 1.5 |
| To encourage savings | 8 | 2 | 40.5 | 34.3 | 17.7 | 78 | 0.8 |
| To achieve a social objective | 53 | 17 | 23.5 | 20.0 | 8.7 | 59 | -1.9 |
| To encourage or attract investment | 24 | 0 | 24.6 | 20.9 | 12.8 | 109 | 3.5 |
| To provide income support or tax relief | 13 | 4 | 8.5 | 7.2 | 3.4 | 67 | -0.3 |
| To encourage employment | 7 | 3 | 1.6 | 1.3 | -0.1 | -7 | -1.2 |
| To achieve an economic objective—other | 8 | 0 | 0.8 | 0.7 | 0.9 | n/a | 0.7 |
| Other | 10 | -1 | 0.5 | 0.4 | 0.1 | 34 | -0.1 |
| Structural Objectives | 58 | 12 | 17.9 | 15.2 | 6.5 | 58 | -1.5 |
| To recognize non-discretionary expenses (ability to pay) | 9 | 3 | 4.9 | 4.2 | 1.1 | 28 | -1.5 |
| To recognize expenses incurred to earn employment income | 11 | 3 | 5.7 | 4.8 | 3.8 | 195 | 2.0 |
| To reduce administration or compliance costs | 12 | -1 | 0.7 | 0.6 | -0.9 | -57 | -1.8 |
| To provide relief for special circumstances | 13 | 3 | 0.1 | 0.1 | 0.0 | 6 | -0.1 |
| Other | 9 | -1 | 6.4 | 5.5 | 2.6 | 68 | -0.2 |
| Total | 182 | 37 | 117.9 | 100.0 | 50.1 | 74 | |
Note: Some tax expenditures pursue multiple objectives. In this analysis, measures have been classified based on the primary objective they are intended to pursue. For example, the partial inclusion of capital gains is intended to encourage both investment and savings but is classified as intending to encourage investment. |
|||||||
3.5 Comparison With Direct Government Spending
Non-structural tax expenditures, which are designed to achieve policy objectives outside the tax system, can at times be an alternative to direct government spending. The Canadian Classification of Functions of Government (CCOFOG) maintained by Statistics Canada categorizes spending by intended purpose. Examining both non-structural tax expenditures and direct spending according to this classification provides insight into the policy areas that are more frequently targeted through the tax system relative to direct spending.
Chart 5 shows non-structural tax expenditures and federal government expenses grouped by category for four of the largest valuations for 2014, the most recent year for which government spending CCOFOG data is available. Expenses related to general public services are omitted from direct spending as the majority of this expenditure is comprised of services that could not be delivered through the tax system, such as executive and legislative responsibilities, public administration and public debt financing.
Non-structural tax expenditures were valued at about $100 billion in 2014, equivalent to over half of the total $185 billion in direct spending by the federal government in that year.
Chart 5
Tax Expenditures and Direct Spending by CCOFOG Classification, 2014

The largest share of non-structural tax expenditures is for measures related to social protection, which includes funds directed toward families and children, old age, sickness and disability, and unemployment. Large tax expenditures in this category are those related to retirement, including RPPs, RRSPs and pension income splitting, the Age Credit, and family-related measures including the Child Tax Credit. A much larger share of tax expenditures than direct spending relates to economic affairs; many of these measures relate to modifying tax rates to affect investment and business incentives. The share of tax expenditures relating to housing and community amenities primarily consists of the non-taxation of capital gains on principal residences, and exemptions from GST for residential rents and new housing and residential rental property. Tax expenditures related to health include the non-taxation of benefits from private health and dental plans and the Medical Expense Tax Credit.
This section provides an overview of the broad incidence of personal income tax expenditures. In contrast to the analysis presented in prior sections, the analysis in this section relies on the joint estimation of the combined value of selected personal income tax expenditures, using the Department of Finance’s T1 micro-simulation model (see Part 1 of this report for additional details on this model). Personal income tax expenditures accounted for in this section include those that are indicated in Part 3 of this report as being estimated using the T1 model. A number of measures pertaining to savings and housing, including RPPs, RRSPs, Tax-Free Savings Accounts, Registered Education Savings Plans, Registered Disability Savings Plans and the non-taxation of capital gains on principal residences, are not included in the T1 model, and thus are not covered by the analysis in this section.[8] This is a significant limitation, given that these measures account for a sizeable share of the total value of personal income tax expenditures. Corporate income tax and GST expenditures are also not taken into account.
To provide a general sense of the incidence of personal income tax expenditures, Chart 6 compares actual average personal income tax rates for 2016 (bold line) to average tax rates under the hypothetical scenario under which tax expenditures that are estimated in the T1 model are eliminated (dashed line). The gap in Chart 6 between the two lines reflects the impact of tax expenditures on average tax rates. Because the classification of any particular measure as a tax expenditure or benchmark measure can be a matter of debate, and not all measures classified as tax expenditures are reflected in Chart 6 (only those the impact of which can be modelled using the T1 model), the true gap could be somewhat different than the one illustrated here.
As can be seen in Chart 6, while tax expenditures reduce average tax rates through most of the income distribution relative to the benchmark tax rates (dashed line versus bold line), the relative impact of tax expenditures on average tax rates is greater for the bottom half of the distribution, which means that tax expenditures effectively increase the progressivity of the federal personal income tax system.[9] This can be seen by the proportion of the area between the two lines, which is more significant at the lower end of the income distribution. The decline in average tax rates due to tax expenditures is also relatively large at the very top end of the income distribution, but this only partly offsets the higher average tax rates that are observed for individuals in the top 10% of the income distribution.[10]
Chart 6
Average Federal Personal Income Tax Rates, 2016 (projections)

Chart 7 shows the cumulative tax savings (projected to 2017) from selected large tax expenditures that predominantly benefit low- and middle-income filers. These measures include credits and deductions that are widely claimed and are capped or income-tested at a relatively modest level, such as the Age Credit and the Canada Employment Credit. In the case of the Child Care Expense Deduction, the deduction must be claimed by the lower-income partner in a couple, while more than half of the claims and about a third of the benefits from the Medical Expense Tax Credit accrue to those aged 65 and over, who on average have modest incomes.
Chart 7
Cumulative Share of Tax Benefits, Selected Tax Expenditures, 2017 (projections)

Tax expenditures deliver targeted benefits to individuals and corporations through reductions in tax liability, serving to further social and economic policy objectives. Tax expenditures also comprise structural tax concessions that serve objectives that are internal to the tax system. While these tax measures grew in number and value between 1991 and 2015, their value as a share of tax revenues and GDP was similar in 1991 and 2015. Non-structural measures, which pursue objectives outside the tax system, represented about 85% of the value of tax expenditures in 2015, a similar share as in 1991. The value of non-structural measures in 2015, and hence the total value of tax expenditures, was dominated by a small number of measures related to retirement, saving and investment. Tax expenditures reduce average tax rates through most of the income distribution relative to the benchmark tax rates, and the relative impact of tax expenditures on average tax rates appears to be greater at the bottom, which means that tax expenditures effectively increase the progressivity of the federal personal income tax system. The decline in average tax rates due to tax expenditures is also relatively large at the very top end of the income distribution, partly offsetting the higher average tax rates for taxpayers in this income group.
Table A1
Measures Introduced and Repealed, 1991–2016 1
| Year | Began/ceased to be in force | Tax expenditure | Tax base |
|---|---|---|---|
| 1991 | Began | Tax treatment of farm savings accounts (AgriInvest and Agri-Québec) | CIT |
| Deductibility of expenses by employed artists | PIT | ||
| Ceased | Federal Sales Tax Credit | PIT | |
| 1992 | Began | Small Business Investment Tax Credit | CIT |
| Interest on small business financing loans | CIT | ||
| Reclassification of expenses under flow-through shares | CIT/PIT | ||
| Ceased | Exploration Tax Credit | CIT | |
| Deductibility of carrying charges on land | CIT | ||
| Small Business Transitional Credit | GST | ||
| 1993 | Ceased | Cape Breton Investment Tax Credit | CIT |
| 1994 | Began | Surtax on the profits of tobacco manufacturers | CIT |
| Deductibility of contributions to a qualifying environmental trust | CIT/PIT | ||
| Ceased | Small Business Investment Tax Credit | CIT | |
| 1995 | Began | Canadian Film or Video Production Tax Credit | CIT |
| Ceased | Interest on small business financing loans | CIT | |
| Special Investment Tax Credit | CIT | ||
| Non-taxation of employer-paid premiums for group term life insurance of up to $25,000 |
PIT | ||
| 1996 | Began | Accelerated deductibility of Canadian Renewable and Conservation Expenses | CIT/PIT |
| Rebate for book purchases made by certain organizations | GST | ||
| Ceased | Special credit for certified institutions | GST | |
| Flow-through of capital cost allowance on Canadian films | PIT | ||
| 1997 | Began | Non-taxation of capital gains on donations of publicly listed securities | CIT/PIT |
| Film or Video Production Services Tax Credit | CIT | ||
| Refunds for Aboriginal self-governments | GST | ||
| Refundable Medical Expense Supplement | PIT | ||
| Deduction for tuition assistance for adult basic education | PIT | ||
| 1998 | Began | Deductibility of countervailing and anti-dumping duties when paid | CIT/PIT |
| Deductibility of earthquake reserves | CIT | ||
| Rebate for specially equipped motor vehicles | GST | ||
| Supplementary Low-Income Credit | PIT | ||
| Caregiver Credit | PIT | ||
| Student Loan Interest Credit | PIT | ||
| 2000 | Began | Non-taxation of capital gains on donations of ecologically sensitive land | CIT/PIT |
| Rebate for new residential rental property | GST | ||
| Mineral Exploration Tax Credit for flow-through share investors | PIT | ||
| Rollovers of investments in small businesses | PIT | ||
| Ceased | Supplementary Low-Income Credit | PIT | |
| 2001 | Began | Low tax rate on general income of small businesses between $200,000 and $300,000 |
CIT |
| Tax rate on resource income | CIT | ||
| 2002 | Began | Apprentice vehicle mechanics’ tools deduction | PIT |
| 2003 | Began | Corporate Mineral Exploration and Development Tax Credit | CIT |
| 2004 | Began | Non-taxation of income earned by military and police deployed to international high- and moderate-risk operational missions | PIT |
| Ceased | Manufacturing and processing allowance | CIT | |
| Non-resident-owned investment corporation refund | CIT | ||
| 2005 | Began | Adoption Expense Tax Credit | PIT |
| Ceased | Low tax rate on general income of small businesses between $200,000 and $300,000 |
CIT | |
| 2006 | Began | Apprenticeship Job Creation Tax Credit | CIT |
| Patronage dividends paid as shares by agricultural cooperatives | CIT/PIT | ||
| Public Transit Tax Credit | PIT | ||
| Textbook Tax Credit | PIT | ||
| Canada Employment Credit | PIT | ||
| Deduction for tradespeople’s tool expenses | PIT | ||
| 2007 | Began | Additional deduction for gifts of medicine | CIT |
| Investment Tax Credit for Child Care Spaces | CIT | ||
| Accelerated capital cost allowance for manufacturing or processing machinery and equipment | CIT/PIT | ||
| Foreign Convention and Tour Incentive Program | GST | ||
| Child Tax Credit | PIT | ||
| Children’s Fitness Tax Credit | PIT | ||
| Pension income splitting | PIT | ||
| Working Income Tax Benefit | PIT | ||
| Ceased | Tax rate on resource income | CIT | |
| Deductibility of royalties paid to Indian bands | CIT | ||
| 2008 | Began | Registered Disability Savings Plans | PIT |
| Ceased | Rebate for foreign visitors | GST | |
| 2009 | Began | Accelerated capital cost allowance for computer equipment | CIT/PIT |
| Home Renovation Tax Credit | PIT | ||
| First-Time Home Buyers’ Tax Credit | PIT | ||
| Tax-Free Savings Account | PIT | ||
| 2010 | Began | Rebate for poppies and wreaths | GST |
| Inclusion of the Universal Child Care Benefit in the income of an eligible dependant | PIT | ||
| Ceased | Home Renovation Tax Credit | PIT | |
| 2011 | Began | Children’s Arts Tax Credit | PIT |
| Volunteer Firefighters Tax Credit | PIT | ||
| 2012 | Began | Family Caregiver Tax Credit | PIT |
| Pooled Registered Pension Plans | PIT | ||
| Ceased | Accelerated capital cost allowance for computer equipment | CIT/PIT | |
| 2013 | Began | Exemption for hospital parking | GST |
| First-Time Donor’s Super Credit | PIT | ||
| Ceased | Non-taxation of income from the Office of the Governor General of Canada |
PIT | |
| 2014 | Began | Family Tax Cut | PIT |
| Search and Rescue Volunteers Tax Credit | PIT | ||
| Ceased | Expensing of purchases of capital equipment used for scientific research and experimental development |
CIT/PIT | |
| Exemption from tax for international banking centres | CIT | ||
| 2015 | Began | Accelerated capital cost allowance for liquefied natural gas facilities | CIT/PIT |
| Zero-rating of feminine hygiene products | GST | ||
| Ceased | Child Tax Credit | PIT | |
| 2016 | Began | Teacher and Early Childhood Educator School Supply Tax Credit | PIT |
| Home Accessibility Tax Credit | PIT | ||
| Ceased | Corporate Mineral Exploration and Development Tax Credit | CIT | |
| Family Tax Cut | PIT | ||
| Overseas Employment Tax Credit | PIT |
1 The analysis presented in this paper was prepared by Rachel Lott, Economist, Tax Policy Branch, Department of Finance Canada. Enquiries regarding Department of Finance Canada publications can be sent to fin.financepublic-financepublique.fin@canada.ca.
2 Previous editions are available at www.fin.gc.ca.
3 See the subsection entitled “Independent Estimates and Projections” in Part 1 of this report for a detailed explanation.
4 See the Annex for a list of all tax expenditures introduced and repealed between 1991 and 2016.
5 Statistics Canada’s New Housing Price Index, which measures changes in contractors’ selling prices of new residential houses, rose 71% between 1991 and 2015. See Statistics Canada (2016), Table 327-0046 – New housing price index, annual, CANSIM database.
6 Budget 1994 eliminated the $100,000 Lifetime Capital Gains Exemption that was available for gains other than gains on small business shares and farming and fishing properties. The elimination was effective as of February 23, 1994, but individuals could claim the exemption for gains that had accrued up to that date on their 1994 tax return.
7 Tax revenues include revenues from the federal personal income tax, corporate income tax, GST and non-resident income tax, with revenues from the latter tax being assigned to the corporate income tax.
8 The analysis of the incidence of these tax expenditures is challenging, mainly because the benefits from these regimes should in principle be measured over a multi-year period and the data needed to perform such an analysis is not readily available.
9 The fact that eliminating tax expenditures would decrease average tax rates for individuals in the bottom two income deciles is attributable to pension income splitting. As it is modelled here, pension income splitting increases the average tax rates of the lower-income spouses to which pension income is transferred. Ideally, the impact of pension income splitting would have to be modelled on a couple basis, as the tax savings from pension income splitting accrue at the level of the couple.
10 Care should be taken in interpreting distributional information on tax expenditures. The pattern of incidence of specific or groups of tax expenditures may depend in part on the concept of income that is used in the analysis. In particular, income is defined here to include capital gains. Capital gains may be a regular source of income for some individuals (e.g., seniors living on investment income), but capital gains are also often realized upon one-time events such as the sale or transfer of a business. Capital gains can thus be “lumpy”, and classifying individuals on the basis of their income inclusive of capital gains may result in individuals being classified as high-income earners that would otherwise be classified as low- or middle-income earners, only because of some large one-time capital gains. This explains in part why some tax expenditures (e.g., Lifetime Capital Gains Exemption, partial inclusion of capital gains) can be described as predominantly benefiting high-income filers.