
Report on Federal Tax Expenditures - Concepts, Estimates and Evaluations 2019: part 9
In recent years, gender-related considerations have been incorporated in the development of new federal tax policies through the use of Gender-based Analysis Plus (GBA+). GBA+ is an analytical tool that helps assess whether proposed policies are likely to have differential impacts on different groups. The "plus" in GBA+ indicates the need to consider identity factors that go beyond biological differences (sex), such as race, ethnicity, age, the presence of a disability or sexual orientation. In order to further advance its priorities for gender equality and strengthen the use of GBA+ in the policy development and decision-making processes, the Government presented in Budget 2018 a Gender Results Framework. This framework identifies six main areas for progress: 1) education and skills development; 2) economic participation and prosperity; 3) leadership and democratic participation; 4) gender-based violence and access to justice; 5) poverty reduction, health and well-being; and 6) gender equality around the world. In Budget 2018, the Government also committed to introducing new legislation to ensure that GBA+ is used to inform not only the budget-making process, but also the review of current government spending, including existing tax expenditures.
The Canadian Gender Budgeting Act, which received Royal Assent on December 13, 2018,[2] aims to ensure that Parliamentarians and Canadians are better informed about the way in which new and existing Government measures impact people differently based on gender and other intersecting identity factors. It requires that the Minister of Finance make available to the public analysis of the impacts of tax expenditures in terms of gender and other intersecting factors on an annual basis.
In conformity with this reporting requirement, this report examines the redistributive impact of the 2016 federal personal income tax (PIT) system by gender and other intersecting identity factors. It primarily uses T1 return data—the most reliable source of information on all Canadian tax filers—to examine the impact of a wide range of federal PIT measures on the distribution of income between men and women. The report focuses on the beneficiaries from these measures rather than on claimants and uses a methodology that accounts for existing pre-tax income inequality between genders which is mainly due to differences in labour market participation and outcomes. While women represented slightly more than half of Canadian tax filers in 2016, they reported about 42% of total pre-tax income. In comparison, they paid about 35% in federal personal income taxes suggesting that the system is redistributive towards women. To analyze the gender-redistributive impact of the federal PIT system, the current study examines the distribution of beneficiaries and benefits associated with the various tax measures of the system as other available studies do, but also complements this information by assessing how each of its components helps to reduce pre-existing income inequality between genders (i.e., income inequality that exist prior to the application of the tax system). Compared to existing studies, it also goes beyond a gender-based comparison by taking into account other available identity factors that have the potential to explain income disparities between genders, i.e., age, family type, and personal and family income groups. The main findings are as follows:
- Overall, the federal PIT system reduces pre-existing income inequality between men and women. In 2016, the share of income held by women after the application of the federal tax system (43.5 per cent) was 1.9 percentage points higher than their share of pre-tax income (41.6 per cent) while, conversely, the share held by men was 1.9 percentage points lower (56.5 compared to 58.4 per cent).
- This redistributive impact towards women is greater among certain groups of tax filers, including tax filers aged 30 to 49, those with dependent children and those reporting low pre-tax income.
- Among the major components of the tax system, refundable credits have the most significant redistributive impact towards women, followed by the progressive tax rate structure especially among high-income tax filers (those in the fourth income quartile). Changes made to income for tax purposes are generally to the advantage of men.
- A similar study performed in 2011 showed that the share of total income rose by 1.4 percentage points for women as a result of the application of the 2008 PIT system.[3] It also found that, independent of gender, the redistributive impact of the federal PIT system was largely due to the progressive statutory tax rate structure and to refundable credits.
- When it is assumed that claimants are the sole beneficiaries of tax expenditures, men and women appear to benefit relatively more from a similar number of the individual tax expenditures included in this study. Women also receive a little more than half of the total tax savings associated with these measures.
- Men benefit relatively more from most of the deductions examined while women benefit relatively more from almost all refundable credits. The Canada Child Benefit is the one that benefits women the most.
- Both men and women benefit from exemptions and non-refundable credits, but in different ways. For example, women benefit relatively more from the non-taxation of social assistance benefits and the non-taxation of Guaranteed Income Supplement and Allowance benefits, as well as from the various non-refundable credits related to the care of dependants, age, health and educational participation. On the other hand, men benefit more from measures such as the Lifetime Capital Gains Exemption and the non-taxation of workers' compensation benefits, as well as from non-refundable credits related to being in a couple, charitable donations, political contributions, or the purchase of a first home.
- The primary beneficiaries of tax expenditures may vary depending on the group of tax filers considered.
- For some tax expenditures, the advantage for men or women changes depending on age group, family type or income group. For example, the advantage for men from the Lifetime Capital Gains Exemption and the non-taxation of workers' compensation benefits does not apply to tax filers under the age of 30. On the other hand, many tax expenditures that, on the whole, are mostly of benefit to women, are only so among tax filers who are part of a couple, especially the tax expenditures related to labour force participation and the Basic Personal Amount.
The remainder of this paper is organized as follows. Section 2 presents background information including details on data sources, the scope and main objective of the analysis and provides a statistical profile of tax filers. Section 3 presents the detailed results of the GBA+ and Section 4 concludes the paper. Additional supporting information is provided in the annexes.
This GBA+ is primarily based on T1 return data, which represents the most reliable source of information on all Canadian tax filers. The analysis also uses a stratified sample of 700,000 tax filers that is representative of the full T1 return data, as well as supplementary data on Canada Child Benefit (CCB) and Goods and Services Tax/Harmonized Sales Tax (GST/HST) Credit payments. The analysis is based on returns from the 2016 tax year, generally filed by the end of April 2017, and uses the tax parameters that prevailed that year.[4] While the payment period for the CCB and GST/HST Credit ran from July 2017 to June 2018, recipients and amounts were determined based on the income that individuals reported in their 2016 tax returns.
The analysis focuses on federal PIT expenditures[5] that impact individuals to which a gender can be assigned.[6] Certain PIT expenditures were excluded from the detailed analysis (Section 3.2), notably those for which beneficiaries and benefit amounts could not be identified using available data since, without this information, a breakdown based on gender or other identity factors could not be produced. Registered plans, such as Registered Pension Plans and Registered Retirement Savings Plans, were also excluded due to incomplete information.[7] The tax expenditures that mainly benefit taxpayers who are not resident individuals (e.g., non-profit organizations, other levels of government, non-residents) are also excluded from the analysis. A list of all PIT expenditures that have been excluded from the detailed analysis for the above-mentioned reasons is presented in Annex B. The results of tax expenditures that have been eliminated or replaced since 2016 are not presented in the tables but are considered in the analysis.
The analysis also takes into account other available characteristics that have the potential to explain income disparities between genders. Table 1 shows the intersecting identity factors that are included and provides details on how these factors are categorized. Although the GBA+ analytical framework published in Budget 2018 suggests taking into account intersecting identity factors that go beyond biological differences (sex) such as race, ethnicity, sexual orientation or gender identity,[8] tax data do not allow for such distinctions to be made.[9]
Table 1
Intersecting Identity Factors Examined in Addition to Gender, and Categories Chosen for Each of These Factors, 2016 Tax Year, Situation on December 31
| Age group | Family type1 | Pre-tax personal income | Adjusted pre-tax family income4 |
|---|---|---|---|
| Under age 30 | Sole filer2 without children3 | Quartile 1 (Min – $15,231) | Quartile 1 (Min – $20,175) |
| Age 30 to 49 | Sole filer with children | Quartile 2 ($15,232 – $32,651) | Quartile 2 ($20,176 – $41,582) |
| Age 50 to 64 | In a couple with children | Quartile 3 ($32,652 – $60,074) | Quartile 3 ($41,583 – $71,631) |
| Age 65 and over | In a couple without children | Quartile 4 ($60,075 – max) | Quartile 4 ($71,632 – max) |
To ensure the protection of tax filers' information, estimates obtained based on fewer than 10 cases are not included and are represented by an "X" in the tables. All shares have been rounded to the nearest tenth (or hundredth for ratios), and dollar amounts, which are presented in 2016 dollars, have been rounded to the nearest million (unless otherwise indicated). As a result, totals may not always add up.
Tables 2 and 3 provide an overview of the distribution of tax filers for the 2016 tax year by gender and the four selected intersecting identity factors. As Table 2 shows, over 27 million individuals filed a 2016 Canadian personal income tax return, of which 48.4 per cent were men and 51.6 per cent were women. Women reported 41.6 per cent of total pre-tax income[10] while men reported 58.4 per cent.
Table 2
Distribution of Tax Filers and Total Pre-Tax Income, by Gender, 2016
| All | Men | Women | |
|---|---|---|---|
| Total number of tax filers (thousands) | 27,445 | 13,290 | 14,155 |
| Distribution of tax filers (%) | 100 | 48.4 | 51.6 |
| Total reported pre-tax income ($ billions) | 1,299 | 759 | 540 |
| Distribution of total reported pre-tax income (%) | 100 | 58.4 | 41.6 |
According to Table 3, tax filers' age profile is quite similar between men and women (columns 2 to 4). Among both men and women, the highest proportion of tax filers (close to one-third) were aged 30 to 49 in 2016. However, a slightly higher proportion of female tax filers were 65 and over (23.3 per cent vs. 20.9 per cent for men), while a slightly higher proportion of male tax filers were under age 30 or aged 50 to 64.
Among both men and women, over 40 per cent of tax filers were sole filers, i.e., they were not in a couple with another filer and had no dependent children. Women were more likely to be sole filers with children (6.5 per cent vs. 1.2 per cent of men) and less likely to be part of all other types of families, especially of a couple without children (34.0 per cent vs. 36.3 per cent).
A substantially smaller proportion of women than men reported pre-tax personal income in the top income quartile (18.1 per cent of women vs. 32.3 per cent of men). Conversely, a much higher proportion of women reported pre-tax personal income that is at the bottom of the income distribution (29.6 per cent of women were in the first quartile vs. 20.1 per cent of men).[11]
The gender differences are, however, less pronounced when tax filers are categorized according to their adjusted pre-tax family income. While the difference between the proportion of men and women in the top personal income quartile is more than 14 percentage points, this difference falls to below 3 percentage points when considering adjusted family income. The same pattern is observed in the bottom income quartile: although women were significantly more likely than men to report low pre-tax personal income (29.6 per cent vs. 20.1 per cent), they were only slightly more likely than men to be in a low family income situation (26.4 per cent vs. 23.5 per cent).
Regardless of age or family type, women's average pre-tax personal income is consistently lower than that of men. However, this is not necessarily the case when the average income of men and women in different personal income brackets is compared. It is only among tax filers who are at the top of the income distribution (those in the top pre-tax income quartile) that a significant difference between the average income of men and women is observed. The per capita pre-tax personal income of women in the top personal income quartile is $104,000 compared to $120,300 for their male counterparts. When family income groups are examined, significant differences can be observed starting in the second quartile with a difference of over $5,000 which increases with each quartile. This indicates that in any given adjusted family income group, except the first quartile, men have higher pre-tax personal income on average than women.
Table 3
Distribution of Tax Filers and Average Pre-Tax Personal Income, by Gender and Selected Intersecting Identity Factors, 2016
| Distribution of tax filers by intersecting identity factor (%) |
Pre-tax personal income per tax filer ($) |
|||||
|---|---|---|---|---|---|---|
|
|
|
|||||
| All | Men | Women | All | Men | Women | |
| All tax filers | 100.0 | 100.0 | 100.0 | 47,300 | 57,100 | 38,100 |
| Age group | ||||||
| Under age 30 | 19.5 | 20.1 | 18.9 | 24,700 | 27,900 | 21,600 |
| 30 – 49 | 32.3 | 32.5 | 32.0 | 55,000 | 66,600 | 44,000 |
| 50 – 64 | 26.1 | 26.5 | 25.8 | 58,500 | 71,800 | 45,600 |
| 65+ | 22.2 | 20.9 | 23.3 | 42,900 | 51,800 | 35,400 |
| Family type | ||||||
| Sole filer without children | 41.1 | 42.0 | 40.2 | 37,100 | 39,700 | 34,500 |
| Sole filer with children | 4.0 | 1.2 | 6.5 | 37,100 | 56,100 | 33,800 |
| In a couple with children | 19.9 | 20.5 | 19.3 | 59,500 | 76,500 | 42,500 |
| In a couple without children | 35.1 | 36.3 | 34.0 | 53,600 | 66,300 | 40,800 |
| Pre-tax personal income | ||||||
| Quartile 1 (Min – $15,231) | 25.0 | 20.1 | 29.6 | 7,000 | 7,000 | 6,900 |
| Quartile 2 ($15,232 – $32,651 ) | 25.0 | 21.6 | 28.2 | 23,000 | 23,200 | 22,900 |
| Quartile 3 ($32,652 – $60,074 ) | 25.0 | 25.9 | 24.1 | 45,100 | 45,500 | 44,700 |
| Quartile 4 ($60,075 – max) | 25.0 | 32.3 | 18.1 | 114,200 | 120,300 | 104,000 |
| Adjusted Pre-tax family income | ||||||
| Quartile 1 (Min – $20,175) | 25.0 | 23.5 | 26.4 | 10,300 | 10,000 | 10,500 |
| Quartile 2 ($20,176 – $41,582 ) | 25.0 | 24.1 | 25.9 | 26,900 | 29,700 | 24,500 |
| Quartile 3 (41,583 – $71,631 ) | 25.0 | 25.9 | 24.2 | 47,000 | 53,900 | 40,100 |
| Quartile 4 ($71,632 – max) | 25.0 | 26.5 | 23.6 | 105,100 | 126,900 | 82,100 |
| Source: T1 return data, 2016. | ||||||
The differences in average pre-tax personal income may be explained by differences in labour market outcomes. Despite significant progress made by women over the past decades in a number of areas including educational attainment, labour force participation and earnings, some challenges remain.[12] Notably, female tax filers' market income is still lower, on average, than that of men. Chart 1 shows that female tax filers aged 30 to 64 are less likely than male tax filers to report market income (86.6 per cent vs. 91.6 per cent in 2016). It also shows that women who earn market income report amounts that are significantly lower on average than men ($47,800 compared to $71,600). These results apply to both components of market income—employment and investment income.
Chart 1
Share of Tax Filers Aged 30 to 64 With Market, Employment and Investment Income, and Average Amounts Reported, by Gender, 2016
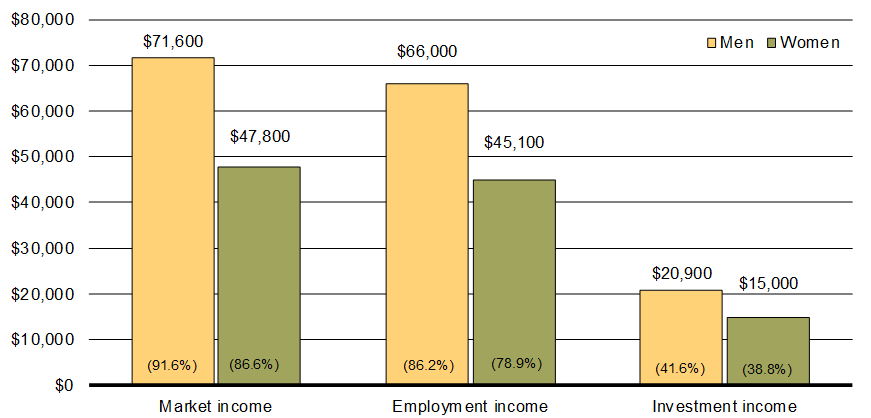
Source: T1 return data, 2016.
Gender differences are also observed in the composition of investment income (Chart 2). Compared to male tax filers aged 30 to 64, a smaller share of the investment income of female tax filers in this age group is composed of dividends (34.3 per cent vs. 37.5 per cent for men) and capital gains (22.2 per cent vs. 25.1 per cent). However, interest, private pension and other investment income represent a larger share of women's investment income compared to men (43.5 per cent vs. 37.3 per cent).
Chart 2
Composition of Total Investment Income Reported by Tax Filers
Aged 30 to 64, by Gender, 2016
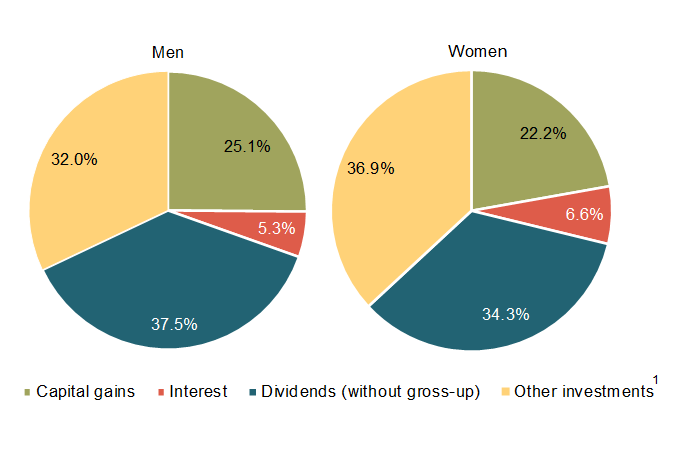
Source: T1 return data, 2016.
Gender differences in the level and composition of total income are observed not only among tax filers aged 30 to 64, but also among younger (less than 30 years) and senior tax filers (age 65 and over). In all of these age groups, employment income represents a smaller share of women's total income compared to men, whereas transfer income represents a smaller share of men's total income (Chart 3).
Chart 3
Employment, Investment, Transfer and Other Income as a Share of Tax Filers' Total Income, by Gender and Age Group, 2016
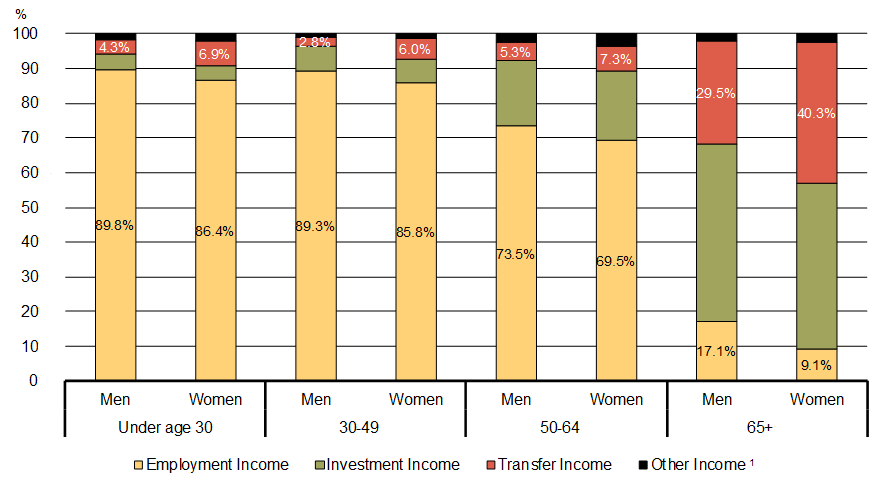 Note: Total income includes employment, investment, transfer and other income.
Source: T1 return data, 2016.
In the federal tax system, tax rates increase with taxable income, some sources of income are treated distinctly (e.g., 50 per cent of capital gains are exempt from tax while certain government transfers, such as provincial social assistance benefits and Guaranteed Income Supplement and Allowance benefits, are entirely exempt from tax), and a number of tax provisions are available to individuals with certain characteristics (e.g., seniors, those with dependants). In addition, there are differences in the socio-demographic characteristics of male and female tax filers as well as in their level and composition of income independent of the tax system. As a result, it can reasonably be expected that the tax system will have different impacts on men and women.
One of the basic principles underlying the tax system is neutrality, which requires that economic activities of tax filers be taxed in the same manner so that their decisions are made on economic merits rather than for tax reasons. There is also the principle of equity, generally examined from the standpoint of vertical equity—the idea that tax filers who have the ability to pay more taxes should contribute more. Progressivity of the tax system generally refers to the principle of vertical equity or, in other words, the effectiveness with which the tax system redistributes income between high- and lower-income tax filers. There is also the concept of horizontal equity—the idea that tax filers who have the same ability to pay should contribute equally. Simplicity is another principle which requires the tax system to be as easy to understand and administer as possible.
Individual tax measures can have more or less important impacts on the various basic principles of the tax system. Although the statutory tax rate structure is usually considered to be the component that primarily contributes to the progressivity of the tax system, tax expenditures can also play a redistributional role. For example, certain tax expenditures can reduce the tax burden on some tax filers but not others, and thus have an impact on the progressivity of the tax system. Tax expenditures can also affect horizontal equity by treating individuals with the same level of income differently. Depending on the situation, certain tax expenditures can have opposite impacts on these various basic principles. For example, tax measures introduced with the main objective of offering better income support to vulnerable populations, thereby improving the progressivity of the tax system, can potentially influence their decisions to participate in the labour market or to save, and thus impact neutrality.
While a thorough policy-making process requires that the various possible impacts of tax measures be taken into account, the current GBA+ focuses specifically on the short-term impact of the 2016 federal PIT tax system on the distribution of income between men and women.
In the case of provisions of the federal PIT system that do not specifically target men or women (i.e., the same tax rules apply independent of the tax filer's gender),[13] it is not necessarily the tax filer's gender that results in a different tax treatment, but rather pre-existing differences in the specific characteristics of men and women (e.g., the fact that they have different profiles in terms of age, family type and/or earned income). Therefore, to capture the redistributive impact of the federal PIT system between genders, it is necessary to not only examine the male-female distribution of beneficiaries and benefits of the various tax system's components, but also to assess how each of the components helps to reduce pre-existing income inequality between genders.
In 2016, women represented 51.6 per cent of tax filers but reported 41.6 per cent of total income before the application of the federal tax system. Therefore, to help reduce pre-existing income inequality between men and women, the 2016 federal PIT system would need to have an overall redistributive impact towards women. For this to occur, it would be required that the sum of its components reduces the share of tax that women pay compared to that of men, and thus increases the share of women's after-tax income compared to their share of pre-tax income. In other words, the 2016 federal PIT system would be required to impact taxable income or net tax payable in favour of women as follows:
- impact women's taxable income through adjustments, exemptions and deductions so that their share of taxable income is lower than their share of pre-tax income;[14] and/or,
- impact net tax payable through the progressive tax rate structure as well as non-refundable credits, tax withholdings transfers and refundable credits so that their share of net tax payable is lower relative to that of men.
By comparing various concepts of income and tax payable, this section assesses the overall impact of the federal PIT system on the redistribution of income between men and women, and identifies the impact of each of its major components (i.e., adjustments to income for tax purposes, exemptions, deductions, tax rates, non-refundable credits and refundable credits). Table 4 illustrates the various concepts that are compared. The starting point for this comparison is total pre-tax income—a concept of income that reflects tax filers' total income before the application of the federal PIT system,[15] while the end point is total income after net tax payable, the transfer of tax withholdings and the calculation of refundable credits—a concept of income that reflects tax filers' total income after the application of the federal PIT system.
The diagram in Annex A provides more details on the various concepts of income and tax examined as well as on the major components of the tax system analysed in this section. It is worth noting that they are all based on the assumption that the tax savings associated with the various federal PIT measures only benefit claimants.
3.1.1 Impacts on the Male-Female Distribution of Income
A comparison of women's share of total taxable income (42.0 per cent) with their share of total pre-tax income (41.6 per cent) shows that the changes made to income for tax purposes are generally to the advantage of men, since they increase women's share of income on which tax is payable by 0.40 percentage points. This is primarily due to adjustments for dividends received, split pension income received and net capital loss (+0.4 percentage points) as well as to deductions (+0.2 percentage points). Conversely, exemptions favour income redistribution towards women as they reduce the share of taxable income held by women by 0.2 percentage points (see numbers in parentheses in Table 4).
The fact that women's share of taxable income after net tax payable, tax withholdings transfers on split pension income[16] and the calculation of refundable credits (44.2 per cent) is 2.2 percentage points higher than their share of taxable income (42.0 per cent) indicates that, overall, the progressive tax rate structure, non-refundable credits and refundable credits are to the benefit of women as they reduce their share of tax liabilities, and consequently increase their share of disposable income. In this case, each of the three components are to the advantage of women, i.e., they each increase the share of income held by women (by 0.5, 0.3 and 1.3 percentage points, respectively- including a 0.1 percentage points for tax withholdings transfers). Refundable credits have the largest redistributive impact towards women, followed by the progressive tax rate structure.
Table 4
Total Amounts of Various Concepts of Income and Tax Payable and Distribution of These Amounts by Gender, 2016
| Concepts of income and tax payable | Total amount ($ millions) |
Distribution of total amount by gender | Major components of the federal PIT system (redistributive impact towards women) | Components | |||
|---|---|---|---|---|---|---|---|
| Men | Women | Men | Women | ||||
| Overall redistributive impact towards women of the federal PIT system (+1.9 pp) |
Pre-tax income (i.e., disposable income before the application of the tax system) | 759,219 | 539,916 | 58.4 % | 41.6 % | Adjustments for dividends, split pension income, net capital loss (+0.4 pp) Exemptions, including the partial inclusion of capital gains (-0.2 pp) Deductions (+0.2 pp) |
Components affecting taxable income: (+ indicates negative impact - indicates positive impact) |
| Income for federal tax purposes, including exempt income | 769,941 | 557,667 | 58.0 % | 42.0 % | |||
| Income for federal tax purposes | 740,624 | 531,110 | 58.2 % | 41.8 % | |||
| Taxable income | 669,959 | 484,350 | 58.0 % | 42.0 % | |||
| Tax payable on taxable income | 126,082 | 82,856 | 60.3 % | 39.7 % | Progressive tax rate structure (+0.5 pp) Non-refundable credits, including the Basic Personal Amount and Basic Federal Tax (+0.3 pp) Tax withholdings transfers(+0.1 pp) and Refundable credits(+1.2 pp) (+1.3 pp) |
Components affecting net tax payable: (- indicates negative impact + indicates positive impact) |
|
| Taxable income less tax payable | 543,877 | 401,494 | 57.5 % | 42.5 % | |||
| Net tax payable (i.e., after non-refundable credits) before tax withholdings transfers andrefundable credits | 86,697 | 47,578 | 64.6% | 35.4 % | |||
| Taxable income less net tax payable | 583,262 | 436,772 | 57.2 % | 42.8 % | |||
| Net tax payable after tax withholdings transfers and refundable credits | 84,514 | 21,210 | 79.9 % | 20.1 % | |||
| Taxable income less net tax payable aftertax withholdings transfers and refundable credits | 585,446 | 463,140 | 55.8% | 44.2 % | |||
| After-tax income or disposable income after the application of the tax system (i.e., Pre-tax income less net tax payable, tax withholdings transfers and refundable credits) | 674,705 | 518,706 | 56.5 % | 43.5 % | |||
| Notes: PP stands for percentage points. The credit for the Basic Personal Amount (BPA) is universal and provides a zero tax rate up to an initial level of income. It thus can be viewed as being part of the tax rate structure, and as such, parts 1, 2 and 3 of this report classify the BPA as a “benchmark tax measure”. In this study, however, the credit for the BPA is controlled for among non-refundable tax credits, as in the T1 return. | |||||||
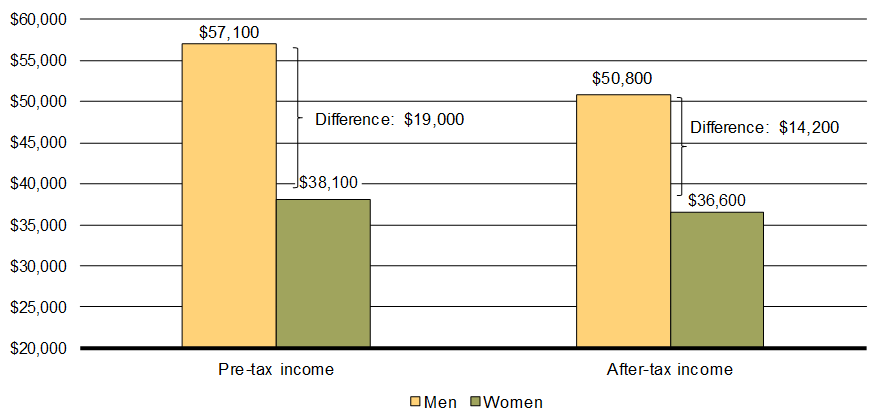
The overall impact of the federal PIT system on the redistribution of income between men and women can be determined by comparing women's total disposable income before and after the application of the federal tax system, since these are the concepts of income that best capture the impact of the tax system on the income that women have at their disposal to meet their needs. By making this comparison, it is found that women's share of total disposable income increased by 1.9 percentage points as a result of the application of the 2016 federal PIT system: they reported 41.6 per cent of total pre-tax income, while their share of total after-tax income was 43.5 per cent. The size of the change in the distribution of income in favour of women due to the 2016 federal PIT system is slightly larger than what was observed in the 2011 Department of Finance Canada study for the 2008 tax year (i.e., 1.4 percentage points).
On the other hand, this 1.9 percentage points increase in women's share of total disposable income resulting from the application of the tax system implies a 1.9 percentage points reduction in men's share of total disposable income. As shown in Table 4, men reported 58.4 % of total pre-tax income while their share of total after-tax income was 56.5%. This is equivalent to a reduction by $63.3 billion in the difference between total income of men and women or to a reduction by $4,800 in their average income when comparing pre-tax and after-tax income (Chart 4).
Chart 4
Average Pre-Tax and After-Tax Income, by Gender, 2016
It should be noted that excluding the CCB and the GST/HST Credit reduces the overall redistributive impact towards women of the 2016 federal PIT system from 1.9 to 0.8 percentage points.
3.1.2 Impacts on the Male-Female Distribution of Income Among Various Groups
It has been observed in the literature that some tax expenditures are likely to provide larger benefits to specific groups of women (e.g., women with high incomes), or that vulnerable populations (e.g., immigrant women, Indigenous women or women with disabilities) are sometimes less likely to benefit from certain tax measures. In particular, Philipps (2018) points out the importance of examining the interaction between gender and different income groups. Accordingly, this section focuses on men and women in particular age, family and income groups, and assesses whether different conclusions can be drawn for these groups.
In general, the federal PIT system remains redistributive towards women when taking into consideration these other characteristics. Notably, Table 5 (columns 3 to 6) shows that the redistributive impact towards women is the largest (+3.0 percentage points) among tax filers aged 30 to 49 years, followed by tax filers under age 30 (+2.5 percentage points). In contrast, the overall redistributive impact is the smallest among seniors (+0.8 percentage points), due to adjustments and deductions affecting the level of taxable income. Indeed, in this age group, such broad components significantly increase women's share of taxable income relative to their share of pre-tax income, and accordingly their relative share of tax payable. This effect is, however, partially compensated by transfers of tax withholdings on split pension income. As for younger women, older women are also relatively more likely than men to benefit from exemptions, the progressive tax rate structure and non-refundable credits. While older female tax filers see only a small increase in their share of income as a result of refundable credits, among tax filers under the age of 50, refundable credits are the main contributor of income redistribution towards women. Among tax filers under age 30, non-refundable credits contribute more to the redistribution of income towards women than the progressive tax rate structure, while the opposite is true for all other age groups.
The breakdown by family type (columns 7 to 10) shows that the tax system's redistributive impact towards women is the largest among tax filers with dependent children. The positive change in the share of women's disposable income resulting from the application of the tax system is 3.9 percentage points among parents living as part of a couple and 3.2 percentage points among lone parents, particularly due to the impact of refundable credits. The progressive tax rate structure is more redistributive towards women among tax filers living in a couple than sole tax filers (regardless of whether they have children or not), while deductions are redistributive towards women only among tax filers living in a couple with children. Exemptions are, for their part, redistributive towards women only among sole filers. The components that have an impact on income for tax purposes have a negative redistributive impact exclusively among tax filers who are part of a couple without children. In all other types of families, female tax filers generally benefit from or are not impacted by these components of the tax system.
Table 5
Change in Women's Share of Income Attributable to the Main Components of the 2016 Federal PIT System, by Age Group and Family Type
| Age group | Family type | ||||||||
|---|---|---|---|---|---|---|---|---|---|
|
|
|
||||||||
| All | <30 | 30–49 | 50–64 | 65+ | Sole filer without children | Sole filer with children | In a couple with children | In a couple without children | |
| Share (%) of tax filers who are women | 51.6 | 50.1 | 51.2 | 50.9 | 54.3 | 50.5 | 85.1 | 50.0 | 49.9 |
| Women's share (%) of total pre-tax income(i.e., disposable income before the application of the tax system) | 41.6 | 43.7 | 40.9 | 39.7 | 44.7 | 47.0 | 77.5 | 35.7 | 38.0 |
| Change (pp) in women's share of income attributable to the components affecting taxable income: | |||||||||
| Adjustments | 0.4 | 0.0 | 0.0 | 0.5 | 1.2 | 0.0 | -0.1 | 0.1 | 1.2 |
| Exemptions | -0.2 | -0.2 | -0.1 | 0.0 | -0.6 | -0.5 | -0.7 | 0.0 | 0.1 |
| Deductions | 0.2 | -0.2 | -0.5 | 0.2 | 1.6 | 0.0 | 0.0 | -0.5 | 0.7 |
| Women's share (%) of total taxable income | 42.0 | 43.4 | 40.4 | 40.4 | 46.9 | 46.5 | 76.8 | 35.3 | 40.0 |
| Change (pp) in women's share of income attributable to the components affecting net tax payable: | |||||||||
| Progressive tax rate structure | 0.5 | 0.2 | 0.5 | 0.7 | 0.5 | 0.3 | 0.3 | 0.6 | 0.6 |
| Non-refundable credits, | 0.3 | 0.5 | 0.4 | 0.3 | 0.2 | 0.4 | 0.5 | 0.3 | 0.2 |
| Tax withholdings transfers | 0.1 | 0.0 | 0.0 | 0.2 | 0.4 | 0.0 | 0.0 | 0.0 | 0.3 |
| Refundable credits | 1.2 | 2.0 | 2.5 | 0.2 | 0.1 | 0.1 | 3.0 | 3.4 | 0.1 |
| Women's share (%) of total taxable income after net tax payable, tax withholdings transfers and refundable credits | 44.2 | 46.0 | 43.7 | 41.6 | 48.1 | 47.2 | 80.5 | 39.6 | 38.9 |
| Women's share (%) of total after-tax income (i.e., disposable income after the application of the tax system) | 43.5 | 46.2 | 43.9 | 40.6 | 45.6 | 47.7 | 80.7 | 39.6 | 38.9 |
| Total change (pp) in women's share of disposable income after the application of the tax system | 1.9 | 2.5 | 3.0 | 1.0 | 0.8 | 0.7 | 3.2 | 3.9 | 0.8 |
| Notes: PP stands for percentage points. Source: T1 return data, 2016. |
|||||||||
Table 6 shows that the lower the pre-tax income of tax filers, the greater the redistributive impact of the federal PIT system towards women. Among tax filers in the first pre-tax personal income quartile, the federal PIT system is clearly to the advantage of women as it increases the share of income held by women by 6.0 percentage points. A redistributive impact towards women is also seen in all other income quartiles, although to a lesser extent than in the first quartile. With the exception of the first quartile, the redistributive impact towards women appears to be greater when family income of tax filers is used to determine income groups rather than personal income. The results presented in Table 6 also indicate that, in the first three family income quartiles, the redistribution of income towards women is mainly due to refundable credits, while in the top quartile, the progressive tax rate structure plays the most significant redistributive role. Interestingly, among tax filers in the first personal income quartile, some components of the PIT system affecting taxable income (i.e., adjustments for dividends and split pension income received—before taking account of tax withholdings transfers—as well as exemptions) negatively impact income redistribution towards women. This negative impact is, on the other hand, largely compensated by the positive impact of refundable credits among those in this quartile and, to some extent, by the positive impact of tax withholdings transfers on split pension income.
Table 6
Change in Women's Share of Income Attributable to the Main Components of the 2016 Federal PIT System, by Quartile of Personal Income and Adjusted Family Income
| Personal income quartile | Adjusted family income quartile | ||||||||
|---|---|---|---|---|---|---|---|---|---|
|
|
|
||||||||
| All | Q1 | Q2 | Q3 | Q4 | Q1 | Q2 | Q3 | Q4 | |
| Share (%) of tax filers who are women | 51.6 | 61.0 | 58.1 | 49.8 | 37.4 | 54.5 | 53.3 | 49.9 | 48.6 |
| Women's share (%) of total pre-tax income (i.e., disposable income before the application of the tax system) | 41.6 | 60.8 | 57.7 | 49.3 | 34.1 | 55.7 | 48.5 | 42.6 | 38.0 |
| Change (pp) in women's share of income attributable to the components affecting taxable income: | |||||||||
| Adjustments | 0.4 | 3.0 | 0.7 | 0.3 | 0.1 | 0.0 | 0.4 | 0.8 | 0.4 |
| Exemptions | -0.2 | 2.2 | -0.2 | 0.1 | -0.2 | -1.0 | -0.1 | 0.0 | -0.1 |
| Deductions | 0.2 | -0.6 | 0.0 | 0.0 | -0.3 | -0.4 | 0.2 | 0.3 | -0.1 |
| Women's share (%) of total taxable income | 42.0 | 65.5 | 58.2 | 49.7 | 33.8 | 54.3 | 49.0 | 43.7 | 38.2 |
| Change (pp) in women's share of income attributable to the components affecting net tax payable: | |||||||||
| Progressive tax rate structure | 0.5 | 0.0 | 0.0 | 0.0 | 0.4 | 0.0 | 0.0 | 0.1 | 0.7 |
| Non-refundable credits, | 0.3 | -0.2 | -0.1 | 0.0 | 0.1 | 0.1 | 0.2 | 0.3 | 0.2 |
| Tax withholdings transfers | 0.1 | 0.4 | 0.1 | 0.1 | 0.1 | 0.0 | 0.1 | 0.2 | 0.1 |
| Refundable credits | 1.2 | 5.3 | 1.5 | 0.8 | 0.2 | 5.7 | 1.9 | 1.0 | 0.2 |
| Women's share (%) of total taxable income after net tax payable, tax withholdings transfers and refundable credits | 44.2 | 70.9 | 59.8 | 50.6 | 34.5 | 60.1 | 51.2 | 45.2 | 39.4 |
| Women's share (%) of total after-tax income (i.e., disposable income after the application of the tax system) | 43.5 | 66.8 | 59.1 | 50.1 | 34.7 | 59.9 | 50.5 | 43.9 | 38.9 |
| Total change (pp) in women's share of disposable income after the application of the tax system | 1.9 | 6.0 | 1.4 | 0.8 | 0.7 | 4.3 | 2.0 | 1.4 | 1.0 |
| Notes: PP stands for percentage points. Source: T1 return data, 2016. |
|||||||||
This section examines the redistributive impact towards women of individual federal PIT measures. To this end, statistics on the number of beneficiaries as well as on the amount of benefits received for each of the selected tax expenditures were produced by gender and the other intersecting identity factors considered.[17]
The "number of beneficiaries" refers to the number of tax filers who, in the absence of a particular tax expenditure, would have had to pay a higher amount of net federal tax, all else being equal (or, in other words, assuming no behavioural change by tax filers). The "total amount of benefits" refers to the amount of net federal tax saved by tax filers due to the tax expenditure, all else being equal. Net federal tax is before refundable tax credits; as such, possible changes in eligibility for refundable credits and benefit amounts that would occur in the absence of the tax expenditure are not accounted for when calculating the number of beneficiaries and total amount of benefits.
Based on these statistics, a number of indicators that provide insight on the use and impact of each tax expenditure were derived:
- The share of beneficiaries: Share of the total number of tax filers who benefit from the measure.
- The average amount of benefits: The per capita amount of total tax payable that beneficiaries saved due to the measure.
- The distribution of total benefits: Share of the total amount of benefits attributed to a particular group (e.g., men or women).
As mentioned before, to determine if and how the PIT system contributes to promoting gender income equality in the short term, it is not sufficient to examine the distribution of beneficiaries and benefits by gender. It is also necessary to look at how each measure contributes to reducing pre-existing income inequality between men and women. In order to control for pre-existing income inequality (i.e., before the application of the federal tax system) and draw conclusions on the impact of the various tax measures, the following indicator was also derived:
- Ratio of the share of total benefits received relative to the share of total pre-tax income reported: A ratio higher than one indicates that a group of tax filers benefits from the tax expenditure proportionally more than others, and vice versa.
If each of these four indicators can bring different and complementary perspectives on the groups of tax filers who benefit the most from each tax expenditure, the last indicator is considered the most informative for the purposes of the current study. Indeed, since this indicator identifies the proportion of total benefits of a tax measures that goes to a particular group of tax filers in relation to the proportion of total pre-tax income reported by this group, it allows a distinction between the impact of the tax system and the impact of pre-existing differences in income earned by men and women.[18]
All indicators were derived based on the assumption that tax expenditures benefit only tax filers who claim them on their income tax return. Also, in order to determine the number of beneficiaries and the amount of benefits attributable to a particular tax expenditure, it was assumed that most other tax expenditures remain unchanged (i.e., assuming no interactions among tax expenditures)[19] and that the behaviour of claimants is not affected by the absence/presence of the tax expenditure. For these reasons, the sum of the benefits associated with each tax expenditure in a group of tax expenditures may not correspond to the total benefits associated with that group, especially since data limitations precluded an examination of the benefits associated with a number of individual federal PIT expenditures in each of the broad types of tax expenditures (i.e., exemptions, deductions, non-refundable credits, refundable credits and others).[20]
Of course, determining who benefits relatively more from a tax expenditure and to what extent may not provide a complete picture of its gender-based impact. Tax expenditures that improve the allocation of income between men and women may, from another standpoint, be seen as representing a disincentive to the labour market participation of women, thereby affecting their longer-term financial security. As mentioned previously, this GBA+ does not examine the impact of federal PIT measures on the labour market participation of men and women. It only provides evidence on the extent to which they affect the redistribution of income between men and women in the short term.
3.2.1 Impacts on the Male-Female Distribution of Income
The final column of Table 7 identifies the tax expenditures that, based on the ratio described above, benefit women relatively more[21] (in bold) and men relatively more (in italics). Other ratios benefit men and women almost equally.
Exemptions
The ratios suggest first that, in 2016, men and women benefited relatively more from about the same number of exemptions reviewed. Relative to their reported proportion of pre-tax income, women benefited to a relatively larger extent from the non-taxation of Guaranteed Income Supplement and Allowance benefits, and from the non-taxation of social assistance benefits. For their part, men benefited relatively more from the non-taxation of income earned by military and police deployed to international operational missions, and from the non-taxation of workers' compensation benefits. Men also benefited relatively more from the Lifetime Capital Gains Exemption, but almost as equally as women from the partial inclusion of capital gains.
Deductions
The ratios also indicate that male tax filers benefited relatively more from most deductions. Only 3 of the 14 deductions examined mostly benefited women in 2016: the child care expense deduction, which generally requires that the parent with the lowest income make the claim; the deduction of union and professional dues; and the disability supports deduction.
While the deduction of carrying charges incurred to earn income benefits men and women almost equally, men benefit relatively more from all other deductions examined. In particular, men mostly benefited from measures related to business investments, the deduction of other employment expenses, such as the deduction for tradespeople's tool expenses, the employee stock option deduction, and the deduction for clergy residence. Deductions are of more benefit to higher-income tax filers as they reduce taxable income and provide tax savings based on the tax filers' marginal tax rate or, in other words, tax savings which increase with income. Since men report, on average, significantly higher pre-tax income than women, it makes sense that men benefit relatively more from most deductions.
Non-Refundable Credits
Unlike deductions, for which the benefit depends on marginal tax rates, non-refundable tax credits yield the same tax savings to all claimants, provided they have enough taxable income to receive the full value of the credit. Of the 31 non-refundable credits reviewed (including those repealed or replaced since 2016), 13 mostly benefited women in 2016, 11 were of relatively more benefit to men, and 7 benefited women and men almost equally. The non-refundable credits that benefited women relatively more include some of those related to the care of dependants (the Eligible Dependant Credit and the Disability Tax Credit),[22] those related to age and health (Age Credit, Pension Income Credit, Medical Expense Tax Credit, Disability Tax Credit and Home Accessibility Tax Credit) and those related to education (Student Loan Interest Credit and Tuition Tax Credit). Other indicators in Table 7 suggest that women benefited relatively more from these measures mainly because they were more likely to claim and benefit from them, rather than because they received a larger average benefit compared to benefiting men. These results are consistent with the greater tendency for women to be the primary caregiver of dependants, their greater participation in post-secondary education, and their longer life expectancy compared to men.
Although men and women are equally likely to claim the credit for the Basic Personal Amount (BPA), the ratios indicate that the BPA was of relatively more benefit to women. Women report incomes that are lower on average than those of men, and as a result, the BPA generally weighs more for them. In the same vein, credits granted to recognize the cost of "regular" labour market participation, such as the Canada Employment Credit and the credits for Canada Pension Plan/Quebec Pension Plan contributions and Employment Insurance/Quebec Parental Insurance Plan premiums, were also of slightly greater benefit to women, although they were used more often by men.
For their part, men mostly benefited from the more "targeted" employment credits examined, such as the Volunteer Firefighters Tax Credit and the Search and Rescue Volunteers Tax Credit. Men also benefited relatively more from non-refundable tax credits that recognize a reduced ability to pay taxes for those with a dependant spouse, i.e., the Spouse or Common-Law Partner Credit and unused credits transferred from a spouse or common-law partner. Credits for foreign taxes, charitable donations, political contributions, the purchase of a first home and adoption expenses were also of relatively more benefit to men in 2016.
Refundable Credits
Due to their lower personal income on average and higher likelihood of being in a low-income family situation, almost all refundable credits benefit women relatively more. For the 2016 tax year, the CCB (with amounts paid during the 2017-18 benefit year based on the 2016 tax year) was the refundable credit that benefited women the most. This is consistent with expectations given that, for CCB purposes, when both male and female parents live together with a child, the female parent is usually considered to be the primary individual responsible for the care of the child and is therefore the parent who must apply for the credit. Among 2016 female tax filers, 22.9 per cent were entitled to a CCB amount in the following benefit year, compared to just over 1.2 per cent of male tax filers. The CCB average amount that female beneficiaries received ($6,715) was also greater than that of male beneficiaries ($5,808). That same year, women also benefited relatively more from the Refundable Medical Expense Supplement, the GST/HST Credit and the Teacher and Early Childhood Educator School Supply Tax Credit. The Working Income Tax Benefit also benefited women relatively more, despite a slightly lower benefit rate among women (5.1 per cent compared to 5.5 per cent among men). The only refundable tax credits that were, on the whole, mostly of benefit to men in 2016 were the investment tax credit refund, the rebate to employees and partners, and the Part XII.2 trust tax credit.
Other types
Estimating the benefits of tax expenditures involving income transfers (notional or real) between tax filers—the tax treatment of alimony and maintenance payments and the pension income splitting—is somewhat more complex. A breakdown between transferors and recipients helps to understand their direct impacts by gender. In 2016, women represented 76.7 per cent of tax filers to whom pension income was transferred and 96.3 per cent of those who received income from taxable alimony or maintenance payments. Since the inclusion of an additional source of income typically results in a higher amount of tax payable, women are more likely to see their net federal tax payable increase as a result of these measures. Correspondingly, because such income transfers allow for deductions, men are more likely to see their net federal tax payable decrease as a result of these measures. However, the income deduction/inclusion aspects of these tax expenditures are not the only ones that need to be considered when attributing their benefits to specific groups of tax filers.
Specifically, attributing the entire benefit of the tax treatment of alimony and maintenance payments to men, as done in some external studies, may be inaccurate in a context where the amounts claimed by the payers and recipients may already account for tax implications. The deduction/inclusion tax rule for support payment results in a tax expenditure for the government (or tax savings for filers) with a total cost that corresponds to the value of deductions by the payers minus taxes collected from recipients. According to 2016 tax data, the amount of this tax expenditure is estimated at $95 million. Determining the share of the tax savings that is captured respectively by payers and recipients is not straightforward. The Spousal Support Advisory Guidelines from the Department of Justice[23] propose formulas for computing spousal support that lead to gross amounts on the assumption that the payer will be able to deduct the support and the recipient will pay tax upon it. However, the results of negotiations and how the amounts are determined in practice are unknown since they are not part of the tax system and not observable in T1 data. In absence of this information, the distribution of benefits of the tax treatment of alimony and maintenance payments that is actually accruing to men and women cannot be estimated accurately. For this reason, this specific tax expenditure has been excluded from the current section.
For pension income splitting, once spouses or partners elect to use the measure, tax withholdings already applied to the split pension income also need to be transferred to the receiving spouses or partners[24]. Considering the three aspects of pension income splitting (i.e., system of deduction and inclusion and the transfer of tax withholdings) the results indicate that men received 68.8% of the total benefits associated with pension income splitting in 2016 compared to 31.2% for women. While such results suggest that men benefit proportionally more from pension income splitting than women, the benefits that they get from this measure are much less important than if no tax withholdings were transferred at the time of filing. Further, for this measure in particular, attributing the ex-post benefits entirely to the claimants may not be the most appropriate assumption for assessing its impact. Pension income splitting was put in place with the objective of extending or modifying the unit of taxation from individual to family, and allowing couples with pension income to reduce their combined taxes. Given that both spouses or partners are required to agree to use this measure at the time of filing, it is conceivable that some of them would also agree to share the post-tax treatment benefits of it. While administrative tax data do not allow us to observe the couples' decision-making process with respect to ex-post benefits, a study by Vincent, St-Cerny and Godbout (2019)[25] indicates that the majority of the couples who responded to their survey, including those who use pension income splitting, chose to share their tax refunds or balances owing.[26] This suggests that most transferors and recipients using this measure ultimately get similar benefits.
Table 7
Portrait of Beneficiaries of the Various Selected Tax Expenditures, by Gender, 2016
| Tax expenditures by type | Share (%) of beneficiaries among all tax filers | Average amount ($) of benefits per beneficiary | Distribution (%) of total benefits between men and women |
Share of benefits received by women relative to their share of pre-tax income | |||
|---|---|---|---|---|---|---|---|
|
|
|||||||
| Men | Women | Men | Women | Men | Women | Ratio4 | |
| Type 1 – Exemptions | |||||||
| Lifetime Capital Gains Exemption | 0.3 | 0.2 | 27,782 | 23,915 | 63.9 | 36.1 | 0.87 |
| Non-taxation of Guaranteed Income Supplement and Allowance benefits | 1.7 | 2.9 | 291 | 271 | 37.0 | 63.0 | 1.52 |
| Non-taxation of income earned by military and police deployed to international operational missions | 0.0 | 0.0 | 4,172 | 2,928 | 88.7 | 11.3 | 0.27 |
| Non-taxation of social assistance benefits | 1.7 | 1.5 | 563 | 569 | 50.2 | 49.8 | 1.20 |
| Non-taxation of workers' compensation benefits | 2.2 | 1.3 | 1,512 | 1,226 | 66.5 | 33.5 | 0.81 |
| Partial inclusion of capital gains | 8.5 | 8.2 | 3,191 | 2,063 | 60.1 | 39.9 | 0.96 |
| Type 2 – Deductions | |||||||
| Capital loss carry-overs | 2.1 | 1.6 | 1,082 | 643 | 66.9 | 33.1 | 0.80 |
| Deduction of carrying charges incurred to earn income | 7.1 | 5.6 | 895 | 721 | 59.5 | 40.5 | 0.97 |
| Non capital loss carry-overs | 0.2 | 0.1 | 2,943 | 1,597 | 67.0 | 33.0 | 0.79 |
| Rollovers of investments in small businesses | 0.0 | 0.0 | 58,937 | 6,719 | 93.4 | 6.6 | 0.16 |
| Child care expense deduction | 2.5 | 5.9 | 866 | 797 | 30.3 | 69.7 | 1.68 |
| Deduction for clergy residence | 0.2 | 0.0 | 2,894 | 2,343 | 83.3 | 16.7 | 0.40 |
| Deduction of allowable business investment losses | 0.0 | 0.0 | 4,981 | 2,971 | 77.5 | 22.5 | 0.54 |
| Deduction for tradespeople's tool expenses | 0.1 | 0.0 | 94 | 96 | 96.8 | 3.2 | 0.08 |
| Deduction of other employment expenses | 3.8 | 1.8 | 1,310 | 767 | 77.3 | 22.7 | 0.55 |
| Deduction of union and professional dues | 19.2 | 18.5 | 194 | 151 | 55.4 | 44.6 | 1.07 |
| Disability supports deduction | 0.0 | 0.0 | 990 | 1,031 | 48.3 | 51.7 | 1.24 |
| Employee stock option deduction | 0.2 | 0.1 | 19,432 | 9,097 | 85.6 | 14.4 | 0.35 |
| Moving expense deduction | 0.4 | 0.2 | 1,253 | 841 | 67.6 | 32.4 | 0.78 |
| Northern Residents Deductions | 1.1 | 0.6 | 1,041 | 851 | 66.3 | 33.7 | 0.81 |
| Type 3 – Non-refundable credits | |||||||
| Adoption Expense Tax Credit | 0.0 | 0.0 | 1,033 | 992 | 63.0 | 37.0 | 0.89 |
| Age Credit – for self1 | 14.5 | 15.6 | 764 | 761 | 46.6 | 53.4 | 1.28 |
| Canada Employment Credit | 59.8 | 49.6 | 167 | 167 | 53.0 | 47.0 | 1.13 |
| Charitable Donation Tax Credit | 21.4 | 17.6 | 638 | 394 | 64.9 | 35.1 | 0.85 |
| Credit for the Basic Personal Amount | 94.1 | 91.8 | 1,475 | 1,387 | 50.6 | 49.4 | 1.19 |
| Disability Tax Credit – for self and for a dependant1 | 2.4 | 2.1 | 1,208 | 1,087 | 54.9 | 45.1 | 1.09 |
| Dividend gross-up and tax credit | 14.5 | 12.7 | 1,436 | 1,077 | 59.0 | 41.0 | 0.95 |
| Eligible Dependant Credit | 1.0 | 3.8 | 1,481 | 1,374 | 21.5 | 78.5 | 1.89 |
| First-Time Home Buyers' Tax Credit | 0.9 | 0.5 | 672 | 633 | 61.5 | 38.5 | 0.93 |
| Foreign tax credit | 5.8 | 5.4 | 1,585 | 592 | 72.8 | 27.2 | 0.65 |
| Labour-Sponsored Venture Capital Corporations Credit | 1.4 | 1.1 | 462 | 381 | 60.2 | 39.8 | 0.96 |
| Medical Expense Tax Credit | 12.2 | 17.0 | 443 | 397 | 43.0 | 57.0 | 1.37 |
| Pension Income Credit – for self1 | 14.6 | 15.8 | 288 | 286 | 46.6 | 53.4 | 1.29 |
| Political Contribution Tax Credit | 0.7 | 0.4 | 186 | 164 | 64.4 | 35.6 | 0.86 |
| Search and Rescue Volunteers Tax Credit | 0.0 | 0.0 | 445 | 439 | 82.1 | 17.9 | 0.43 |
| Spouse or Common-Law Partner Credit | 9.0 | 2.3 | 1,113 | 998 | 80.2 | 19.8 | 0.48 |
| Student Loan Interest Credit | 1.5 | 2.3 | 80 | 81 | 38.7 | 61.3 | 1.47 |
| Tax credit for Canada Pension Plan/Quebec Pension Plan (CPP/QPP) contributions by employed and self-employed persons | 56.8 | 47.3 | 279 | 248 | 55.9 | 44.1 | 1.06 |
| Non-taxation (exemption) of CPP/QPP contributions by employers | 67.3 | 57.8 | 356 | 279 | 58.2 | 41.8 | 1.00 |
| Tax credit for Employment Insurance (EI) and Quebec Parental Insurance Plan (QPIP) premiums paid by employed and self-employed persons | 51.5 | 44.5 | 112 | 98 | 55.3 | 44.7 | 1.08 |
| Non-taxation (exemption) of EI and QPIP premiums paid by employers | 51.6 | 44.6 | 216 | 174 | 57.5 | 42.5 | 1.02 |
| Tuition Tax Credit – for self or for a dependant1 | 8.8 | 9.0 | 900 | 859 | 49.0 | 51.0 | 1.23 |
| Volunteer Firefighters Tax Credit | 0.3 | 0.0 | 445 | 436 | 92.2 | 7.8 | 0.19 |
| Unused credits transferred from a spouse or common-law partner1 | 2.9 | 1.2 | 590 | 671 | 67.7 | 32.3 | 0.78 |
| Home Accessibility Tax Credit | 0.1 | 0.1 | 656 | 621 | 55.5 | 44.5 | 1.07 |
| Type 4 – Refundable credits | |||||||
| Canada Child Benefit | 1.2 | 22.9 | 5,808 | 6,715 | 4.1 | 95.9 | 2.31 |
| Working Income Tax Benefit | 5.5 | 5.1 | 810 | 822 | 49.7 | 50.3 | 1.21 |
| Goods and Services Tax/Harmonized Sales Tax Credit | 35.3 | 39.3 | 395 | 431 | 43.6 | 56.4 | 1.36 |
| Refundable Medical Expense Supplement | 1.6 | 2.4 | 278 | 275 | 38.9 | 61.1 | 1.47 |
| Teacher and Early Childhood Educator School Supply Tax Credit | 0.1 | 0.3 | 66 | 66 | 18.4 | 81.6 | 1.96 |
| Other refundable tax credits2 | 1.9 | 1.5 | 283 | 110 | 75.4 | 24.6 | 0.59 |
| Other types | |||||||
| Pension income splitting – total (considers spouses or partners who receive and make the transfer of income and tax withholdings)3 | 9.4 | 8.6 | 698 | 325 | 68.8 | 31.2 | 0.75 |
| Notes: For simplicity, the term "tax expenditures" refers to the concepts of "tax expenditures" and "benchmark measures" throughout the study. These concepts are discussed in Part 1 of this report. The tax expenditures that were in place in 2016 but that are no longer in force (e.g. the Public Transit Tax Credit or the Children's Fitness Tax Credit) are not presented in this table but are included in the analysis (i.e., as part of the total of 60 measures studied). 1 The unused portion of the following credits can be transferred to a spouse or common-law partner: Age Credit, Family Caregiver Tax Credit (repealed), Pension Income Credit, Disability Tax Credit and Tuition Tax Credit. For these tax expenditures, the portions transferable to a spouse or common-law partner are considered in the "Unused credits transferred from a spouse or common-law partner" measure. Thus, only the portions of these measures that tax filers claim for themselves or their dependants, and that are therefore not related to their marital status, are presented separately in the table. 2 Other refundable tax credits include the refund of the investment tax credit, the rebate to employees and partners, and the Part XII.2 trust tax credit. 3 Net benefits attributable to the "Pension income splitting" consider the deduction obtained by the transferor and the tax collected from the receiver as well as the tax withholdings transferred. Except for the Age Tax Credit, other potential interactions (e.g. with the Pension Income Credit or the Spouse or Common-Law Partner Credit) were not accounted for in the calculation. 4 The bold ratios identify tax expenditures for which the share of benefits attributed to women was at least 5 per cent greater than the share of total pre-tax income reported by women, while the ratios in italics identify tax expenditures for which the share of benefits attributed to women was at least 5 per cent lower than the share of total pre-tax income reported by women. Sources: T1 return data, CCB and GST/HST Credit payment data, and the Department of Finance Canada's T1 microsimulation model for the partial inclusion of capital gains, 2016. |
|||||||
Overall, the ratios show that among the 60 federal PIT expenditures examined in this study, 25 benefited women relatively more, 25 benefited men relatively more, and 10 benefited men and women almost equally, meaning that more than half either reduced or did not worsen income inequality between men and women in 2016. The results, however, underline important differences in the types of measures mostly benefiting each gender. As an illustration, the following table identifies the top five measures for men and women as per the ratios presented in Table 7 regardless of the total cost of each tax expenditure.
| Men | Women |
|---|---|
| Deduction for tradespeople's tool expenses | Canada Child Benefit |
| Rollovers of investments in small businesses | Teacher and Early Childhood Educator School Supply Tax Credit |
| Volunteer Firefighters Tax Credit | Eligible Dependant Credit |
| Non-taxation of income earned by military and police deployed to international operational missions | Child care expense deduction |
| Employee stock option deduction | Non-taxation of Guaranteed Income Supplement and Allowance benefits |
Obviously, identifying the total number of measures mostly benefiting men and women may be seen as partially informative given that total benefit amounts may differ greatly from one measure to another. As previously mentioned, it is preferable not to sum up benefits associated with each tax expenditure because this may not correspond to the total value of benefits associated with that group of tax expenditures. Nonetheless, such an estimate suggests that women benefited from about 55 per cent of the total amount of net federal tax saved due to the presence of these 60 tax measures in 2016, while men benefited from about 45 per cent of this total amount. Excluding CCB and GST/HST Credit payments, the share of total benefits that went to women decreases to about 45 per cent, a proportion that is still slightly higher than their share of pre-tax income.
3.2.2 Impacts on the Male-Female Distribution of Income Among Various Groups
Tables 9 and 10 show the ratios of the share of benefits received by women relative to the share of pre-tax income that they reported in 2016, by age group, family type, and personal and family income group. These ratios make it possible to verify whether the conclusions drawn in the previous section are robust (i.e., remain relatively the same) regardless of the group of men and women considered. The analysis in this section continues with the assumption that the benefits of each tax expenditure only accrue to claimants.
In many cases, it is difficult to draw firm conclusions due to the small number of tax filers from which the ratios are calculated. When a group is small, the results are more likely to be influenced by the presence of outliers and thus, to present significant variations between groups or from one year to another. Therefore, the ratios calculated based on 250 or fewer observations (denoted by [E] in Tables 9 and 10) are not commented on in the present study. It should also be noted that, due to the large number of new statistics produced by gender and other intersecting identity factors, only a limited portion is discussed.
Age Group
Overall, the main findings discussed in the previous section remain unchanged regardless of the age group of tax filers considered. However, for some particular tax expenditures, the overall results do not hold true for all age groups. Notably, the ratios presented in columns 3 to 6 of Table 9 indicate that the overall advantage to men of certain tax expenditures disappears for tax filers under the age of 30. This is the case for the Lifetime Capital Gains Exemption and the non-taxation of workers' compensation benefits, two measures for which the difference in benefit rates between men and women is much less significant among young tax filers.
In addition, the relatively larger benefit to men of non-refundable credits related to the presence of a spouse or common-law partner (i.e., the Spouse or Common-Law Partner Credit and unused credits transferred from a spouse or common-law partner) is more pronounced among senior tax filers. It is also interesting to note that the unused credits transferred from a spouse or common-law partner and pension income splitting among those aged 50 to 64 mostly benefit women. Furthermore, for a few tax expenditures, the gender of the main beneficiary varies by age group. For instance, the Disability Tax Credit is mostly of benefit to men among young tax filers (under 30), while the opposite is true among older tax filers (50 or over).
Lastly, some tax expenditures that recognize expenses incurred to earn employment income (such as the deduction of union and professional dues, the Canada Employment Credit, and tax credits for Canada Pension Plan/Quebec Pension Plan contributions and Employment Insurance/Quebec Parental Insurance Plan premiums) that were previously identified as being to the advantage of women, are of relatively more benefit to men among the senior population. This, is likely due to the larger difference in the employment rate between men and women in that age group. This latter finding also applies to the Working Income Tax Benefit.
Family Type
A review of the share of benefits received by men and women with the same family type suggests that several tax expenditures that appear, on the whole, mostly of benefit to women are only so among tax filers who are in a couple with another tax filer. This is observed for tax expenditures related to the recognition of expenses incurred to earn employment income and the Basic Personal Amount.27 Among sole tax filers (with or without children), men and women benefit relatively equally from these last tax measures. The overall advantage to women of expenditures related to education, the Teacher and Early Childhood Educator School Supply Tax Credit and the CCB is also more pronounced among tax filers who are in a couple.
By contrast, the ratios calculated by family type indicate that the overall advantage to women from benefits related to the non-taxation of Guaranteed Income Supplement and Allowance benefits is only seen among sole tax filers (i.e., who do not live with another tax filer). For tax filers in a couple, this measure seems instead to be of relatively more benefit to men. In addition, the non-taxation of social assistance benefits does not appear as much to the advantage of women when grouping tax filers by family type. Moreover, among sole tax filers with children, women do not necessarily benefit relatively more from the child care expense deduction, as is the case among tax filers in a couple with children.
Table 9
Ratio of the Share of Benefits Received by Women Relative to the Share of Pre-Tax Income That They Report, by Age Group and Family Type, 2016
| Tax expenditures by type | All | Age group | Family type | ||||||
|---|---|---|---|---|---|---|---|---|---|
|
|
|
||||||||
| <30 | 30-49 | 50-64 | 65+ | Sole filer without children | Sole filer with children | In a couple with children | In a couple without children | ||
| Type 1 – Exemptions | |||||||||
| Lifetime Capital Gains Exemption | 0.87 | 1.07 | 0.84 | 0.89 | 0.81 | 0.91 | 0.80[E] | 0.88 | 0.88 |
| Non-taxation of Guaranteed Income Supplement and Allowance benefits | 1.52 | X | X | 2.14 | 1.34 | 1.51 | 1.05[E] | 0.41 | 0.84 |
| Non-taxation of income earned by military and police deployed to international operational missions |
0.27 | 0.28[E] | 0.27 | 0.27[E] | X | 0.32[E] | 0.62[E] | 0.16[E] | 0.32[E] |
| Non-taxation of social assistance benefits | 1.20 | 1.04 | 1.22 | 1.28 | 1.23 | 0.99 | 1.15 | 0.95 | 1.07 |
| Non-taxation of workers' compensation benefits | 0.81 | 1.28 | 0.90 | 0.70 | 0.83 | 0.85 | 0.83 | 1.06 | 0.64 |
| Partial inclusion of capital gains | 0.96 | 0.91 | 0.86 | 0.93 | 0.97 | 1.12 | 0.99 | 0.93 | 0.83 |
| Type 2 – Deductions | |||||||||
| Capital loss carry-overs | 0.80 | 0.79 | 0.70 | 0.75 | 0.83 | 0.93 | 0.79 | 0.56 | 0.81 |
| Deduction of carrying charges incurred to earn income | 0.97 | 0.91 | 0.86 | 0.95 | 1.00 | 1.22 | 0.99 | 0.73 | 0.90 |
| Non capital loss carry-overs | 0.79 | 0.72 | 0.92 | 0.86 | 0.59 | 0.64 | 0.93 | 0.85 | 0.89 |
| Rollovers of investments in small businesses | 0.16 | 0.01[E] | 1.34[E] | 0.76[E] | 0.37[E] | 0.11[E] | X | 0.62[E] | 0.17[E] |
| Child care expense deduction | 1.68 | 1.95 | 1.71 | 1.04 | 0.61[E] | X | 1.01 | 1.91 | X |
| Deduction for clergy residence | 0.40 | 0.42 | 0.35 | 0.47 | 0.35 | 0.79 | 0.85[E] | 0.26 | 0.42 |
| Deduction of allowable business investment losses | 0.54 | 0.49[E] | 0.58 | 0.58 | 0.43 | 0.70 | 0.70[E] | 0.51 | 0.53 |
| Deduction for tradespeople's tool expenses | 0.08 | 0.09 | 0.07[E] | 0.07[E] | X | 0.09 | 0.14[E] | 0.05[E] | 0.06[E] |
| Deduction of other employment expenses | 0.55 | 0.57 | 0.57 | 0.57 | 0.36 | 0.58 | 0.80 | 0.48 | 0.56 |
| Deduction of union and professional dues | 1.07 | 1.07 | 1.23 | 1.21 | 0.91 | 0.93 | 0.99 | 1.17 | 1.16 |
| Disability supports deduction | 1.24 | 1.08[E] | 1.04 | 0.98 | 1.37[E] | 1.28 | 1.09[E] | 0.83[E] | 1.10[E] |
| Employee stock option deduction | 0.35 | 0.45 | 0.36 | 0.39 | 0.16[E] | 0.52 | 0.63 | 0.31 | 0.33 |
| Moving expense deduction | 0.78 | 0.93 | 0.80 | 0.88 | 0.48 | 1.04 | 1.06 | 0.60 | 0.80 |
| Northern Residents Deductions | 0.81 | 0.84 | 0.90 | 0.95 | 0.89 | 0.83 | 1.03 | 0.67 | 0.82 |
| Type 3 – Non-refundable credits | |||||||||
| Adoption Expense Tax Credit | 0.89 | 0.51[E] | 0.91 | 1.02[E] | 0.56[E] | 1.44[E] | 1.16[E] | 0.87 | 1.02[E] |
| Age Credit – for self | 1.28 | X | X | X | 1.19 | 1.46 | 0.93 | 0.59 | 1.16 |
| Canada Employment Credit | 1.13 | 1.06 | 1.16 | 1.21 | 0.88 | 0.96 | 1.02 | 1.25 | 1.25 |
| Charitable Donation Tax Credit | 0.85 | 0.94 | 0.83 | 0.85 | 0.82 | 1.22 | 0.97 | 0.69 | 0.72 |
| Credit for the Basic Personal Amount | 1.19 | 1.10 | 1.19 | 1.25 | 1.16 | 1.06 | 1.04 | 1.30 | 1.27 |
| Disability Tax Credit – for self and for a dependant (excludes unused amounts transferred to a spouse) | 1.09 | 0.81 | 0.97 | 1.13 | 1.13 | 1.30 | 1.07 | 0.80 | 1.01 |
| Dividend gross-up and tax credit | 0.95 | 1.04 | 0.99 | 1.00 | 0.95 | 0.97 | 0.83 | 1.10 | 1.03 |
| Eligible Dependant Credit | 1.89 | 1.94 | 1.94 | 1.78 | 1.42 | 1.02 | 1.09 | 1.91 | 1.38 |
| First-Time Home Buyers' Tax Credit | 0.93 | 0.91 | 0.91 | 1.05 | 0.97 | 0.88 | 1.08 | 0.79 | 1.02 |
| Foreign tax credit | 0.65 | 0.61 | 0.56 | 0.61 | 0.89 | 0.82 | 0.88 | 0.46 | 0.66 |
| Labour-Sponsored Venture Capital Corporations Credit | 0.96 | 0.76 | 0.96 | 1.03 | 0.84 | 0.86 | 0.75 | 0.96 | 1.07 |
| Medical Expense Tax Credit | 1.37 | 1.26 | 1.49 | 1.45 | 1.24 | 1.43 | 1.10 | 1.52 | 1.33 |
| Pension Income Credit – for self | 1.29 | 1.24 | 1.56 | 1.44 | 1.16 | 1.41 | 0.88 | 1.25 | 1.25 |
| Political Contribution Tax Credit | 0.86 | 0.75 | 0.75 | 0.88 | 0.84 | 1.07 | 0.80 | 0.70 | 0.80 |
| Search and Rescue Volunteers Tax Credit | 0.43 | 0.46[E] | 0.46 | 0.46 | 0.25[E] | 0.58 | 0.69[E] | 0.30[E] | 0.40 |
| Spouse or Common-Law Partner Credit | 0.48 | 0.53 | 0.49 | 0.50 | 0.26 | 0.47 | 0.98 | 0.42 | 0.62 |
| Student Loan Interest Credit | 1.47 | 1.44 | 1.47 | 1.51 | 1.19 | 1.23 | 1.18 | 1.71 | 1.64 |
| Tax credit for Canada Pension Plan/Quebec Pension Plan (CPP/QPP) contributions by employed and self-employed persons |
1.06 | 0.98 | 1.08 | 1.13 | 0.86 | 0.91 | 1.00 | 1.11 | 1.20 |
| Non-taxation (exemption) of CPP/QPP contributions by employers | 1.00 | 0.94 | 1.03 | 1.06 | 0.88 | 0.89 | 0.97 | 1.03 | 1.11 |
| Tax credit for Employment Insurance (EI) and Quebec Parental Insurance Plan (QPIP) premiums paid by employed and self-employed persons |
1.08 | 0.99 | 1.10 | 1.16 | 0.86 | 0.93 | 1.01 | 1.12 | 1.21 |
| Non-taxation (exemption) of EI and QPIP premiums paid by employers | 1.02 | 0.96 | 1.04 | 1.09 | 0.83 | 0.91 | 1.00 | 1.04 | 1.14 |
| Tuition Tax Credit – for self or for a dependant | 1.23 | 1.23 | 1.31 | 1.00 | 0.61 | 1.13 | 1.17 | 1.24 | 1.19 |
| Volunteer Firefighters Tax Credit | 0.19 | 0.22 | 0.19 | 0.19 | 0.11[E] | 0.22 | 0.39[E] | 0.14 | 0.20 |
| Unused credits transferred from a spouse or common-law partner | 0.78 | 0.65 | 0.70 | 1.30 | 0.49 | 0.72 | 0.77[E] | 0.73 | 0.87 |
| Home Accessibility Tax Credit | 1.07 | 0.88[E] | 1.00 | 1.22 | 0.99 | 1.57 | 1.09[E] | 0.83 | 0.87 |
| Type 4 – Refundable credits | |||||||||
| Canada Child Benefit | 2.31 | 2.24 | 2.35 | 2.20 | 1.75 | 1.61 | 1.19 | 2.75 | 2.58 |
| Working Income Tax Benefit | 1.21 | 1.15 | 1.32 | 1.11 | 0.88 | 0.95 | 1.19 | 0.75 | 0.92 |
| Goods and Services Tax/Harmonized Sales Tax Credit | 1.36 | 1.22 | 1.45 | 1.32 | 1.34 | 1.15 | 1.18 | 1.28 | 1.07 |
| Refundable Medical Expense Supplement | 1.47 | 1.43 | 1.55 | 1.49 | 1.17 | 1.34 | 1.19 | 1.10 | 1.25 |
| Teacher and Early Childhood Educator School Supply Tax Credit | 1.96 | 2.00 | 2.00 | 1.96 | 1.39[E] | 1.78 | 1.20[E] | 2.18 | 2.18 |
| Other refundable tax credits | 0.59 | 0.72 | 0.66 | 0.57 | 0.35 | 0.62 | 0.83 | 0.59 | 0.57 |
| Other types | |||||||||
| Pension income splitting – total (considers spouses or partners who receive and make the transfer of income and tax withholdings) |
0.75 | 1.82[E] | 0.74 | 1.27 | 0.56 | 0.88 | 0.95[E] | 0.63 | 0.82 |
| [E] Statistics to be use with caution. Notes: Tax filers who report being in a couple, but with a non-filer or a filer that can't be identified in the T1 return data, are identified in this study as sole filers. This explains why there are some sole tax filers who benefit from tax measures related to the presence of a spouse or partner. The methodology employed to identify tax filers with children (e.g., situation on December 31, 2016) also explains the use of certain measures related to the presence of dependants among sole filers or filers without children. Sources: T1 return data, CCB and GST/HST Credit payment data, and the Department of Finance Canada's T1 microsimulation model for the partial inclusion of capital gains, 2016. |
|||||||||
Personal Income and Adjusted Family Income Groups
When the ratios are calculated for tax filers in specific personal and family income quartiles (Table 10), the relative advantage to women of many tax expenditures is seen more at the tails of the income distribution. Notably, for some measures for which an overall advantage for women was noted (e.g., the child care expense deduction, the Eligible Dependant Credit and the CCB), the redistributive impact towards women is more pronounced in the highest pre-tax personal income quartiles (quartiles 3 and 4). For some other measures (such as the Basic Personal Amount, measures related to the recognition of employment and education expenses, the Working Income Tax Benefit, the GST/HST Credit and the Refundable Medical Expense Supplement), the advantage to women is only seen among the highest quartiles. These results suggest that, for these tax expenditures, the redistributive impact towards women generally increases with the tax filer's income, whether personal or family income.
Conversely, while men are found to benefit proportionally more from the pension income splitting at the aggregate level, this advantage does not hold in the lowest income groups of tax filers, where women benefit relatively more.
For a few other measures, the trend in terms of a redistributive impact between genders becomes less clear or is reversed when income groups are accounted for. For instance, while the non-taxation of social assistance benefits appears to be to the advantage of women, this is not the case when the population of tax filers is categorized by income quartiles. Likewise, while neither gender appears to benefit relatively more from the partial inclusion of capital gains or the deduction of carrying charges incurred to earn income, both measures appear to be to the advantage of women when considering tax filers in the same personal income quartile. A comparable result is also observed with regards to capital loss carry-overs: this measure is found to be to the advantage of men at the aggregate level, but to the advantage of women in each of the first three personal income quartiles.[28] Such results underline the importance of considering income categories when analyzing the redistributive impact of the tax system by gender.
It is also interesting to note that, for a few federal PIT measures, the GBA+ results are also sensitive to whether the income groups considered are based on the tax filers' personal or family income. Notably, women with low pre-tax personal incomes tend to benefit mostly from several non-refundable credits which, on the whole, tend to be of relatively more benefit to men (e.g., credits for charitable donations, dividends, foreign tax and political contributions, and unused credits transferred from a spouse or common-law partner). However, that advantage for women does not remain when considering the low-family-income population, which suggests that the majority of women with low personal incomes who benefit mostly from these credits are likely not living in low-income families.
Table 10
Ratio of the Share of Benefits Received by Women Relative to the Share of Pre-Tax Personal Income That They Report, by Personal Tax Filers' Income and Adjusted Family Income Quartiles, 2016
| Tax expenditure by type | All | Personal income | Adjusted family income | ||||||
|---|---|---|---|---|---|---|---|---|---|
|
|
|
||||||||
| Q1 | Q2 | Q3 | Q4 | Q1 | Q2 | Q3 | Q4 | ||
| Type 1 – Exemptions | |||||||||
| Lifetime Capital Gains Exemption | 0.87 | 1.09[E] | 0.87 | 0.98 | 1.06 | 0.41[E] | 0.75 | 0.80 | 0.95 |
| Non-taxation of Guaranteed Income Supplement and Allowance benefits | 1.52 | 1.39 | 1.16 | 1.02 | 1.56 | 1.35 | 1.29 | 1.28 | 1.50 |
| Non-taxation of income earned by military and police deployed to international operational missions |
0.27 | X | 0.55[E] | 0.31[E] | 0.33 | 0.50[E] | 0.07[E] | 0.19[E] | 0.35 |
| Non-taxation of social assistance benefits | 1.20 | 0.81 | 0.90 | 0.91 | 1.01 | 0.94 | 1.00 | 0.93 | 0.99 |
| Non-taxation of workers' compensation benefits | 0.81 | 0.93 | 0.76 | 0.64 | 0.89 | 0.69 | 0.67 | 0.74 | 0.97 |
| Partial inclusion of capital gains | 0.96 | 1.20 | 1.15 | 1.20 | 1.14 | 0.73 | 1.15 | 1.27 | 1.03 |
| Type 2 – Deductions | |||||||||
| Capital loss carry-overs | 0.80 | 1.36 | 1.13 | 1.10 | 0.91 | 1.02 | 1.02 | 1.06 | 0.84 |
| Deduction of carrying charges incurred to earn income | 0.97 | 1.35 | 1.16 | 1.18 | 1.12 | 0.96 | 1.13 | 1.19 | 1.03 |
| Non capital loss carry-overs | 0.79 | 0.91 | 0.83 | 0.81 | 0.85 | 0.62 | 0.79 | 0.84 | 0.83 |
| Rollovers of investments in small businesses | 0.16 | 0.87[E] | 0.63[E] | 1.39[E] | 0.11[E] | 0.85[E] | 1.63[E] | 0.83[E] | 0.10[E] |
| Child care expense deduction | 1.68 | 1.15 | 1.30 | 1.49 | 1.94 | 1.34 | 1.53 | 1.64 | 1.81 |
| Deduction for clergy residence | 0.40 | 0.84[E] | 0.62 | 0.43 | 0.41 | 0.21[E] | 0.21 | 0.36 | 0.53 |
| Deduction of allowable business investment losses | 0.54 | 0.83[E] | 0.84 | 0.75 | 0.59 | 0.54[E] | 0.73 | 0.69 | 0.55 |
| Deduction for tradespeople's tool expenses | 0.08 | X | 0.16[E] | 0.07 | 0.06[E] | 0.21[E] | 0.10 | 0.07[E] | 0.06[E] |
| Deduction of other employment expenses | 0.55 | 0.86 | 0.76 | 0.63 | 0.60 | 0.65 | 0.62 | 0.54 | 0.58 |
| Deduction of union and professional dues | 1.07 | 0.92 | 1.06 | 1.16 | 1.16 | 0.89 | 1.05 | 1.05 | 1.15 |
| Disability supports deduction | 1.24 | X | 1.00[E] | 1.28 | 1.41 | 0.69[E] | 1.25[E] | 1.35 | 1.28 |
| Employee stock option deduction | 0.35 | 0.37[E] | 0.69[E] | 0.94 | 0.42 | 0.26[E] | 0.85 | 0.77 | 0.38 |
| Moving expense deduction | 0.78 | 0.92 | 0.89 | 0.87 | 0.84 | 0.85 | 0.79 | 0.77 | 0.82 |
| Northern Residents Deductions | 0.81 | 0.93 | 0.92 | 0.93 | 0.85 | 0.82 | 0.93 | 0.86 | 0.80 |
| Type 3 – Non-refundable credits | |||||||||
| Adoption Expense Tax Credit | 0.89 | X | 1.16[E] | 0.95[E] | 0.94 | X | 0.76[E] | 0.85[E] | 0.99 |
| Age Credit – for self | 1.28 | 1.44 | 1.07 | 0.89 | 0.94 | 1.20 | 1.16 | 1.16 | 1.35 |
| Canada Employment Credit | 1.13 | 0.96 | 1.01 | 1.03 | 1.08 | 0.91 | 1.00 | 1.09 | 1.21 |
| Charitable Donation Tax Credit | 0.85 | 1.28 | 1.06 | 0.98 | 0.89 | 0.91 | 1.00 | 0.98 | 0.83 |
| Credit for the Basic Personal Amount | 1.19 | 1.03 | 1.02 | 1.01 | 1.10 | 0.94 | 1.06 | 1.14 | 1.25 |
| Disability Tax Credit – for self and for a dependant (excludes unused amounts transferred to a spouse) |
1.09 | 1.22 | 1.03 | 0.97 | 1.00 | 0.87 | 1.04 | 1.03 | 1.09 |
| Dividend gross-up and tax credit | 0.95 | 1.40 | 0.95 | 0.95 | 1.15 | 0.75 | 0.77 | 0.94 | 1.09 |
| Eligible Dependant Credit | 1.89 | 1.44 | 1.52 | 1.66 | 2.00 | 1.63 | 1.73 | 1.71 | 1.49 |
| First-Time Home Buyers' Tax Credit | 0.93 | 0.90 | 0.93 | 0.86 | 0.91 | 0.78 | 0.86 | 0.90 | 0.96 |
| Foreign tax credit | 0.65 | 1.32 | 1.05 | 1.05 | 0.75 | 0.64 | 0.84 | 0.91 | 0.69 |
| Labour-Sponsored Venture Capital Corporations Credit | 0.96 | 1.25[E] | 1.19 | 1.03 | 0.94 | 0.89 | 0.93 | 0.92 | 1.04 |
| Medical Expense Tax Credit | 1.37 | 1.27 | 1.12 | 1.16 | 1.41 | 0.99 | 1.12 | 1.39 | 1.50 |
| Pension Income Credit – for self | 1.29 | 1.48 | 1.16 | 0.99 | 1.18 | 1.11 | 1.18 | 1.23 | 1.35 |
| Political Contribution Tax Credit | 0.86 | 1.31 | 1.01 | 0.89 | 0.89 | 0.69 | 0.93 | 0.92 | 0.88 |
| Search and Rescue Volunteers Tax Credit | 0.43 | 1.00[E] | 0.55[E] | 0.41 | 0.37 | 0.66[E] | 0.48[E] | 0.38 | 0.45 |
| Spouse or Common-Law Partner Credit | 0.48 | 0.48 | 0.51 | 0.49 | 0.39 | 0.50 | 0.50 | 0.39 | 0.29 |
| Student Loan Interest Credit | 1.47 | 1.15 | 1.19 | 1.30 | 1.59 | 1.10 | 1.29 | 1.43 | 1.60 |
| Tax credit for Canada Pension Plan/Quebec Pension Plan (CPP/QPP) contributions by employed and self-employed persons |
1.06 | 0.93 | 1.00 | 1.04 | 1.08 | 0.90 | 0.96 | 1.00 | 1.16 |
| Non-taxation (exemption) of CPP/QPP contributions by employers | 1.00 | 0.94 | 0.98 | 1.01 | 1.04 | 0.86 | 0.93 | 0.96 | 1.09 |
| Tax credit for Employment Insurance (EI) and Quebec Parental Insurance Plan (QPIP) premiums paid by employed and self-employed persons |
1.08 | 0.95 | 1.02 | 1.05 | 1.08 | 0.92 | 0.98 | 1.02 | 1.17 |
| Non-taxation (exemption) of EI and QPIP premiums paid by employers | 1.02 | 0.95 | 1.02 | 1.03 | 1.05 | 0.92 | 0.97 | 0.98 | 1.10 |
| Tuition Tax Credit – for self or for a dependant | 1.23 | 0.96 | 0.98 | 1.10 | 1.22 | 0.99 | 1.10 | 1.22 | 1.20 |
| Volunteer Firefighters Tax Credit | 0.19 | 0.50[E] | 0.31 | 0.18 | 0.12 | 0.26[E] | 0.22 | 0.16 | 0.18 |
| Unused credits transferred from a spouse or common-law partner | 0.78 | 1.24 | 0.66 | 0.66 | 0.81 | 0.72 | 0.67 | 0.79 | 0.75 |
| Home Accessibility Tax Credit | 1.07 | 1.39[E] | 1.12 | 0.97 | 1.13 | 0.75[E] | 1.11 | 1.05 | 1.09 |
| Type 4 – Refundable credits | |||||||||
| Canada Child Benefit | 2.31 | 1.60 | 1.67 | 1.92 | 2.68 | 1.71 | 1.97 | 2.27 | 2.57 |
| Working Income Tax Benefit | 1.21 | 0.77 | 0.99 | 1.18 | 1.10 | 0.90 | 1.18 | 1.44 | 1.57 |
| Goods and Services Tax/Harmonized Sales Tax Credit | 1.36 | 0.98 | 1.06 | 1.28 | 1.57 | 1.04 | 1.12 | 1.41 | 2.06 |
| Refundable Medical Expense Supplement | 1.47 | 0.98 | 1.06 | 1.28 | 1.57 | 1.08 | 1.28 | 1.50 | 1.58 |
| Teacher and Early Childhood Educator School Supply Tax Credit | 1.96 | 1.26 | 1.50 | 1.79 | 2.33 | 1.31 | 1.75 | 1.95 | 2.13 |
| Other refundable tax credits | 0.59 | 0.59 | 0.70 | 0.63 | 0.65 | 0.57 | 0.60 | 0.56 | 0.64 |
| Other types | |||||||||
| Pension income splitting – total (considers spouses or partners who receive and make the transfer of income and tax withholdings) | 0.75 | 1.50 | 1.12 | 0.00 | 0.08 | 1.47 | 1.05 | 0.86 | 0.33 |
| Sources: T1 return data, CCB and GST/HST Credit payment data, and the Department of Finance Canada's T1 microsimulation model for the partial inclusion of capital gains, 2016 | |||||||||
This study confirms that the progressive nature of the federal PIT system reduces pre-tax income inequality that exists between genders, as the share of after-tax income held by women is higher than their share of income before the application of the tax system. The analysis of the impacts of the broad components of the 2016 federal PIT system indicates that its overall redistributive impact towards women was primarily due to refundable credits, followed by the progressive tax rate structure. Exemptions and non-refundable credits also played a redistributive role, albeit more modest. However, this was not necessarily the case for the set of adjustments made to tax filers' incomes for tax purposes, nor for the set of deductions which tended to benefit men relatively more.
A more detailed analysis of the allocation of benefits for each tax expenditure suggests that certain measures more strongly contribute to the redistribution of income between men and women, the CCB in particular. Overall, more than half of the individual tax expenditures examined in this GBA+ were found to improve, or not worsen, the distribution of income between men and women in 2016.
While some tax expenditures were found to favour particular groups of tax filers (men or women, or specific groups of men and women), it is important to recall that the tax system has various objectives and that a tax expenditure cannot be assessed entirely on the impact it has on the allocation of income between groups. A thorough process for assessing tax measures requires the consideration of a much broader range of possible effects than the ones studied in the current GBA+. It is also important to note that the tax system is only one of the tools at the Government's disposal for the promotion of gender equality.
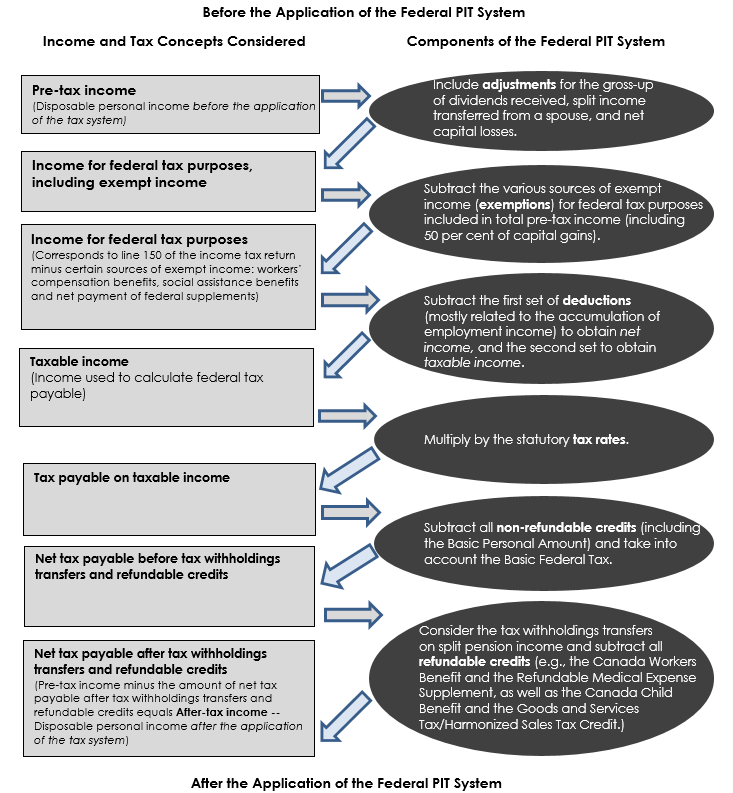
List of Tax Expenditures Excluded from the Analysis and the Main Reason for Their Exclusion
| Tax expenditures by type | Main reason for exclusion |
|---|---|
| Type 1 – Exemptions | |
| $200 capital gains exemption on foreign exchange transactions | No data is available on claimants or beneficiaries |
| Capital gains exemption on personal-use property | No data is available on claimants or beneficiaries |
| Deduction for certain contributions by individuals who have taken vows of perpetual poverty | No data is available on claimants or beneficiaries |
| Exemption for international shipping and aviation by non-residents | Main beneficiaries other than resident individuals |
| Exemptions from non-resident withholding tax | Main beneficiaries other than resident individuals |
| Exemption of scholarship, fellowship and bursary income | Available data do not permit breakdown of beneficiaries by gender |
| Non-taxation of allowances for diplomats and other government employees posted abroad | Available data do not permit breakdown of beneficiaries by gender |
| Non-taxation of allowances for members of legislative assemblies and certain municipal officers | Available data do not permit breakdown of beneficiaries by gender |
| Non-taxation of benefits from private health and dental plans | Available data do not permit breakdown of beneficiaries by gender |
| Non-taxation of benefits in respect of home relocation loans | Available data do not permit breakdown of beneficiaries by gender |
| Non-taxation of capital dividends | No data is available on claimants or beneficiaries |
| Non-taxation of capital gains on donations of cultural property | Available data do not permit breakdown of beneficiaries by gender |
| Non-taxation of capital gains on donations of ecologically sensitive land | Available data do not permit breakdown of beneficiaries by gender |
| Non-taxation of capital gains on donations of publicly listed securities | Available data do not permit breakdown of beneficiaries by gender |
| Non-taxation of capital gains on principal residences | Available data do not permit breakdown of beneficiaries by gender |
| Non-taxation of certain non-monetary employment benefits | No data is available on claimants or beneficiaries |
| Non-taxation of certain veterans' benefits | Available data do not permit breakdown of beneficiaries by gender |
| Non-taxation of investment income on certain amounts received as damages in respect of personal injury or death |
No data is available on claimants or beneficiaries |
| Non-taxation of lottery and gambling winnings | No data is available on claimants or beneficiaries |
| Non-taxation of non-profit organizations | Main beneficiaries other than resident individuals |
| Non-taxation of personal property of status Indians and Indian bands situated on reserve | No data is available on claimants or beneficiaries |
| Non-taxation of provincial assistance for venture investments in small businesses | No data is available on claimants or beneficiaries |
| Non-taxation of RCMP pensions and other compensation in respect of injury, disability or death | Available data do not permit breakdown of beneficiaries by gender |
| Non-taxation of registered charities | Main beneficiaries other than resident individuals |
| Non-taxation of strike pay | No data is available on claimants or beneficiaries |
| Non-taxation of up to $10,000 of death benefits | Available data do not permit breakdown of beneficiaries by gender |
| Tax-free amount for emergency services volunteers | Available data do not permit breakdown of beneficiaries by gender |
| Tax-Free Savings Account | Available data do not permit breakdown of beneficiaries by gender |
| Types 2 – Deductions | |
| Apprentice vehicle mechanics' tools deduction | Available data do not permit breakdown of beneficiaries by gender |
| Deductibility of certain costs incurred by musicians | Available data do not permit breakdown of beneficiaries by gender |
| Deductibility of expenses by employed artists | Available data do not permit breakdown of beneficiaries by gender |
| Deduction for self-employed artists | No data is available on claimants or beneficiaries |
| Deduction for tuition assistance for adult basic education | Available data do not permit breakdown of beneficiaries by gender |
| Flow-through share deductions | Available data do not permit breakdown of beneficiaries by gender |
| Partial deduction of and partial input tax credits for meals and entertainment | Available data do not permit breakdown of beneficiaries by gender |
| Patronage dividends paid as shares by agricultural cooperatives | Available data do not permit breakdown of beneficiaries by gender |
| Type 3 – Non-refundable credits | |
| Apprenticeship Job Creation Tax Credit | Available data do not permit breakdown of beneficiaries by gender |
| Atlantic Investment Tax Credit | Available data do not permit breakdown of beneficiaries by gender |
| Investment Tax Credit for Child Care Spaces | Available data do not permit breakdown of beneficiaries by gender |
| Logging Tax Credit | Available data do not permit breakdown of beneficiaries by gender |
| Mineral Exploration Tax Credit for flow-through share investors | Available data do not permit breakdown of beneficiaries by gender |
| Scientific Research and Experimental Development Investment Tax Credit | Available data do not permit breakdown of beneficiaries by gender |
| Other types | |
| Accelerated capital cost allowance for clean energy generation equipment | No data is available on claimants or beneficiaries |
| Accelerated capital cost allowance for computer equipment | No data is available on claimants or beneficiaries |
| Accelerated capital cost allowance for liquefied natural gas facilities | No data is available on claimants or beneficiaries |
| Accelerated capital cost allowance for manufacturing or processing machinery and equipment | No data is available on claimants or beneficiaries |
| Accelerated capital cost allowance for mining and oil sands assets | No data is available on claimants or beneficiaries |
| Accelerated capital cost allowance for vessels | No data is available on claimants or beneficiaries |
| Accelerated deductibility of Canadian Renewable and Conservation Expenses | No data is available on claimants or beneficiaries |
| Accelerated deductibility of some Canadian Exploration Expenses | No data is available on claimants or beneficiaries |
| Cash basis accounting | No data is available on claimants or beneficiaries |
| Deductibility of contributions to a qualifying environmental trust | No data is available on claimants or beneficiaries |
| Deductibility of costs of capital assets and eligibility for investment tax credits before asset is put in use | No data is available on claimants or beneficiaries |
| Deductibility of countervailing and anti-dumping duties when paid | No data is available on claimants or beneficiaries |
| Deferral for asset transfers to a corporation and corporate reorganizations | No data is available on claimants or beneficiaries |
| Deferral of capital gains through intergenerational rollovers of family farms or fishing businesses | No data is available on claimants or beneficiaries |
| Deferral of capital gains through transfers to a spouse, spousal trust or alter ego trust | No data is available on claimants or beneficiaries |
| Deferral of income from destruction of livestock | Available data do not permit breakdown of beneficiaries by gender |
| Deferral of income from grain sold through cash purchase tickets | Available data do not permit breakdown of beneficiaries by gender |
| Deferral of income from sale of livestock in a region of drought, flood or excessive moisture | No data is available on claimants or beneficiaries |
| Deferral through 10-year capital gain reserve Deferral through five-year capital gain reserve | Available data do not permit breakdown of beneficiaries by gender |
| Deferral through five-year capital gain reserve | Available data do not permit breakdown of beneficiaries by gender |
| Deferral through rollover of capital gains and capital cost allowance recapture in respect of dispositions of land and buildings | No data is available on claimants or beneficiaries |
| Deferral through rollover of capital gains and capital cost allowance recapture in respect of involuntary dispositions | No data is available on claimants or beneficiaries |
| Deferral through use of billed-basis accounting by professionals and professional corporations | No data is available on claimants or beneficiaries |
| Deferred Profit-Sharing Plans | No data is available on claimants or beneficiaries |
| Earned depletion | No data is available on claimants or beneficiaries |
| Employee benefit plans | No data is available on claimants or beneficiaries |
| Expensing of advertising costs | No data is available on claimants or beneficiaries |
| Expensing of current expenditures on scientific research and experimental development | No data is available on claimants or beneficiaries |
| Expensing of employee training costs | No data is available on claimants or beneficiaries |
| Expensing of purchases of capital equipment used for scientific research and experimental development | No data is available on claimants or beneficiaries |
| Holdback on progress payments to contractors | No data is available on claimants or beneficiaries |
| Non-deductibility of advertising expenses in foreign media | No data is available on claimants or beneficiaries |
| Pooled Registered Pension Plans | Registered plans |
| Quebec Abatement | Main beneficiaries other than resident individuals |
| Reclassification of expenses under flow-through shares | Available data do not permit breakdown of beneficiaries by gender |
| Registered Disability Savings Plans | Registered plans |
| Registered Education Savings Plans | Registered plans |
| Registered Pension Plans | Registered plans |
| Registered Retirement Savings Plans | Registered plans |
| Saskatchewan Pension Plan | Registered plan |
| Taxation of capital gains upon realization | No data is available on claimants or beneficiaries |
| Tax treatment of alimony and maintenance payments | Available data do not permit breakdown of beneficiaries by gender |
| Tax treatment of farm savings accounts (AgriInvest and Agri-Québec) | No data is available on claimants or beneficiaries |
| Tax treatment of investment income from life insurance policies | Available data do not permit breakdown of beneficiaries by gender |
| Transfer of income tax points to provinces | Main beneficiaries other than resident individuals |
Burlock, Amanda and Melissa Moyser. "Time Use: Total Work Burden, Unpaid Work, and Leisure," Statistics Canada, Women in Canada: A Gender-Based Statistical Report, July 30, 2018.
Canada Revenue Agency. T1 Final Statistics, 2017 edition (2016 tax year).
Cottet, Sophie, Marion Monnet and Lucile Romanello. Assessing the Gender Impact of Tax and Benefit Reforms, Institut des Politiques Publiques, IPP Report No. 14, March 2016.
Department of Finance Canada. "Distributional Impact of the Federal Personal Income Tax System and Refundable Credits: Analysis by Income, Sex, Age and Family Status,"Tax Expenditures and Evaluations 2011, January 2012.
Department of Finance Canada. Report on Federal Tax Expenditures 2018, March 2018.
Feltham, Glenn and Macnaughton, Alan, "Who Benefited from the Deduction-Inclusion Regime for Taxing Child Support?", Canadian Tax Journal / Revue Fiscale Canadienne, (1999) Vol. 47, No. 6 / no 6, p. 1479-1503.
Fox, Dan and Melissa Moyser. "The Economic Well-Being of Women in Canada," Statistics Canada, Women in Canada: A Gender-Based Statistical Report, May 16, 2018.
Government of Canada. Budget 2018,Equality + Growth: A Strong Middle Class, February 27, 2018.
Government of Canada, Department of Justice, Spousal Support Advisory Guidelines, July 2008.
Government of Quebec. Bilan de la mise en œuvre du plan d'action en matière d'analyse différenciée selon les sexes, November 2015.
International Development Research Centre. Taxation and Gender Equity: A Comparative Analysis of Direct and Indirect Taxes in Developing and Developed Countries, edited by Caren Grown and Imraan Valodia, 318 pages.
Kabouchi, Joelle. "Gender-Based Tax Reform," Canadian Tax Focus, Canadian Tax Foundation, Volume 7, Number 2, 2017.
Lahey, Kathleen A. "Uncovering Women in Taxation: The Gender Impact of Detaxation, Tax Expenditures, and Joint Tax/Benefit Units," Osgoode Hall Law Journal 52.2: 427-459, winter 2015.
Lahey, Kathleen A. "The Alberta Disadvantage: Gender, Taxation, and Income Inequality," Parkland Institute, March 2015.
Lahey, Kathleen A. Tax/Transfer Policy and Sex Equality: What Australia, Canada, and UK Should Learn From Experience, presentation at the Gender Equality in Australia's Tax and Transfer System Workshop, Gender Institute and Tax Transfer Policy Institute, ANU, Canberra, ACT, unpublished, November 4, 2015.
Lahey, Kathleen A. "Gender, Taxation and Equality in Developing Countries: Issues and Policy Recommendations," Discussion Paper, UN Women, April 2018.
MacDonald, David. "Are Tax Loopholes Sexist? The Gender Distribution of Federal Tax Expenditures", Canadian Centre for Policy Alternatives, March 2019.
Moyser, Melissa. "Women and Paid Work," Statistics Canada, Women in Canada: A Gender-Based Statistical Report, March 8, 2017.
Oñati International Institute for the Sociology of Law. Challenging Gender Inequality in Tax Policy Making: Comparative Perspectives, edited by Kim Brooks, Asa Gunnarson, Lisa Philipps and Maria Wersig, 2011, 306 pages.
Philipps, Lisa. "Gendering the Analysis of Tax Expenditures: Bridging Two Solitudes in Canadian Fiscal Policy," Osgoode Hall Law School, unpublished, spring 2018.
Sinha, Maire. "Portrait of Caregivers, 2012," Statistics Canada, September 2013.
Statistics Canada. "Does Education Pay? A Comparison of Earnings by Level of Education in Canada and Its Provinces and Territories," Census in Brief, November 29, 2017.
Statistics Canada. Canadian Megatrends: The Surge of Women in the Workforce, December 17, 2015.
Statistics Canada. Data tables, 2016 Census, "Visible Minority (15), Income Sources and Taxes (16),… – 25 % Sample Data."
Suzie St-Cerny. "La fiscalité québécoise et l'utilisation des mesures fiscales destinés aux particuliers," study prepared for the Commission d'examen sur la fiscalité québécoise, Chaire en fiscalité et en finances publiques, Université de Sherbrooke, 37 pages, October 2014.
Vincent, Carole, Suzie St-Cerny and Luc Godbout."La fiscalité est-elle neutre par rapport au sexe? Une analyse différenciée selon le sexe des mesures fiscales," research paper 2017-06, Chaire en fiscalité et en finances publiques, Université de Sherbrooke, 46 pages, June 2017.
Vincent, Carole, Suzie St-Cerny and Luc Godbout. "Lefractionnement du revenu de pension : Fonctionnement, enjeux et pistes de réflexion," research paper 2019-02, Chaire en fiscalité et en finances publiques, Université de Sherbrooke, 45 pages, February 2019.
1 The analysis presented in this study was prepared by Dominique Fleury, Economist, Tax Policy Branch, Department of Finance Canada. Enquiries regarding Department of Finance publications can be sent to finpub@canada.ca.
2 Division 9 of Part 4 of Bill C-86 (A second Act to implement certain provisions of the budget tabled in Parliament on February 27, 2018 and other measures) enacted the Canadian Gender Budgeting Act.
3 Distributional Impact of the Federal Personal Income Tax System and Refundable Credits: Analysis by Income, Sex, Age and Family Status. Tax Expenditures Report 2011, Department of Finance Canada.
4 2016 was the most recent year for which complete tax data were available at the time the study was conducted. In 2016, the federal statutory PIT rates were 15 per cent, 20.5 per cent, 26 per cent, 29 per cent and 33 per cent.
5 The provincial/territorial tax systems are not taken into account in this study. The study covers all federal refundable tax credits that are delivered through the PIT system, including the CCB, the GST/HST Credit and the rebate to employees and partners (though these last two measures are categorized as GST measures in this report). It also covers the Part XII.2 trust tax credit that individuals could claim in respect of certain income received from trusts and on which Part XII.2 tax was paid by trusts.
6 In the T1 return data, each record is assigned a code which represents the sex of the tax filer. The Canada Revenue Agency assigns the code by matching the social insurance number (SIN) reported on the tax return to the SIN master file, which includes the sex of every person who has received a SIN.
7 While information is available in T1 return data on deductible contributions made to, and taxable withdrawals made from, registered plans, no information is available on investment income earned (which is non-taxable) in such plans.
8 Gender identity recognizes that individuals may have perceptions of their own gender, which is not necessarily binary (man or woman) and/or correlated with their sex or biological gender attributed at birth. In this study, the term "gender" refers to the sex or biological gender attributed at birth based on available data.
9 Ways to make better use of available data and overcome existing data limitations will continue to be explored to improve future GBA+ of tax expenditures.
10 Pre-tax income includes all income for federal tax purposes,i with the following adjustments: a) plus the non-taxable portion of capital gains;ii b) less the gross-up of dividends received;iii c) less the split income amounts transferred from a spouse; and d) less the net capital losses incurred during the year and those carried over from prior years.
i Income for federal tax purposes corresponds to line 150 of the federal income tax return. In addition to taxable employment and investment income, it includes some government transfers (i.e., those reported in the T1 return as well as support payments received from a former spouse when this amount is deductible by the payers).Some other sources of exempt income, such as all capital gains realized on the sale of a principal residence, investment income in a Tax-Free Savings Account, scholarships and lottery winnings, cannot be taken into account in total pre-tax income, as they are not reported on the PIT return and it is not possible to produce reliable estimates of these amounts for each tax filer. GST/HST Credit or Canada Child Tax Benefit payments received in 2016 are also excluded from 2016 taxable income.
ii Under current federal tax legislation, 50 per cent of capital gains are taxable (the other 50 per cent are exempt).
iii In 2016, the calculation of income for federal tax purposes included income from dividends paid by corporations grossed-up by a factor of 1.38 for eligible dividends and by a factor of 1.17 for other dividends.
11 An analysis by quartile divides the income distribution into four groups. The first group, referred to as the first or bottom quartile, includes the 25 per cent of the population with the lowest incomes, while the last or top quartile includes the 25 per cent of the population with the highest incomes.
12 Dan Fox and Melissa Moyser, "The Economic Well-Being of Women in Canada," Statistics Canada, 2018.
13 For CCB purposes, when both parents live together, the female parent is usually considered to be primarily responsible for the care of the child and is therefore the parent who must apply for the credit.
14 In this study, exemptions cover amounts not includable in total income as well as amounts that, while includable in total income, are deductible in determining net income or taxable income.
15 See footnote 10 for a definition of pre-tax income.
16See section 3.2.1 (Other Types) for more information on tax withholdings transfers.
17 For all PIT measures except refundable credits, the number of beneficiaries and the total amount of benefits differ from the number of claimants and the total amounts of claims since amounts claimed by tax filers are recorded at their full value by the Canada Revenue Agency, regardless of whether they are eligible or not. The amounts claimed can only serve as a proxy for the actual amount of benefits received for each of the tax expenditures considered
18 Philipps (2018) uses a similar indicator based on the total amount claimed by tax filers relative to their total income. St-Cerny (2014) suggests that alternative indicators may also be used to determine the main beneficiaries from tax expenditures. For instance, MacDonald (2019) compares the share of total benefits that goes to men or women to the proportion that this group represents among all tax filers and concludes, on the basis of this indicator, that a smaller number of measures benefit women more. However, the use of this indicator implies that all groups of tax filers should benefit equally from the tax savings resulting from tax expenditures, irrespective of their level of pre-tax income (St-Cerny, 2014).
19 With the following exceptions: the calculation of the number of beneficiaries of the partial inclusion of capital gains because, assuming an increase from 50 per cent to 100 per cent in the amount of taxable capital gains, the allowable Lifetime Capital Gains Exemption would most likely be increased to 100 per cent; the inclusion of the Universal Child Care Benefit in an eligible dependant's income (repealed) because, without the inclusion, the dependant's income level used to determine eligibility for the Eligible Dependant Credit is lower; and the Age Credit and the Medical Expense Tax Credit, for which eligibility and amounts are based on the tax filer's net income, an income concept that depends on the presence or absence of certain other tax expenditures.
20 Annex B provides a list of PIT expenditures that are not part of this GBA+ and the main reason for their exclusion.
21 A measure is considered to "benefit women relatively more" if their share of its total benefits is greater than their share of reported pre-tax income. For simplicity, the expressions "mostly benefits" and "to the advantage of" are also employed to denote such an outcome. Given the state of the male-female distribution of pre-tax income, a measure that "is to the advantage of women" can also be interpreted as a measure that "has a redistributive impact towards women" or a measure that "reduces income inequality between men and women."
22 In this study, the benefits of the Disability Tax Credit (as well as of the Age Credit, Family Caregiver Tax Credit (repealed), Pension Income Credit and Tuition Tax Credit), only consider the benefits related to the portion of the credit that tax filers claim for themselves or their dependants. The unused portion that is transferrable to the spouse or common-law partner is considered separately in the "Unused credits transferred from a spouse or common-law partner" measure.
23 Government of Canada, Department of Justice, Spousal Support Advisory Guidelines, July 2008.
24 Step 5 of the Canada Revenue Agency's Form T1032, Joint Election to Split Pension income.
25 Vincent, Carole, Suzie St-Cerny and Luc Godbout. "Le fractionnement du revenu de pension : Fonctionnement, enjeux et pistes de réflexion," research paper 2019-02, Chaire en fiscalité et en finances publiques, Université de Sherbrooke, February 2019.
26 The federal PIT system includes a certain number of measures that can be transferred or shared between family members, and some measures for which family income is used to determine entitlement. For such measures, a prior negotiation process within the couple could lead to the tax expenditure being claimed in the tax return of the highest or lower-income spouse or partner and/or to the attribution of ex-post benefits to both spouses or partners. Further sensitivity analysis regarding the distribution of resources within couples would be considered in future research.
27 This also appears to be the case for the Eligible Dependant Credit. However, as tax filers are not entitled to claim this credit when in a couple, this result is based on a small particular number of cases which presumably experienced a separation during the tax year.
28 These kinds of results may not appear intuitive at first glance. However, the results are based on an indicator (ratio) that is sensitive to multiple factors, notably the proportion of tax filers, the proportion of claimants who benefit from a measure, as well as the total amounts of pre-tax income reported and benefits received within each group. The multiplicity of factors that are captured by the ratio explains apparent counter-intuitive results.