
Report on Federal Tax Expenditures - Concepts, Estimates and Evaluations 2021: part 8
How Responsive Are R&D Expenditures to Tax IncentivesFootnote 1
1. Introduction
Government intervention in the provision of public goods is justified on the grounds that private spending falls below the socially desirable level in the presence of externalities. In the context of business spending on research and development (R&D), externalities occur through knowledge spillover effects. If firms cannot capture the social value of increased knowledge – that is, if the social return on R&D is higher than its private return – then, in the absence of government support, firms will perform less R&D than is optimal.
This rationale underpins the decision by many countries, including Canada, to offer R&D subsidies. About 80% of Canada’s support for R&D is delivered in the form of tax incentives,Footnote 2 which at the federal level is through the Scientific Research and Experimental Development (SR&ED) Program. The SR&ED Program provides broad-based financial support for R&D performed in Canada through immediate deductibility of qualifying expenditures and an investment tax credit (ITC). The ITC rate is enhanced for Canadian-controlled private corporations (CCPCs) with up to $3 million per year of qualified expenditures (henceforth, “small” firms). Some 26,000 businesses and individuals benefited from $2.8 billion of assistance from the SR&ED ITC in 2018.Footnote 3 Several provinces also provide similar tax incentives to support business R&D, generally following the federal program but with varying rates.Footnote 4
However, the extent to which tax incentives are effective in encouraging businesses to conduct additional R&D remains an active area of research. To assess the responsiveness of R&D expenditures by small and large firms to the SR&ED ITC, this study estimates the elasticity of R&D expenditures with respect to the user cost of capital in Canada using T2 corporate tax return data from 2000 to 2016. The study focuses on two components of total R&D spending, namely, expenditures on wages and materials, while the identification strategy exploits variation in the user cost of capital brought about by changes to the federal and provincial SR&ED credit rates, and changes to the corporate income tax (CIT) rate. In line with the existing literature (e.g. OECD, 2016; Agrawal et al., 2020; Parsons and Phillips, 2007), the results suggest that the SR&ED ITC is effective in stimulating additional business spending on R&D in Canada, in particular among small firms. Moreover, firms in the manufacturing sector are found to be the most responsive.
The remainder of the study is organized as follows. Section 2 provides an overview of the SR&ED Program parameters, and Section 3 describes trends in claimed SR&ED expenditures over the sample period. Section 4 reviews the existing literature on the effectiveness of R&D subsidies. Section 5 describes the data and methodology used in estimation. Section 6 presents and discusses estimation results. Section 7 adds concluding remarks.
2. Overview of the SR&ED Program
The SR&ED Program is the single largest federal program supporting business R&D in Canada. The federal government has provided tax assistance for R&D since 1944, and the SR&ED Program in its current form was introduced in 1994. The overview provided in this section pertains to the 2000-2016 period of analysis covered in this study. Subsequently, Budget 2019 announced the repeal of the use of taxable income as a factor in determining a CCPC’s annual expenditure limit for the purpose of the enhanced SR&ED credit, for taxation years ending after March 19, 2019.Footnote 5
Components, Rates and Limits (2016)
The main component of the SR&ED Program is an investment tax credit on eligible SR&ED expenditures:
- The general SR&ED investment tax credits are available to all businesses at a rate of 15% on eligible SR&ED expenditures and are non-refundable. Unused investment tax credits can be carried back up to three years and carried forward up to 20 years to be applied against taxes payable in those years.
- CCPCs have access to an enhanced rate of 35% on their first $3 million per year of qualified expenditures. This $3 million “expenditure limit” is gradually reduced when taxable income and taxable capital are within a certain “phase-out range”. Specifically, the expenditure limit is reduced when previous-year taxable income exceeds $500,000 or previous-year taxable capital exceeds $10 million. The expenditure limit is completely phased out when previous-year taxable income exceeds $800,000 or previous-year taxable capital exceeds $50 million.
- SR&ED tax credits earned at the enhanced rate of 35% are fully refundable. For CCPCs, except those within the phase-out range, 40% of the value of the general SR&ED tax credits earned on expenditures in excess of the expenditure limit is refundable (that is, for firms that have insufficient taxable income to use all their SR&ED tax credits, unused credits can be refunded up to 40%).
These program parameters are summarized in Table 1.
| Business Type | Credit Rate | Refundability Rate |
|---|---|---|
| Unincorporated businesses | 15 | 40 |
| CCPC that is a qualifying corporation1: | ||
Expenditures up to the expenditure limit2 |
35 | 100 |
Expenditures over the expenditure limit |
15 | 40 |
| CCPC that is not a qualifying corporation but with prior-year taxable income less than $800,000 and prior-year taxable capital less than $50 million: | ||
Expenditures up to the reduced expenditure limit |
35 | 100 |
Expenditures over the expenditure limit |
15 | 0 |
| CCPCs with prior-year taxable income over $800,000 or with prior-year taxable capital employed in Canada over $50 million and non-CCPCs | 15 | 0 |
|
1 A qualifying corporation is a corporation with prior-year taxable income that does not exceed its qualifying income limit, calculated as $500,000 x ($40,000,000-(taxable capital-$10,000,000)/$40,000,000). 2 The expenditure limit is $3 million per annum for taxation years that end on or after February 26, 2008. The expenditure limit for CCPCs is phased out for prior-year taxable income between $500,000 and $800,000 and for prior-year taxable capital employed in Canada between $10 million and $50 million. |
||
The program also allows eligible SR&ED expenditures to be fully deducted for income tax purposes in the year they are incurred, even though such expenditures give rise to new knowledge, technology and other intangible assets of a capital nature that are expected to generate benefits over multiple years, which would otherwise be required to be depreciated over their useful economic life.
Eligible Activities and Expenditures
Three broad categories of activity eligible for the SR&ED tax incentives are defined in subsection 248(1) of the Income Tax Act: basic research, applied research, and experimental development.Footnote 6 SR&ED tax incentives generally do not cover activities in later stages of the innovation spectrum such as commercialization, but certain support activities are also eligible where they are commensurate with the needs, and directly in support, of basic research, applied research, or experimental development. These support activities include engineering, design, operations research, mathematical analysis, computer programming, data collection, testing, and psychological research. In administering the SR&ED Program, the Canada Revenue Agency assesses the work against certain criteria to determine eligibility.Footnote 7
Most R&D expenditures made by, or on behalf of, a business in Canada and related to its activities may be eligible for the SR&ED tax incentives. Expenses eligible for the SR&ED tax incentives include the salaries or wages of employees directly engaged in SR&ED, the cost of materials consumed or transformed in SR&ED, contracts to perform SR&ED, and overhead expenditures. Businesses have a choice in how to treat overhead and administrative expenses. Under the “traditional method”, overhead and administrative expenses must be specifically identified and allocated in respect of SR&ED and may be eligible for both the SR&ED tax deduction and credit. Under the “proxy method”, overhead and administrative expenses that are attributable to SR&ED are deductible as ordinary current expenses. For the purposes of the SR&ED tax credit, however, in lieu of including these amounts directly in the credit base, a notional amount (55% of the total salaries or wages of employees directly engaged in SR&ED) is eligible for the tax credit.
To simplify the tax credit base and increase the cost-effectiveness of the program, beginning in 2014, capital expenditures were no longer eligible, and the eligibility of contract payments and overhead expenditures were modified. Table A1 of the annex provides a summary of the major changes to the SR&ED Program between 2000 and 2016 (i.e., the time period covered by this study).
3. Recent Trends
This section provides a description of the trends in SR&ED expendituresFootnote 8 by businesses in Canada over the period spanning 2000 to 2016. The analysis is based on information from businesses that performed R&D activities in Canada and claimed the SR&ED ITC in their T2 returns over these years.
SR&ED Expenditures and Number of Firms Claiming SR&ED Tax Credits in Canada, 2000-2016
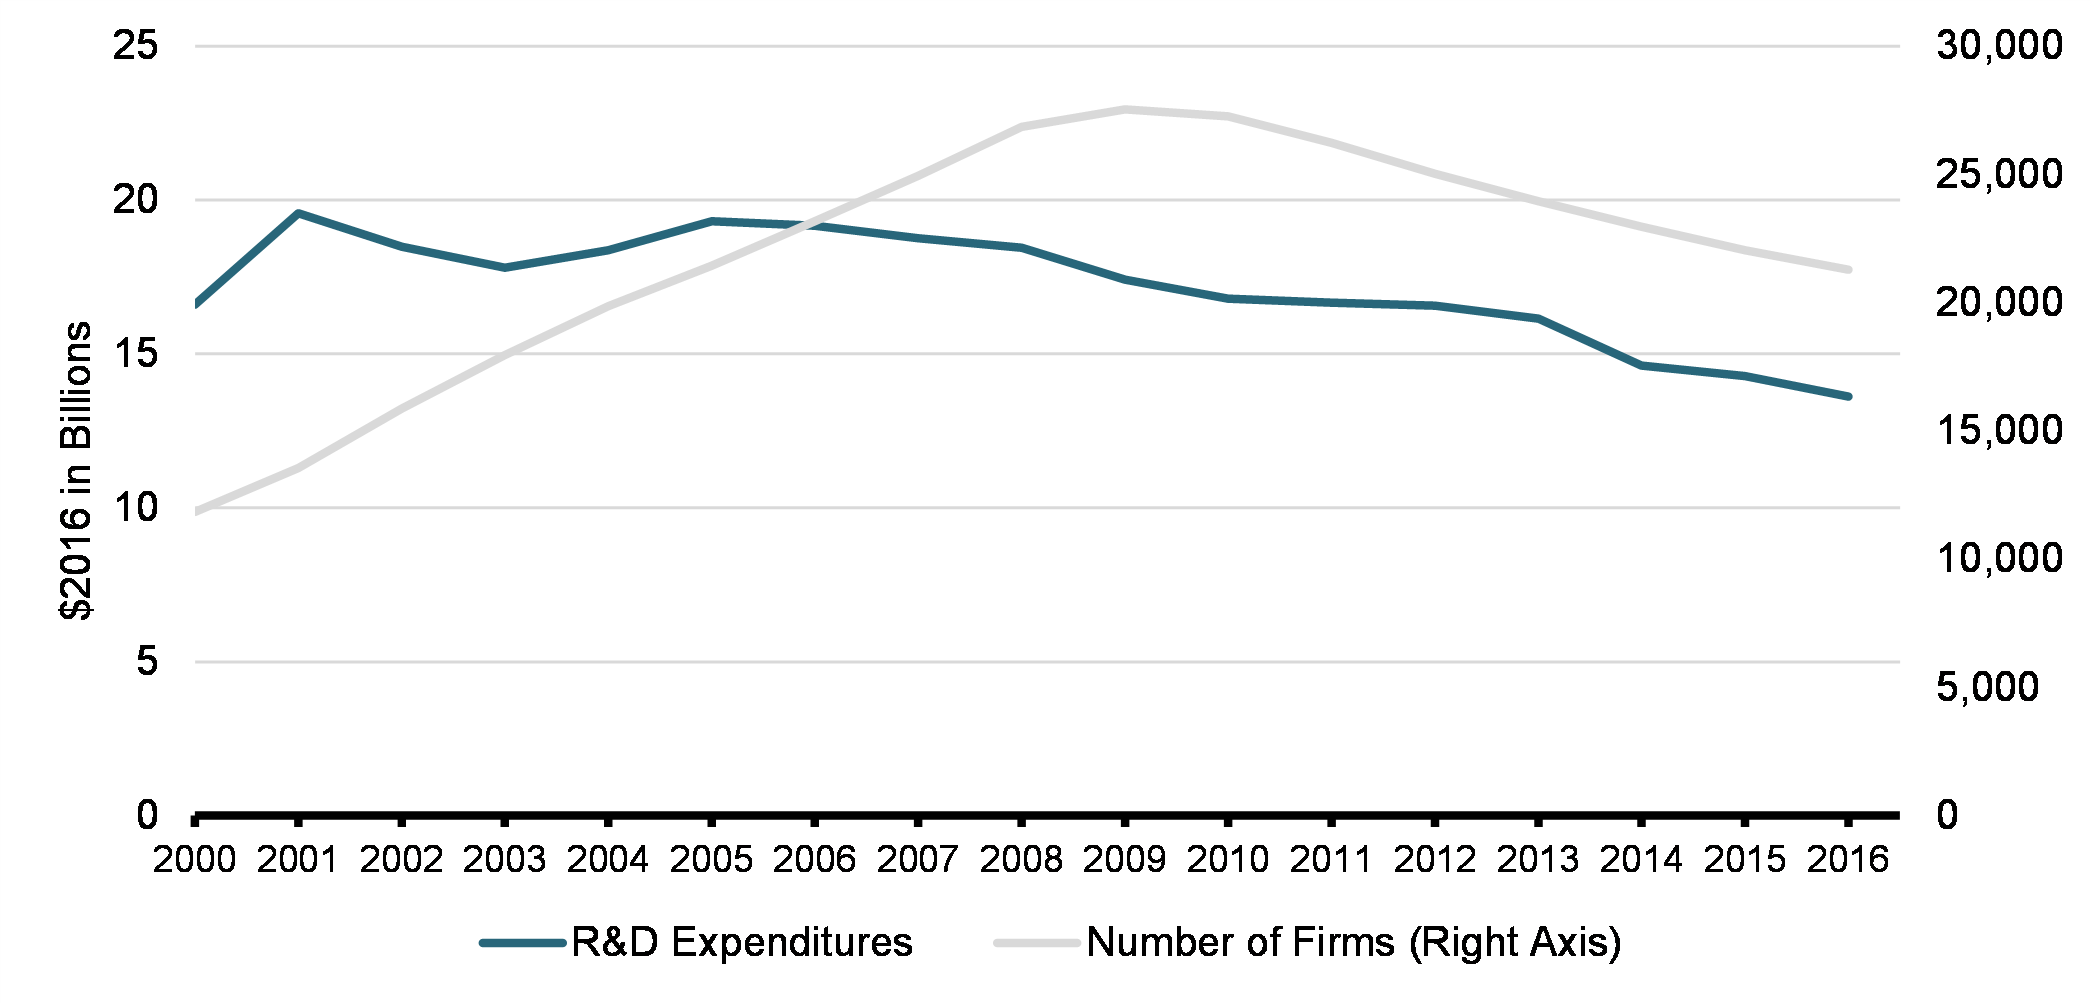
Chart 1 shows the trends in overall SR&ED expenditures and the number of businesses claiming these expenditures between 2000 and 2016. Businesses claimed $13.6 billion in SR&ED expenditures in 2016, a 30% decline from the peak of nearly $19.6 billion in 2001.Footnote 9 Over this period, there was an 18% decline in reported SR&ED expenditures, with the decline taking place mostly after 2005. Between 2005 and 2016, reported SR&ED expenditures by businesses fell each year at an average annual rate of 2.9%.
Over 21,000 firms, including about 17,000 small firms, claimed SR&ED expenditures in 2016. This is about 80% higher than the number of firms (about 11,800) claiming in 2000. Although the number of firms claiming SR&ED expenditures increased overall between 2000 and 2016, a significant decline was observed after the 2008-09 financial crisis. After reaching a peak of about 27,500 firms in 2009, the number of firms claiming the SR&ED tax credit has fallen every year, declining by 23% between 2009 and 2016.
Small Firms
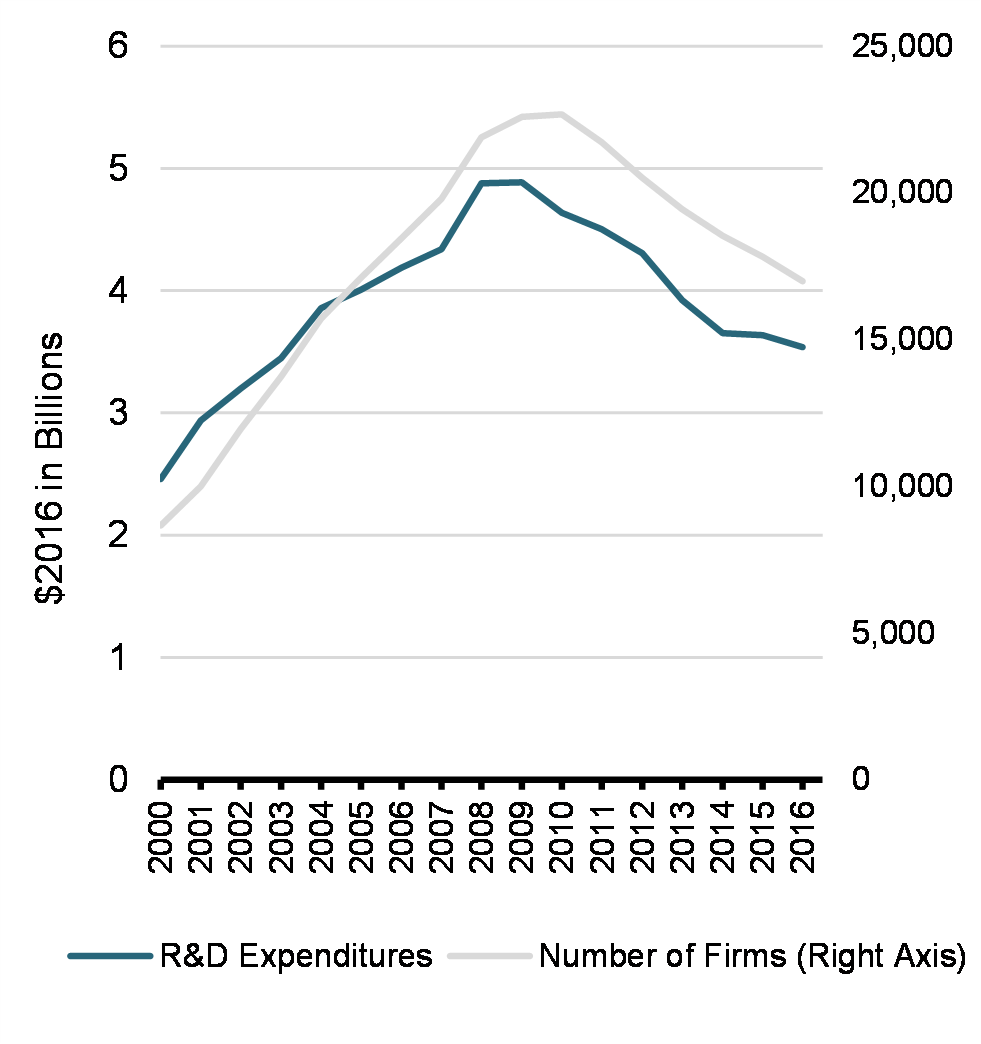
Large Firms
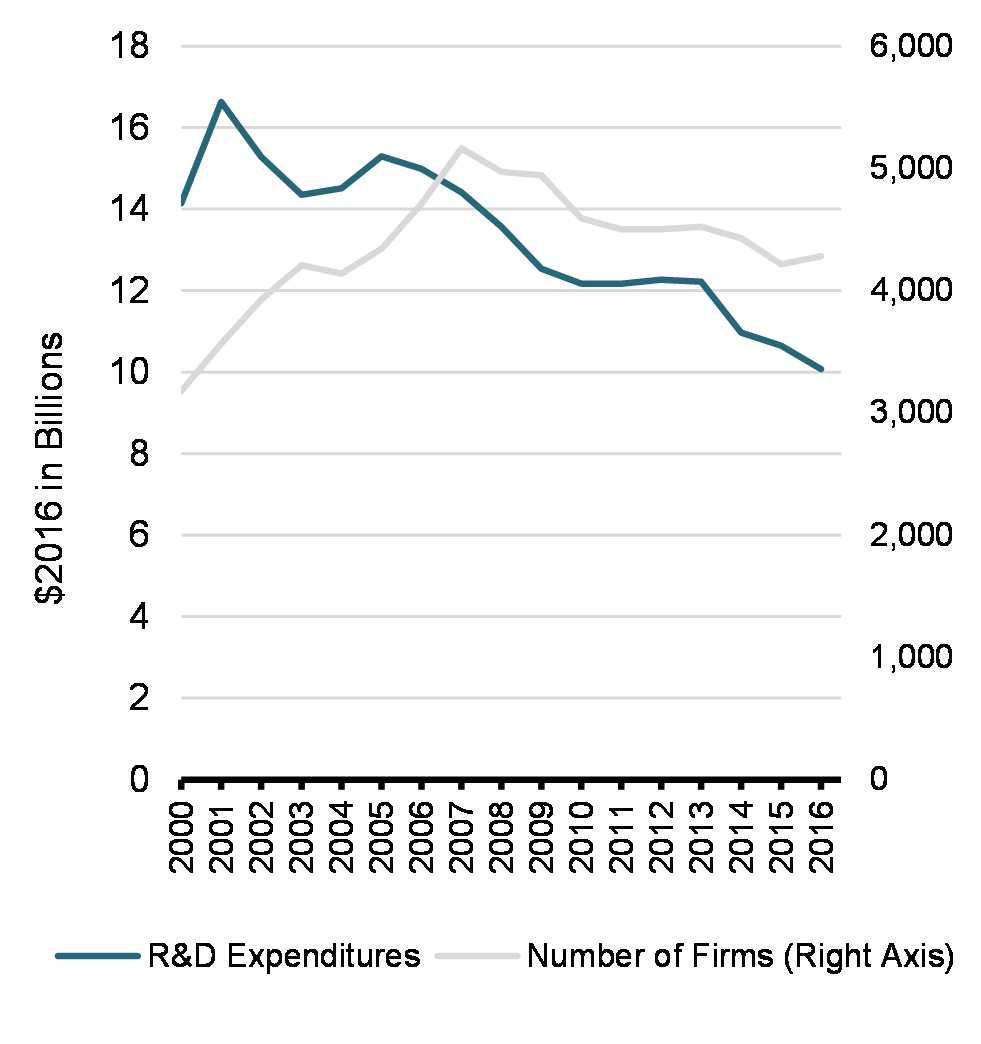
Chart 2 decomposes SR&ED claimant counts and expenditures by firm size. Claimant numbers grew for both small and large firms in the early years of the sample, then declined 25% and 17% from their peaks in 2010 and 2007, respectively. However, there was still a net increase of 96% and 35% in the number of small and large claimants over the sample period. SR&ED expenditures, for their part, grew by 44% for small firms but declined by 29% for large firms. The decline was fairly stable for large firms over the whole sample period, while for small firms SR&ED expenditures followed the trend exhibited in the number of claimants: after reaching a peak of about $4.9 billion in 2009, claimed SR&ED expenditures by small firms fell each year, declining by 28% between 2009 and 2016. Thus, the decline in the total number of claimants (in Chart 1) can largely be attributed to the decrease in the number of small firms while the decline in expenditures was driven by large firms. This primarily reflects their relative proportions, with small firms representing 80% of the claimants, on average, while large firms accounted for 77% of overall expenditures over the sample period.
SR&ED Expenditures by Industry, 2016
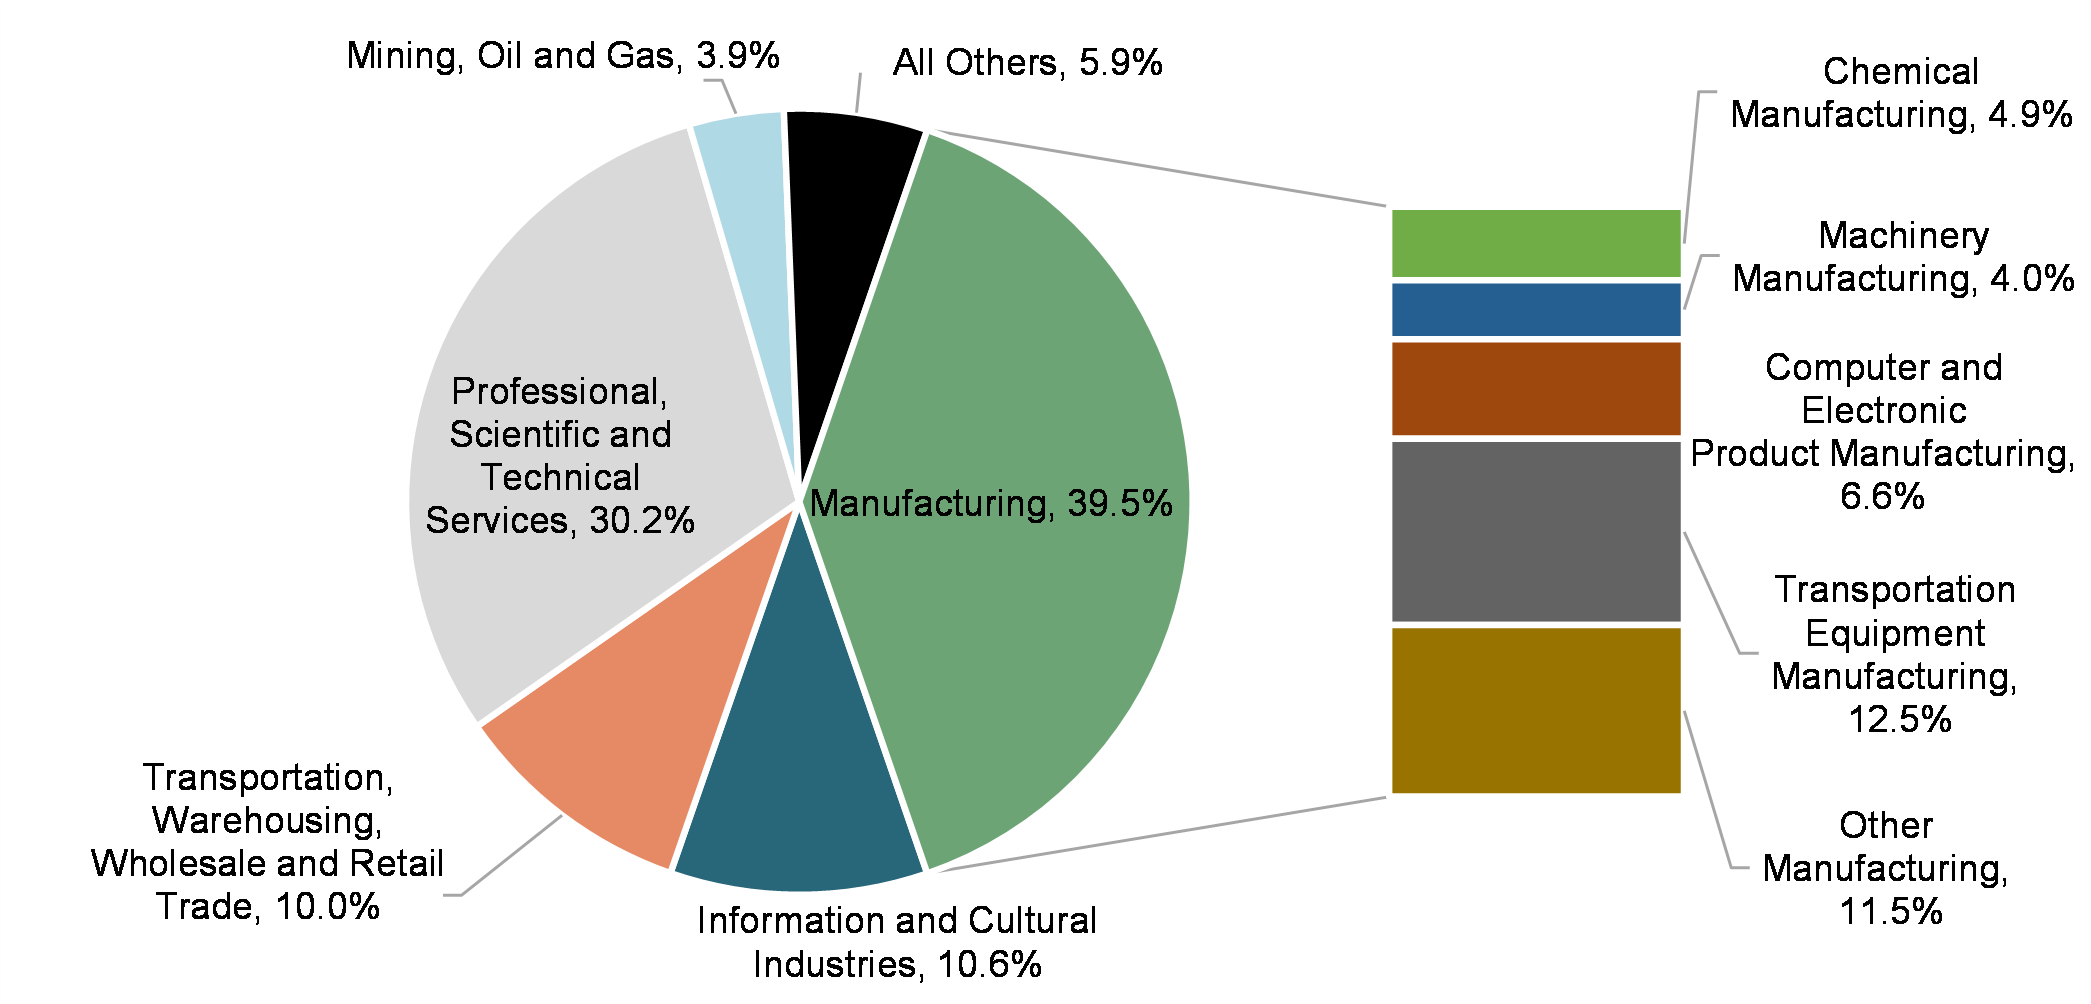
Chart 3 presents the distribution of claimed SR&ED expenditures by industry in 2016. Almost 70% of overall SR&ED expenditures were claimed by businesses from the manufacturing sector (40%) and the professional, scientific, and technical services sector (30%), while an additional 20.6% was shared almost equally by information and cultural industries and transportation, warehousing, wholesale and retail trade. Within the manufacturing sector, transport equipment manufacturing and computer and electronic product manufacturing accounted for almost half of overall SR&ED expenditures. Although not shown in Chart 3, large firms represented more than 75% of claimed expenditures on average across sectors. For example, large firms claimed 81% of manufacturing SR&ED expenditures and 97% of the mining, oil and gas expenditures. However, their representation was somewhat lower (60%) in the professional, scientific and technical services sector.
Distribution of SR&ED Expenditures by Small and Large Firms Among Various Industries, 2016
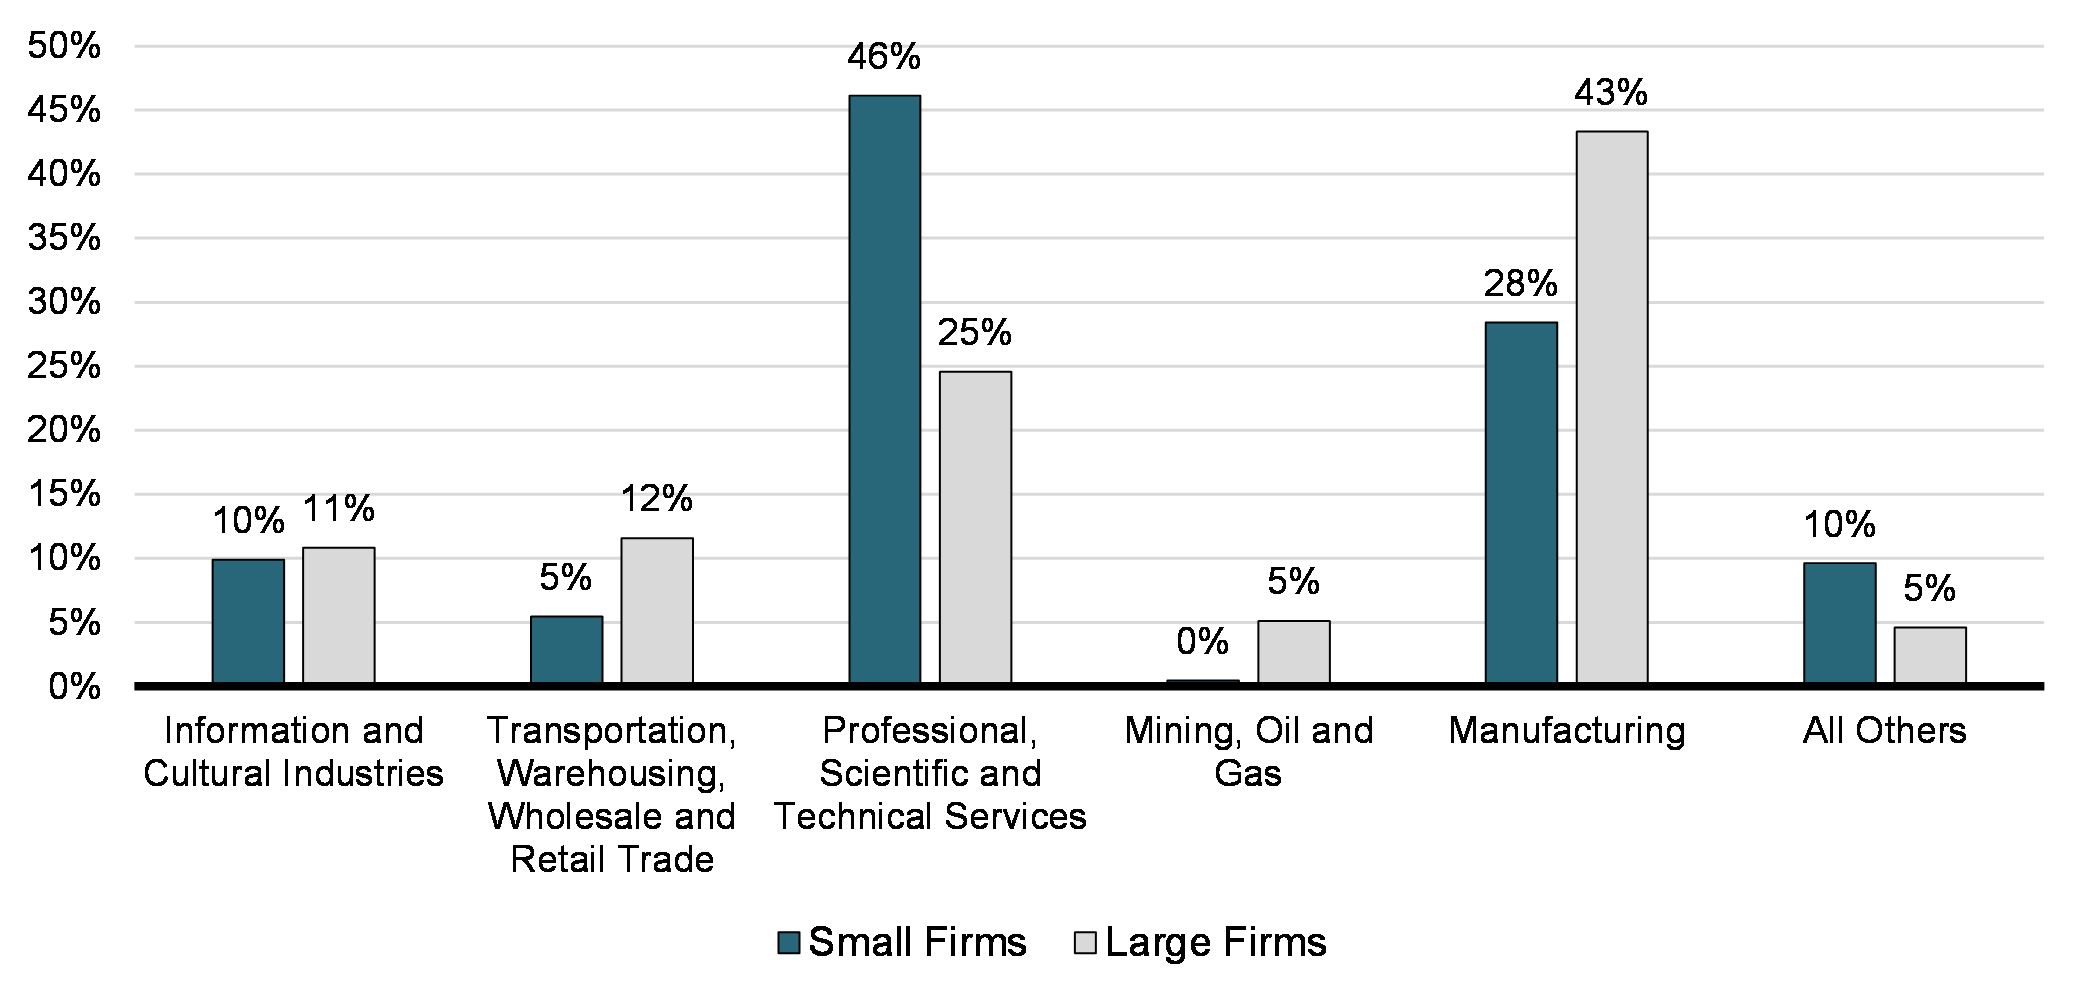
Chart 4 further decomposes claimed total 2016 SR&ED expenditures by industrial classification between small and large businesses. The manufacturing sector accounted for the largest share (43%) of SR&ED expenditures claimed by large firms while the professional, scientific and technical services sector made up an additional 25%. On the other hand, 46% of claimed SR&ED expenditures by small firms were in the professional, scientific and technical services sector, while manufacturing accounted for about 28% of their overall claimed SR&ED expenditures.
Chart 5 presents the distribution of claimed SR&ED expenditures by businesses from different provinces over the period of 2000 to 2016. In most provinces, eligible expenditures follow the federal definition, with an additional requirement that the R&D is performed in the province. Therefore, where possible, claimed SR&ED expenditures for businesses reporting activities in multiple jurisdictions were allocated using the amount of expenditures eligible for the provincial tax credit. Moreover, in some cases corporations have permanent establishments in that province, which is informative in allocating federally eligible expenditures. However, the Canada Revenue Agency does not administer Quebec or Alberta tax credits, and only began administering Ontario’s R&D tax credits in 2009. Where provincial tax credit amounts are not available, then, claimed SR&ED expenditures were allocated according to the provincial distribution of the corporation’s taxable income. As it is not possible to know in which province the R&D is performed using SR&ED claims in these cases, this allocation rule may under or overestimate the R&D expenditures in some provinces. Firms with activities in multiple jurisdictions represent on average 8% of the firms included in the sample, and 44% of overall SR&ED expenditures.
SR&ED Expenditures by Province, 2000-2016
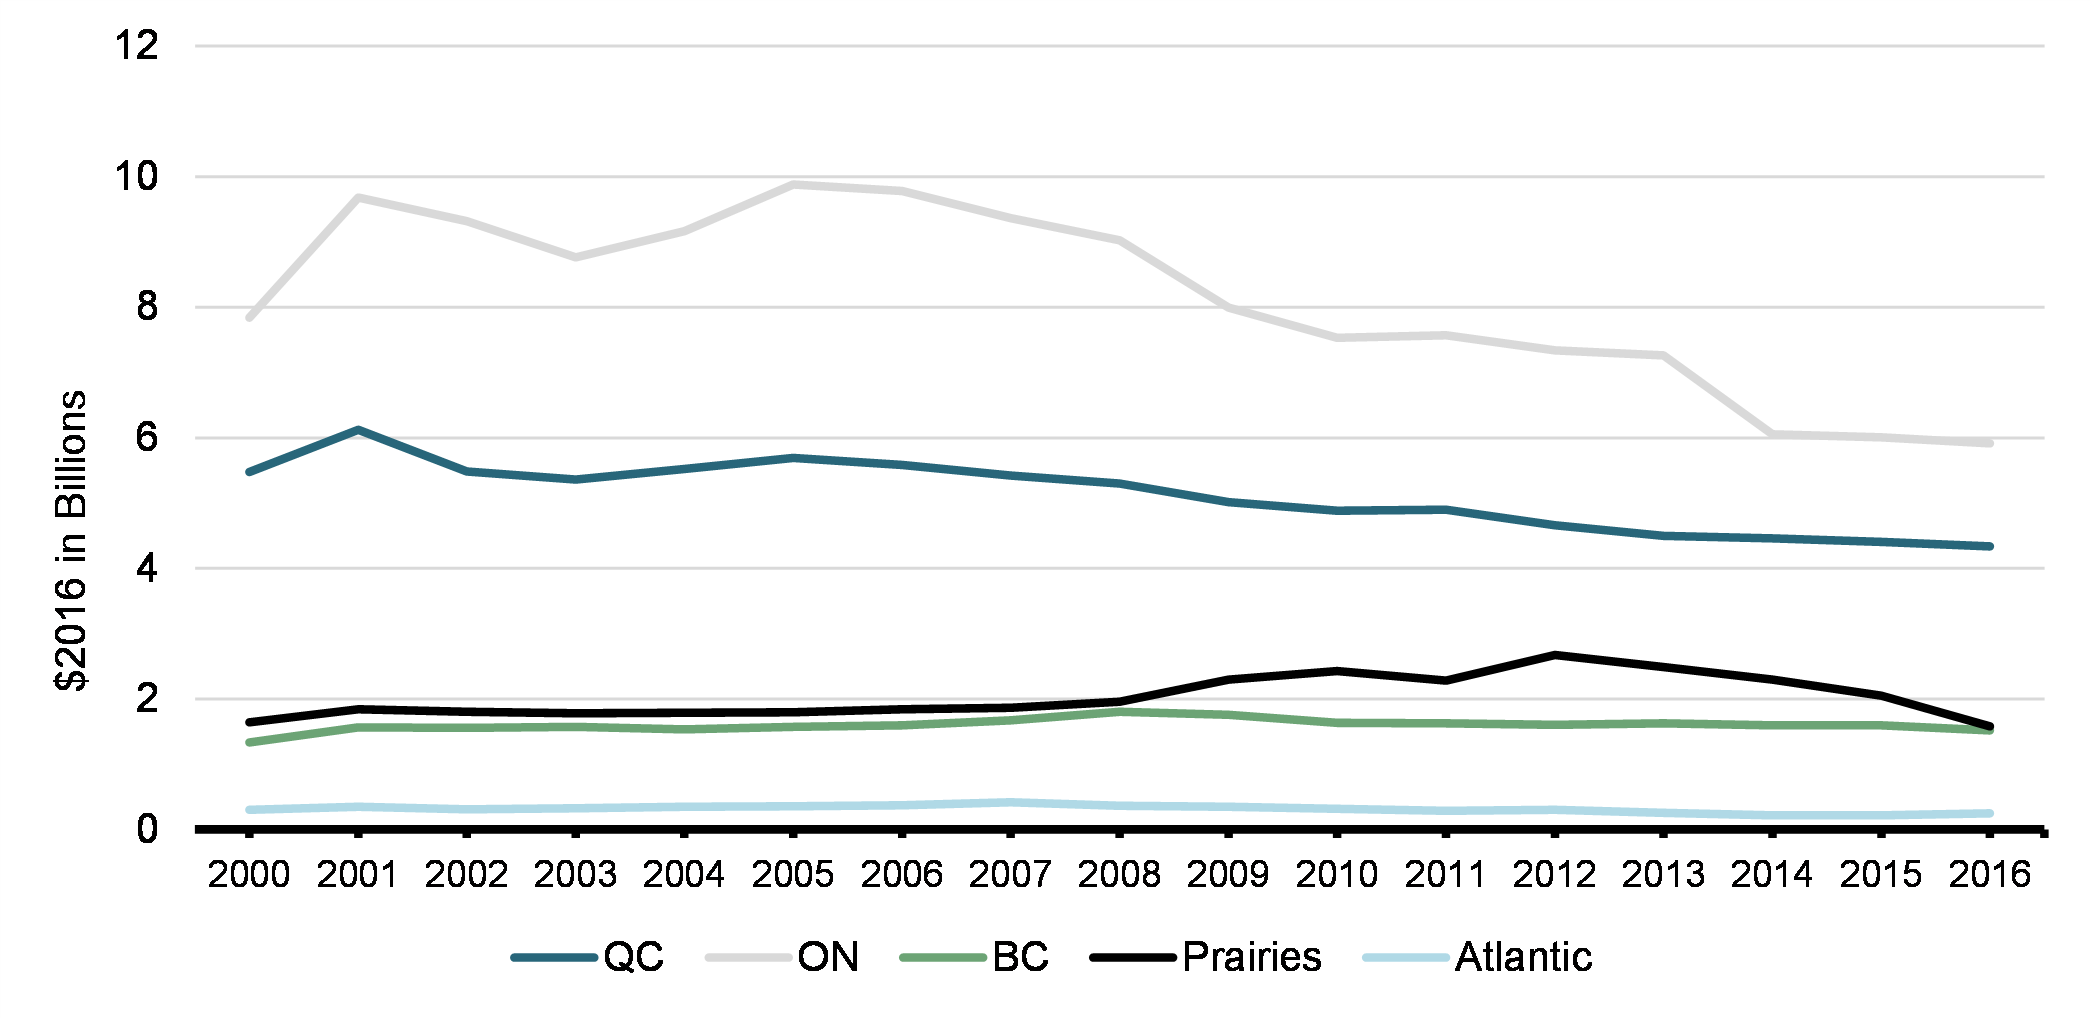
As can be inferred from Chart 5, in 2016 Ontario and Quebec together represented $10.3 billion, or 75% of total claimed SR&ED expenditures. This marks a decline from $13.3 billion, or an 80% share, in 2000. Claimed SR&ED expenditures in the Atlantic provinces, Prairies and British Columbia were relatively unchanged over the period and stood at $300 million, $1.6 billion and $1.5 billion, respectively, in 2016. However, in the Prairies, SR&ED expenditures had increased by 37% between 2008 and 2012, followed by a decline through 2016.
4. Review of Literature
Hall and Van Reenen (2000) and Parsons and Phillips (2007) provide a comprehensive review of earlier studies investigating the sensitivity of R&D investment to tax incentives, while more recent studies have been compiled by the OECD (2016). Empirical strategies typically involve either a structural approach that exploits a change in policy (e.g., Swenson, 1992; Bailey and Lawrence, 1992; Guceri and Liu, 2019) or a regression framework where R&D spending is cast as a function of the after-tax price of performing R&D and non-tax control variables (e.g., Hall, 1993; Bloom et al., 2002; Lokshin and Mohnen, 2012; Rao, 2016; Thomson, 2017). The responsiveness of R&D expenditures to tax incentives is usually measured as a price elasticity, i.e., the percentage change in R&D spending due to a 1% change in the cost of performing R&D. Overall, the evidence suggests a price elasticity around one, which implies that a 1% reduction in the cost of R&D leads to a 1% increase in R&D spending.
Most Canadian studies focus on the federal tax incentive for R&D. Early examples include McFetridge and Warda (1983), Bernstein (1986), Shah (1994), Nadiri and Kim (1996), and Dagenais et al. (1997, 2004), all of which report a positive relationship between the SR&ED tax credit and business expenditures on R&D.More recently, Agrawal et al. (2020) estimate the R&D elasticity by exploiting the introduction of the enhanced SR&ED ITC rate for small firms in 2004. Their results suggest that eligible small firms increased their R&D expenditures by 15%, on average, following the policy change, corresponding to an overall R&D cost elasticity of -1.5.
Only two studies estimate the effect of provincially run R&D tax credits, with mixed results: Baghana and Mohnen (2009) estimate negative price elasticities (-0.10 in the short-run and -0.14 in the long-run) for manufacturing firms in Quebec between 1997 and 2003, while Brouillette (2011) does not find any statistically significant effect from the R&D tax credit introduced in British Columbia in 1999.Footnote 10
Several studies have examined whether responsiveness to R&D incentives differs by firm size. The available evidence, reviewed in OECD (2016), suggests that small firms are more responsive to R&D tax incentives than their larger counterparts. Moreover, Kasahara et al. (2014) find the effect is greater among small firms with more outstanding debt, suggesting it operates through a relaxing of financial constraints. Canadian evidence on the effect of firm size is limited, but Baghana and Mohnen (2009) noted the short-run price elasticity of small firms in Quebec is twice that of large firms.
There is also some evidence that the responsiveness to tax incentives differs by component of R&D. Agrawal et al. (2020) and Rao (2016) find positive impacts of the tax credits on wages and contracts in Canada (elasticity coefficient of -1.05 for wages and -3.00 for contracts) and the US (elasticity coefficient of -3.5 for both wages and contracts).
The response of firms to R&D tax incentives may also depend on the industry to which they belong (Appelt et al., 2019). In addition, the use of cross-industry differences in R&D expenditure as a source of identifying variation is illustrated in Thomson (2017).
5. Data and Methodology
5.1 Data
This study employs T2 tax return data from 2000 to 2016, covering firms that claimed the SR&ED ITC at least once during the period and that had activities in a province. Firms are grouped by size (small or large), country of control, province and industry. Small firms, being CCPCs eligible for the enhanced credit rate (i.e., not exceeding $3 million in qualified expenditures), are by definition Canadian-controlled, but large firms may be classified as Canadian-controlled, US-controlled, other foreign-controlled, or of unknown ownership. As mentioned before, approximately 8% of firms had activities in multiple provinces in which case their R&D expenditures were allocated following provincial R&D tax credits, and otherwise according to the provincial distribution of taxable income. Industrial classification is at the NAICS 2-digit level,Footnote 11 except for manufacturing (at the 3-digit level), for a total of 37 industry groups in the sample. These groupings result in a total of 358 province-industry combinations for small firms and 1,195 province-industry-ownership combinations for large firms.Footnote 12
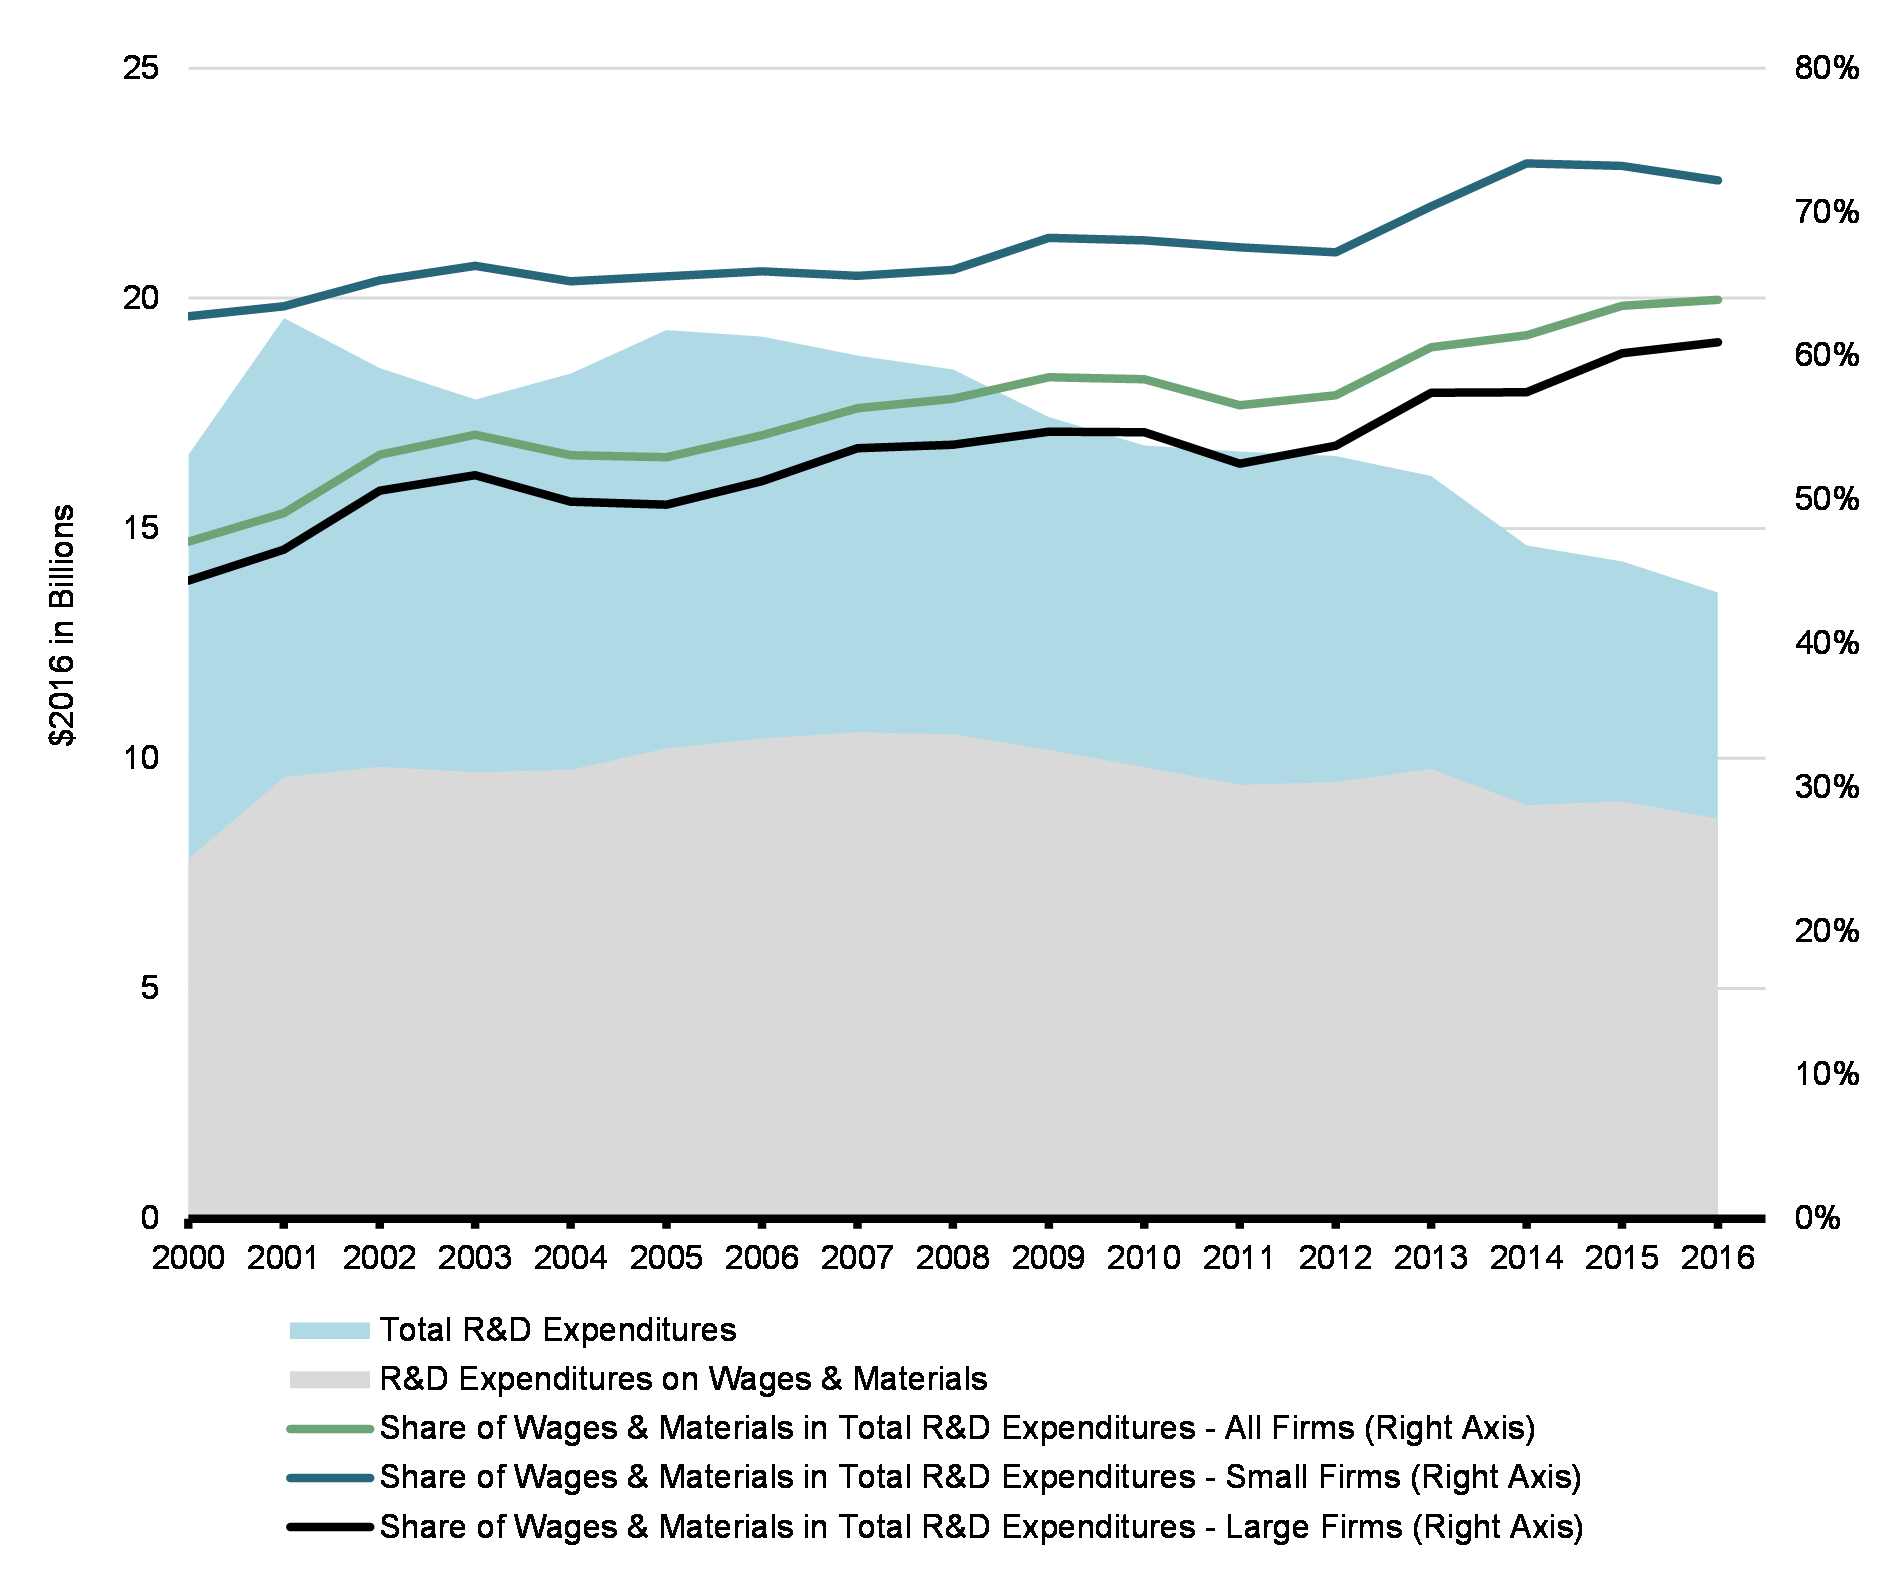
The measure of SR&ED ITC expenditures adopted here is based only on wages and materials reported on Form T661. As Budget 2012 restricted the expenditures eligible for the credit (i.e., by disallowing capital expenditures, reducing the prescribed proxy amount for overhead expenditures, and limiting fees paid to arm’s-length third-party contracts), using total claimed expenditures could lead to a downward bias in the estimated effectiveness of the credit that would be due to policy changes, as opposed to a real decline in SR&ED expenditures. The eligibility of wages and materials, however, was unchanged throughout the sample period. As shown in Chart 6, SR&ED expenditures on wages and materials accounted for almost 64% of total SR&ED spending in 2016, a share that has been growing over the sample time period, and more sharply since Budget 2012 rendered capital expenditures ineligible. About 68% of the overall SR&ED expenditures by small firms, on average, were made on wages and materials, while this share was on average 53% for large firms.
SR&ED Expenditures on Wages and Materials, 2000-2016
The concept of the user cost of capital used in this study follows the standard neoclassical theory of investment.Footnote 13 A profit-maximizing firm increases its level of capital investment until the value of the marginal product of capital is equal to the marginal cost of capital, or the user cost of capital. At this equilibrium, the user cost represents the minimum rate of return required to cover the returns demanded by the suppliers of financial capital, economic depreciation (i.e., the loss of value of the capital asset) and business taxes. The user cost of R&D expenditures () can be written as the weighted average of user costs across capital inputs used in investment:
(1)
where represents the share of R&D input in total R&D expenditures, is the price of capital relative to output, is the ITC rate, is the sales tax on capital , is the cost of financing, is the rate of economic depreciation for capital input , is the inflation rate, is the corporate income tax rate,Footnote 14 is the present value of tax depreciation for capital , and is the capital tax rate. The present value of tax depreciation for capital, , takes the value one, as only R&D expenditures on wages and materials are considered, and these may be expensed when incurred. The cost of financing is given by , where is the share of debt in the financing structure, is the nominal interest rate, and is the implicit rate of return on equity. The capital asset price relative to the output price is also assumed to be equal to one. The rate of depreciation for R&D, is assumed to be 10%.Footnote 15
The calculation of the cost of financing () requires information on the shares of debt and equity in the overall financing strategy of the firms. These shares serve as weights in calculating the averages of the returns on debt and equity. Data from the Quarterly Survey of Financial Statements conducted by Statistics Canada is used to calculate the debt-asset ratio for the industries in the dataset.Footnote 16 Debt is defined as the sum of total borrowings, and loans and accounts with affiliates, while the 10-year government bond yield is used as the return on equity.Footnote 17
Additional data is used to serve as controls in the estimation procedure. The real net income of firms is included to account for the operating aspects of the business. Industry-level real gross domestic product (GDP) by province is included as a control for differing macroeconomic trends across jurisdictions. Provincial working age populations are included, as total R&D spending on wages and materials may be influenced by the availability of workers.Footnote 18 Industry entry and exit rates are also used, since in more competitive industries (i.e., with higher entry and exit rates), R&D spending is expected to be lower as the associated private gains will be difficult to capture.Footnote 19
5.2 Empirical Model
Following the existing literature, business expenditures on R&D are modelled as a function of the user cost of R&D:
(2)
where is the R&D expenditures on wages and materials by industry-province group at time , is the user cost of R&D for industry-province group at time , and and denote industry and year fixed effects, respectively. denotes the country of ownership fixed effects and is employed to estimate equation (2) for large firms. is the vector of time varying controls at the industry-province level: real net income, real GDP, working age population, entry rate and exit rate. Control variables are expressed in logarithm, with the exception of the entry and exit rates.
Equation (2) is estimated using the pooled ordinary least-squares (OLS) method, separately for small and large firms. Given the log-log specification, the coefficient corresponds to the user cost elasticity of R&D. It is expected to be negative, such that private spending on R&D decreases as the user cost of R&D expenditures increases. An elasticity coefficient of -1.0, for example, means that business R&D increases by one percentage point for every one percentage point decrease in the cost of R&D expenditures.
The identification strategy of the elasticity estimates in this study exploits the variation in the user cost that is brought about by the variation in the provincial credit rates and the variation in the provincial CIT rates. The estimates rely on these differences in provincial trends given that businesses across provinces receive the federal SR&ED tax credit at the same rate.
In order to control for firm-specific differences in terms of country of control, “ownership” fixed effects are included in the estimation framework for large firms. Moreover, the empirical model of this study uses year fixed effects to control for potential changes in the administration of the tax credits over the sample period.
Summary statistics for the variables used in estimating equation (2) are provided in Table A7 of the annex.
6. Results and Discussion
6.1 Regression Results
Preferred estimates for small firms are shown in the first column of Table 2. This specification includes the full set of controls and fixed effects. All coefficients, except the entry rate, have their expected signs and are found to be statistically significant at the 1% level. The point estimate of the cost elasticity of R&D expenditures for small firms is -1.3, indicating that a 10% reduction in the user cost of R&D expenditures is expected to increase the private R&D spending of small businesses by 13%. Although the coefficient on the entry rate is found to be statistically insignificant, the coefficient for the exit rate is significant at the 1% level and its sign is negative. This suggests that in industries with a lower exit rate, businesses may have greater financial stability to invest and grow, and thus increase R&D expenditures on wages and materials.
Similar results are seen in Column 4, which shows the preferred estimates for large firms. The elasticity coefficient is -1.01 and significant at the 1% level, implying that large firms are expected to increase R&D expenditures by slightly over 10% as a result of a 10% decrease in user cost. As with small firms, all other coefficients (except the entry rate) are found to be statistically significant and of expected sign.
The estimated elasticity coefficients suggest that businesses in Canada are responsive to changes in the user cost of R&D expenditures. It should be noted, however, that the dependent variable considered is R&D spending on wages and materials, and while these two components constitute more than 60% of overall R&D expenditures, Agrawal et al. (2020) found that the elasticity estimate for R&D wages is about two-thirds of the estimate for total R&D spending by small firms.
| Small Firms | Large Firms | ||||||
|---|---|---|---|---|---|---|---|
| Dependent Variable: log(R&D Expenditures on Wages and Materials) | |||||||
| 1 | 2 | 3 | 4 | 5 | 6 | 7 | |
| log(User Cost) | -1.31* | -1.30* | -1.60* | -1.01* | -1.01* | -1.10* | -0.78* |
| (0.15) | (0.15) | (0.14) | (0.25) | (0.25) | (0.25) | (0.26) | |
| log(Net Income) | 2.31* | 2.34* | - | 1.76* | 1.77* | - | 2.82* |
| (0.29) | (0.29) | (0.17) | (0.17) | (0.18) | |||
| log(GDP)t-1 | 0.41* | 0.40* | 0.39* | 0.64* | 0.64* | 0.64* | 0.62* |
| (0.02) | (0.02) | (0.02) | (0.02) | (0.02) | (0.02) | (0.02) | |
| log(Working Age Population) | 0.90* | 0.91* | 0.90* | 0.80* | 0.80* | 0.81* | 0.72* |
| (0.03) | (0.03) | (0.03) | (0.03) | (0.03) | (0.03) | (0.03) | |
| Entry Rate | 0.00 | - | 0.00 | 0.01 | - | 0.01 | 0.00 |
| (0.02) | (0.02) | (0.01) | (0.01) | (0.02) | |||
| Exit Rate | -0.13* | - | -0.13* | -0.04*** | - | -0.04** | -0.04*** |
| (0.02) | (0.02) | (0.02) | (0.02) | (0.02) | |||
| Industry Fixed Effects | Yes | Yes | Yes | Yes | Yes | Yes | Yes |
| Year Fixed Effects | Yes | Yes | Yes | Yes | Yes | Yes | Yes |
| Ownership Fixed Effects | No | No | No | Yes | Yes | Yes | No |
| R-Squared | 0.77 | 0.77 | 0.76 | 0.64 | 0.64 | 0.63 | 0.63 |
| No. of Observation | 4,490 | 4,490 | 4,490 | 12,972 | 12,972 | 12,972 | 12,972 |
| Fisher Panel Unit-Root Test Statistic – Inverse Normal (corresponding p-value) |
-10.56 (0.00) | -10.56 (0.00) | -9.93 (0.00) | -19.74 (0.00) | -19.77 (0.00) | -19.84 (0.00) | -20.35 (0.00) |
|
Notes: Estimation results for the model described in equation (2). Small firms are CCPCs with no more than $3 million of qualified SR&ED expenditures per year. Standard errors of the parameter estimates are reported in parenthesis. *Indicates significance at 1% level, **indicates significance at 5% level, and ***indicates significance at 10% level. In all specifications, a Fisher test for panel unit roots in the residuals of equation (2) was performed and the null of unit root was rejected. Panel unit root testing of individual regressors is provided in Table A8 of the annex. |
|||||||
The higher elasticity coefficient seen for small firms is consistent with smaller firms being more financially constrained than larger firms. If this presents a barrier to spending on R&D, access to the SR&ED ITC may relax smaller firms’ credit constraints. This effect could also be compounded by the fact that SR&ED ITCs claimed by small firms are generally fully refundable, meaning that a small firm would receive the benefits of the SR&ED immediately, regardless if the firm has a sufficient tax liability to absorb the ITCs.
In Columns 2 and 5, the entry rate and exit rate controls are dropped. The absence of these variables does not have any substantial effect on the coefficient estimates. This is not surprising since the coefficient of entry rate was insignificant in the preferred specifications and the effect of the exit rate on R&D expenditures was limited for large firms. In Columns 3 and 6, net income is dropped, resulting in larger elasticity coefficients. Firms with higher net income are expected to spend more on R&D, but the inclusion of net income in the preferred specification demonstrates this also holds at the aggregate province-industry (-ownership) level. Finally, Column 7 removes the ownership fixed effects for large firms, and as a result the magnitude of the elasticity coefficient is somewhat smaller. This suggests that the country of origin for large firms plays a role in determining the responsiveness of R&D expenditures to changes in the user cost.
6.2 Robustness
In this section, a number of robustness checks are performed to validate the results.
| Small Firms | Large Firms | ||||||
|---|---|---|---|---|---|---|---|
| Dependent Variable: log(R&D Expenditures on Wages and Materials) | |||||||
| (1) Excluding Multi-Jurisdictional Corporations |
(2) Manufacturing Industries |
(3) Non-Manufacturing Industries |
(4) Excluding Multi-Jurisdictional Corporations |
(5) Manufacturing Industries |
(6) Non-Manufacturing Industries |
||
| log(User Cost) | -1.53* | -1.75* | -0.84* | -1.08* | -1.13* | -0.73* | |
| (0.12) | (0.15) | (0.23) | (0.31) | (0.33) | (0.37) | ||
| log(Net Income) | Yes | Yes | Yes | Yes | Yes | Yes | |
| log(GDP)t-1 | Yes | Yes | Yes | Yes | Yes | Yes | |
| log(Working Age Population) | Yes | Yes | Yes | Yes | Yes | Yes | |
| Entry Rate | Yes | Yes | Yes | Yes | Yes | Yes | |
| Exit Rate | Yes | Yes | Yes | Yes | Yes | Yes | |
| Industry Fixed Effects | Yes | Yes | Yes | Yes | Yes | Yes | |
| Year Fixed Effects | Yes | Yes | Yes | Yes | Yes | Yes | |
| Ownership Fixed Effects | No | No | No | Yes | Yes | Yes | |
| R-Squared | 0.80 | 0.78 | 0.77 | 0.53 | 0.64 | 0.66 | |
| No. of Observation | 4,267 | 2,337 | 2,153 | 6,119 | 7,103 | 5,869 | |
|
Notes: Estimation results shown are for the model described in equation (2). Small firms are CCPCs with no more than $3 million of qualified SR&ED expenditures per year. Standard errors of the parameter estimates are reported in parenthesis. *Indicates significance at 1% level, **indicates significance at 5% level, and ***indicates significance at 10% level. |
|||||||
Columns 1 and 4 in Table 3 provide results for small and large firms, respectively, when excluding firms that operated in more than one province. While these represent on average only 8% of firms included in the sample, they account for 44% of overall SR&ED expenditures. For these firms, where it was not possible to apportion SR&ED expenditures using provincial R&D claims, the use of provincial taxable income as an allocation rule may lead to an under or overestimate of R&D expenditures within a province. However, these results suggest that the exclusion of firms operating in multiple jurisdictions does not explain away the observed effect of user cost on R&D spending. In fact, an increase (in absolute terms) in both elasticity estimates is observed, with a smaller impact on the estimate for large firms, even though they represent the majority of corporations with activities in multiple jurisdictions.
Columns 2 and 3 in Table 3 present the results for manufacturing and non-manufacturing industries for small firms, while Columns 5 and 6 present the results for large firms. These groupings are chosen to investigate whether the estimated effects are primarily driven by observations in the manufacturing industry, which accounts for about 37% of the firms on average in the dataset and about 40% of overall SR&ED expenditures claimed in 2016. Manufacturing firms are found to be much more responsive to the tax credit compared to their non-manufacturing counterparts. For small manufacturing firms, a much larger elasticity coefficient (-1.75) is observed compared to the overall user cost elasticity for all small firms (-1.31), while for large manufacturing firms, the effect is less pronounced (-1.13 vs. -1.01). The elasticity estimate is lower still, in absolute terms, for large firms in non-manufacturing industries (-0.73).
Three other types of robustness tests were performed. The depreciation rate was varied from 10% to 30% in one-percentage point increments. User cost coefficient estimates were essentially unchanged under these specifications, ranging between -1.31 and -1.32 for small firms, and remaining at -1.01 for large firms. NAICS-specific regressions were also run, and while heterogeneity was noted, sample sizes were small and standard errors often too large to yield significant results. Lastly, to limit the effect that changes in CIT rates may have over time, the sample period was limited to a period of relative stability in CIT rates (2013-2016). The user cost coefficient was lower for small firms (-0.83) but not significantly different from that of the preferred specification, while for large firms the result was not significant. These results confirm that the SR&ED ITC rate itself is linked to small firm R&D spending decisions.
7. Conclusion
This study examined the effectiveness of the SR&ED ITC in stimulating private spending on R&D. The user cost elasticity of R&D spending on wages and materials was estimated for small and large firms using administrative tax data for the period spanning 2000 to 2016. Both elasticities were found to be greater than one in absolute terms, at -1.31 for small firms and -1.01 for large firms. These results are in line with the existing literature, and serve as evidence that the SR&ED Program is associated with additional private spending on R&D in Canada, particularly among small firms, as well as those in the manufacturing sector.
Consistent with the findings from existing literature, this study asserts that firms’ R&D spending decisions are a function of the after-tax price of performing R&D and non-tax control variables. In particular, the identification strategy proposed depends on variation in both SR&ED ITC and CIT rates influencing firms’ user cost of capital. Subsampling over a period of relative stability in CIT rates suggests the SR&ED ITC rate is itself linked to small firm R&D spending decisions, but examining the effects of the two variables separately would be of interest for future research.
It should also be noted that these results represent the average response across provinces and industries. While responsiveness plausibly differs along these dimensions, lack of variation and small sample sizes were a limiting factor in assessing such heterogeneity. Moreover, the results do not necessarily indicate that the SR&ED Program attracts foreign R&D; they may instead reveal a tendency for firms to allocate their R&D to those provinces where the cost is minimized.
Annex: The Federal Scientific Research and Experimental Development (SR&ED) Program
| Budget 2000 |
|
|
|---|---|---|
| Budget 2003 |
|
|
| Budget 2004 |
|
|
| Budget 2006 |
|
|
| Budget 2008 |
|
|
| Budget 2009 |
|
|
| Budget 2012 |
|
|
| Budget 2013 |
|
|
| Budget 2019 |
|
|
| 1 The analysis in this study considers the period from 2000 to 2016, and as such does not account for this change. | ||
| 2000 | 2001 | 2002 | 2003 | 2004 | 2005 | 2006 | 2007 | 2008 | 2009 | 2010 | 2011 | 2012 | 2013 | 2014 | 2015 | 2016 | |
|---|---|---|---|---|---|---|---|---|---|---|---|---|---|---|---|---|---|
| Federal | 35.0 | 35.0 | 35.0 | 35.0 | 35.0 | 35.0 | 35.0 | 35.0 | 35.0 | 35.0 | 35.0 | 35.0 | 35.0 | 35.0 | 35.0 | 35.0 | 35.0 |
| AB | 0.0 | 0.0 | 0.0 | 0.0 | 0.0 | 0.0 | 0.0 | 0.0 | 0.0 | 10.0 | 10.0 | 10.0 | 10.0 | 10.0 | 10.0 | 10.0 | 10.0 |
| BC | 10.0 | 10.0 | 10.0 | 10.0 | 10.0 | 10.0 | 10.0 | 10.0 | 10.0 | 10.0 | 10.0 | 10.0 | 10.0 | 10.0 | 10.0 | 10.0 | 10.0 |
| MB | 15.0 | 15.0 | 15.0 | 15.0 | 15.0 | 20.0 | 20.0 | 20.0 | 20.0 | 20.0 | 20.0 | 20.0 | 20.0 | 20.0 | 20.0 | 20.0 | 20.0 |
| NB | 10.0 | 10.0 | 10.0 | 15.0 | 15.0 | 15.0 | 15.0 | 15.0 | 15.0 | 15.0 | 15.0 | 15.0 | 15.0 | 15.0 | 15.0 | 15.0 | 15.0 |
| NL | 15.0 | 15.0 | 15.0 | 15.0 | 15.0 | 15.0 | 15.0 | 15.0 | 15.0 | 15.0 | 15.0 | 15.0 | 15.0 | 15.0 | 15.0 | 15.0 | 15.0 |
| NS | 15.0 | 15.0 | 15.0 | 15.0 | 15.0 | 15.0 | 15.0 | 15.0 | 15.0 | 15.0 | 15.0 | 15.0 | 15.0 | 15.0 | 15.0 | 15.0 | 15.0 |
| ON | 14.5 | 14.5 | 14.5 | 14.5 | 14.5 | 14.5 | 14.5 | 14.5 | 14.5 | 14.5 | 14.5 | 14.5 | 14.5 | 14.5 | 14.5 | 14.5 | 13.0 |
| PE | 0.0 | 0.0 | 0.0 | 0.0 | 0.0 | 0.0 | 0.0 | 0.0 | 0.0 | 0.0 | 0.0 | 0.0 | 0.0 | 0.0 | 0.0 | 0.0 | 0.0 |
| QC* | 40.0 | 40.0 | 40.0 | 37.5 | 35.0 | 37.5 | 37.5 | 37.5 | 37.5 | 37.5 | 37.5 | 37.5 | 37.5 | 37.5 | 33.8 | 30.0 | 30.0 |
| SK | 15.0 | 15.0 | 15.0 | 15.0 | 15.0 | 15.0 | 15.0 | 15.0 | 15.0 | 15.0 | 15.0 | 15.0 | 15.0 | 15.0 | 15.0 | 10.0 | 10.0 |
|
Note: Small firms are CCPCs with no more than $3 million of qualified SR&ED expenditures per year. *ITC rates for Quebec are not directly comparable to those of other provinces or the federal level as the credit base is narrower. |
|||||||||||||||||
| 2000 | 2001 | 2002 | 2003 | 2004 | 2005 | 2006 | 2007 | 2008 | 2009 | 2010 | 2011 | 2012 | 2013 | 2014 | 2015 | 2016 | |
|---|---|---|---|---|---|---|---|---|---|---|---|---|---|---|---|---|---|
| Federal | 20.0 | 20.0 | 20.0 | 20.0 | 20.0 | 20.0 | 20.0 | 20.0 | 20.0 | 20.0 | 20.0 | 20.0 | 20.0 | 20.0 | 15.0 | 15.0 | 15.0 |
| AB | 0.0 | 0.0 | 0.0 | 0.0 | 0.0 | 0.0 | 0.0 | 0.0 | 0.0 | 10.0 | 10.0 | 10.0 | 10.0 | 10.0 | 10.0 | 10.0 | 10.0 |
| BC | 10.0 | 10.0 | 10.0 | 10.0 | 10.0 | 10.0 | 10.0 | 10.0 | 10.0 | 10.0 | 10.0 | 10.0 | 10.0 | 10.0 | 10.0 | 10.0 | 10.0 |
| MB | 15.0 | 15.0 | 15.0 | 15.0 | 15.0 | 20.0 | 20.0 | 20.0 | 20.0 | 20.0 | 20.0 | 20.0 | 20.0 | 20.0 | 20.0 | 20.0 | 20.0 |
| NB | 10.0 | 10.0 | 10.0 | 15.0 | 15.0 | 15.0 | 15.0 | 15.0 | 15.0 | 15.0 | 15.0 | 15.0 | 15.0 | 15.0 | 15.0 | 15.0 | 15.0 |
| NL | 15.0 | 15.0 | 15.0 | 15.0 | 15.0 | 15.0 | 15.0 | 15.0 | 15.0 | 15.0 | 15.0 | 15.0 | 15.0 | 15.0 | 15.0 | 15.0 | 15.0 |
| NS | 15.0 | 15.0 | 15.0 | 15.0 | 15.0 | 15.0 | 15.0 | 15.0 | 15.0 | 15.0 | 15.0 | 15.0 | 15.0 | 15.0 | 15.0 | 15.0 | 15.0 |
| ON | 4.5 | 4.5 | 4.5 | 4.5 | 4.5 | 4.5 | 4.5 | 4.5 | 4.5 | 4.5 | 4.5 | 4.5 | 4.5 | 4.5 | 4.5 | 4.5 | 4.0 |
| PE | 0.0 | 0.0 | 0.0 | 0.0 | 0.0 | 0.0 | 0.0 | 0.0 | 0.0 | 0.0 | 0.0 | 0.0 | 0.0 | 0.0 | 0.0 | 0.0 | 0.0 |
| QC | 20.0 | 20.0 | 20.0 | 18.8 | 17.5 | 17.5 | 17.5 | 17.5 | 17.5 | 17.5 | 17.5 | 17.5 | 17.5 | 17.5 | 15.8 | 14.0 | 14.0 |
| SK | 15.0 | 15.0 | 15.0 | 15.0 | 15.0 | 15.0 | 15.0 | 15.0 | 15.0 | 15.0 | 15.0 | 15.0 | 15.0 | 15.0 | 15.0 | 10.0 | 10.0 |
| 2000 | 2001 | 2002 | 2003 | 2004 | 2005 | 2006 | 2007 | 2008 | 2009 | 2010 | 2011 | 2012 | 2013 | 2014 | 2015 | 2016 | |
|---|---|---|---|---|---|---|---|---|---|---|---|---|---|---|---|---|---|
| Federal | 13.1 | 13.1 | 13.1 | 13.1 | 13.1 | 13.1 | 13.1 | 13.1 | 11.0 | 11.0 | 11.0 | 11.0 | 11.0 | 11.0 | 11.0 | 11.0 | 10.5 |
| AB | 6.0 | 5.0 | 4.5 | 4.0 | 3.0 | 3.0 | 3.0 | 3.0 | 3.0 | 3.0 | 3.0 | 3.0 | 3.0 | 3.0 | 3.0 | 3.0 | 3.0 |
| BC | 4.8 | 4.5 | 4.5 | 4.5 | 4.5 | 4.5 | 4.5 | 4.5 | 2.5 | 2.5 | 2.5 | 2.5 | 2.5 | 2.5 | 2.5 | 2.5 | 2.5 |
| MB | 7.0 | 6.0 | 5.0 | 5.0 | 5.0 | 5.0 | 4.5 | 3.0 | 2.0 | 1.0 | 0.0 | 0.0 | 0.0 | 0.0 | 0.0 | 0.0 | 0.0 |
| NB | 4.5 | 4.0 | 3.5 | 3.0 | 2.5 | 2.0 | 1.5 | 5.0 | 5.0 | 5.0 | 5.0 | 5.0 | 4.5 | 4.5 | 4.5 | 4.0 | 3.5 |
| NL | 5.0 | 5.0 | 5.0 | 5.0 | 5.0 | 5.0 | 5.0 | 5.0 | 5.0 | 5.0 | 4.0 | 4.0 | 4.0 | 4.0 | 3.0 | 3.0 | 3.0 |
| NS | 5.0 | 5.0 | 5.0 | 5.0 | 5.0 | 5.0 | 5.0 | 5.0 | 5.0 | 5.0 | 5.0 | 4.5 | 4.0 | 3.5 | 3.0 | 3.0 | 3.0 |
| ON | 7.0 | 6.5 | 6.0 | 5.5 | 5.5 | 5.5 | 5.5 | 5.5 | 5.5 | 5.5 | 4.5 | 4.5 | 4.5 | 4.5 | 4.5 | 4.5 | 4.5 |
| PE | 7.5 | 7.5 | 7.5 | 7.5 | 7.5 | 6.5 | 5.4 | 4.3 | 3.2 | 2.1 | 1.0 | 1.0 | 1.0 | 4.5 | 4.5 | 4.5 | 4.5 |
| QC | 9.0 | 9.0 | 9.0 | 8.9 | 8.9 | 8.9 | 8.0 | 8.0 | 8.0 | 8.0 | 8.0 | 8.0 | 8.0 | 8.0 | 8.0 | 8.0 | 8.0 |
| SK | 8.0 | 6.0 | 6.0 | 6.0 | 5.5 | 5.0 | 5.0 | 4.5 | 4.5 | 4.5 | 4.5 | 2.0 | 2.0 | 2.0 | 2.0 | 2.0 | 2.0 |
| Note: Small firms are CCPCs with no more than $3 million of qualified SR&ED expenditures per year. | |||||||||||||||||
| 2000 | 2001 | 2002 | 2003 | 2004 | 2005 | 2006 | 2007 | 2008 | 2009 | 2010 | 2011 | 2012 | 2013 | 2014 | 2015 | 2016 | |
|---|---|---|---|---|---|---|---|---|---|---|---|---|---|---|---|---|---|
| Federal | 29.1 | 28.1 | 26.1 | 24.1 | 22.1 | 22.1 | 22.1 | 22.1 | 19.5 | 19.0 | 18.0 | 16.5 | 15.0 | 15.0 | 15.0 | 15.0 | 15.0 |
| AB | 15.5 | 13.5 | 13.0 | 12.5 | 11.5 | 11.5 | 10.0 | 10.0 | 10.0 | 10.0 | 10.0 | 10.0 | 10.0 | 10.0 | 10.0 | 12.0 | 12.0 |
| BC | 16.5 | 16.5 | 13.5 | 13.5 | 13.5 | 12.0 | 12.0 | 12.0 | 11.0 | 11.0 | 10.5 | 10.0 | 10.0 | 11.0 | 11.0 | 11.0 | 11.0 |
| MB | 17.0 | 17.0 | 16.5 | 16.0 | 15.5 | 15.0 | 14.5 | 14.0 | 13.0 | 12.0 | 12.0 | 12.0 | 12.0 | 12.0 | 12.0 | 12.0 | 12.0 |
| NB | 17.0 | 16.0 | 14.5 | 13.0 | 13.0 | 13.0 | 13.0 | 13.0 | 13.0 | 12.0 | 11.0 | 10.0 | 10.0 | 12.0 | 12.0 | 12.0 | 14.0 |
| NL | 14.0 | 14.0 | 14.0 | 14.0 | 14.0 | 14.0 | 14.0 | 14.0 | 14.0 | 14.0 | 14.0 | 14.0 | 14.0 | 14.0 | 14.0 | 14.0 | 15.0 |
| NS | 16.0 | 16.0 | 16.0 | 16.0 | 16.0 | 16.0 | 16.0 | 16.0 | 16.0 | 16.0 | 16.0 | 16.0 | 16.0 | 16.0 | 16.0 | 16.0 | 16.0 |
| ON | 14.5 | 12.5 | 12.5 | 12.5 | 14.0 | 14.0 | 14.0 | 14.0 | 14.0 | 14.0 | 12.0 | 11.5 | 11.5 | 11.5 | 11.5 | 11.5 | 11.5 |
| PE | 16.0 | 16.0 | 16.0 | 16.0 | 16.0 | 16.0 | 16.0 | 16.0 | 16.0 | 16.0 | 16.0 | 16.0 | 16.0 | 16.0 | 16.0 | 16.0 | 16.0 |
| QC | 9.0 | 9.0 | 9.0 | 8.9 | 8.9 | 8.9 | 9.9 | 9.9 | 11.4 | 11.9 | 11.9 | 11.9 | 11.9 | 11.9 | 11.9 | 11.9 | 11.9 |
| SK | 17.0 | 17.0 | 17.0 | 17.0 | 17.0 | 17.0 | 14.0 | 13.0 | 12.0 | 12.0 | 12.0 | 12.0 | 12.0 | 12.0 | 12.0 | 12.0 | 12.0 |
| 2000 | 2001 | 2002 | 2003 | 2004 | 2005 | 2006 | 2007 | 2008 | 2009 | 2010 | 2011 | 2012 | 2013 | 2014 | 2015 | 2016 | |
|---|---|---|---|---|---|---|---|---|---|---|---|---|---|---|---|---|---|
| Federal | 22.1 | 22.1 | 22.1 | 22.1 | 22.1 | 22.1 | 22.1 | 22.1 | 19.5 | 19.0 | 18.0 | 16.5 | 15.0 | 15.0 | 15.0 | 15.0 | 15.0 |
| AB | 14.5 | 13.5 | 13.0 | 12.5 | 11.5 | 11.5 | 10.0 | 10.0 | 10.0 | 10.0 | 10.0 | 10.0 | 10.0 | 10.0 | 10.0 | 12.0 | 12.0 |
| BC | 17.0 | 17.0 | 16.5 | 16.0 | 15.5 | 15.0 | 14.5 | 14.0 | 13.0 | 12.0 | 12.0 | 12.0 | 12.0 | 12.0 | 12.0 | 12.0 | 12.0 |
| MB | 17.0 | 16.0 | 14.5 | 13.0 | 13.0 | 13.0 | 13.0 | 13.0 | 13.0 | 12.0 | 11.0 | 10.0 | 10.0 | 12.0 | 12.0 | 12.0 | 14.0 |
| NB | 5.0 | 5.0 | 5.0 | 5.0 | 5.0 | 5.0 | 5.0 | 5.0 | 5.0 | 5.0 | 5.0 | 5.0 | 5.0 | 5.0 | 5.0 | 5.0 | 15.0 |
| NL | 16.0 | 16.0 | 16.0 | 16.0 | 16.0 | 16.0 | 16.0 | 16.0 | 16.0 | 16.0 | 16.0 | 16.0 | 16.0 | 16.0 | 16.0 | 16.0 | 16.0 |
| NS | 12.5 | 11.0 | 11.0 | 11.0 | 12.0 | 12.0 | 12.0 | 12.0 | 12.0 | 12.0 | 10.0 | 10.0 | 10.0 | 10.0 | 10.0 | 10.0 | 10.0 |
| ON | 7.5 | 7.5 | 7.5 | 7.5 | 7.5 | 16.0 | 16.0 | 16.0 | 16.0 | 16.0 | 16.0 | 16.0 | 16.0 | 16.0 | 16.0 | 16.0 | 16.0 |
| PE | 8.9 | 9.0 | 9.0 | 8.9 | 8.9 | 8.9 | 9.9 | 9.9 | 11.4 | 11.9 | 11.9 | 11.9 | 11.9 | 11.9 | 11.9 | 11.9 | 11.9 |
| QC | 10.0 | 10.0 | 10.0 | 10.0 | 10.0 | 10.0 | 10.0 | 10.0 | 10.0 | 10.0 | 10.0 | 10.0 | 10.0 | 10.0 | 10.0 | 10.0 | 10.0 |
| SK | 10.0 | 10.0 | 10.0 | 10.0 | 10.0 | 10.0 | 10.0 | 10.0 | 10.0 | 10.0 | 10.0 | 10.0 | 10.0 | 10.0 | 10.0 | 10.0 | 10.0 |
| Variable | Small Firms | Large Firms | ||||||
|---|---|---|---|---|---|---|---|---|
| Mean | Std. Dev. | Min | Max | Mean | Std. Dev. | Min | Max | |
| Real Net Income* | 7,160 | 916 | 5,440 | 10,300 | 7,270 | 1,150 | 326 | 32,100 |
| Real GDP* | 5,282 | 10,394 | 0.0 | 93,420 | 5,783 | 11,121 | 0.0 | 93,420 |
| Working Age Population* | 2.9 | 2.9 | 0.1 | 9.4 | 3.1 | 3.0 | 0.1 | 9.4 |
| Real SR&ED Expenditures on Wages and Materials* | 9.6 | 36.0 | 0.0 | 502.0 | 8.7 | 32.1 | 0.0 | 840.0 |
| Entry Rate | 11.2 | 3.9 | 6.0 | 24.2 | 11.2 | 3.9 | 6.0 | 24.2 |
| Exit Rate | 10.7 | 2.9 | 7.6 | 22.3 | 10.7 | 2.9 | 7.6 | 22.3 |
| User Cost | 0.06 | 0.01 | 0.04 | 0.11 | 0.08 | 0.01 | 0.06 | 0.13 |
| No. of Observation | 4,490 | 12,972 | ||||||
| Notes: * denotes figures in $ millions. Data aggregated at the province-industry level for small firms, and at the province-industry-ownership level for large firms. | ||||||||
| Small Firms | Large Firms | ||||||||||||||||
|---|---|---|---|---|---|---|---|---|---|---|---|---|---|---|---|---|---|
| Im, Pesaran & Shin W-stat | ADF-Fisher Chi-square | PP-Fisher Chi-square | Im, Pesaran & Shin W-stat | ADF-Fisher Chi-square | PP-Fisher Chi-square | ||||||||||||
| log(User Cost) | 0.00 | 0.00 | 0.00 | 0.00 | 0.00 | 0.00 | |||||||||||
| log(Net Income) | 0.00 | 0.00 | 0.00 | 0.00 | 0.00 | 0.00 | |||||||||||
| log(Work Age Pop.) | 0.00 | 0.00 | 0.10 | 0.00 | 0.00 | 0.00 | |||||||||||
| log(GDP)t-1 | 0.00 | 0.00 | 0.00 | 0.00 | 0.00 | 0.00 | |||||||||||
| Entry Rate | 0.00 | 1.00 | 0.98 | 0.04 | 0.99 | 0.00 | |||||||||||
| Exit Rate | 0.00 | 0.00 | 0.00 | 0.00 | 0.00 | 0.00 | |||||||||||
| Notes: For each series, cells show the probability of maintaining null hypothesis that panels contain individual unit root processes. Other available unit root tests (Levin-Lin Chu, Breitung and Hadri) were excluded due to dataset having large N, small T. Harris-Tzavalis could not be run as panel data is unbalanced. Small firms are CCPCs with no more than $3 million of qualified SR&ED expenditures per year. | |||||||||||||||||
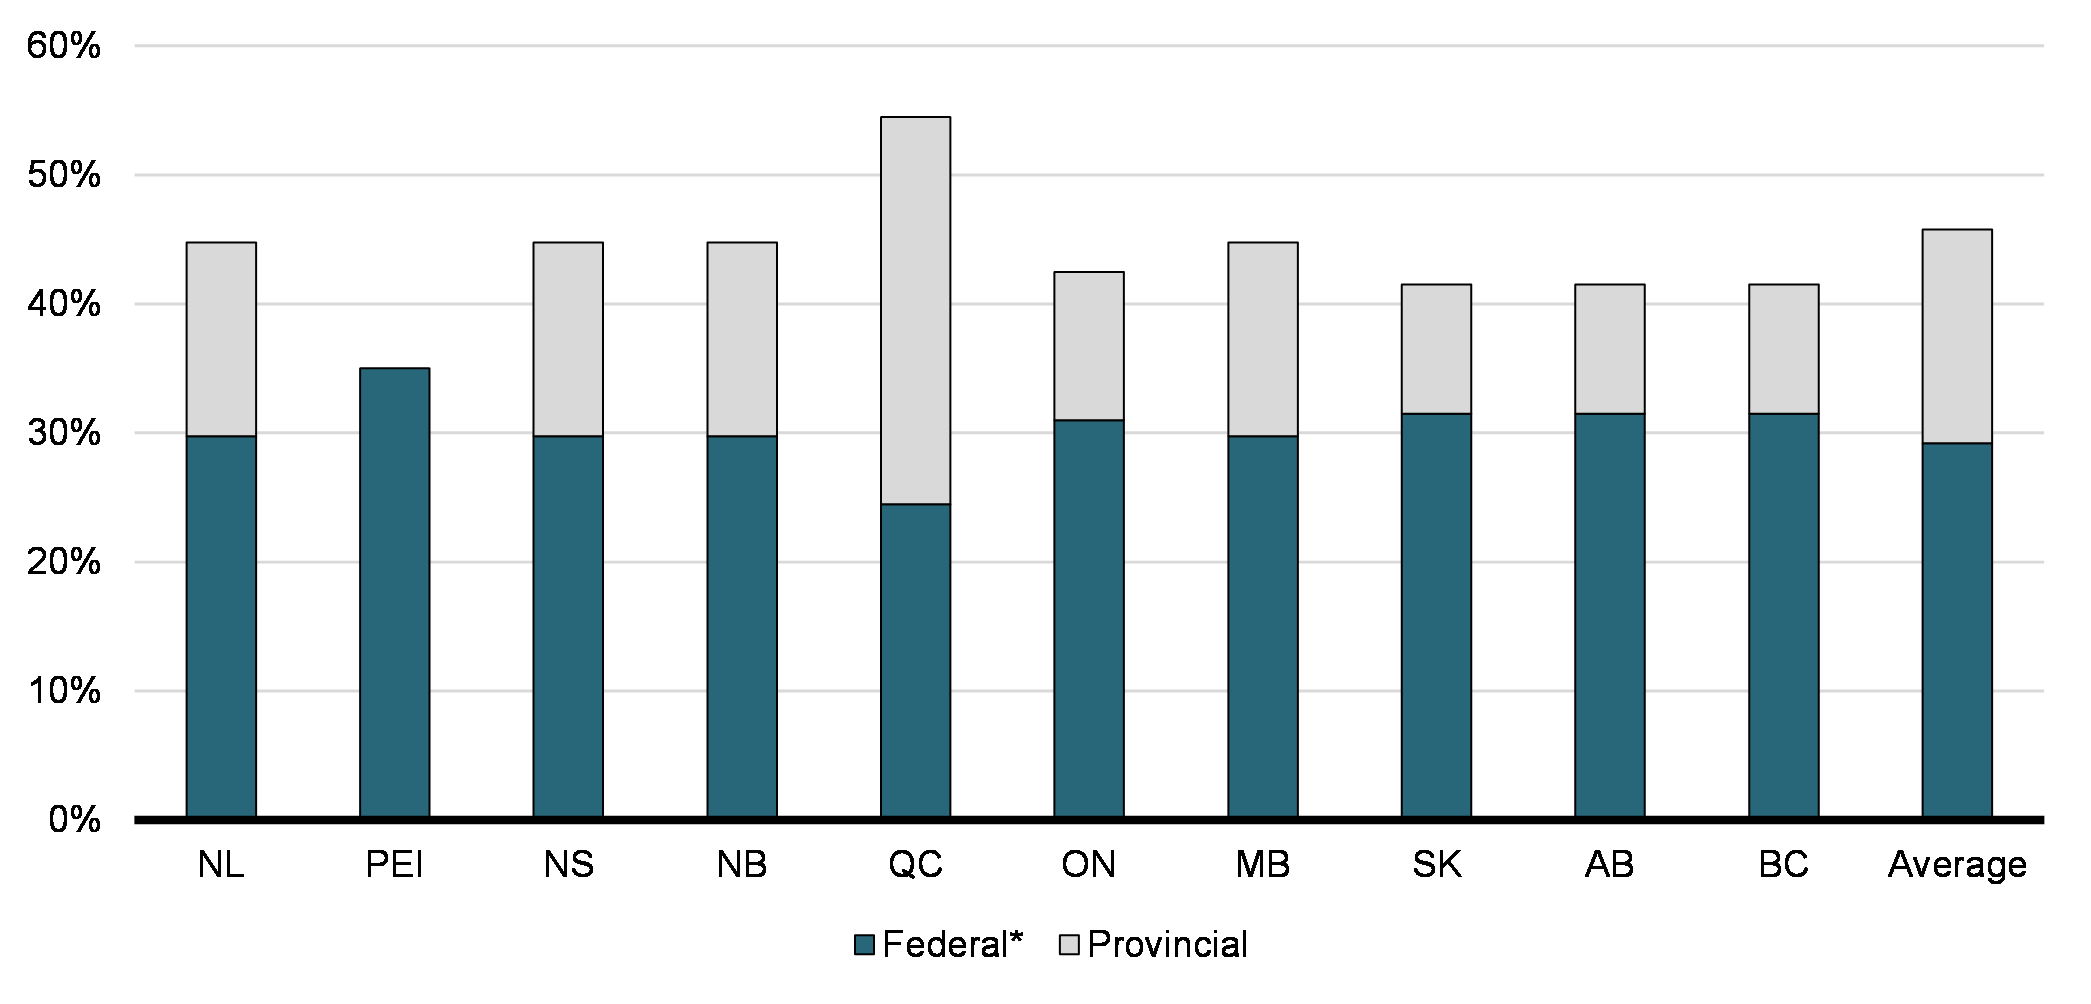
Combined Effective Federal-Provincial-Territorial Tax Credit Rates for Large Business, 2018
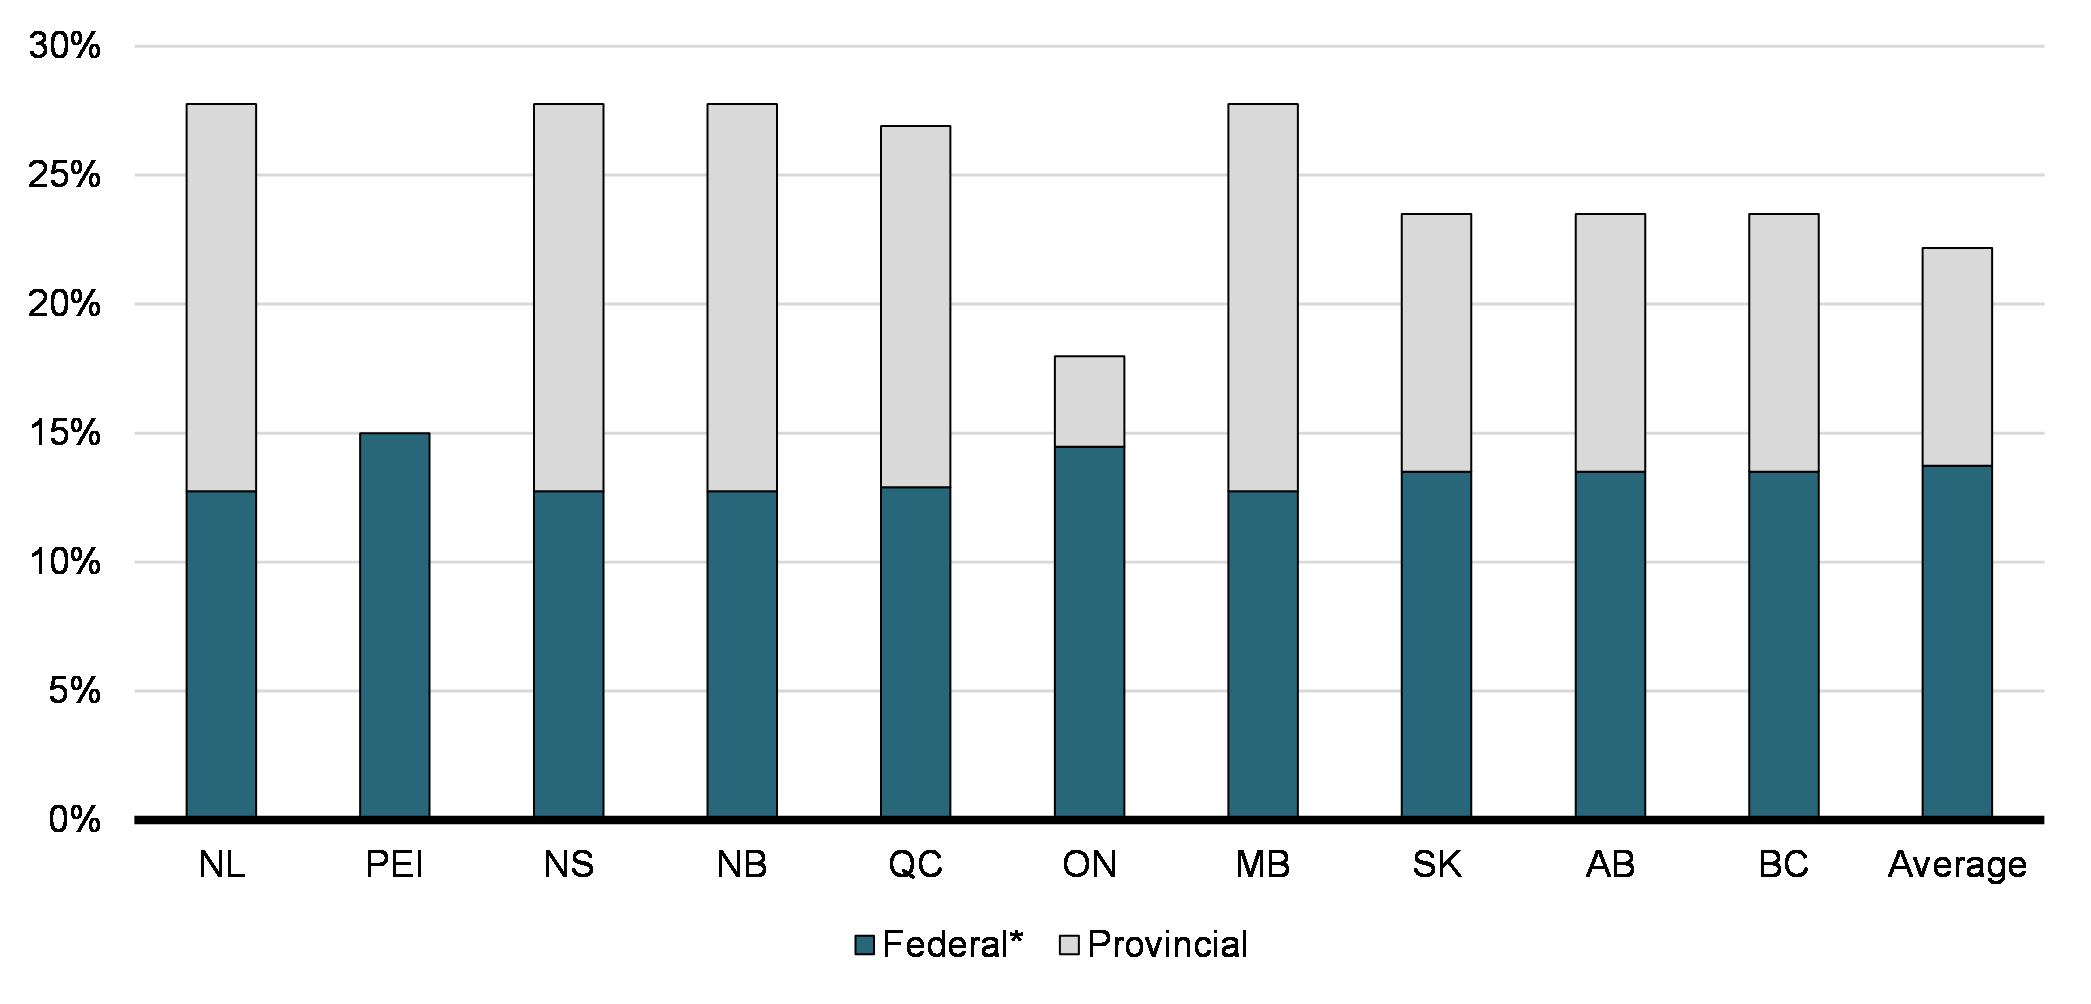
Combined Effective Federal-Provincial-Territorial Tax Credit Rates for Small Business, 2018
References
Agrawal, A., C. Rosell, and T. Simcoe (2020), “Tax Credits and Small Firm R&D Spending”, American Economic Journal: Economic Policy, 12(2), 1-21.
Appelt, S., F. Galindo-Rueda and A.C.G. Cabral (2019), “Measuring R&D Tax Support: Findings from the New OECD R&D Tax Incentives Database”, OECD Science, Technology and Industry Working Papers, no. 2019/06.
Baghana, R. and P. Mohnen (2009), “Effectiveness of R&D Tax Incentives in Small and Large Enterprises in Quebec”, Small Business Economics, v. 33, 91-107.
Bailey, M. and R. Lawrence (1992), “Tax Incentives for R&D: What Do the Data Tell Us?”, Technical report, Council on Research and Technology, Washington, DC.
Bernstein, J. I. (1986), “The Effect of Direct and Indirect Tax Incentives on Canadian Industrial R&D Expenditures”, Canadian Public Policy, 12(3), 438-48.
Bloom, N., L. Chennells, R. Griffith and J. Van Reenen (1997), “How Has Tax Affected the Changing Cost of R&D? Evidence from Eight Countries”, Institute for Fiscal Studies, IFS Working Papers: W97/03.
Bloom, N., R. Griffith and J. Van Reenen (2002) “Do R&D Tax Credits Work? Evidence from a Panel of Countries 1979-97”, Journal of Public Economics,85(1), 1-31.
Boadway, R., N. Bruce and J. Mintz (1984), “Taxation, Inflation, and the Effective Marginal Tax Rate on Capital in Canada”, Canadian Journal of Economics, February 1984, 17(1), 62-79.
Breitung, J. and S. Das (2005), “Panel Unit Root Tests Under Cross-Sectional Dependence”, Statistica Neerlandica, 59, 414-433.
Brouillette, D. (2011), “Estimating the Incremental Impacts of a Provincial R&D Tax Credit on Business R&D Expenditures Using a Natural
Experiment in British Columbia”, Economic Research and Policy Analysis Branch Working Paper Series, Working Paper 2014-06, Industry Canada.
Choi, I. (2001), “Unit Root Tests for Panel Data”, Journal of International Money and Finance, 20, 249-272.
Dagenais, M., P. Mohnen and P. Therrien (1997), “Do Canadian Firms Respond to Fiscal Incentives to Research and Development?”, CIRANO Scientific Series 97s-34.
Dagenais, M., P. Mohnen and P. Therrien (2004), “Les firmes canadiennes répondent-elles aux incitations fiscales à la recherche-développement?“, L’Actualité économique, 80(2/3), 175-206.
Guceri, I. and L. Liu (2019), “Effectiveness of Fiscal Incentives for R&D: Quasi-experimental Evidence”, American Economic Journal: Economic Policy, 11(1), 266-91.
Hadri, K. (2000), “Testing for Stationarity in Heterogeneous Panel Data”, The Econometrics Journal, 3, 148-161.
Hall, B. (1993), “R&D Tax Policy during the Eighties: Success or Failure?”, Tax Policy and the Economy, v. 7, 1-36.
Hall, B. and J. Van Reenen (2000), “How Effective Are Fiscal Incentives for R&D? A Review of the Evidence”, Research Policy, v. 29, 449-470.
Hall, R. and D. W. Jorgenson (1967), “Tax Policy and Investment Behavior”, American Economic Review,
v. 57, 391-414.
Harris, R. D. F. and E. Tzavalis (1999), “Inference for Unit Roots in Dynamic Panels Where the Time Dimension Is Fixed”, Journal of Econometrics, 91, 201-226.Im, K. S., M.H. Pesaran and Y. Shin (2003), “Testing for Unit Roots in Heterogeneous Panels”, Journal of Econometrics, 115, 53-74.
Jorgenson, D. (1963), “Capital Theory and Investment Behavior”, American Economic Review, 53(2), 247-259.
Kasahara, H., K. Shimotsu and M. Suzuki (2014), "Does an R&D Tax Credit Affect R&D Expenditure? The Japanese R&D Tax Credit Reform in 2003", Journal of the Japanese and International Economies, v. 31, 72-97.
King, M. A. and D. Fullerton (1983), “The Taxation of Income from Capital: A Comparative Study of the U.S., U.K., Sweden, and West Germany: The Theoretical Framework”, National Bureau of Economic Research, Working Paper no. 1058.
Lebeau, D. (1996), “Les mesures fiscales d’aide à la R-D et les entreprises québécoises“, Conseil de la science et de la technologie, Gouvernement du Québec.
Lester, J., A. Patry and D. Adéa (2007), “An International Comparison of Marginal Effective Tax Rates on Investment in R&D by Large Firms”, Department of Finance Canada, Working Paper 2007-07.
Levin, A., C.-F. Lin and C.-S. J. Chu (2002), “Unit Root Tests in Panel Data: Asymptotic and Finite-Sample Properties”, Journal of Econometrics, 108, 1-24.
Lokshin, B. and P. Mohnen (2012), “How Effective Are Level-based R&D Tax Credits? Evidence from the Netherlands”, Applied Economics, 44(12), 1527-1538.
McFetridge, D. and J. Warda (1983), “Canadian R & D Incentives: Their Adequacy and Impact”, Canadian Tax Paper, no. 70, Toronto: Canadian Tax Foundation, February.
McKenzie, K.J. (2008), “Measuring Tax Incentives for R&D”, International Tax and Public Finance, 15, 563-581.
Nadiri, M.I. and I. Prucha (1993), “Estimation of the Depreciation Rate of Physical and R&D Capital in the U.S. Total Manufacturing Sector”, National Bureau of Economic Research, Working Paper no. 4591.
Nadiri, M.I. and S. Kim (1996), “International R&D Spillovers, Trade and Productivity in Major OECD Countries”, National Bureau of Economic Research, Working Paper no. 5801.
OECD (2016), “R&D Tax Incentives: Evidence on Design, Incidence and Impacts”, OECD Science, Technology and Industry Policy Papers, no. 32, OECD Publishing, Paris.
Parsons, M. and N. Phillips (2007). “An Evaluation of the Federal Tax Credit for Scientific Research and Experimental Development”, Department of Finance Canada, Working Paper 2007-08.
Rao, N. (2016), “Do Tax Credits Stimulate R&D Spending? The Effect of the R&D Tax Credit in its First Decade”, Journal of Public Economics, v. 140, 1-12.
Shah, A. (1994), “The Economics of Research and Development: How Research and Development Capital Affects Production and Markets and Is Affected by Tax Incentives”, World Bank, Policy Research Department, Working Paper no. 1325.
Swenson, C. (1992), “Some Tests of the Incentive Effects of the Research and Experimentation Tax Credit”, Journal of Public Economics,49(2), 203-18.
Thomson, R. (2017), “The Effectiveness of R&D Tax Credits”, The Review of Economics and Statistics, 99(3), 544-549.