
Archived - Report on Federal Tax Expenditures - Concepts, Estimates and Evaluations 2023: part 8
Gender-Based Analysis Plus of Tax Expenditures: A Closer Look at Persons with DisabilitiesFootnote 1
1. Introduction
To better inform parliamentarians and Canadians on how government measures affect people based on gender and other intersecting identity factors, the Canadian Gender Budgeting Act requires that the Minister of Finance publish an annual Gender-based Analysis Plus (GBA Plus) of the impacts of existing tax expenditures based on various key identity factors. The GBA Plus studies published to date have focused on identity factors directly identifiable using T1 tax return data. The 2019 and 2020 studies looked at the impact of the personal income tax (PIT) system based on gender and family status, while the 2021 and 2022 studies examined the impact of additional identity factors, such as age, income group and region of residence. However, the “Plus” in GBA Plus indicates the need to consider identity factors that go beyond those directly identifiable in the tax data, such as ethnicity, sexual orientation or disability. The analysis presented in the current study focuses on the latter.
The federal government recognizes that a disability can represent a barrier to participation and has adopted measures to support the integration of persons with disabilities. A variety of federal programs are in place to help persons with disabilities earn a decent income while promoting their employment integration and social inclusion, including the Opportunities Fund for Persons with Disabilities and the Canada Student Grant for Students with Disabilities. Other programs, such as the Canada Pension Plan disability benefits and the Child Disability Benefit, also provide direct income support to individuals with disabilities.
The tax system is another mechanism used by the federal government to support Canadians with disabilities. The Canadian tax system recognizes that persons with disabilities and those who care for them may need to incur expenses that reduce their ability to pay taxes. It therefore offers tax relief to recognize those costs, including the Disability Tax Credit (DTC), the disability supports deduction (DSD) and the Medical Expense Tax Credit (METC).
However, the impacts of these tax expenditures on Canadians with disabilities cannot be assessed based solely on tax data. Although T1 tax data can be used to identify individuals who benefit from these tax expenditures, they do not allow for a comprehensive identification of all Canadians with disabilities. On the other hand, while the Canadian Survey on Disability (CSD) enables a more exhaustive identification of the population that reports having a disability, it does not contain the tax data needed to assess the extent to which that population benefits from these tax expenditures.
To address their respective limitations, a linkage was made between these two databases. The new linked dataset makes it possible to examine the use of certain federal tax expenditures by all individuals identified as having a disability. It also allows for a determination of the extent to which those individuals benefit from these tax expenditures.
Section 2 provides contextual information about this study, including details on the data used, an overview of the number and characteristics of persons identifying themselves as having a disability in Canada, and a list of tax expenditures of interest for the study, i.e., those that provide specific support to persons with disabilities or their caregivers. Section 3 continues by profiling the use of these tax expenditures by disability status. Section 4 completes the study by examining the distribution of benefits from these tax expenditures, and the extent to which they effectively assist persons with disabilities.
2. Context
2.1 Data
To analyze the benefits from federal tax expenditures accruing to Canadians with disabilities, the population of persons with disabilities must first be identified. As noted in the study on the Refundable Medical Expense Supplement (RMES) published in 2020,Footnote 2 this could be done by identifying the users of the two tax measures most directly targeted for this group in T1 return data, namely the DSD and the DTC. However, as those measures target specific categories of persons with disabilities—in particular the DTC targets those with certain severe and prolonged mental and physical
impairmentsFootnote 3—using DSD and DTC claims would underestimate the total population of taxfilers with a disability in Canada.
According to Statistics Canada, data on disability have been collected since the early 1980s, following a recommendation by a special Parliamentary Committee on the Disabled and Handicapped,Footnote 4 which asked “... that the Federal Government direct Statistics Canada to give a high priority to the development and implementation of a long-term strategy which will generate comprehensive data on disabled persons in Canada...”.Footnote 5 Since then, several changes have been made regarding the collection of reliable data on the population of persons with disabilities. These changes were made for several reasons, including to comply with certain international agreements concerning the definition and recognition of disability. In particular, Canada ratified the United Nations Convention on the Rights of Persons with Disabilities in 2010. Upon ratification, Employment and Social Development Canada launched a data development strategy to better understand the lives of Canadians with specific difficulties and limitations, and developed a new series of questions to identify persons with disabilities. After undergoing extensive qualitative and quantitative testing, these questions were used for the first time in the 2012 CSD. They were used again in the 2017 CSD, and the 2022 CSD, for which data are forthcoming. The CSD is now considered the most comprehensive source of information on persons with disabilities in Canada.
While the CSD provides more comprehensive information about different forms and intensities of limitations, and enables a better identification of persons identifying themselves as having disabilities, it contains very few details on the income earned and taxes paid by Canadians with disabilities, nor does it contain the tax data needed to examine the extent to which they benefit from existing tax expenditures. The ability to study the impact of federal tax expenditures on persons with disabilities is therefore limited when CSD and tax data remain separate.
To overcome this limitation, the Department of Finance Canada partnered with Statistics Canada to undertake a linkage exercise between the 2017 CSD data and the data from 2017 T1 returns. All CSD respondents who filed an income tax return for 2017 were linked to their respective tax files.Footnote 6 For taxfilers identified as being in a couple, the tax characteristics of their spouse were also included in the new database that was made available to the Department of Finance through the Federal Research Data Centre.Footnote 7
Overall, all CSD variables were included in the new linked database, in addition to certain tax variables for the respondent and their spouse (as applicable). Disability status can therefore be determined using the definition of disability from the CSD, i.e., “anyone who reported being ‘sometimes,’ ‘often’ or ‘always’ limited in their daily activities due to a long-term condition or health problem, as well as anyone who reported being ‘rarely’ limited if they were also unable to do certain tasks or could only do them with a lot of difficulty.”Footnote 8,Footnote 9 The tax variables retained include certain demographic characteristics (e.g., province of taxation), various sources of pre-tax income (e.g., employment, investment, capital gains and transfers), various tax measures that allow the calculation of after-tax income for individuals, and claims of tax expenditures designed to offer specific support to persons with disabilities and their caregivers.
2.2 Overview of the number and characteristics of Canadians with disabilities
A study published by Statistics Canada in 2018Footnote 10 based on the 2017 CSD found that about one-fifth of all Canadians aged 15 and older (or 6.2 million individuals) reported having a disability that limits their activities. Of these, 43% are categorized as having a severe or very severe disability.
This study also found that the older the individuals, the more likely they are to have at least one disability. While 13% of persons aged 15 to 24 years reported a disability, this percentage rises to 20% among adults aged 25 to 64 and to 38% among those aged 65 and over. The most commonly observed type of disability also varies by age. Among the youngest, disabilities related to mental health and learning are the most common, while those related to pain, mobility and flexibility are dominant among seniors. In all age groups, a slightly higher incidence of disabilities is observed among women.
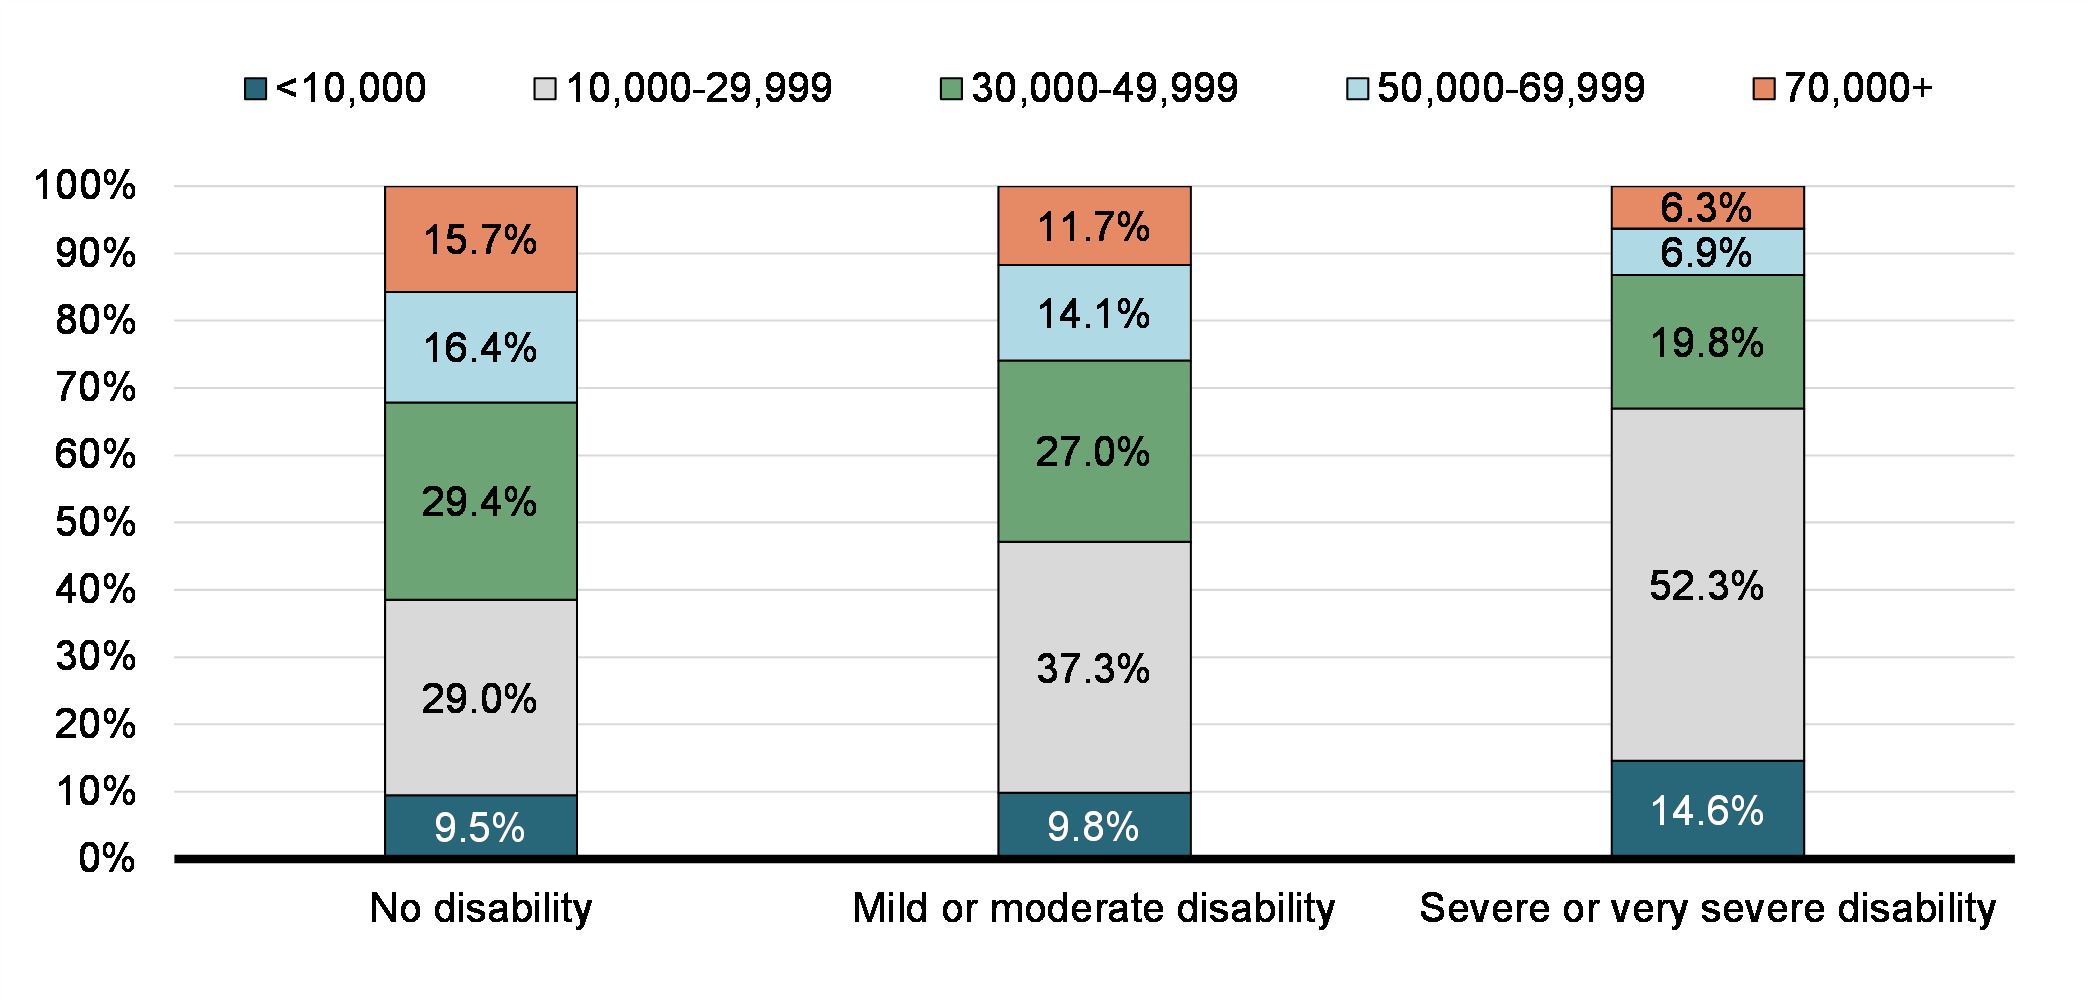
It also revealed that the presence of a disability, and particularly a severe or very severe disability, has an adverse impact on the employment status of working-age adults and on their income levels. As indicated in Chart 1, the proportion of adults with personal after-tax income under $30,000 is significantly higher among persons with severe or very severe disabilities (66.9%), or mild and moderate disabilities (47.1%) than among persons without disabilities (38.5%). The presence of a disability also significantly increases the likelihood of being in a low-family-income situation, especially among adults who are unattached.
Distribution by after-tax income for persons aged 25 years and over, by disability status and severity of disability, Canada, 2017
The data from 2017 T1 tax returns combined with data from the CSD reveal new findings concerning taxfilers with disabilities.Footnote 11 Table 1 shows that 22.6% of the 25.5 million adult taxfilers in the linked database are identified as having at least one disability. It also shows that nearly 43% of those adults have a severe or very severe disability based on the severity criteria set out in the CSD. These percentages are comparable to those estimated by Statistics Canada among the entire CSD population (i.e., all individuals aged 15 and over, whether taxfilers or not).
| Target population | |
|---|---|
| Number (#) of adults (i.e., individuals aged 18 or over*) | 27,276,000 |
| Number (#) of adult taxfilers** | 25,515,700 |
- Proportion (%) of adult taxfilers who did not report any disability*** |
77.4 |
- Proportion (%) of adult taxfilers who reported at least one disability |
22.6 |
- Proportion (%) of taxfilers with a disability, whose disability is categorized as mild or moderate |
57.5 |
- Proportion (%) of taxfilers with a disability, whose disability is categorized as severe or very severe |
42.5 |
|
Notes: *This includes the number of CSD respondents who were aged 16 and over in May 2016, at the time of the Census. **This refers to CSD respondents who could be matched to their tax file. Matching was not possible for some respondents due to inconsistencies in the matching variable. Although some may have completed an income tax return in 2017, they are excluded from the population of taxfilers. The total number of adult taxfilers may therefore differ from the number of taxfilers aged 18 years or more identified solely based on tax files. This difference can also be explained by the probability-based sample of the CSD which can lead to a certain margin of error around estimates, as well as by the exclusion of certain populations from the CSD sample.Footnote 12 ***Identification of disability and disability severity is based on definitions established as part of the CSD, not on eligibility criteria for the DTC. Source: CSD data combined with T1 tax return data, 2017. |
|
Table 2 profiles taxfilers aged 18 and over, by disability status. In particular, it shows that persons with disabilities, especially those with severe or very severe disabilities, are older on average. It also shows that this population is made up of a slightly higher percentage of women, unattached individuals, and individuals in the first two personal and family income quartiles. The last two lines of the table indicate that the average pre-tax family income of persons with disabilities ($52,600), and particularly those with severe or very severe disabilities ($42,200), is considerably lower than that of persons without disabilities ($72,300).
| All | No disability | Disability | Mild or moderate disability | Severe or very severe disability | |
|---|---|---|---|---|---|
| Distribution by sex (%) | |||||
Men |
47.9 | 49.2 | 43.5 | 45.3 | 41.0 |
Women |
52.1 | 50.8 | 56.5 | 54.7 | 59.0 |
| Average age (yrs.) | 49.2 | 47.1 | 56.7 | 53.8 | 60.5 |
| Distribution by age (%) | |||||
18 to 29 |
17.1 | 19.2 | 9.8 | 12.5 | 6.3 |
30 to 39 |
16.3 | 18.0 | 10.7 | 13.1 | 7.6 |
40 to 49 |
16.3 | 17.5 | 12.5 | 13.9 | 10.5 |
50 to 64 |
27.3 | 26.5 | 29.7 | 28.2 | 31.7 |
65 or over |
23.0 | 18.8 | 37.3 | 32.3 | 44.0 |
| Distribution by family type (%) | |||||
Unattached person (person not in a two-filer couple)* |
37.4 | 35.9 | 42.6 | 39.9 | 46.3 |
Person in a two-filer couple |
62.6 | 64.1 | 57.4 | 60.1 | 53.7 |
| Distribution by pre-tax personal income quartile (%) | |||||
1st quartile |
25.0 | 22.6 | 33.2 | 27.2 | 41.4 |
2nd quartile |
25.0 | 23.4 | 30.4 | 27.7 | 34.2 |
3rd quartile |
25.0 | 26.4 | 20.3 | 24.2 | 15.1 |
4th quartile |
25.0 | 27.6 | 16.0 | 20.9 | 9.4 |
| Distribution by adjusted family income quartile** (%) | |||||
1st quartile |
25.0 | 22.0 | 35.2 | 28.1 | 44.8 |
2nd quartile |
25.0 | 24.3 | 27.5 | 26.3 | 29.2 |
3rd quartile |
25.0 | 25.9 | 21.8 | 25.4 | 17.0 |
4th quartile |
25.0 | 27.8 | 15.5 | 20.2 | 9.0 |
| Average pre-tax personal income ($) | 52,700 | 56,400 | 40,300 | 46,700 | 31,700 |
| Average pre-tax adjusted family income ($) | 67,800 | 72,300 | 52,600 | 60,300 | 42,200 |
|
Notes: *This group refers to taxfilers who are unattached but also those whose partners did not file (or could not be matched). **Income is adjusted for the presence of a partner but ignores the presence of children under 18 in the family, as this number could not be reliably determined based on the available variables. The adjusted family income of an individual in a couple is obtained by dividing the individual’s total pre-tax family income by the square root of 2. No adjustment is made for unattached individuals. Source: CSD data combined with T1 tax return data, 2017. |
|||||
2.3 Tax expenditures that provide specific support to persons with disabilities or their caregivers
The federal PIT system includes measures designed to increase tax fairness by considering the effect of a severe and prolonged disability on individuals’ ability to pay taxes. Persons with these types of disability (or those who care for them) may face expenses related to their disability that reduce their income available to pay taxes. Some of these expenses are related to the purchase of specific goods and services whose costs can easily be detailed using invoices, while others are harder to quantify (e.g., custom-made clothing or more expensive transportation). Currently, three federal tax expenditures recognize some of the easily quantifiable expenses of persons with disabilities: the DSD, the METC and the Home Accessibility Tax Credit (HATC). The DTC and the Canada Caregiver Credit (CCC), meanwhile, recognize expenses that cannot be easily detailed.
Some federal tax measures also have social objectives in relation to disability, such as the HATC, which is designed to promote independence by recognizing the specific impact of costs for improving the safety, accessibility and functionality of a dwelling for persons with disabilities. The PIT system also includes incentives to save by helping individuals with severe disabilities and their family members accumulate savings to ensure their long-term financial security (Registered Disability Savings Plans (RDSP)).
Income support is another objective of some measures in the PIT system, providing income support to low-income families through refundable credits. Some of these measures are specifically targeted at families in which the presence of a disability can impose additional costs when joining the work force (i.e., the Canada Workers Benefit supplement (CWB-sup.) and the RMES).
The Goods and Services Tax (GST) system also includes several measures designed to reduce the additional expenses incurred by persons with disabilities or achieve social objectives, by making certain goods and services exempt from the federal sales tax or imposing a zero taxation rate (e.g., zero-rating of prescription medication or exempting hospital parking fees from the GST). However, the data used in this study do not allow for an analysis of the impact of this latter group of tax expenditures.
Table 3 presents a list of PIT expenditures that provide specific support to persons with disabilities or a supporting person or caregiver, and that are examined in the current study. It also provides an overview of the availability of data for each of these expenditures. Since this study is based on survey data linked to tax data, the unweighted observation counts are sometimes insufficient to meet Statistics Canada’s confidentiality criterion.
To overcome this limitation, the DSD and the HATC have been combined. When the counts were still insufficient, the statistics related to these measures have been excluded from the tables. For the same reason, individual statistics on amounts withdrawn from an RDSP also had to be omitted from the tables, and those related to the CWB-sup. were sometimes excluded.
Objectives |
Tax expenditures | Type | Availability of data |
|---|---|---|---|
| Recognize ability to pay | Medical Expense Tax Credit (METC) | Non-refundable credit | Always available |
| Disability Tax Credit (DTC) | Non-refundable credit | Always available | |
| Canada Caregiver Credit (CCC) | Non-refundable credit | Always available | |
| Disability supports deduction (DSD) | Deduction | Often insufficient | |
| Recognize ability to pay and achieve a social objective | Home Accessibility Tax Credit (HATC) | Non-refundable credit | Often insufficient |
| Provide income support | Canada Workers Benefit supplement (CWB-sup.) | Refundable credit | Sometimes insufficient |
| Refundable Medical Expense Supplement (RMES) | Refundable credit | Always available | |
| Provide income support and tax relief | Non-taxation of workers’ compensation (WC) benefits | Exemption | Always available |
| Non-taxation of RCMP pensions and other compensation in respect of injury, disability or death |
Exemption | Missing | |
| Non-taxation of social assistance (SA) benefits | Exemption | Always available | |
| Encourage savings | Registered Disability Savings Plans (RDSP) | Registered plans | Always insufficient |
Table 4 provides a brief description of the ten tax expenditures for which data are available (whether or not they meet Statistics Canada’s reliability criterion) and that are examined in this study, in whole or in part.
Tax expenditures |
Description |
|---|---|
| Medical Expense Tax Credit (METC) | The METC provides non-refundable tax relief to taxfilers for medical expenses and disability expenses incurred on their behalf, on their spouse or common-law partner’s behalf or on behalf of a dependant. These expenses must be supported by receipts. |
| Disability Tax Credit (DTC) | The DTC provides non-refundable tax relief to individuals with a severe and prolonged disability in recognition of expenses related to that disability that cannot be detailed. The person with the disability may claim the entire DTC or, if they do not need the full amount to reduce their income tax to zero, they may transfer the remaining amount to a supporting family member (including a spouse or common-law partner). |
| Canada Caregiver Credit (CCC) | The CCC provides non-refundable tax relief to taxfilers who care for an infirm family member (a spouse or common-law partner, child or certain relatives). |
| Disability supports deduction (DSD) | The DSD allows taxfilers with a mental or physical impairment to deduct from their total income certain expenses (such as attendant care expenses) incurred to carry on a business or pursue education. |
| Home Accessibility Tax Credit (HATC) | The HATC provides non-refundable tax relief in recognition of expenses related to the renovation or modification of a dwelling incurred in order to improve the accessibility and functionality of a dwelling for seniors and individuals eligible for the DTC. The individual, their spouse or common-law partner, or certain supporting relatives may claim the credit. |
| Canada Workers Benefit supplement (CWB-sup.) | The CWB is a refundable tax credit that supplements the earnings of low- and modest-income workers and aims to improve their work incentives. It includes a basic amount and a supplement for eligible persons with disabilities (CWB-sup.). The supplement is provided to persons eligible for both the CWB and the DTC. |
| Refundable Medical Expense Supplement (RMES) | The RMES is a refundable credit that provides low-income working Canadians with assistance for medical and disability-related expenses. Only the worker who claims the METC and/or the DSD can claim the RMES. |
| Non-taxation of workers’ compensation (WC) benefits | The non-taxation of WC benefits ensures that the compensation received by workers who were injured at workFootnote 13 are usually included in the taxfiler’s total income, but are deducted for the calculation of taxable income. |
| Non-taxation of social assistance (SA) benefits | The non-taxation of SA benefits ensures that SA benefits are included in the taxfiler’s total income and taken into account in determining income-tested credits and benefits, but exempted from the calculation of taxable income, recognizing the nature of this income source as a payment of last resort.Footnote 14 |
| Registered Disability Savings Plans (RDSP) | An RDSP is a tax-assisted long-term savings plan that may generally be established for the benefit of an individual under 60 years of age who is eligible for the DTC. Contributions to an RDSP are not deductible from income and the amounts withdrawn from it are not included in income for tax purposes. However, investment income accumulated in an RDSP is included in the calculation of the beneficiary’s taxable income when it is withdrawn from the plan. |
3. Use of the selected tax expenditures for persons with disabilities
Table 5 summarizes the usage of the tax expenditures of interest among all individual taxfilers aged 18 and over, by their personal disability status. Regardless of the individuals’ family situation (in a couple or not), the usage of a tax expenditure is determined by claims on their personal income tax returns. It first shows that, among the 5.8 million persons with disabilities, the most commonly claimed tax expenditure is the METC. The proportion of persons claiming the METC is only slightly lower among persons without a disability because this measure is available to all taxfilers with eligible medical expenses in a year, regardless of disability status. This is also true for the RMES, for which the eligibility criteria are based on the level of eligible medical expenses, the individuals’ family income level and their participation in the labour market, not on their personal disability status.
The second most common tax expenditures claimed by persons with disabilities are the DTC and the non-taxation of SA benefits.Footnote 15 Unlike the METC, RMES or non-taxation of SA benefits, the DTC directly targets persons with disabilities, which is why we see only a small proportion of persons without a disability claiming the credit. The main reason that proportion is not nil among this last group is because this credit can be claimed by a supporting person without a disability on behalf of a partner or another dependant who is unable to use the full amount.
For the DTC, the claim rate observed in the linked database understates the measure’s usage. Indeed, it captures the claim rate for the 2017 tax year as the T1 data as of January 29, 2019 (those where the tax data linked to the CSD data). However, at that date, the DTC claims reassessment process had not yet been completed by the Canada Revenue Agency. This process usually results in an increase in the number of claimants by about 20% annually.
Among the ten selected tax expenditures, the CCC is the most likely to be claimed by persons without a disability, as that measure is intended to provide tax relief for individuals who care for persons with disabilities. Family status plays a role in access to the CCC by persons with disabilities, as 4% of those who are in a couple have a partner who claims it, while unattached individuals do not have this option. It is interesting to note that, contrary to what may be expected, the CCC claim rate among persons with disabilities is slightly higher than among persons without disabilities. This suggests that a significant proportion of persons with disabilities themselves provide support to other persons with disabilities.
Table 5 confirms that, in the vast majority of cases, tax expenditures that have components that more specifically target persons with disabilities are actually much more likely to be claimed by individuals identified as having a disability in the CSD. This is particularly the case for the CWB-sup., the DTC, and the non-taxation of WC benefits and SA benefits. Some claimants of these tax expenditures are persons without a disability, largely because the questions on the disability survey and the eligibility criteria for these measures do not necessarily perfectly overlap. In particular, the evaluation report on the DTC (2004) noted that responses in surveys on disability may fail to cover everyone eligible for the DTC and may, on the other hand, include some individuals who should not be considered eligible.Footnote 16 This is also the case for the CWB-sup., and the non-taxation of WC benefits and SA benefits.
More generally, the results show that 45.8% of all persons with disabilities claimed at least one of the ten tax expenditures studied. As expected, this proportion is higher than for persons without a disability (23.6%), and increases with the severity of the disability, from 35.6% among persons with a mild or moderate disability to 59.6% among those with a severe or very severe disability (not reported).
| No disability | Disability | |
|---|---|---|
| Total number of adult taxfilers (#) | 19,746,700 | 5,769,000 |
| Medical Expense Tax Credit | 18.4 | 22.5 |
| Disability Tax Credit (for self or transferred from a dependant, including partners) | 2.0 | 13.5 |
| Canada Caregiver Credit | 1.4 | 2.0 |
| Total deduction for disability supports deduction and Home Accessibility Tax Credit* | 0.1 | 0.2 |
| Canada Workers Benefit supplement | 0.0 | 0.5 |
| Refundable Medical Expense Supplement | 2.0 | 2.2 |
| Non-taxation of workers’ compensation benefits | 1.6 | 4.1 |
| Non-taxation of social assistance benefits | 2.4 | 13.5 |
| Any of the ten selected tax expenditures | 23.6 | 45.8 |
|
Notes: *The results for the DSD and HATC had to be combined to obtain counts high enough to meet the confidentiality test for the database consisting of the CSD and T1 tax return data. Source: CSD data combined with T1 tax return data, 2017. |
||
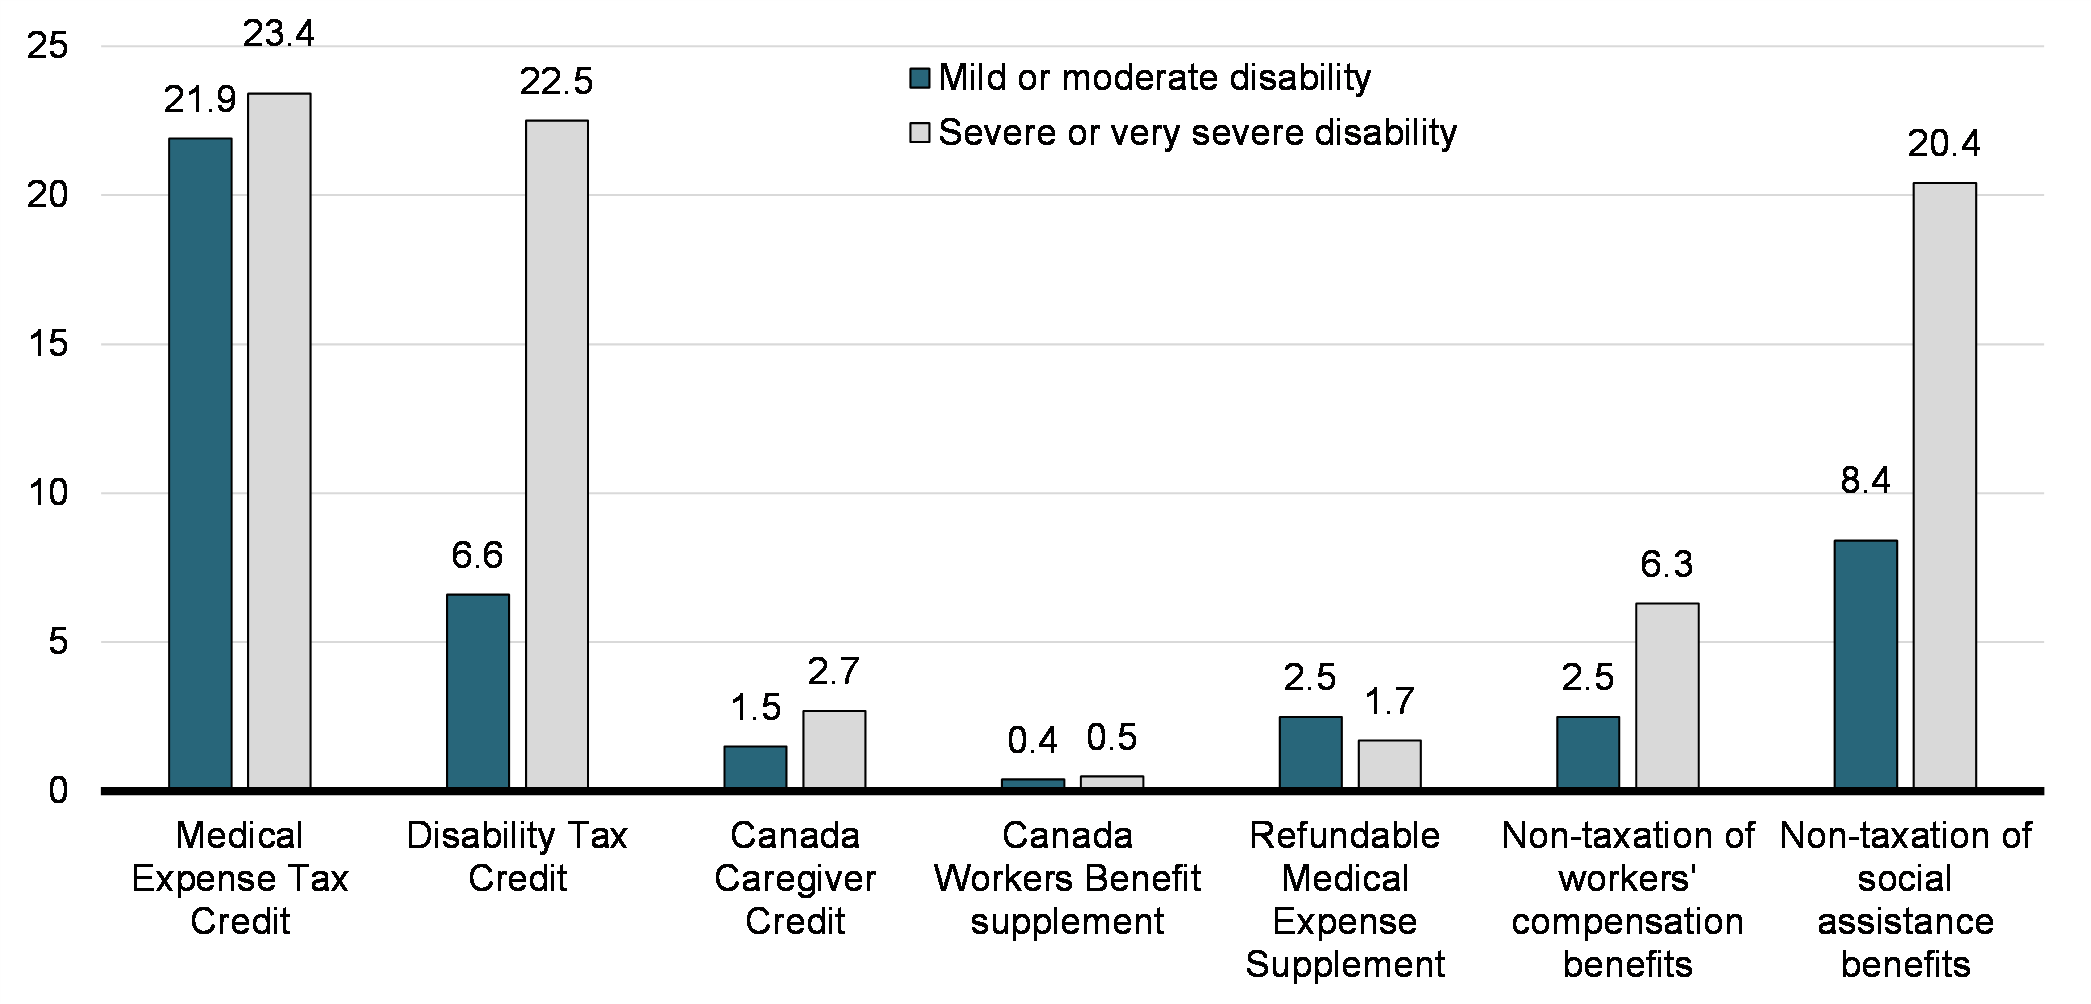
Furthermore, when we look at the claim rate for these tax expenditures based on the severity of the disability (Chart 2), we see that it is DTC usage that varies the most according to this criterion. This observation is consistent with the nature of the credit, which targets persons with severe and prolonged impairment in specific areas of daily living.Footnote 17 There is also a statistically significant difference between the claim rate of the non-taxation of WC benefits and SA benefits among persons with a mild or moderate disability and those with a severe or very severe disability. However, the difference observed between these two groups is small or not statistically significant for all other measures studied. The proportion of RMES claimants is even slightly higher among persons with mild or moderate disabilities. This result is probably explained by the RMES eligibility condition that taxfilers must report a certain amount of employment income.
Proportion (%) of claimants of selected PIT expenditures for persons with disabilities, among adult taxfilers, by severity of disability, 2017
4. Benefits from the selected tax expenditures for persons with disabilities
This section shifts the focus from individuals who claim the ten selected tax expenditures to those who actually benefit from them, i.e., those who realize personal federal tax savings as a result of claiming. The GBA Plus studies published in recent years have mostly focused on analyzing the impacts and distribution of such benefits.
4.1 Number of beneficiaries, benefit amounts and distribution of benefits
Not all claimants of a tax expenditure obtain tax savings as a result of claiming. They must meet all eligibility criteria for the measure and, with the exception of refundable credits, have enough taxable income to be able to benefit from a reduction in tax payable. To assess whether claimants benefit directly from a tax expenditure, it must be determined whether they would have had more net federal tax payable without that tax expenditure, all else being equal. When this occurs, the “total direct benefits amount” will be equivalent to the amount of net federal tax saved as a result of claiming the tax expenditure.
Table 6 suggests that 36.9% of individual taxfilers with disabilities would have had no federal tax payable even in the absence of the tax expenditures under consideration, given their already low level of taxable income. By comparison, these proportions are 24.9% for taxfilers without disabilities and 45.5% for those with severe or very severe disabilities. Table 6 also shows that the existence of these ten tax expenditures increases the proportion of taxfilers with disabilities who have no federal tax payable by 9.5 percentage points (46.4% minus 36.9%). The greater proportion of taxfilers with no federal income tax payable among persons with disabilities means that this population is somewhat less likely to benefit from the tax expenditures under review when claiming.
| No disability | Disability | Mild or moderate disability | Severe or very severe disability | |
|---|---|---|---|---|
| Proportion (%) of adult taxfilers who would pay no net federal tax if all the selected tax expenditures were not available** | 24.9 | 36.9 | 30.6 | 45.5 |
| Proportion (%) of adult taxfilers who paid no net federal tax in the presence of all selected tax expenditures | 26.5 | 46.4 | 35.8 | 60.8 |
| Proportion (%) of beneficiaries relative to claimants | 82.2 | 67.9 | 74.8 | 62.2 |
|
Notes: *The RMES and the CWB-sup. are not considered for the production of these estimates since they are applied after the calculation of net federal tax paid. **Assuming no behavioural change in the use of other existing tax measures in the absence of the selected group of tax expenditures. Source: CSD data combined with T1 tax return data, 2017. |
||||
On the other hand, Table 7 shows that 31.1% of taxfilers with disabilities benefited from at least one of the ten tax expenditures, compared to 19.4% of those without disabilities. That proportion increases to 37.1% among persons with severe or very severe disabilities. This table also suggests that the METC, the DTC, and the non-taxation of SA benefits and WC benefits are not only the most claimed federal tax expenditures among taxfilers with disabilities, but are also the most likely to result in tax savings.
Further, Table 7 indicates that, among beneficiaries of any of the ten tax expenditures, the total benefit received is higher on average among persons with disabilities, and particularly those with severe or very severe disabilities. Among persons with disabilities, those who benefit from the DTC and the non-taxation of WC benefits saved the largest average amount of taxes. For some tax expenditures, beneficiaries without disabilities tended to benefit from slightly higher tax savings on average because their level of income is generally higher, often allowing them to save more or use more of the non-refundable credits.
| No disability | Disability | Mild or moderate disability | Severe or very severe disability | |||||
|---|---|---|---|---|---|---|---|---|
| % | $ | % | $ | % | $ | % | $ | |
| Medical Expense Tax Credit | 15.3 | 350 | 16.4 | 380 | 17.3 | 360 | 15.1 | 420 |
| Disability Tax Credit (for self or transferred from a dependant, including partners) | 1.5 | 1,170 | 8.1 | 1,050 | 4.5 | 1,070 | 12.9 | 1,040 |
| Canada Caregiver Credit | 1.1 | 680 | 1.0 | 570 | 1.0 | 590 | 1.1 | 540 |
| Total deduction for the disability supports deduction and Home Accessibility Tax Credit | 0.1 | 910 | 0.1 | 740 | X | X | X | X |
| Canada Workers Benefit supplement | 0.0 | 460 | 0.5 | 430 | 0.4 | 420 | 0.5 | 440 |
| Refundable Medical Expense Supplement | 2.0 | 280 | 2.2 | 350 | 2.5 | 320 | 1.7 | 400 |
| Non-taxation of workers’ compensation benefits | 1.4 | 1,120 | 3.3 | 1,750 | 2.1 | 1,320 | 4.9 | 2,010 |
| Non-taxation of social assistance benefits | 0.6 | 610 | 4.4 | 550 | 2.9 | 630 | 6.5 | 500 |
| Any of the ten selected tax expenditures | 19.4 | 550 | 31.1 | 840 | 26.7 | 680 | 37.1 | 1,000 |
|
Notes: “X” means that the estimate was suppressed to meet the confidentiality requirements of the Statistics Act. Source: CSD data combined with T1 tax return data, 2017. |
||||||||
Table 8 shows that more than 40% of all tax savings from the ten tax expenditures directly benefited persons with disabilities, while that population accounted for 22.6% of adult taxfilers. These measures are not intended solely for persons with disabilities, either because they are designed to provide income support or support for medical care costs for the entire population, or because they are intended for, or transferrable to, supporting persons. For most of these measures, however, the proportion of total benefits that is received by persons with disabilities is above the proportion they represent among all taxfilers. The only exception is the CCC, a measure that aims to provide support to individuals who care for persons with disabilities. Moreover, while the respective shares of benefits received by persons with disabilities from the METC and the RMES are only slightly greater than the proportion this population represents among all taxfilers, the shares of benefits from the DTC, the CWB-sup. and the non-taxation of WC and SA benefits are significantly higher. This overrepresentation of benefits is especially important among persons with severe or very severe disabilities, with the exception of the RMES, probably partly because of its labour force participation requirements.
| No disability | Disability | Mild or moderate disability | Severe or very severe disability | |
|---|---|---|---|---|
| Distribution of total 18+ taxfiler population as a % | 77.4 | 22.6 | 13.0 | 9.6 |
| Distribution in % of benefits received from each tax expenditure: | ||||
| Medical Expense Tax Credit | 74.4 | 25.6 | 14.6 | 11.0 |
| Disability Tax Credit (for self or transferred from a dependant, including partners) | 41.8 | 58.2 | 19.2 | 39.0 |
| Canada Caregiver Credit | 81.1 | 18.9 | 10.8 | 8.2 |
| Total deduction for the disability supports deduction and Home Accessibility Tax Credit | 76.2 | 23.8 | X | X |
| Canada Workers Benefit supplement | 18.7 | 81.3 | 39.4 | 41.9 |
| Refundable Medical Expense Supplement | 71.9 | 28.1 | 17.2 | 10.9 |
| Non-taxation of workers’ compensation benefits | 48.7 | 51.3 | 14.3 | 37.0 |
| Non-taxation of social assistance benefits | 35.0 | 65.0 | 28.3 | 36.7 |
| Any of the ten selected tax expenditures | 58.1 | 41.9 | 16.5 | 25.3 |
|
Notes: “X” means that the estimate was suppressed to meet the confidentiality requirements of the Statistics Act. Because of the high variability around the 23.8% estimate associated with the deduction for the DSD and HATC, it cannot be concluded that this proportion is statistically higher than the proportion of individuals with disabilities among all taxfilers (22.6%). Source: CSD data combined T1 tax return data, 2017. |
||||
4.2 Main beneficiaries among the entire population
The distribution of benefits between adults with and without disabilities, as compared to the percentage of the overall population these groups represent (first line of Table 9), makes it possible to see the extent to which the ten tax expenditures benefit each group. However, to examine the extent to which these tax expenditures actually play a role in mitigating pre-tax income inequalities between these groups, another indicator is considered more appropriate, namely a ratio that captures the total share of benefits received by each group compared to the share of total pre-tax income reported by those groups (second line of Table 9). Drawing conclusions based on this last ratio allows for a distinction between the impact of the tax system and the impact of pre-existing income differences between the groups
studied.Footnote 18
| No disability | Disability | Mild or moderate disability | Severe or very severe disability | |
|---|---|---|---|---|
| Distribution of total 18+ taxfiler population as a % | 77.4 | 22.6 | 13.0 | 9.6 |
| Distribution of total pre-tax income as a % | 82.7 | 17.3 | 11.5 | 5.8 |
|
Source: CSD data combined T1 tax return data, 2017. |
||||
For each selected tax expenditure, Table 10 shows the ratios calculated for persons with and without disabilities, with a mild or moderate disability, and with a severe or very severe disability. These ratios confirm that, for all the tax expenditures, the proportion of benefits received by taxfilers with disabilities is greater than the proportion of pre-tax income they report. For example, while taxfilers with disabilities reported 17.3% of all pre-tax income, they received 28.1% of RMES benefits, a ratio of 1.62. A ratio over one suggests that a tax expenditure is beneficial for a group, as it redistributes income towards that group, and thus reduces pre-tax income inequalities that exist between it and the rest of the population.
Based on these ratios, Table 10 classifies each tax expenditure of interest as being particularly beneficial for: (1) taxfilers without disabilities; (2) taxfilers with a mild or moderate disability; and (3) taxfilers with a severe or very severe disability. Based on this classification, it is clear that taxfilers with disabilities— whether mild, moderate, severe or very severe—benefited relatively more from the federal tax expenditures providing support to persons with disabilities. The only exceptions are the CCC for taxfilers with a mild or moderate disability, and the DSD combined with the HATC, for which the results cannot be released as there were not enough observations to meet the Statistics Canada reliability criterion.
The same table suggests that, in 2017, the four federal PIT expenditures most beneficial to taxfilers with severe or very severe disabilities were the CWB-sup., the DTC and the non-taxation of WC benefits and SA benefits. The CWB-sup. and the non-taxation of SA benefits were also particularly beneficial for taxfilers with mild or moderate disabilities.
| Tax expenditure | Ratio by disability status | Groups that especially benefit | |||||
|---|---|---|---|---|---|---|---|
| No disability (1) |
Disability | Mild or moderate disability (2) |
Severe or very severe disability (3) |
No disability (1) |
Mild or moderate disability (2) |
Severe or very severe disability (3) |
|
| Medical Expense Tax Credit | 0.90 | 1.48 | 1.27 | 1.90 | |||
| Disability Tax Credit | 0.51 | 3.36 | 1.67 | 6.72 | |||
| Canada Caregiver Credit | 0.98 | 1.09 | 0.94 | 1.41 | |||
| Total deduction for the disability supports deduction and Home Accessibility Tax Credit* | 0.92 | 1.38 | X | X | X | ||
| Canada Workers Benefit supplement | 0.23 | 4.70 | 3.43 | 7.22 | |||
| Refundable Medical Expense Supplement | 0.87 | 1.62 | 1.50 | 1.88 | |||
| Non-taxation of workers’ compensation benefits | 0.59 | 4.70 | 1.24 | 6.38 | |||
| Non-taxation of social assistance benefits | 0.42 | 3.76 | 2.46 | 6.33 | |||
| Any of the ten selected tax expenditures | 0.70 | 2.42 | 1.44 | 4.37 | |||
|
Notes: A threshold of more than 1.05 and less than 0.95 indicates that a group benefits respectively more or less from a tax expenditure than others. |
|||||||
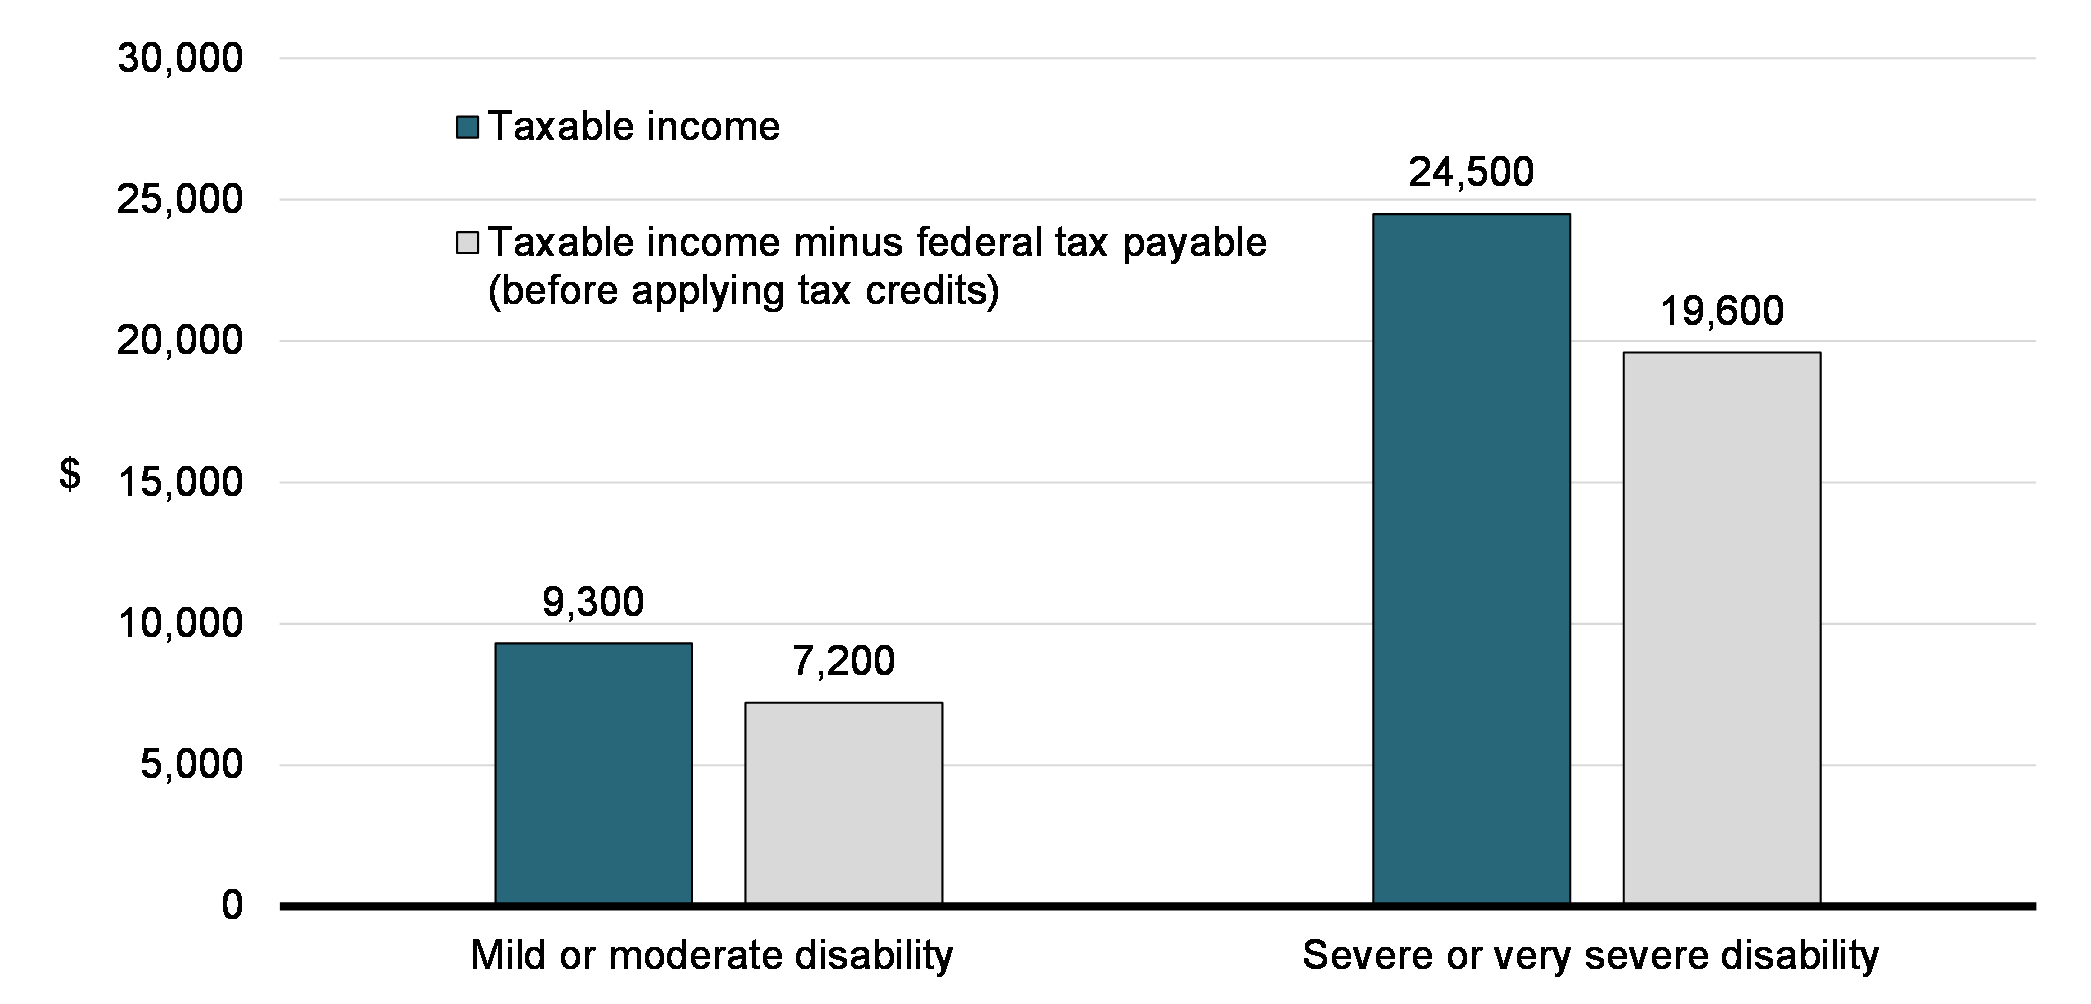
Moreover, since persons with disabilities generally earn lower incomes than persons without disabilities, some other more general components of the PIT system can contribute to reducing income inequalities between these groups, including the Basic Personal Amount (BPA) and the progressive tax rate structure. In Table 11, the ratios show that the BPA indeed provides a slight advantage to persons with disabilities. Furthermore, Chart 3 indicates that the gap in average income between persons with and without disabilities is also reduced by the application of the progressive tax rate structure. It further indicates that this reduction increases with the severity of the disability. After applying the tax rate structure, the personal income gap decreases by $2,100 for taxfilers with a mild or moderate disability and by $4,900 for taxfilers with a severe or very severe disability. Hence, these two components of the federal tax system also effectively contributed to reducing income inequalities between taxfilers with and without disabilities in 2017, particularly those with severe or very severe disabilities.
Tax expenditure |
Ratio by disability status | ||
|---|---|---|---|
| No disability | Mild or moderate disability | Severe or very severe disability | |
| Credit for the Basic Personal Amount (BPA) | 0.98 | 1.09 | 1.14 |
|
Note: A threshold of more than 1.05 and less than 0.95 indicates that a group benefits respectively more or less from a tax expenditure than others. Source: CSD data combined with T1 tax return data, 2017. |
|||
Average personal income gap (in $) between taxfilers with disabilities (mild or moderate, and severe or very severe) and those without disabilities, before and after the application of the tax rate structure, 2017
4.3 Main beneficiaries among the population with disabilities
The benefit generated by the tax expenditures under consideration can vary based on certain characteristics of persons with disabilities. Using the indicator discussed above, which controls for pre-tax income differences between groups, Table 12 identifies the groups among the population of persons with disabilities who benefited relatively more or less from the ten tax expenditures. It indicates that, among taxfilers with disabilities, those who receive Canada Pension Plan/Quebec Pension Plan (CPP/QPP) disability benefits or private insurance plan benefits, who have a severe or very severe disability, who have income below the median, who have multiple disabilities or who are aged 65 and over, benefit relatively more. Taxfilers who report an “other” type of disability (i.e., memory disabilities or unknown disabilities) also appear to be advantaged by these ten tax expenditures.
| Any of the ten selected tax expenditures | ||
|---|---|---|
| Ratios for persons with disabilities (PWD) | Groups of PWD who benefit relatively more, less or equally | |
| Gender | ||
Men |
0.99 | relatively equally |
Women |
1.02 | relatively equally |
| Age group | ||
Under 65 |
0.88 | relatively less |
65 or over |
1.15 | relatively more |
| In a couple | ||
No |
1.03 | relatively equally |
Yes |
0.98 | relatively equally |
| Quartile of pre-tax personal income | ||
Q1-Q2 (i.e., below median) |
1.51 | relatively more |
Q3-Q4 (i.e., above median) |
0.81 | relatively less |
| Quartile of pre-tax family income | ||
Q1-Q2 (i.e., below median) |
1.63 | relatively more |
Q3-Q4 (i.e., above median) |
0.72 | relatively less |
| Severity of the disability | ||
Mild to moderate |
0.60 | relatively less |
Severe or very severe |
1.81 | relatively more |
| Type of disability | ||
Mental health, learning and development |
0.69 | relatively less |
Pain, mobility and flexibility |
0.92 | relatively less |
Vision, hearing, dexterity |
0.95 | relatively equally |
Other* |
1.42 | relatively more |
| Number of disabilities | ||
Just one |
0.49 | relatively less |
Several |
1.30 | relatively more |
| Receives CPP/QPP disability benefits or benefits under a private insurance plan (insurance) | ||
Yes |
2.80 | relatively more |
No |
0.82 | relatively less |
|
Notes: A threshold of more than 1.05 and less than 0.95 indicates that a group benefits respectively more and less from a tax expenditure than others. *The “other” type of disability includes memory disabilities and unknown disabilities. Appendix B of the document Canadian Survey on Disability, 2017: Concepts and Methods Guide specifies that “Persons with an unknown disability are identified as persons whose daily activities are limited because of any long-term health problem or condition other than the 10 specific types of disabilities identified by the survey (seeing, hearing, mobility, flexibility, dexterity, pain, learning, developmental, mental health and memory disabilities). Two questions are used to identify persons with an unknown disability. First, respondents were asked if they have any other health problem or long-term condition (not already reported) that has lasted or is expected to last for six months or more. When the respondent said ‘yes’ to this question, a subsequent question was asked regarding how often this health problem or condition limited their daily activities.” Source: CSD data combined with T1 tax return data, 2017. |
||
5. Conclusion
Extending the scope of the GBA Plus studies published to date, this study uses a new database that combines 2017 CSD data and data from 2017 T1 returns to profile Canadians with disabilities. It provides, for the first time, an overview of the impact of elements of the federal PIT system on all persons with disabilities in Canada. It focuses in particular on the use and benefits received from ten tax expenditures that recognize the reduced ability of persons with disabilities to pay taxes.
Among other results, the study shows that all of these tax expenditures contribute, in varying degrees, to reducing the pre-tax income inequalities that exist between persons with and without disabilities. The study also notes more significant redistributive effects towards persons with severe or very severe disabilities. It further identifies the most beneficial federal PIT expenditures for taxfilers with severe or very severe disabilities, namely the CWB-sup., the DTC and the non-taxation of WC benefits and SA benefits.
In addition to persons with severe or very severe disabilities, the study identifies other groups of persons with disabilities who especially benefit from the tax expenditures under review, namely those who receive CPP/QPP disability benefits or private insurance plan benefits, those with personal and family income below the median, those with multiple disabilities, those aged 65 and over, and those whose disability is related to memory or of unknown type.
The study also finds that other more general elements of the PIT system play a significant redistributive role towards persons with disabilities, including the progressive tax rate structure and the Basic Personal Amount.
It is important to note that the tax system is only one mechanism used by the federal government to provide support to Canadians with disabilities. Other government programs are also available, including direct income support programs and education and employment assistance programs, as well as indirect transfer programs of financial resources to the provinces and territories.
Appendix A
| Identification for the CSD | Eligibility for the DTC | |
|---|---|---|
| Target population | Individuals whose activities are limited due to a condition or health problem that affects their ability to see, hear, move, learn, memorize or focus, an emotional, psychological or mental health disorder, or any other long-term health problem. | Individuals with a severe and prolonged impairment in one of the following or significant limitations in two of the following categories of basic activities of daily living: vision, hearing, speaking, dressing, walking, feeding, eliminating (bowel or bladder functions), or mental functions. Individuals who receive therapy to support a vital function may also be eligible. |
| Means of identifying the condition | Self-declaration | Self-declaration and certification by a medical practitioner |
| Duration of the condition | At least 6 months | At least 12 months |
| Severity of the condition | The severity of the disability is determined based on an overall disability score that considers the intensity of the difficulties (no difficulty, some difficulty, a lot of difficulty, or cannot do) and the frequency of the limitation of activities (never, rarely, sometimes, often or always). A score is assigned for each of the 10 types of disability. This score increases with the level of difficulty and the frequency of the limitation. The overall severity score for an individual is then obtained by calculating the average standardized scores for the 10 types of disability. To be classified as having a severe disability, a person must obtain a maximum score in at least one type of disability, a medium score in a few types or a low score in several types of disabilities. | The disability must significantly limit the person’s ability to carry out one or more basic activities of daily living. They must be unable or require an inordinate amount of time (i.e., take significantly more time than is usually required by persons who do not have the individual's impairment) to do the activity or activities, even with the use of appropriate therapy, medication, and devices. The limitation(s) must also be present all or substantially all of the time (interpreted as generally at least 90% of the time). |