
Archived - Report on Federal Tax Expenditures - Concepts, Estimates and Evaluations 2023: part 9
Profile of the Northern Residents DeductionsFootnote 1
1. Introduction
The Northern Residents Deductions (NRD) isFootnote 2 a set of deductions available to those who live in a prescribed zone in the more northerly regions of Canada. The NRD recognizes the increased living costs faced by individuals in these areas and assists in drawing skilled labour to northern and isolated communities. The NRD was introduced in Budget 1986 and its current design was implemented in 1991.
This study presents a profile of the NRD. Section 2 provides historical and other background information on the measure. Section 3 discusses the data used for the analysis. Section 4 looks at usage of the NRD by claimants, with a focus on the different components of the measure. Section 5 examines the benefits received by claimants. Concluding remarks are provided in Section 6.
2. Background and Overview
2.1 Background
In the late 1970s, concerns were raised about the non-reporting of employer-provided taxable housing and other benefits for workers in the north. In considering the matter, the government initially approved a remission order, effectively temporarily rendering some benefits non-taxable, but planned to phase back in their taxation. Ultimately, with a view to encourage development in the north and "achieve equity between employees and the self-employed", Budget 1986 announced a system of tax benefits for housing and travel for "residents of the north and isolated posts", effective January 1, 1987. Eligibility for the NRD was initially on a community-by-community basis, with the criteria similar to rules for northern-and isolated-area pay premiums among federal employees. However, this meant some communities were eligible for the NRD while other adjacent ones were not.
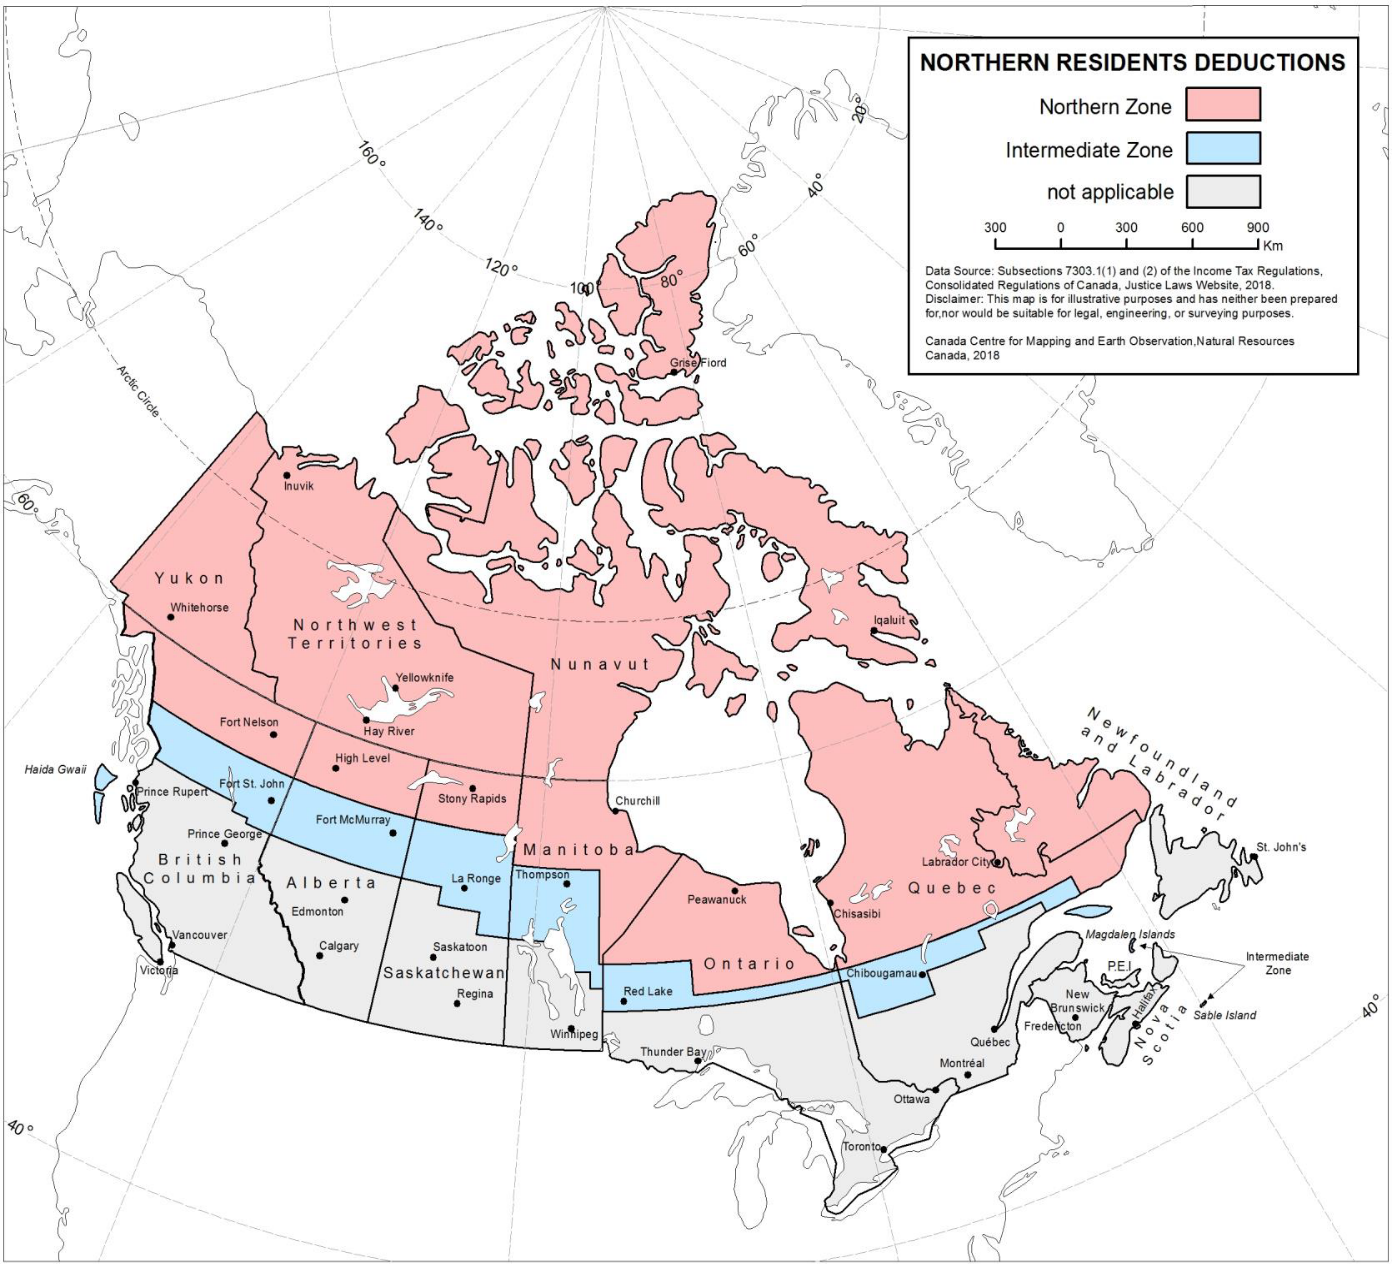
To improve fairness, the government created the Task Force on Tax Benefits for Northern and Isolated Areas. Its report recommended an overhaul of the eligibility criteria as well as the creation of a single Northern Zone (NZ) (Department of Supply and Services Canada, 1989). Drawing on the conclusions of the report and additional consultations, the government established the NZ as well as an Intermediate Zone (IZ), effective January 1, 1991 (Pigeon, 2004). A map of the NZ and IZ boundaries is provided in Appendix A.
2.2 Deduction Components
The NRD includes a residency deduction and a travel deduction.
The residency component is split between basic and additional residency amounts. The basic residency amount is calculated as the number of days in the year a claimant lived in a prescribed zone (six months, at a minimum) multiplied by the daily rate. The additional residency amount is calculated similarly, but applies only if the claimant maintained and lived in a dwelling in the prescribed zone, and if the claimant was the only person claiming the basic amount for living in that dwelling. Following Budget 2016, the maximum daily residency deduction (i.e., basic and additional amounts) is $22.00 for those residing in an NZ and $11.00 for those residing in an IZ.Footnote 3 Claimants who receive special work site non-taxable benefits see their residency deduction reduced accordingly.Footnote 4 The total residency claim is also limited to 20% of the claimant's net income.
The travel component of the NRD may be claimed for trips of a medical nature, and up to two of any other nature, that began in a prescribed zone.Footnote 5 The trip may be taken by the claimant or by an eligible family member.Footnote 6 For the NZ, the maximum deduction is the lowest of:
- the taxable travel benefits received from employment for the trip or, as announced in Budget 2021, for the 2021 and later taxation years, the portion of a standard $1,200 amount allocated to the trip;
- the total travel expenses paid for the trip; or
- the cost of the lowest return airfare available at the time of the trip between the airport closest to the claimant's residence and the nearest designated city to that airport,Footnote 7 whether or not travel was made by air or to that city.
Residents of the prescribed NZ may claim 100% of the amounts described above, while residents of the prescribed IZ may claim 50%.Footnote 8
3. Data
The data used in this study covers the 2008-2020 period and draws primarily on T1 returns and the T2222. In particular, the total NRD claim is obtained from the T1 (line 255/25500), while the T2222 is used for the following components:
- NZ residency amount (total, i.e., sum of basic and additional amounts)
- IZ residency amount (total, i.e., sum of basic and additional amounts)
- Travel amount for trips beginning in the NZ
- Travel amount for trips beginning in the IZ (before applying the 50% reduction).
This study also employs employment slip data (T4), supplemented with information from corporate tax returns (T2), to attribute a 2-digit North American Industry Classification System (NAICS) code to claimants with earnings from employment.
4. Claimants
4.1 Taxfilers and Claimants in Prescribed Zones
The NRD is available to taxfilers residing in a prescribed NZ or IZ, as defined in section 7303.1 of the Income Tax Act Regulations, for a continuous period of at least six consecutive months. To assist taxpayers, the Canada Revenue Agency (CRA) maintains a (non-exhaustive) list of 1,329 places located in prescribed zones across Alberta, British Columbia, Manitoba, Newfoundland and Labrador, Nova Scotia, Ontario, Quebec, and Saskatchewan. In addition, all places in the territories (Yukon, Nunavut, and the Northwest Territories) belong to a prescribed NZ.Footnote 9 As full addresses are not available in the T1 data, a matching process between T1 postal codes and places in prescribed zones was used to help determine whether a taxfiler resides in the NZ or IZ. Details on this method are provided in Appendix B.
Table 1 presents a breakdown of taxfilers and claimants in 2019 based on the postal code method for identifying their area of residence. Overall, out of nearly 29 million taxfilers, 483,900 (or 1.7%) had a postal code identified as belonging to a prescribed zone, and of these approximately 37% were in the NZ specifically. There were 261,600 NRD claimants, 89.1% of which had a postal code identified as belonging to a prescribed zone, and for these the NZ share was slightly lower (35.6%). 10.9% of claimants were not found to have an NZ/IZ postal code, and this may be the result of:
- claimants residing in a place within a prescribed zone that was not matched to a postal code;
- claimants residing in a prescribed zone but retaining a mailing address in a non-prescribed zone;
- claimants having resided in a prescribed zone, but then returning to a non-prescribed zone before filing their T1 (and using the non-prescribed zone address).
| Total | Postal code in NZ or IZ* | Share in a prescribed zone (NZ or IZ)* | NZ / IZ split | |||
|---|---|---|---|---|---|---|
| Total | NZ | IZ | ||||
| Number | Number | Number | Number | % | % | |
| Taxfilers | 28,903,800 | 483,900 | 178,900 | 305,000 | 1.7 | 37.0 / 63.0 |
| NRD claimants | 261,600 | 233,100 | 82,900 | 150,200 | 89.1 | 35.6 / 64.4 |
| Claimant share (%) | 0.9 | 48.2 | 46.3 | 49.3 | N/A | N/A |
|
Notes: *Based on the postal code method for identifying taxfiler or claimant area of residence. All population figures in this table are rounded to the nearest 100. Source: T1 and T2222 data; Department of Finance calculations. |
||||||
Table 1 also shows that, in 2019, only 48.2% of taxfilers whose postal code was identified as belonging to a prescribed zone claimed the NRD, with only modest differences among those in the NZ (46.3%) compared to the IZ (49.3%). This is lower than the share of NRD claimants among taxfilers who declared they resided in a territory (60.9%), but comparable to the share of taxfilers for whom tax was payable to a territory (46.1%). There are several reasons for the observed claimant proportions. First, some taxfilers located in a prescribed zone may not have enough net income to warrant claiming the NRD.Footnote 10 Second, if a taxfiler and their spouse are both eligible for the NRD, it may be easier or optimal for only one claimant to claim both the basic and additional residency amounts. Third, a taxfiler may retain a mailing address in a prescribed zone while living outside of the zone during the year (or some sufficiently long portion thereof). Footnote 11 Fourth, for postal codes that straddle the IZ and the non-prescribed zone—but which are assigned to the IZ—taxfilers in the non-prescribed area may be incorrectly assigned to the IZ. However, the claimant proportion of taxfilers in the IZ would then likely be lower than in the NZ, and this is not observed.
Overall, the results suggest broad agreement between the postal code zone and residency component claimed: 91% of claimants whose postal code was in the NZ also claimed the NZ residency component; similarly, 94.4% of claimants with an IZ postal code also claimed the IZ residency component.
4.2 Trends in Claims
Value of NRD claims, associated tax expenditure cost, and number of claimants (2008-2020)
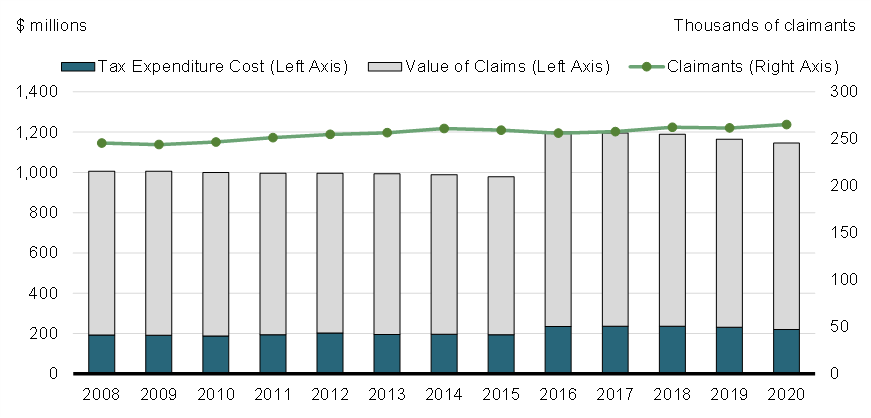
Chart 1 shows the evolution of the number of NRD claimants, value of claims, and tax expenditure cost over the 2008-2020 period. Claimant numbers have been stable overall: increasing slowly between 2008 and 2014, from 245,500 to 261,000 then decreasing to 256,000 in 2016, and subsequently increasing again to a maximum of 265,100 in 2020. In addition, between 2008 and 2020 the NRD claimant share of taxfilers declined from 1% to 0.9% (not shown). Meanwhile, the value of NRD claims and the estimated tax expenditure costs held steady between 2008 and 2015, averaging $995 million and $195 million, and then increased in 2016 to $1.2 billion and $235 million, respectively (all figures in constant 2020 dollars). This shift largely reflects the impact of the Budget 2016 changes that increased the NRD daily rate from $16.50 to $22.00. In 2020, the tax expenditure cost fell slightly to $220 million, and this may be attributable to the pandemic's impact on travel.
| Total,1 all claimants | NZ resident claimants | IZ resident claimants | |||||
|---|---|---|---|---|---|---|---|
| Total1 | NZ residency component2 | NZ travel component2 | Total1 | IZ residency component3 | IZ travel component2,4 | ||
| $ | $ | $ | $ | $ | $ | $ | |
| 2008 | 4,100 | 6,260 | 5,325 | 1,265 | 3,060 | 2,850 | 425 |
| 2009 | 4,125 | 6,020 | 5,165 | 1,125 | 3,090 | 2,855 | 455 |
| 2010 | 4,055 | 5,950 | 5,090 | 1,120 | 3,040 | 2,810 | 460 |
| 2011 | 3,960 | 5,815 | 4,935 | 1,110 | 2,950 | 2,730 | 435 |
| 2012 | 3,910 | 6,035 | 5,005 | 1,260 | 2,910 | 2,685 | 445 |
| 2013 | 3,870 | 5,815 | 4,890 | 1,165 | 2,875 | 2,650 | 440 |
| 2014 | 3,790 | 5,695 | 4,800 | 1,140 | 2,805 | 2,590 | 425 |
| 2015 | 3,775 | 5,630 | 4,755 | 1,120 | 2,785 | 2,575 | 415 |
| 2016 | 4,690 | 7,615 | 6,280 | 1,330 | 3,580 | 3,375 | 405 |
| 2017 | 4,640 | 7,080 | 6,150 | 1,305 | 3,535 | 3,215 | 400 |
| 2018 | 4,530 | 6,870 | 6,000 | 1,230 | 3,470 | 3,225 | 390 |
| 2019 | 4,455 | 7,000 | 5,870 | 1,180 | 3,405 | 3,230 | 380 |
| 2020 | 4,320 | 6,275 | 5,835 | 760 | 3,345 | 3,235 | 285 |
|
Notes: All dollar values are rounded to the nearest 5. Claimant location as determined by residency component claimed. Claimant subgroups omit those who had mixed residency components or no residency components. Component values are as reported by the taxfiler, while the values in the total column are system-derived and consider the 20%-of-net-income ceiling on what may be claimed. Thus, the values in the "Total" columns are somewhat lower than the sum of components. 1 System calculated. Source: T1 and T2222 data; Department of Finance calculations. |
|||||||
Table 2 shows the average amount claimed by all NRD claimants by year, and provides a breakdown by claimants' zone of residence and component claimed. There was a substantial increase in the total average claim in 2016 ($4,690 compared to $3,775 in 2015), the result of Budget 2016's increase in the daily rate afforded to NRD claimants for 2016 and later taxation years. NZ claimants' average claim was nearly twice as large as that of IZ claimants (e.g., $6,275 compared to $3,345 in 2020), owing to the 50% reduction in what may be claimed for those in the latter group. These subgroup averages can be reconciled with the overall average by noting there were far more IZ claimants than NZ claimants (approximately 78% more in 2019, as shown in Table 1). For either subgroup of claimants, the residency component was by far the most important. However, the average travel deduction of NZ claimants was three times larger than that of IZ claimants—even prior to the 50% reduction—likely reflecting increased costs of travel from more remote regions.
Proportion of claimants reporting different components of the measure
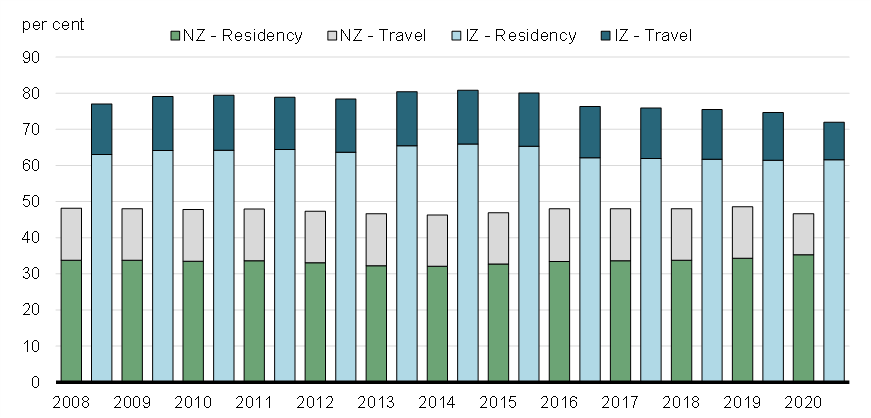
Chart 2 shows the proportion of claimants reporting different components of the NRD. Over three-fifths claimed the residency component in the IZ, while one-third claimed the NZ residency component. The travel deduction was claimed by 14-15% of claimants for journeys beginning in either the NZ or IZ. Given there are approximately half as many claimants in the NZ compared to the IZ, this suggests the former group was twice as likely to travel and claim this component of the NRD. A decrease in usage of the travel component was also observed in 2020, again likely as a result of the pandemic.
Proportion of claimants reporting maximum residency amounts, by year
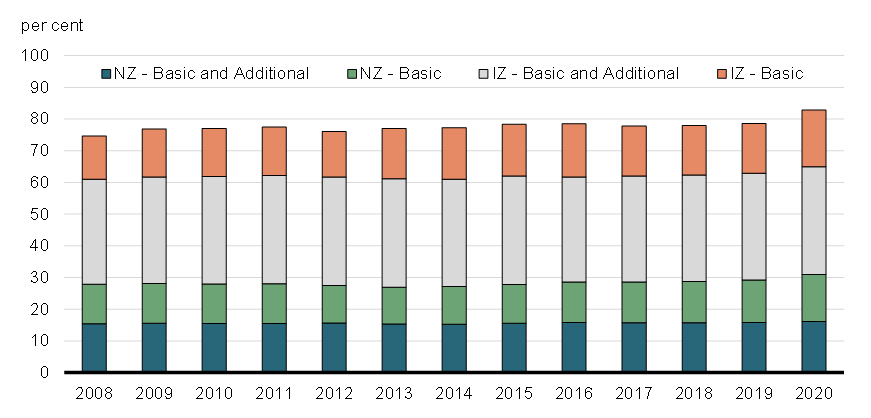
Chart 3 shows the proportion of claimants requesting the maximum residency amount, divided between the NZ and IZ as well as between those claiming the maximum basic amount and maximum basic and additional amounts.Footnote 12 The overall proportion of claimants reporting the maximum residency amount—i.e., who resided in a prescribed zone for the entire calendar year, and who claimed either the basic or basic and additional residency amounts—increased from 74.7% to 82.8% between 2008 and 2020. Moreover, on average over the period, approximately 34% of claimants in the IZ claimed the maximum basic and additional residency amounts, compared to 16% in the NZ. In other words, claimants in the IZ were twice as likely to be the only taxfiler claiming the residency deduction for a given dwelling, while staying in the zone for the whole year.
4.3 Demographic and Industrial Characteristics of Claimants
Table 3 provides a breakdown of selected components of the NRD claimed in 2019, by sex, age, and total income group. There were roughly three male claimants for every two female claimants, and men claimed 9% more on average than women ($4,605 vs. $4,230). Women were slightly more likely to claim the NZ residency component (36.5% vs 32.4%) and the NZ travel component (17.1% vs 12.4%). Men were more likely to claim the IZ residency component (65.6% vs 54.5%) and more likely to be the only resident of a dwelling claiming the basic amount in the IZ for the year (39.5% vs. 24.5%).
| Gender* | ||||
|---|---|---|---|---|
| Male | Female | |||
| Number (% of column total) | ||||
| NZ Residency | 50,700 (32.4) | 38,300 (36.5) | ||
Maximum (basic & additional) |
24,800 (15.8) | 16,500 (15.7) | ||
| IZ Residency | 102,700 (65.6) | 57,200 (54.5) | ||
Maximum (basic & additional) |
61,800 (39.5) | 26,200 (24.5) | ||
| NZ Travel | 19,400 (12.4) | 17,900 (17.1) | ||
| IZ Travel | 20,700 (13.2) | 13,900 (13.3) | ||
| Total | 156,600 | 104,900 | ||
| Average claim (2020 dollars) | $4,605 | $4,230 | ||
| Total income group | ||||
| <$50,000 | $50-$100,000 | $100-$150,000 | >$150,000 | |
| NZ Residency | 31,100 (35.3) | 31,400 (33.4) | 18,300 (37.3) | 8,200 (27) |
Maximum (basic & additional) |
10,700 (12.1) | 15,200 (16.2) | 10,300 (21) | 5,200 (17.1) |
| IZ Residency | 52,600 (59.7) | 57,000 (60.7) | 28,800 (58.7) | 21,600 (71.1) |
Maximum (basic & additional) |
21,600 (24.5) | 33,000 (35.1) | 18,700 (38.1) | 14,600 (48) |
| NZ Travel | 4,700 (5.3) | 15,100 (16.1) | 12,200 (24.8) | 5,300 (17.4) |
| IZ Travel | 5,100 (5.8) | 11,900 (12.7) | 8,100 (16.5) | 9,500 (31.2) |
| Total | 88,100 | 93,900 | 49,100 | 30,400 |
| Average claim (2020 dollars) | $3,395 | $4,540 | $5,525 | $5,545 |
| Age group | ||||
| Under 25 | 25-44 | 45-64 | 65 and above | |
| NZ Residency | 7,000 (38.5) | 37,500 (33.8) | 32,800 (34.2) | 11,700 (32) |
Maximum (basic & additional) |
1,400 (7.7) | 16,300 (14.7) | 17,300 (18) | 6,400 (17.5) |
| IZ Residency | 10,100 (55.5) | 66,600 (60.1) | 58,600 (61) | 24,600 (67.2) |
Maximum (basic & additional) |
2,400 (13.2) | 35,700 (32.2) | 34,400 (35.8) | 15,500 (42.3) |
| NZ Travel | 2,200 (12.1) | 18,300 (16.5) | 15,300 (15.9) | 1,500 (4.1) |
| IZ Travel | 1,600 (8.8) | 17,000 (15.3) | 14,700 (15.3) | 1,300 (3.6) |
| Total | 18,200 | 110,800 | 96,000 | 36,600 |
| Average claim (2020 dollars) | $3,230 | $4,515 | $4,705 | $4,225 |
|
Notes: All population figures in this table are rounded to the nearest 100. All dollar values are rounded to the nearest 5. As only select components are displayed, and since multiple components can be reported by a claimant, the sum of components will not equal the column total, and column percentages will not add up to 100. Source: T1 and T2222 data; Department of Finance calculations. |
||||
Table 3 also shows that, while not directly dependent on income,Footnote 13 average claim amounts are increasing with total income: claimants with less than $50,000 claimed an average of $3,395 compared to $5,545 among those in the $150,000 or more group. This may be explained by those in the latter group being more likely to claim the maximum basic and additional residency amount in the NZ and IZ (17.1% and 48% vs. 12.1% and 24.5%, respectively), and being far more likely to claim either travel component. Finally, Table 3 shows that average claim amounts are also increasing with age, up to the 45-64 group: young claimants (under 25) claimed $3,230 on average compared to $4,705 among the 45-64. Those 65 and above, meanwhile, claimed slightly less at $4,225. Young claimants were somewhat more likely to be in the NZ but far less likely to be the only resident in a dwelling to claim, irrespective of zone. Travel deductions were also less likely to be claimed by young claimants and, in particular, by claimants 65 and above.
| Claimants | Non-claimants | ||
|---|---|---|---|
| NZ residency | IZ residency | ||
| % of column total | |||
| Agriculture, forestry, fishing and hunting | 1.3 | 2.5 | 1.6 |
| Mining, quarrying, and oil and gas extraction | 8 | 17.2 | 1.1 |
| Utilities | 1.3 | 1.1 | 0.7 |
| Construction | 7.8 | 9.4 | 6.2 |
| Manufacturing | 2.3 | 6.3 | 9.2 |
| Wholesale trade | 2.1 | 3.5 | 4.5 |
| Retail trade | 7.2 | 7.5 | 10.9 |
| Transportation and warehousing | 4.3 | 6.5 | 4.3 |
| Information and cultural industries | 1 | 0.5 | 1.8 |
| Finance and insurance | 0.8 | 1.3 | 4 |
| Real estate and rental and leasing | 1.3 | 2.4 | 1.6 |
| Professional, scientific and technical services | 2.2 | 3.3 | 6.2 |
| Management of companies and enterprises | 1.2 | 1.6 | 1.1 |
| Administrative and support, waste management and remediation services | 2.7 | 3.2 | 4.6 |
| Educational services | 3.7 | 4.7 | 5 |
| Health care and social assistance | 4.8 | 3.5 | 8 |
| Arts, entertainment and recreation | 0.3 | 0.5 | 1.3 |
| Accommodation and food services | 4.1 | 4.2 | 6.7 |
| Other services (except public administration) | 2.4 | 3.5 | 3.1 |
| Public administration | 33.1 | 13 | 12 |
|
Note: Limited to claimants and non-claimants with a known NAICS code who reported positive T4 earnings. Claimants assigned to IZ or NZ based on residency component claimed. A NAICS code could not be assigned to the remaining 8.2%, 4.4% and 6.4% of claimants in the NZ, IZ and non-claimants, respectively. Source: T1, T2, T4 and T2222 data; Department of Finance calculations. |
|||
Table 4 looks at the distribution of claimants with T4 earnings in terms of their 2-digit NAICS code and compares them with non-claimants. If claimants had more than one T4 slip, the NAICS code was chosen based on the job with the most earnings. Claimants in the NZ were much more likely than non-claimants to work in public administration (33.1% vs. 12%) or mining, quarrying, and oil and gas extraction (8% vs. 1.1%), but less likely to work in manufacturing (2.3% vs. 9.2%), retail trade (7.2% vs. 10.9%), and health care and social assistance (4.8% vs. 8%), among others. Similar differences were observed between claimants in the IZ and non-claimants, although the former were even more likely to work in mining, quarrying, and oil and gas extraction (17.2%) than their NZ counterparts. The share of IZ claimants working in public administration was roughly comparable to that of non-claimants (13% vs. 12%).
| NZ | IZ | |||
|---|---|---|---|---|
| Average residency claim | Average travel claim | Average residency claim | Average travel claim | |
| $ | $ | $ | $ | |
| Agriculture, forestry, fishing and hunting | 6,045 | 1,405 | 3,120 | 225 |
| Mining, quarrying, and oil and gas extraction | 6,375 | 1,895 | 3,445 | 885 |
| Utilities | 6,335 | 3,045 | 3.415 | 715 |
| Construction | 5,470 | 535 | 3,305 | 220 |
| Manufacturing | 6,010 | 1,240 | 3,415 | 685 |
| Wholesale trade | 6,135 | 1,770 | 3,390 | 435 |
| Retail trade | 5,535 | 525 | 3,060 | 215 |
| Transportation and warehousing | 5,900 | 935 | 3,340 | 265 |
| Information and cultural industries | 6,130 | 1,170 | 3,170 | 280 |
| Finance and insurance | 5,730 | 875 | 3,185 | 300 |
| Real estate and rental and leasing | 5,870 | 750 | 3,255 | 185 |
| Professional, scientific and technical services | 5,655 | 975 | 3,135 | 330 |
| Management of companies and enterprises | 5,895 | 1,450 | 3,330 | 795 |
| Administrative and support, waste management and remediation services | 5,685 | 510 | 3,070 | 95 |
| Educational services | 5,615 | 2,030 | 3,120 | 950 |
| Health care and social assistance | 5,525 | 1,225 | 3,065 | 200 |
| Arts, entertainment and recreation | 5,420 | 370 | 2,905 | 80 |
| Accommodation and food services | 5,055 | 185 | 2,755 | 25 |
| Other services (except public administration) | 6,005 | 1,915 | 3,250 | 230 |
| Public administration | 5,970 | 1,870 | 3,215 | 595 |
| Total | 5,835 | 1,355 | 3,240 | 460 |
|
Notes: All dollar values are rounded to the nearest 5. Data in this table limited to claimants who had positive T4 earnings. NAICS code assigned according based on employer for the T4 slip with highest employment income. Source: T1, T2, T4 and T2222 data; Department of Finance calculations. |
||||
Table 5 provides a further breakdown of average residency and travel claims by 2-digit NAICS codes, for claimants with employment income in the NZ and IZ, respectively. Consistent with Table 3, claim amounts are much lower in the IZ, reflecting the halved daily rate and less expensive travel. Within each zone, there is relatively little variation across industries in the average residency claim, but considerably more in the average travel claim. For example, in the NZ, average travel claims ranged from a low of $185 in accommodation and food services to a high of $3,045 in the utilities sector. Likewise, in the IZ, average travel claims ranged from $25 in accommodation and food services to $950 in educational services. This variation may to some extent owe to differences in employer-provided taxable travel benefits across industries.
5. Beneficiaries
An NRD claimant is considered a beneficiary if their net federal income tax payable is decreased as a result of claiming, relative to a scenario where the NRD is not claimed (but holding all other factors constant). The amount by which net federal tax payable decreases is termed the direct benefit. The NRD reduces taxable income, but does not reduce net income. As such, no indirect benefits arise from impacts on the entitlement to existing refundable credits.
| Claimants | Beneficiaries | Benefit as % of claim | |||
|---|---|---|---|---|---|
| Number | Claim (average) | Number | Benefit (average) | ||
| Gender1 | |||||
| Male | 156,600 | $4,605 | 146,900 | $1,055 | 22.9% |
| Female | 104,900 | $4,230 | 93,100 | $875 | 20.7% |
| Total income group | |||||
| <$50,000 | 88,100 | $3,395 | 66,800 | $520 | 15.3% |
| $50,000 - $100,000 | 93,900 | $4,540 | 93,700 | $910 | 20% |
| $100,000 - $150,000 | 49,100 | $5,525 | 49,100 | $1,370 | 24.8% |
| >$150,000 | 30,400 | $5,545 | 30,400 | $1,615 | 29.1% |
| Age group | |||||
| Under 25 | 18,200 | $3,230 | 15,800 | $615 | 19% |
| 25-44 | 110,800 | $4,515 | 105,100 | $1,010 | 22.4% |
| 45-64 | 96,000 | $4,705 | 91,300 | $1,065 | 22.6% |
| 65 and above | 36,600 | $4,225 | 27,800 | $835 | 19.8% |
| Total | 261,600 | $4,455 | 240,000 | $9852 | 22.1% |
|
Notes: All population figures in this table are rounded to the nearest 100. All dollar values are rounded to the nearest 5. Source: T1 and T2222 data; Department of Finance calculations. |
|||||
Table 6 compares NRD claimants and beneficiaries. Overall, 91.7% of claimants are estimated to have derived a benefit from the NRD. Among beneficiaries, the average benefit was $985, or 22.1% of the average claim value. Benefit-to-claim ratios varied modestly by sex and age group, but ranged from 15.3% for claimants with less than $50,000 in total income to 29.1% for claimants with total income in excess of $150,000.
Finally, Table 7 looks at the average claim and benefit by 2-digit NAICS code. Average claims were highest in utilities, public administration, and information and cultural industries, and lowest in accommodation and food services, and arts, entertainment and recreation. Average benefits among beneficiaries also generally tracked average claim amounts, but the benefit-to-claim ratios ranged from a low of 17.6% in accommodation and food services to a high of 26.1% in mining, quarrying, and oil and gas extraction, likely reflecting differences in average employment income across industries.
| Claimants | Beneficiaries | Benefit as % of claim | |
|---|---|---|---|
| Claim (average) | Benefit (average) | ||
| Agriculture, forestry, fishing and hunting | $4,120 | $845 | 20.5% |
| Mining, quarrying, and oil and gas extraction | $4,690 | $1,225 | 26.1% |
| Utilities | $5,975 | $1,490 | 24.9% |
| Construction | $4,130 | $905 | 21.9% |
| Manufacturing | $4,260 | $945 | 22.2% |
| Wholesale trade | $4,540 | $1,060 | 23.3% |
| Retail trade | $3,900 | $755 | 19.4% |
| Transportation and warehousing | $4,270 | $915 | 21.4% |
| Information and cultural industries | $5,155 | $1,105 | 21.4% |
| Finance and insurance | $4,015 | $850 | 21.2% |
| Real estate and rental and leasing | $3,965 | $870 | 21.9% |
| Professional, scientific and technical services | $4,005 | $880 | 22% |
| Management of companies and enterprises | $4,570 | $1,070 | 23.4% |
| Administrative and support, waste management and remediation services | $3,985 | $825 | 20.7% |
| Educational services | $4,310 | $885 | 20.5% |
| Health care and social assistance | $4,440 | $935 | 21.1% |
| Arts, entertainment and recreation | $3,440 | $660 | 19.2% |
| Accommodation and food services | $3,405 | $600 | 17.6% |
| Other services (except public administration) | $4,455 | $960 | 21.5% |
| Public administration | $5,650 | $1,270 | 22.5% |
| Total | $4,455 | $985 | 22.1% |
|
Source: T1, T2, T4 and T2222 data. Notes: All claimants with known NAICS code, whether or not they reported positive T4 earnings. For claimants and beneficiaries of unknown NAICS, the average claim amount was $3,920, the average benefit was $770, yielding a benefit-to-claim ratio of 19.6%. |
|||
6. Conclusion
The NRD recognizes the increased living costs faced by individuals in northern and isolated areas and assists in drawing skilled labour to such communities. This study has presented a profile of the NRD for the period spanning 2008 to 2020. Claimant numbers have generally been steady over this period, although the estimated tax expenditure cost increased following Budget 2016's increase in the daily rate for the residency component. The residency component accounts for the majority of the value of claims on average, while only a minority of claimants (15%) claim the travel deduction. Claimants were generally found to stay in a prescribed zone for the entire year. They were more often men, individuals with total income under $100,000, and of core working age (25-64). Compared to other taxfilers, claimants were more likely to work in public administration or in mining, quarrying, and oil and gas extraction, but less likely to work in manufacturing, retail trade, or health care and social assistance. Travel claim amounts were also found to vary with claimants' industry of work.
References
Pigeon, M.A. (2004). "Federal Northern Residents Deduction", Library of Parliament, PRB 03-52E.
Department of Supply and Services Canada (1989). Report of the Task Force on Tax Benefits for Northern and Isolated Areas.
Appendix A
Northern Residents Deductions: NZ and IZ boundaries
Appendix B: Postal Codes and Places in Prescribed Zones
T1 postal code data is used to help determine whether a taxfiler resides in a prescribed northern or intermediate zone (NZ/IZ) at the end of the taxation year. A preliminary match between places in prescribed zones and postal codes was made using Statistics Canada's Postal Code Conversion File. Places in prescribed zones were matched with the "Community name" variable, and the associated postal code was retained. However, a match was found for only 20.6% of places, likely due to the "Community" concept not always lining up with places as defined by the CRA. Therefore, to complete the matching process, the remaining places in prescribed zones were manually associated to postal codes using Google Maps. Overall, there was a postal code match for 94.1% of places in prescribed zones within the provinces, and 9,974 postal codes associated with prescribed zones.
It should be noted that in Canada's north, postal codes are relatively few and span large areas. As such, a postal code can encompass more than one place in a prescribed zone, and straddle the NZ and the IZ, or the IZ and the non-prescribed zone. Chart B1 is a Venn diagram showing how places, postal codes, and prescribed and non-prescribed zones may interact. Postal code areas A, B, and C represent "ideal" situations: all are completely inscribed in one zone, and may contain one or multiple places (area A) or one place may span multiple postal codes (areas B and C). Areas D and E represent scenarios where the postal code area straddles the NZ and IZ, and the IZ and non-prescribed zone, respectively. (Area F, meanwhile, illustrates a postal code whose area is completely inscribed in the non-prescribed zone.)
Provinces/territories, places, postal code areas, and prescribed zones
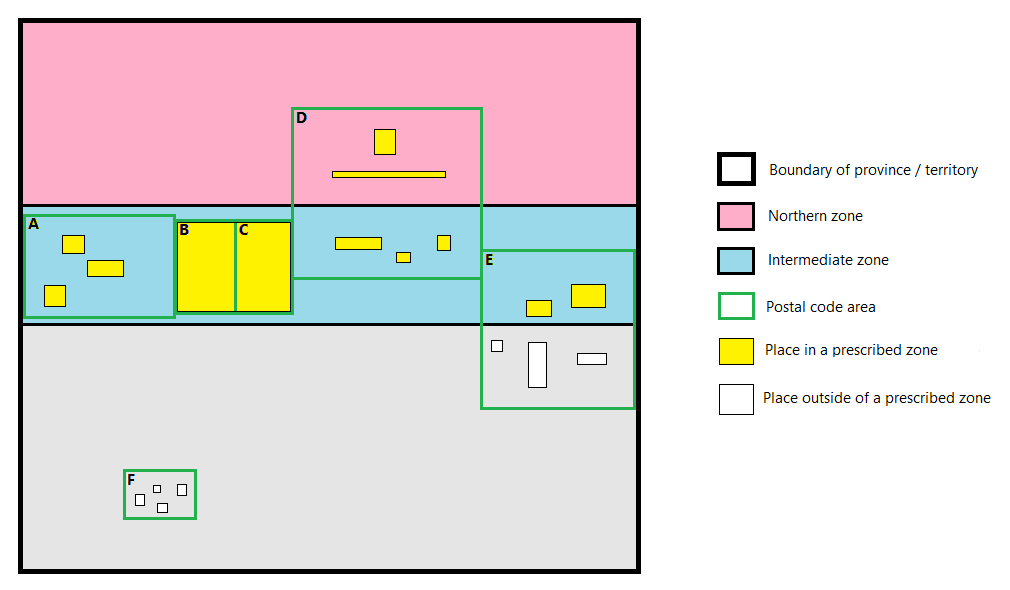
While almost all postal codes associated with a prescribed zone exclusively contain places in the NZ or IZ, 18 included places in both zones (as in area D of the diagram). These postal codes were assigned to either the NZ or IZ according to where most of the places lie.Footnote 14,Footnote 15 If a postal code contained any place belonging to the IZ (and none in the NZ), it was considered to belong to the IZ, even if its area extends into the non-prescribed zone, as in area E. This rule could lead to an overestimation of the number of taxfilers who are in a prescribed zone, but was deemed preferable to arriving at an underestimate by assigning these postal codes to the non-prescribed zone.