
Archived - The Fiscal Monitor - August 2023

Highlights
August 2023
There was a budgetary deficit of $3.1 billion in August 2023, compared to a deficit of $2.5 billion in August 2022. The budgetary deficit before net actuarial losses and gains was $3.2 billion, compared to a deficit of $1.8 billion in the same period of 2022-23. The budgetary balance before net actuarial losses and gains is intended to supplement the traditional budgetary balance and improve the transparency of the government's financial reporting by isolating the impact of the amortization of net actuarial losses and gains arising from the revaluation of the government's pension and other employee future benefit plans.
Monthly Budgetary Balance and Budgetary Balance Excluding Net Actuarial Losses and gains
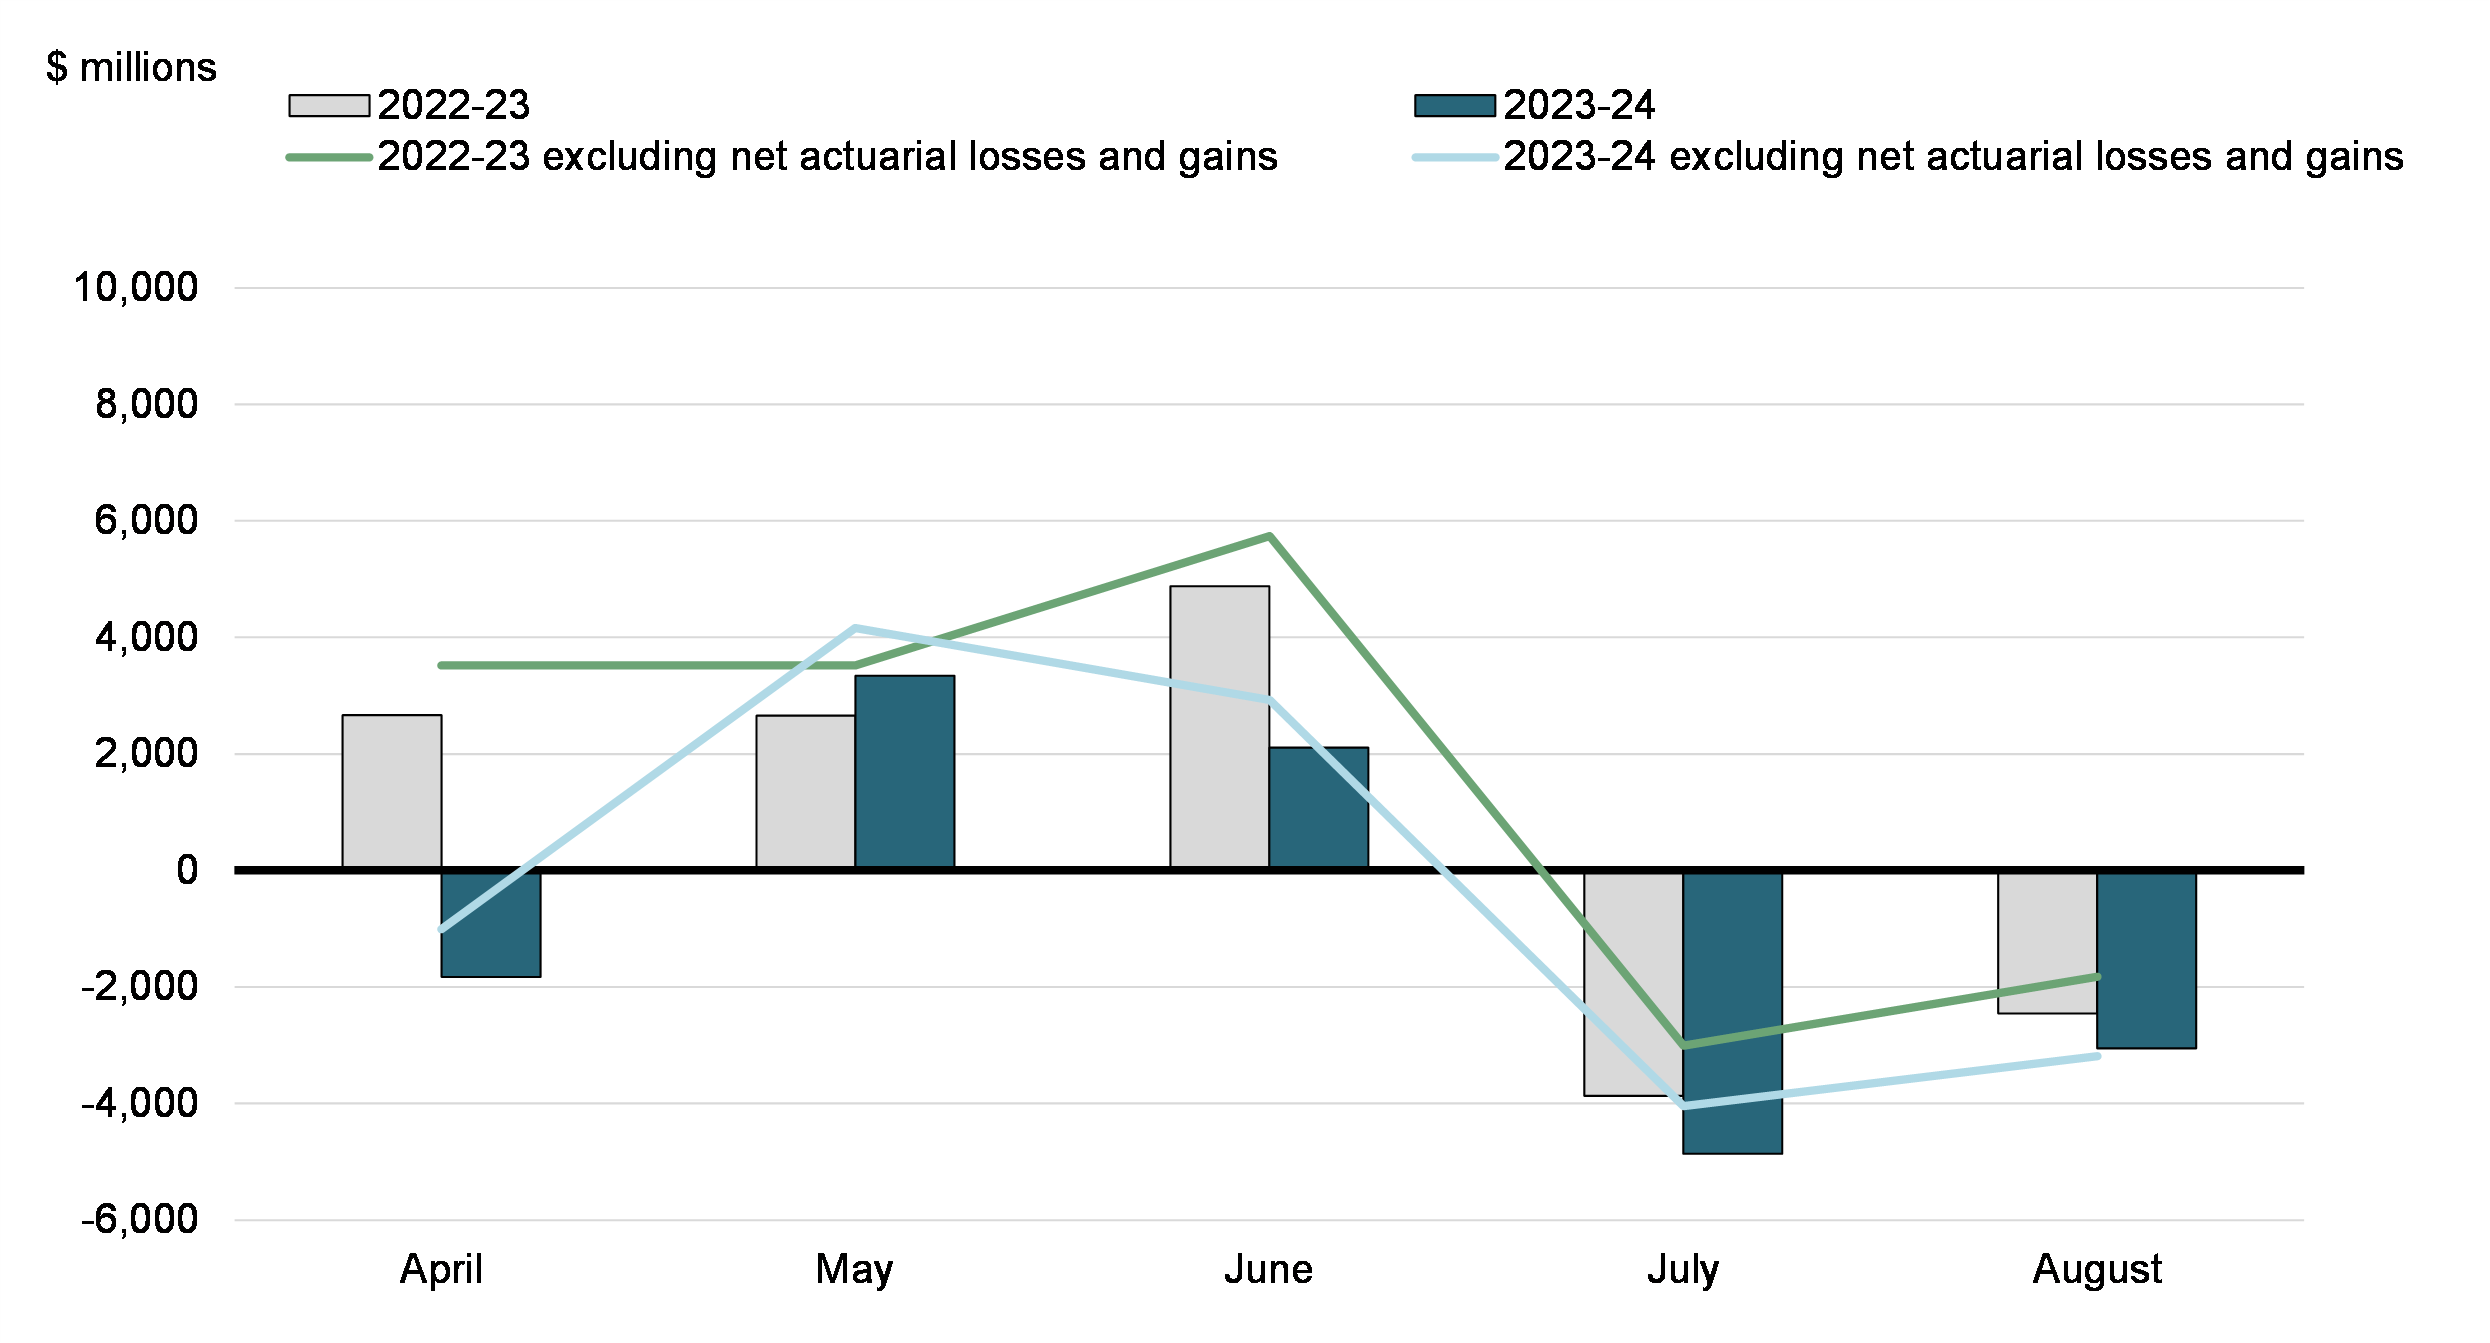
Compared to August 2022:
- Revenues decreased by $0.4 billion, or 1.3 per cent.
- Program expenses excluding net actuarial losses and gains were up $0.2 billion, or 0.6 per cent, as higher transfers to other levels of government were largely offset by lower operating expenses and other transfer payments.
- Public debt charges were up $0.7 billion, or 20.6 per cent, largely reflecting higher interest rates, offset in part by lower Consumer Price Index adjustments on Real Return Bonds.
- The government recorded net actuarial gains of $0.1 billion in August 2023, compared to net actuarial losses of $0.6 billion in August 2022, largely due to a year-to-date adjustment in August 2023 to reflect the amortization of gains arising from actuarial valuations prepared for the Public Accounts of Canada 2023.
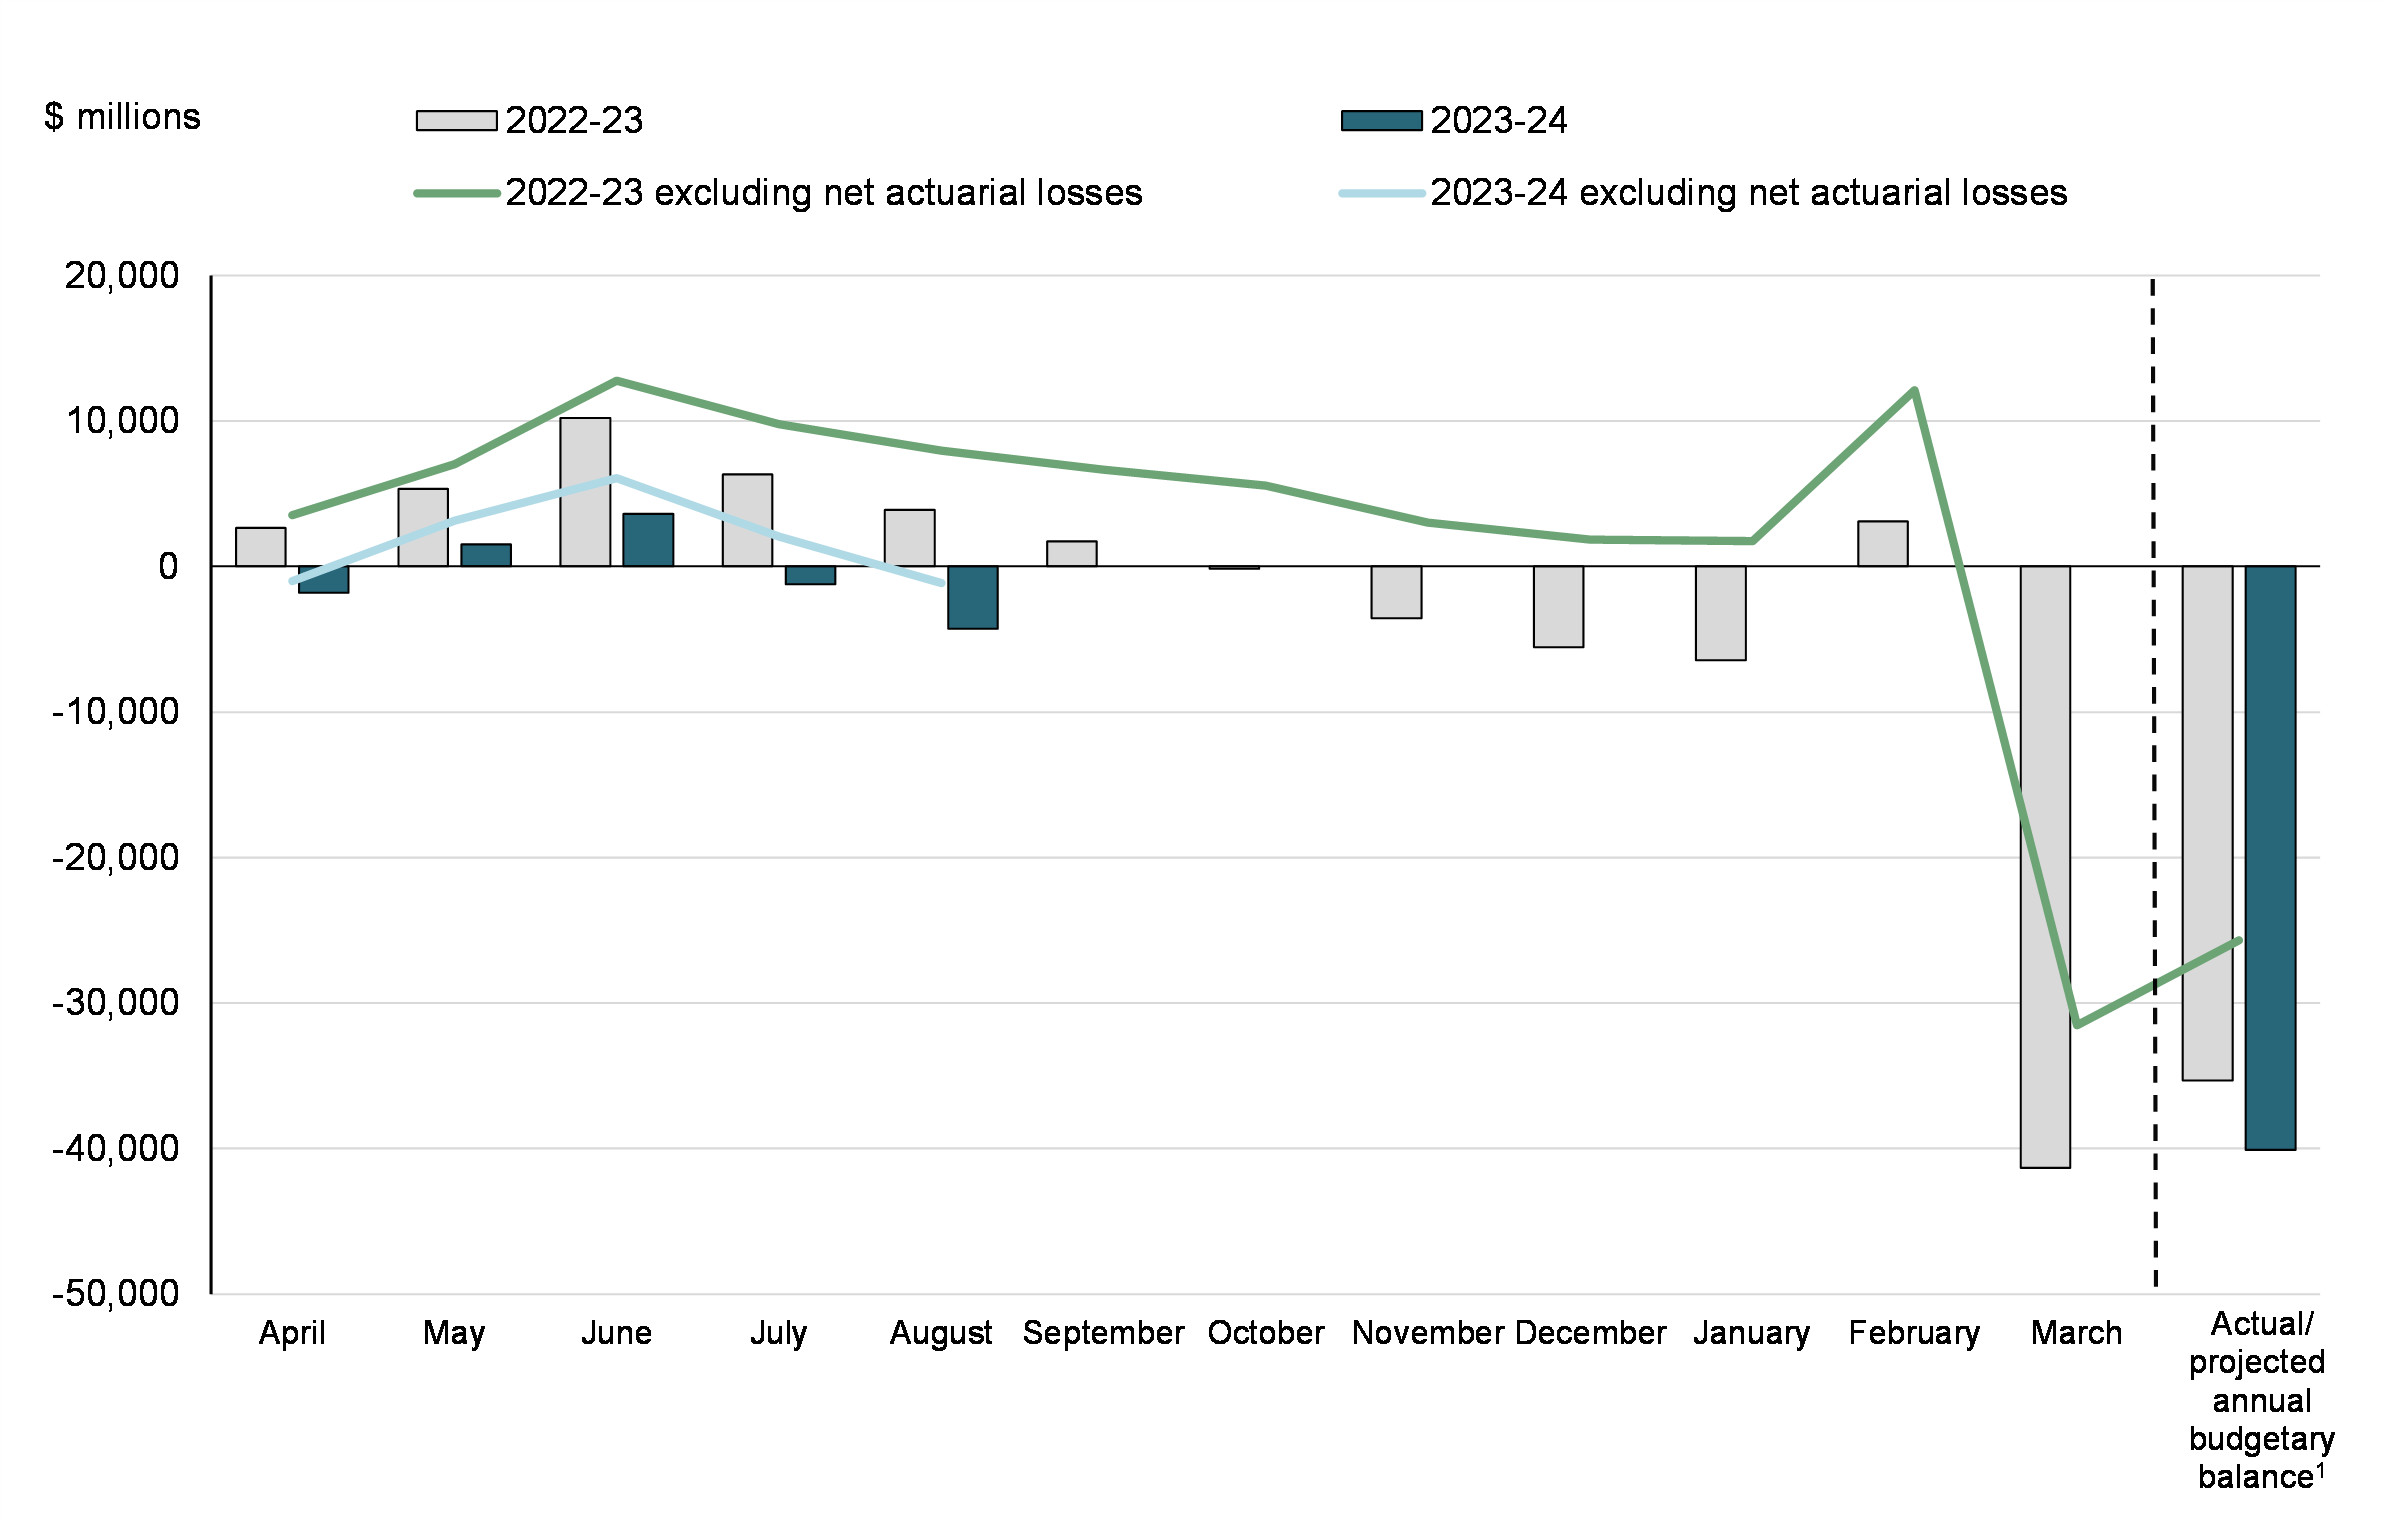
April to August 2023
The government posted a budgetary deficit of $4.3 billion for the April to August period of the 2023-24 fiscal year, compared to a surplus of $3.9 billion reported for the same period of 2022-23. The budgetary deficit before net actuarial losses was $1.1 billion, compared to a surplus of $8.0 billion in the April to August period of 2022-23.
Compared to 2022-23:
- Revenues were up $2.4 billion, or 1.4 per cent, largely reflecting higher interest revenues and other non-tax revenues.
- Program expenses excluding net actuarial losses were up $7.4 billion, or 4.8 per cent, reflecting increases across direct program expenses, major transfers to other levels of government, proceeds from the pollution pricing framework returned, and major transfers to persons.
- Public debt charges increased by $4.1 billion, or 27.7 per cent, largely reflecting higher interest rates, offset in part by lower Consumer Price Index adjustments on Real Return Bonds.
- Net actuarial losses decreased by $0.9 billion, or 22.7 per cent, reflecting the amortization of gains arising from actuarial valuations prepared for the Public Accounts of Canada 2023.
Year-to-Date Budgetary Balance and Budgetary Balance Excluding Net Actuarial Losses
| August | April to August | |||
|---|---|---|---|---|
| 2022 | 2023 | 2022-23 | 2023-24 | |
| Budgetary transactions | ||||
| Revenues | 34,081 | 33,647 | 177,197 | 179,602 |
| Expenses | ||||
Program expenses, excluding net actuarial losses and gains |
-32,330 | -32,526 | -154,485 | -161,896 |
Public debt charges |
-3,570 | -4,304 | -14,759 | -18,843 |
| Budgetary balance, excluding net actuarial losses and gains | -1,819 | -3,183 | 7,953 | -1,137 |
Net actuarial (losses) gains |
-635 | 130 | -4,075 | -3,150 |
| Budgetary balance (deficit/surplus) | -2,454 | -3,053 | 3,878 | -4,287 |
| Non-budgetary transactions | -2,024 | -1,220 | -25,452 | -40,109 |
| Financial source/requirement | -4,478 | -4,273 | -21,574 | -44,396 |
| Net change in financing activities | -5,229 | 19,711 | 26,249 | 70,032 |
| Net change in cash balances | -9,707 | 15,438 | 4,675 | 25,636 |
| Cash balance at end of period | 96,937 | 67,432 | ||
|
Note: Positive numbers indicate net source of funds. Negative numbers indicate net requirement for funds. |
||||
Revenues
Revenues in August 2023 totalled $33.6 billion, down $0.4 billion, or 1.3 per cent, from August 2022.
- Tax revenues decreased by $1.4 billion, or 4.6 per cent, compared to the same period in 2022-23, driven by a decline in corporate income tax revenue partially offset by an increase in personal income tax revenue and non-resident income tax revenue.
- Proceeds from the pollution pricing framework were up $0.2 billion, or 36.6 per cent, reflecting higher carbon pollution pricing in 2023.
- Employment Insurance (EI) premium revenues were up $0.2 billion, or 10.3 per cent, reflecting a higher premium rate and better labour market conditions.
- Other revenues were up $0.5 billion, or 21.8 per cent, reflecting higher interest revenues and net foreign exchange gains. These increases were offset in part by lower net profits from enterprise Crown corporations, largely reflecting Bank of Canada losses as its interest expense on variable-rate deposits has outpaced interest earned on its fixed-rate investments.
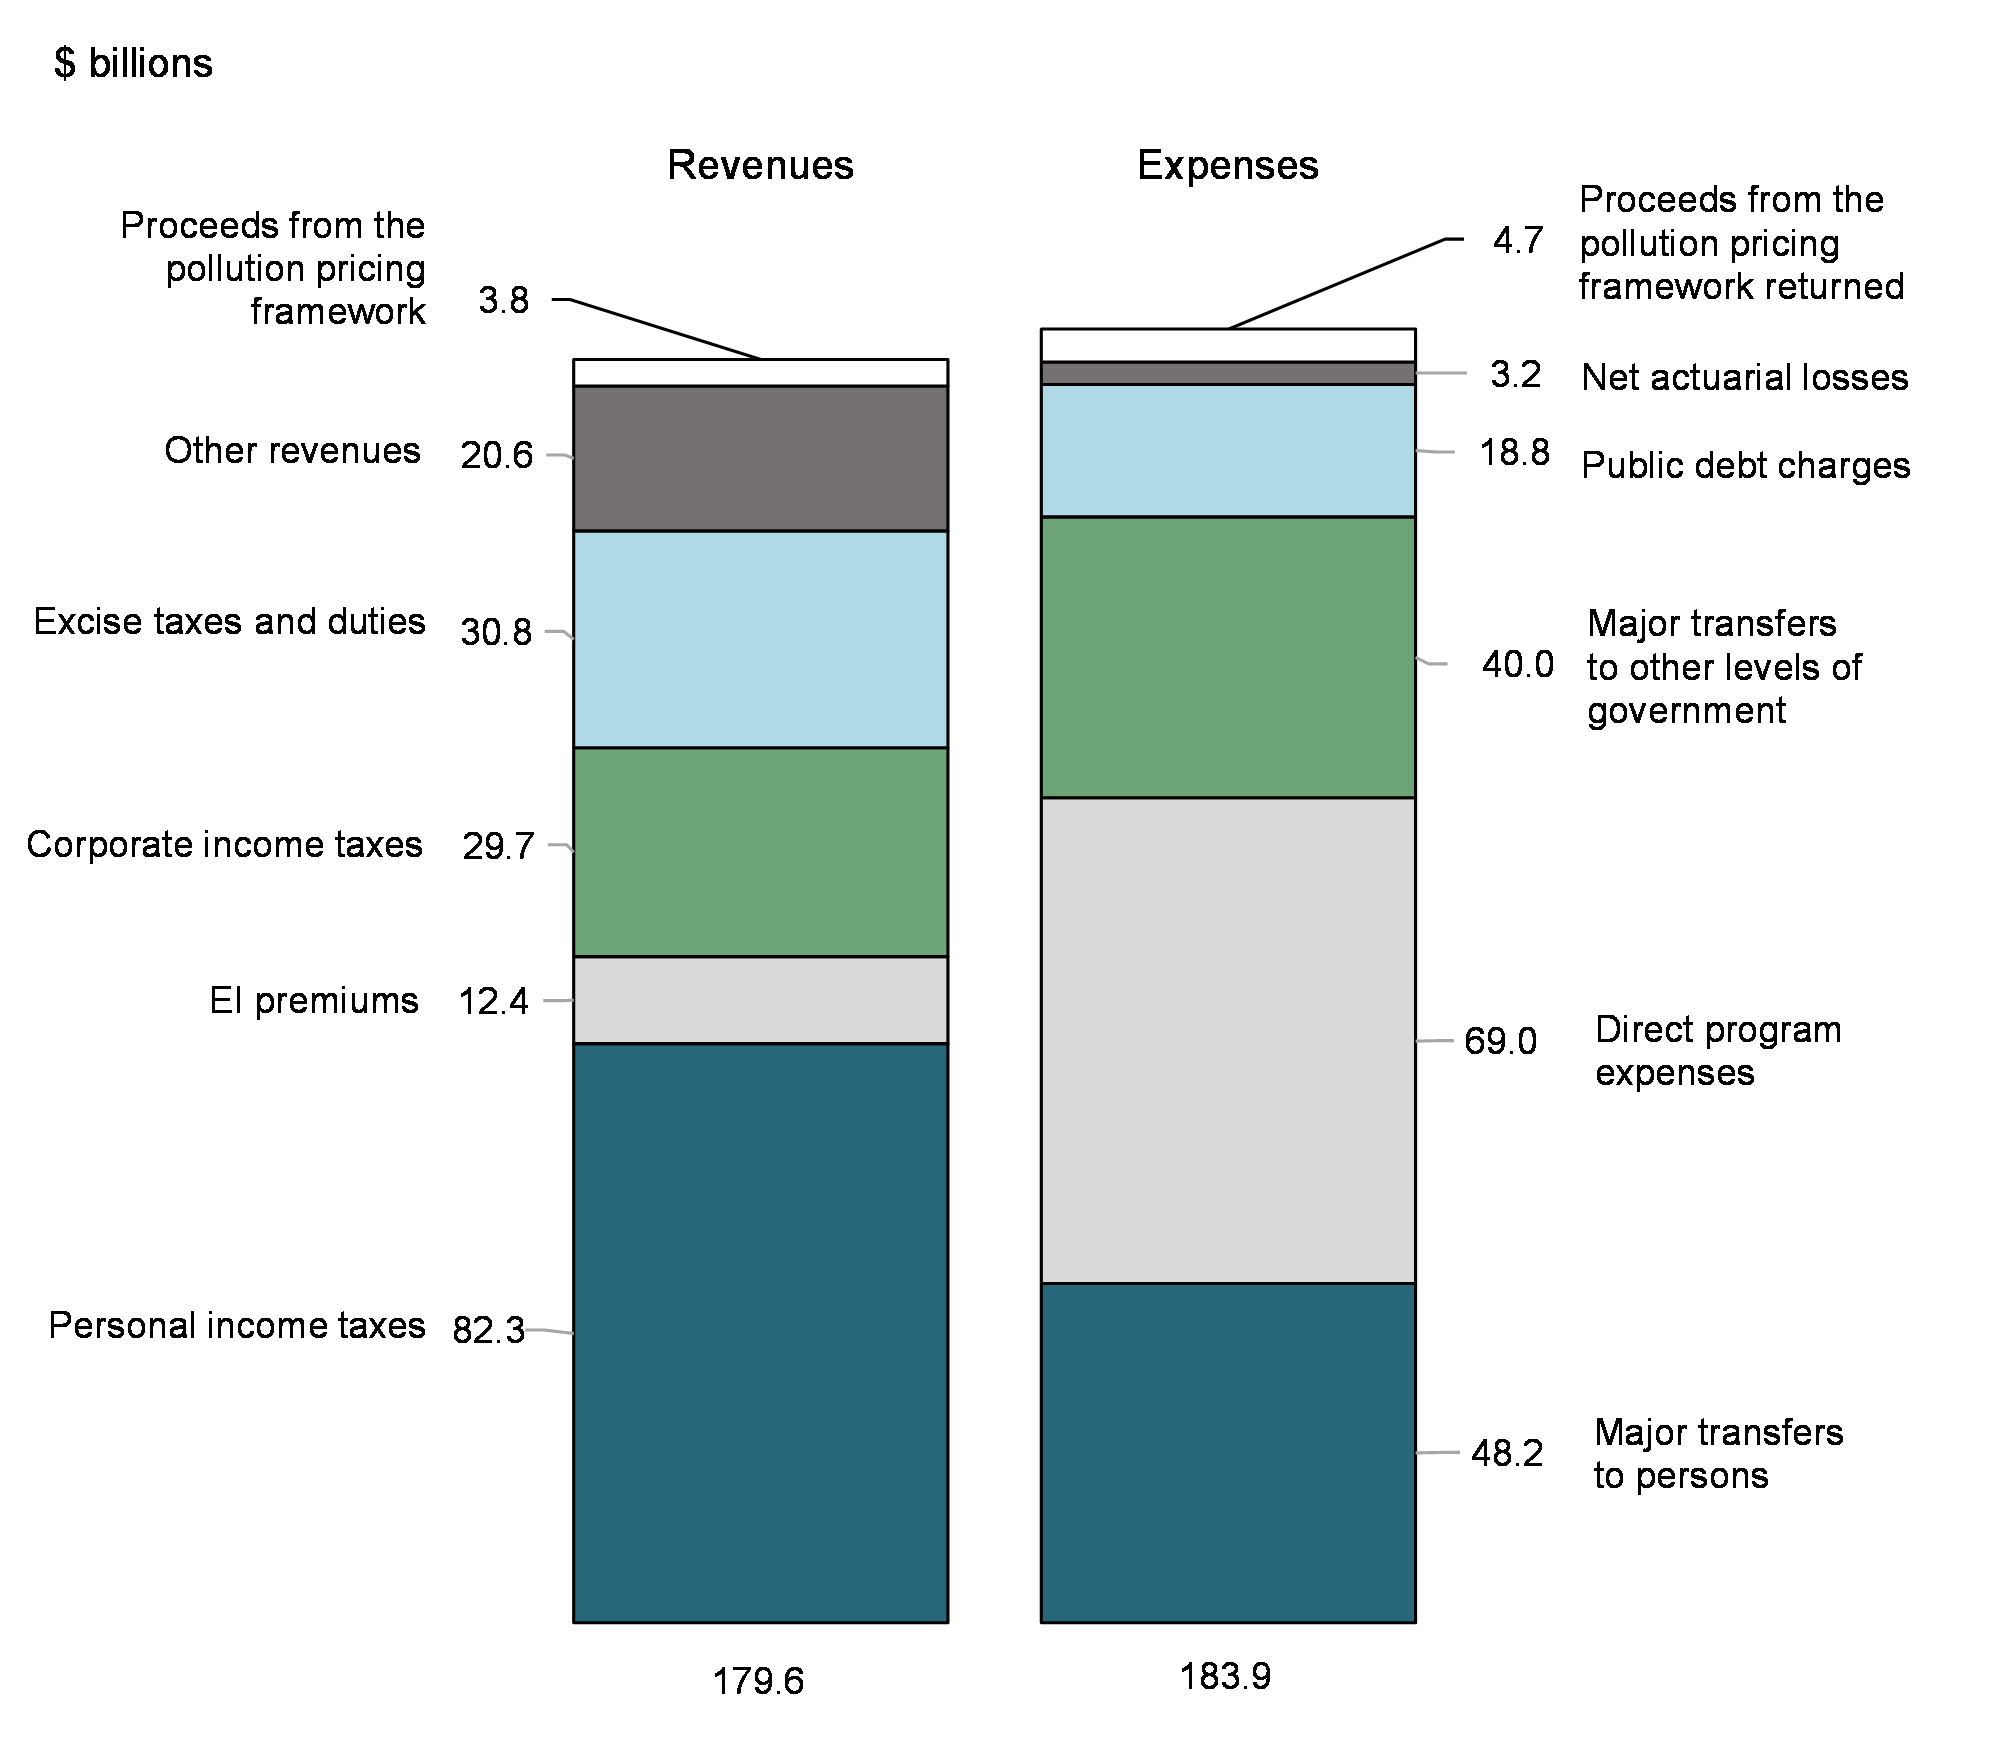
Revenues for the April to August period of 2023-24 totalled $179.6 billion, up $2.4 billion, or 1.4 per cent, from the same period in 2022-23.
- Tax revenues decreased by $1.4 billion, or 0.9 per cent, compared to the same period in 2022-23, driven by a decline in income tax revenue, with lower corporate and non-resident income tax revenue partially offset by an increase in personal income tax revenue.
- Proceeds from the pollution pricing framework were up $0.6 billion, or 20.3 per cent, reflecting higher carbon pollution pricing in 2023.
- EI premium revenues were up $1.0 billion, or 8.7 per cent, reflecting a higher premium rate and better labour market conditions.
- Other revenues were up $2.2 billion, or 16.0 per cent, largely reflecting higher interest revenues and net foreign exchange revenues, offset in part by Bank of Canada losses.
| August | April to August | |||||
|---|---|---|---|---|---|---|
| 2022 | 2023 | Change | 2022-23 | 2023-24 | Change | |
| ($ millions) | (%) | ($ millions) | (%) | |||
| Tax revenues | ||||||
| Income taxes | ||||||
Personal |
15,506 | 16,154 | 4.2 | 77,228 | 82,294 | 6.6 |
Corporate |
6,800 | 4,764 | -29.9 | 35,844 | 29,696 | -17.2 |
Non-resident |
748 | 785 | 4.9 | 5,252 | 4,976 | -5.3 |
Total income tax revenues |
23,054 | 21,703 | -5.9 | 118,324 | 116,966 | -1.1 |
| Other taxes and duties | ||||||
Goods and Services Tax |
4,188 | 4,634 | 10.6 | 23,095 | 23,418 | 1.4 |
Energy taxes |
623 | 494 | -20.7 | 2,244 | 2,154 | -4.0 |
Customs import duties |
570 | 489 | -14.2 | 2,684 | 2,331 | -13.2 |
Other excise taxes and duties |
834 | 599 | -28.2 | 2,810 | 2,908 | 3.5 |
Total excise taxes and duties |
6,215 | 6,216 | 0.0 | 30,833 | 30,811 | -0.1 |
| Total tax revenues | 29,269 | 27,919 | -4.6 | 149,157 | 147,777 | -0.9 |
| Proceeds from the pollution pricing framework | 506 | 691 | 36.6 | 3,134 | 3,771 | 20.3 |
| Employment Insurance premiums | 1,809 | 1,996 | 10.3 | 11,430 | 12,419 | 8.7 |
| Other revenues | 2,497 | 3,041 | 21.8 | 13,476 | 15,635 | 16.0 |
| Total revenues | 34,081 | 33,647 | -1.3 | 177,197 | 179,602 | 1.4 |
|
Note: Totals may not add due to rounding. |
||||||
Expenses
Program expenses excluding net actuarial losses and gains in August 2023 were $32.5 billion, up $0.2 billion, or 0.6 per cent, from August 2022.
- Major transfers to persons, consisting of elderly benefits, EI benefits, COVID-19 income support for workers, and children's benefits, were up $0.1 billion or 1.2 per cent.
- Elderly benefits increased by $0.5 billion, or 9.0 per cent, largely reflecting changes in consumer prices to which benefits are fully indexed, and growth in the number of recipients.
- EI benefits decreased by $0.1 billion, or 4.4 per cent.
- COVID-19 income support for workers decreased $0.5 billion, primarily reflecting redeterminations of benefits in August 2023.
- Children's benefits were up $0.2 billion, or 8.7 per cent, mainly reflecting the indexation of benefits to consumer prices.
- Major transfers to other levels of government were up $1.7 billion, or 25.1 per cent, largely due to year‑over‑year timing differences in Canada-wide early learning and child care transfers and legislated growth in the Canada Health Transfer, the Canada Social Transfer, Equalization transfers and transfers to the territories.
- Proceeds from the pollution pricing framework returned increased by $36 million, or 50.7 per cent, largely reflecting an increase in the rate of the Climate Action Incentive and, starting July 2023, the inclusion of Newfoundland and Labrador, Nova Scotia, and Prince Edward Island in the framework for the fuel charge. Direct proceeds continue to be fully returned in the provinces or territories where they are generated.
- Direct program expenses were down $1.6 billion, or 10.7 per cent. Within direct program expenses:
- Other transfer payments decreased by $0.8 billion, or 14.6 per cent, largely reflecting increased transfers for international assistance in August 2022, which did not recur in the current year.
- Operating expenses of the government's departments, agencies, and consolidated Crown corporations and other entities decreased by $0.9 billion, or 8.7 per cent, largely reflecting year-to-date adjustments made in the prior and current years for pensions and benefits expense to reflect the latest actuarial valuations prepared for the Public Accounts of Canada.
Public debt charges increased $0.7 billion, or 20.6 per cent, largely reflecting higher interest rates, offset in part by lower Consumer Price Index adjustments on Real Return Bonds.
Net actuarial losses and gains, which represent the amortization of changes in the value of the government's obligations for pensions and other employee future benefits accrued in previous fiscal years and related assets, contributed a $0.1 billion gain, compared to a $0.6 billion loss in the same period of the prior year. This largely reflects a year-to-date adjustment in August 2023 to reflect the amortization of gains arising from actuarial valuations prepared for the Public Accounts of Canada 2023.
For the April to August period of 2023-24, program expenses excluding net actuarial losses were $161.9 billion, up $7.4 billion, or 4.8 per cent, from the same period the previous year.
- Major transfers to persons were up $0.9 billion or 1.9 per cent.
- Elderly benefits increased by $3.6 billion, or 13.1 per cent, largely reflecting growth in the number of recipients and changes in consumer prices, to which benefits are fully indexed. In addition, as of July 2022, the Old Age Security pension has permanently increased by 10 per cent for seniors aged 75 and over.
- EI benefits decreased by $1.0 billion, or 10.9 per cent, largely reflecting the expiry of temporary pandemic‑related measures to facilitate access to EI.
- COVID-19 income support for workers decreased $2.0 billion, due to the wind-down of these benefits in the prior year, and the redetermination of benefits in the current year.
- Children's benefits were up $0.4 billion, or 4.0 per cent, mainly reflecting the indexation of benefits to consumer prices.
- Major transfers to other levels of government were up $2.2 billion, or 6.0 per cent, largely reflecting legislated growth in the Canada Health Transfer, the Canada Social Transfer, Equalization transfers and transfers to the territories, offset in part by year-over-year timing differences in Canada-wide early learning and child care transfers and an increase in the current year in the amount recorded for the Quebec Abatement, which is accounted for as a reduction in transfer payments.
- Proceeds from the pollution pricing framework returned increased by $1.5 billion, or 46.3 per cent, largely reflecting an increase in the rate of the Climate Action Incentive and, starting July 2023, the inclusion of Newfoundland and Labrador, Nova Scotia, and Prince Edward Island in the framework for the fuel charge.
- Direct program expenses were up $2.8 billion, or 4.2 per cent. Within direct program expenses:
- Other transfer payments increased by $1.1 billion, or 4.7 per cent, reflecting a number of factors including higher payments with respect to Indigenous Peoples, disbursements for the third round of the Rapid Housing Initiative, and higher transfers under the Canada Workers Benefit, offset in part by the one-time, non-taxable grant provided by the government in 2022-23 to alleviate the financial hardship of Guaranteed Income Supplement and Allowance recipients who received pandemic benefits in 2020, as well as a decrease in international assistance.
- Operating expenses of the government's departments, agencies, and consolidated Crown corporations and other entities increased by $1.6 billion, or 3.9 per cent, reflecting in large part higher personnel expenses and bad debt expenses.
Public debt charges increased by $4.1 billion, or 27.7 per cent, largely reflecting higher interest rates, offset in part by lower Consumer Price Index adjustments on Real Return Bonds.
Net actuarial losses decreased by $0.9 billion, or 22.7 per cent, reflecting the amortization of gains arising from actuarial valuations prepared for the Public Accounts of Canada 2023.
| August | April to August | |||||
|---|---|---|---|---|---|---|
| 2022 | 2023 | Change | 2022-23 | 2023-24 | Change | |
| ($ millions) | (%) | ($ millions) | (%) | |||
| Major transfers to persons | ||||||
Elderly benefits |
5,723 | 6,237 | 9.0 | 27,348 | 30,936 | 13.1 |
Employment Insurance benefits |
2,452 | 2,345 | -4.4 | 9,594 | 8,548 | -10.9 |
COVID-19 income support for workers1 |
4 | -461 | -11,625.0 | 241 | -1,780 | -838.6 |
Children's benefits |
2,014 | 2,190 | 8.7 | 10,126 | 10,527 | 4.0 |
| Total major transfers to persons | 10,193 | 10,311 | 1.2 | 47,309 | 48,231 | 1.9 |
| Major transfers to other levels of government | ||||||
Canada Health Transfer |
3,767 | 4,118 | 9.3 | 18,837 | 20,592 | 9.3 |
Canada Social Transfer |
1,328 | 1,368 | 3.0 | 6,641 | 6,840 | 3.0 |
Equalization |
1,827 | 1,997 | 9.3 | 9,133 | 9,984 | 9.3 |
Territorial Formula Financing |
310 | 329 | 6.1 | 2,386 | 2,533 | 6.2 |
Canada-wide early learning and child care |
- | 1,170 | n/a | 2,219 | 1,788 | -19.4 |
Canada Community-Building Fund |
- | - | n/a | 1,134 | 1,184 | 4.4 |
Health agreements with provinces/territories2 |
- | - | n/a | 1 | - | -100.0 |
Other fiscal arrangements3 |
-531 | -596 | -12.2 | -2,625 | -2,949 | -12.3 |
| Total major transfers to other levels of government | 6,701 | 8,386 | 25.1 | 37,726 | 39,972 | 6.0 |
| Proceeds from the pollution pricing framework returned | 71 | 107 | 50.7 | 3,194 | 4,672 | 46.3 |
| Direct program expenses | ||||||
Other transfer payments4 |
5,180 | 4,423 | -14.6 | 23,565 | 24,681 | 4.7 |
Operating expenses |
10,185 | 9,299 | -8.7 | 42,691 | 44,340 | 3.9 |
| Total direct program expenses | 15,365 | 13,722 | -10.7 | 66,256 | 69,021 | 4.2 |
| Total program expenses, excluding net actuarial losses and gains | 32,330 | 32,526 | 0.6 | 154,485 | 161,896 | 4.8 |
| Public debt charges | 3,570 | 4,304 | 20.6 | 14,759 | 18,843 | 27.7 |
| Total expenses, excluding net actuarial losses and gains | 35,900 | 36,830 | 2.6 | 169,244 | 180,739 | 6.8 |
Net actuarial losses (gains) |
635 | -130 | -120.5 | 4,075 | 3,150 | -22.7 |
| Total expenses | 36,535 | 36,700 | 0.5 | 173,319 | 183,889 | 6.1 |
|
Note: Totals may not add due to rounding. 1 COVID-19 income support for workers includes the Canada Emergency Response Benefit, the Canada Recovery Benefit, the Canada Recovery Caregiving Benefit, the Canada Recovery Sickness Benefit, and the Canada Worker Lockdown Benefit. 2 Health agreements with provinces/territories include Home and Community Care and Mental Health and Substance Use Agreements. 3 Other fiscal arrangements include the Quebec Abatement (Youth Allowances Recovery and Alternative Payments for Standing Programs), which represent a recovery from Quebec of a tax point transfer; statutory subsidies; and other items. 4 Comparative figures have been reclassified to reflect the current year's presentation. |
||||||
The following table presents total expenses by main object of expense.
| August | April to August | |||||
|---|---|---|---|---|---|---|
| 2022 | 2023 | Change | 2022-23 | 2023-24 | Change | |
| ($ millions) | (%) | ($ millions) | (%) | |||
| Transfer payments | 22,145 | 23,227 | 4.9 | 111,794 | 117,556 | 5.2 |
| Other expenses | ||||||
| Personnel, excluding net actuarial losses and gains | 6,106 | 5,495 | -10.0 | 25,761 | 26,834 | 4.2 |
| Transportation and communications | 282 | 243 | -13.8 | 1,031 | 1,084 | 5.1 |
| Information | 56 | 34 | -39.3 | 143 | 133 | -7.0 |
| Professional and special services | 1,224 | 1,577 | 28.8 | 5,158 | 5,825 | 12.9 |
| Rentals | 333 | 295 | -11.4 | 1,807 | 1,907 | 5.5 |
| Repair and maintenance | 350 | 336 | -4.0 | 1,429 | 1,255 | -12.2 |
| Utilities, materials and supplies | 653 | 439 | -32.8 | 2,717 | 1,959 | -27.9 |
| Other subsidies and expenses | 745 | 433 | -41.9 | 2,465 | 3,126 | 26.8 |
| Amortization of tangible capital assets | 425 | 434 | 2.1 | 2,131 | 2,173 | 2.0 |
| Net loss on disposal of assets | 11 | 13 | 18.2 | 49 | 44 | -10.2 |
| Total other expenses | 10,185 | 9,299 | -8.7 | 42,691 | 44,340 | 3.9 |
| Total program expenses, excluding net actuarial losses and gains | 32,330 | 32,526 | 0.6 | 154,485 | 161,896 | 4.8 |
| Public debt charges | 3,570 | 4,304 | 20.6 | 14,759 | 18,843 | 27.7 |
| Total expenses, excluding net actuarial losses and gains | 35,900 | 36,830 | 2.6 | 169,244 | 180,739 | 6.8 |
| Net actuarial losses (gains) | 635 | -130 | -120.5 | 4,075 | 3,150 | -22.7 |
| Total expenses | 36,535 | 36,700 | 0.5 | 173,319 | 183,889 | 6.1 |
|
Note: Totals may not add due to rounding. |
||||||
Revenues and expenses (April to August 2023)
Financial requirement of $44.4 billion for April to August 2023
The budgetary balance is presented on an accrual basis of accounting, recording government revenues and expenses when they are earned or incurred, regardless of when the cash is received or paid. In contrast, the financial source/requirement measures the difference between cash coming in to the government and cash going out. This measure is affected not only by changes in the budgetary balance but also by the cash source/requirement resulting from the government's investing activities through its acquisition of capital assets and its loans, financial investments and advances, as well as from other activities, including payment of accounts payable and collection of accounts receivable, foreign exchange activities, and the amortization of its tangible capital assets. The difference between the budgetary balance and financial source/requirement is recorded in non-budgetary transactions.
With a budgetary deficit of $4.3 billion and a requirement of $40.1 billion from non-budgetary transactions, there was a financial requirement of $44.4 billion for the April to August 2023 period, compared to a financial requirement of $21.6 billion for the same period of the previous year.
| August | April to August | |||
|---|---|---|---|---|
| 2022 | 2023 | 2022-23 | 2023-24 | |
| Budgetary balance (deficit/surplus) | -2,454 | -3,053 | 3,878 | -4,287 |
| Non-budgetary transactions | ||||
| Accounts payable, accrued liabilities and accounts receivable | 3,249 | 1,172 | -11,282 | -31,033 |
| Pensions, other future benefits, and other liabilities | 1,375 | 5 | 5,568 | 3,971 |
| Foreign exchange accounts and derivatives | -5,778 | -1,636 | -14,406 | -9,622 |
| Loans, investments and advances | -745 | -406 | -4,623 | -2,822 |
| Non-financial assets | -125 | -355 | -709 | -603 |
| Total non-budgetary transactions | -2,024 | -1,220 | -25,452 | -40,109 |
| Financial source/requirement | -4,478 | -4,273 | -21,574 | -44,396 |
|
Note: Totals may not add due to rounding. |
||||
Net financing activities up $70.0 billion
The government financed this financial requirement of $44.4 billion and increased cash balances by $25.6 billion by increasing unmatured debt by $70.0 billion. The increase in unmatured debt was achieved primarily through the issuance of treasury bills and marketable bonds.
Cash balances at the end of August 2023 stood at $67.4 billion, down $29.5 billion from their level at the end of August 2022.
| August | April to August | |||
|---|---|---|---|---|
| 2022 | 2023 | 2022-23 | 2023-24 | |
| Financial source/requirement | -4,478 | -4,273 | -21,574 | -44,396 |
| Net increase (+)/decrease (-) in financing activities | ||||
| Unmatured debt transactions | ||||
Canadian currency borrowings |
||||
Marketable bonds |
-10,537 | -1,101 | 26,546 | 11,795 |
Treasury bills |
1,816 | 20,911 | -7,810 | 51,898 |
Total Canadian currency borrowings |
-8,721 | 19,810 | 18,736 | 63,693 |
Foreign currency borrowings |
3,512 | -79 | 7,639 | 6,469 |
Total market debt transactions |
-5,209 | 19,731 | 26,375 | 70,162 |
Obligations related to capital leases and other unmatured debt |
-20 | -20 | -126 | -130 |
| Net change in financing activities | -5,229 | 19,711 | 26,249 | 70,032 |
| Change in cash balance | -9,707 | 15,438 | 4,675 | 25,636 |
| Cash balance at end of period | 96,937 | 67,432 | ||
|
Note: Totals may not add due to rounding. |
||||
Federal debt
The federal debt, or accumulated deficit, is the difference between the government's total liabilities and total assets. The year-over-year change in the accumulated deficit reflects the year-to-date budgetary balance plus remeasurement gains and losses.
Remeasurement gains and losses include:
- changes in the fair value of derivatives, such as swap agreements and foreign exchange forward agreements, which are used by the government to manage financial risks, and
- certain unrealized gains and losses on financial instruments and certain actuarial gains and losses related to pensions and other employee future benefits reported by consolidated Crown corporations, enterprise Crown corporations, and other government business enterprises.
Remeasurement gains and losses are not reflected in the budgetary balance but are instead charged directly to the accumulated deficit. The government began accounting for remeasurement gains and losses in 2022-23 with the adoption of a new standard of the Public Sector Accounting Board regarding financial instruments.
The accumulated deficit increased by $7.2 billion over the April to August 2023 period, reflecting the $4.3‑billion budgetary deficit and $2.9 billion in net remeasurement losses.
| March 31, 2023 | August 31, 2023 | Change | |
|---|---|---|---|
| Liabilities | |||
| Accounts payable and accrued liabilities | 259,440 | 220,638 | -38,802 |
| Interest-bearing debt | |||
Unmatured debt |
|||
Payable in Canadian currency |
|||
Marketable bonds |
1,044,997 | 1,056,792 | 11,795 |
Treasury bills |
198,899 | 250,797 | 51,898 |
Subtotal |
1,243,896 | 1,307,589 | 63,693 |
Payable in foreign currencies |
16,034 | 22,503 | 6,469 |
Obligations related to capital leases and other unmatured debt |
5,110 | 4,980 | -130 |
Total unmatured debt |
1,265,040 | 1,335,072 | 70,032 |
Pension and other liabilities |
|||
Public sector pensions |
166,425 | 163,758 | -2,667 |
Other employee and veteran future benefits |
177,949 | 185,647 | 7,698 |
Other liabilities |
7,339 | 6,279 | -1,060 |
Total pension and other liabilities |
351,713 | 355,684 | 3,971 |
Total interest-bearing debt |
1,616,753 | 1,690,756 | 74,003 |
| Foreign exchange accounts liabilities | 44,151 | 43,796 | -355 |
| Derivatives1 | 4,689 | 2,372 | -2,317 |
| Total liabilities | 1,925,033 | 1,957,562 | 32,529 |
| Financial assets | |||
| Cash and accounts receivable | 243,520 | 261,387 | 17,867 |
| Foreign exchange accounts assets | 169,390 | 176,948 | 7,558 |
| Derivatives1 | 3,260 | 83 | -3,177 |
| Loans, investments, and advances (net of allowances)2 | 213,110 | 215,581 | 2,471 |
| Public sector pension assets | 12,996 | 12,996 | - |
| Total financial assets | 642,276 | 666,995 | 24,719 |
| Net debt | 1,282,757 | 1,290,567 | 7,810 |
| Non-financial assets | 109,744 | 110,347 | 603 |
| Federal debt (accumulated deficit) | 1,173,013 | 1,180,220 | 7,207 |
|
Note: Totals may not add due to rounding. 1 August 31, 2023 net balance of derivative assets and derivative liabilities includes net remeasurement losses of $2.6 billion resulting from the change in their fair values over the April to August 2023 period. 2 August 31, 2023 amount includes $0.4 billion in net remeasurement losses from consolidated Crown corporations, enterprise Crown corporations, and other government business enterprises for the April to August 2023 period. |
|||
Notes
- The Fiscal Monitor is a report on the consolidated financial results of the Government of Canada, prepared monthly by the Department of Finance Canada. The government is committed to releasing The Fiscal Monitor on a timely basis in accordance with the International Monetary Fund's Special Data Dissemination Standards Plus, which are designed to promote member countries' data transparency and promote the development of sound statistical systems.
- The financial results reported in The Fiscal Monitor are drawn from the accounts of Canada, which are maintained by the Receiver General and used to prepare the annual Public Accounts of Canada.
- The Fiscal Monitor is generally prepared in accordance with the same accounting policies as used to prepare the government's annual consolidated financial statements, which are summarized in Section 2 of Volume I of the Public Accounts of Canada, available through the Public Services and Procurement Canada website.
- The financial results presented in The Fiscal Monitor have not been audited or reviewed by an external auditor.
- There can be substantial volatility in monthly results due to the timing of revenue receipts and expense recognition. For instance, a large share of government spending is typically reported in the March Fiscal Monitor.
- The April to March results reported in The Fiscal Monitor are not the final results for the fiscal year as a whole. The final results are published in the annual Public Accounts of Canada and incorporate post-March end-of-year adjustments made once further information becomes available, including the accrual of tax revenues reflecting assessments of tax returns and valuation adjustments for assets and liabilities. Post-March adjustments may also include the accrual of measures announced in the budget that are recorded upon receipt of Royal Assent of enabling legislation.
- Table 7, Condensed Statement of Assets and Liabilities, is included in the monthly Fiscal Monitor following the finalization and publication of the government's financial results for the preceding fiscal year, typically in the fall.
Note: Unless stated otherwise, changes in financial results are presented on a year-over-year basis.
For inquiries about this publication, contact Bradley Recker at bradley.recker@fin.gc.ca.
October 2023