
Changing Nature of Work and Skills infographic – 2021
Alternate formats

Figure 1: Changing Nature of Work and Skills Infographic
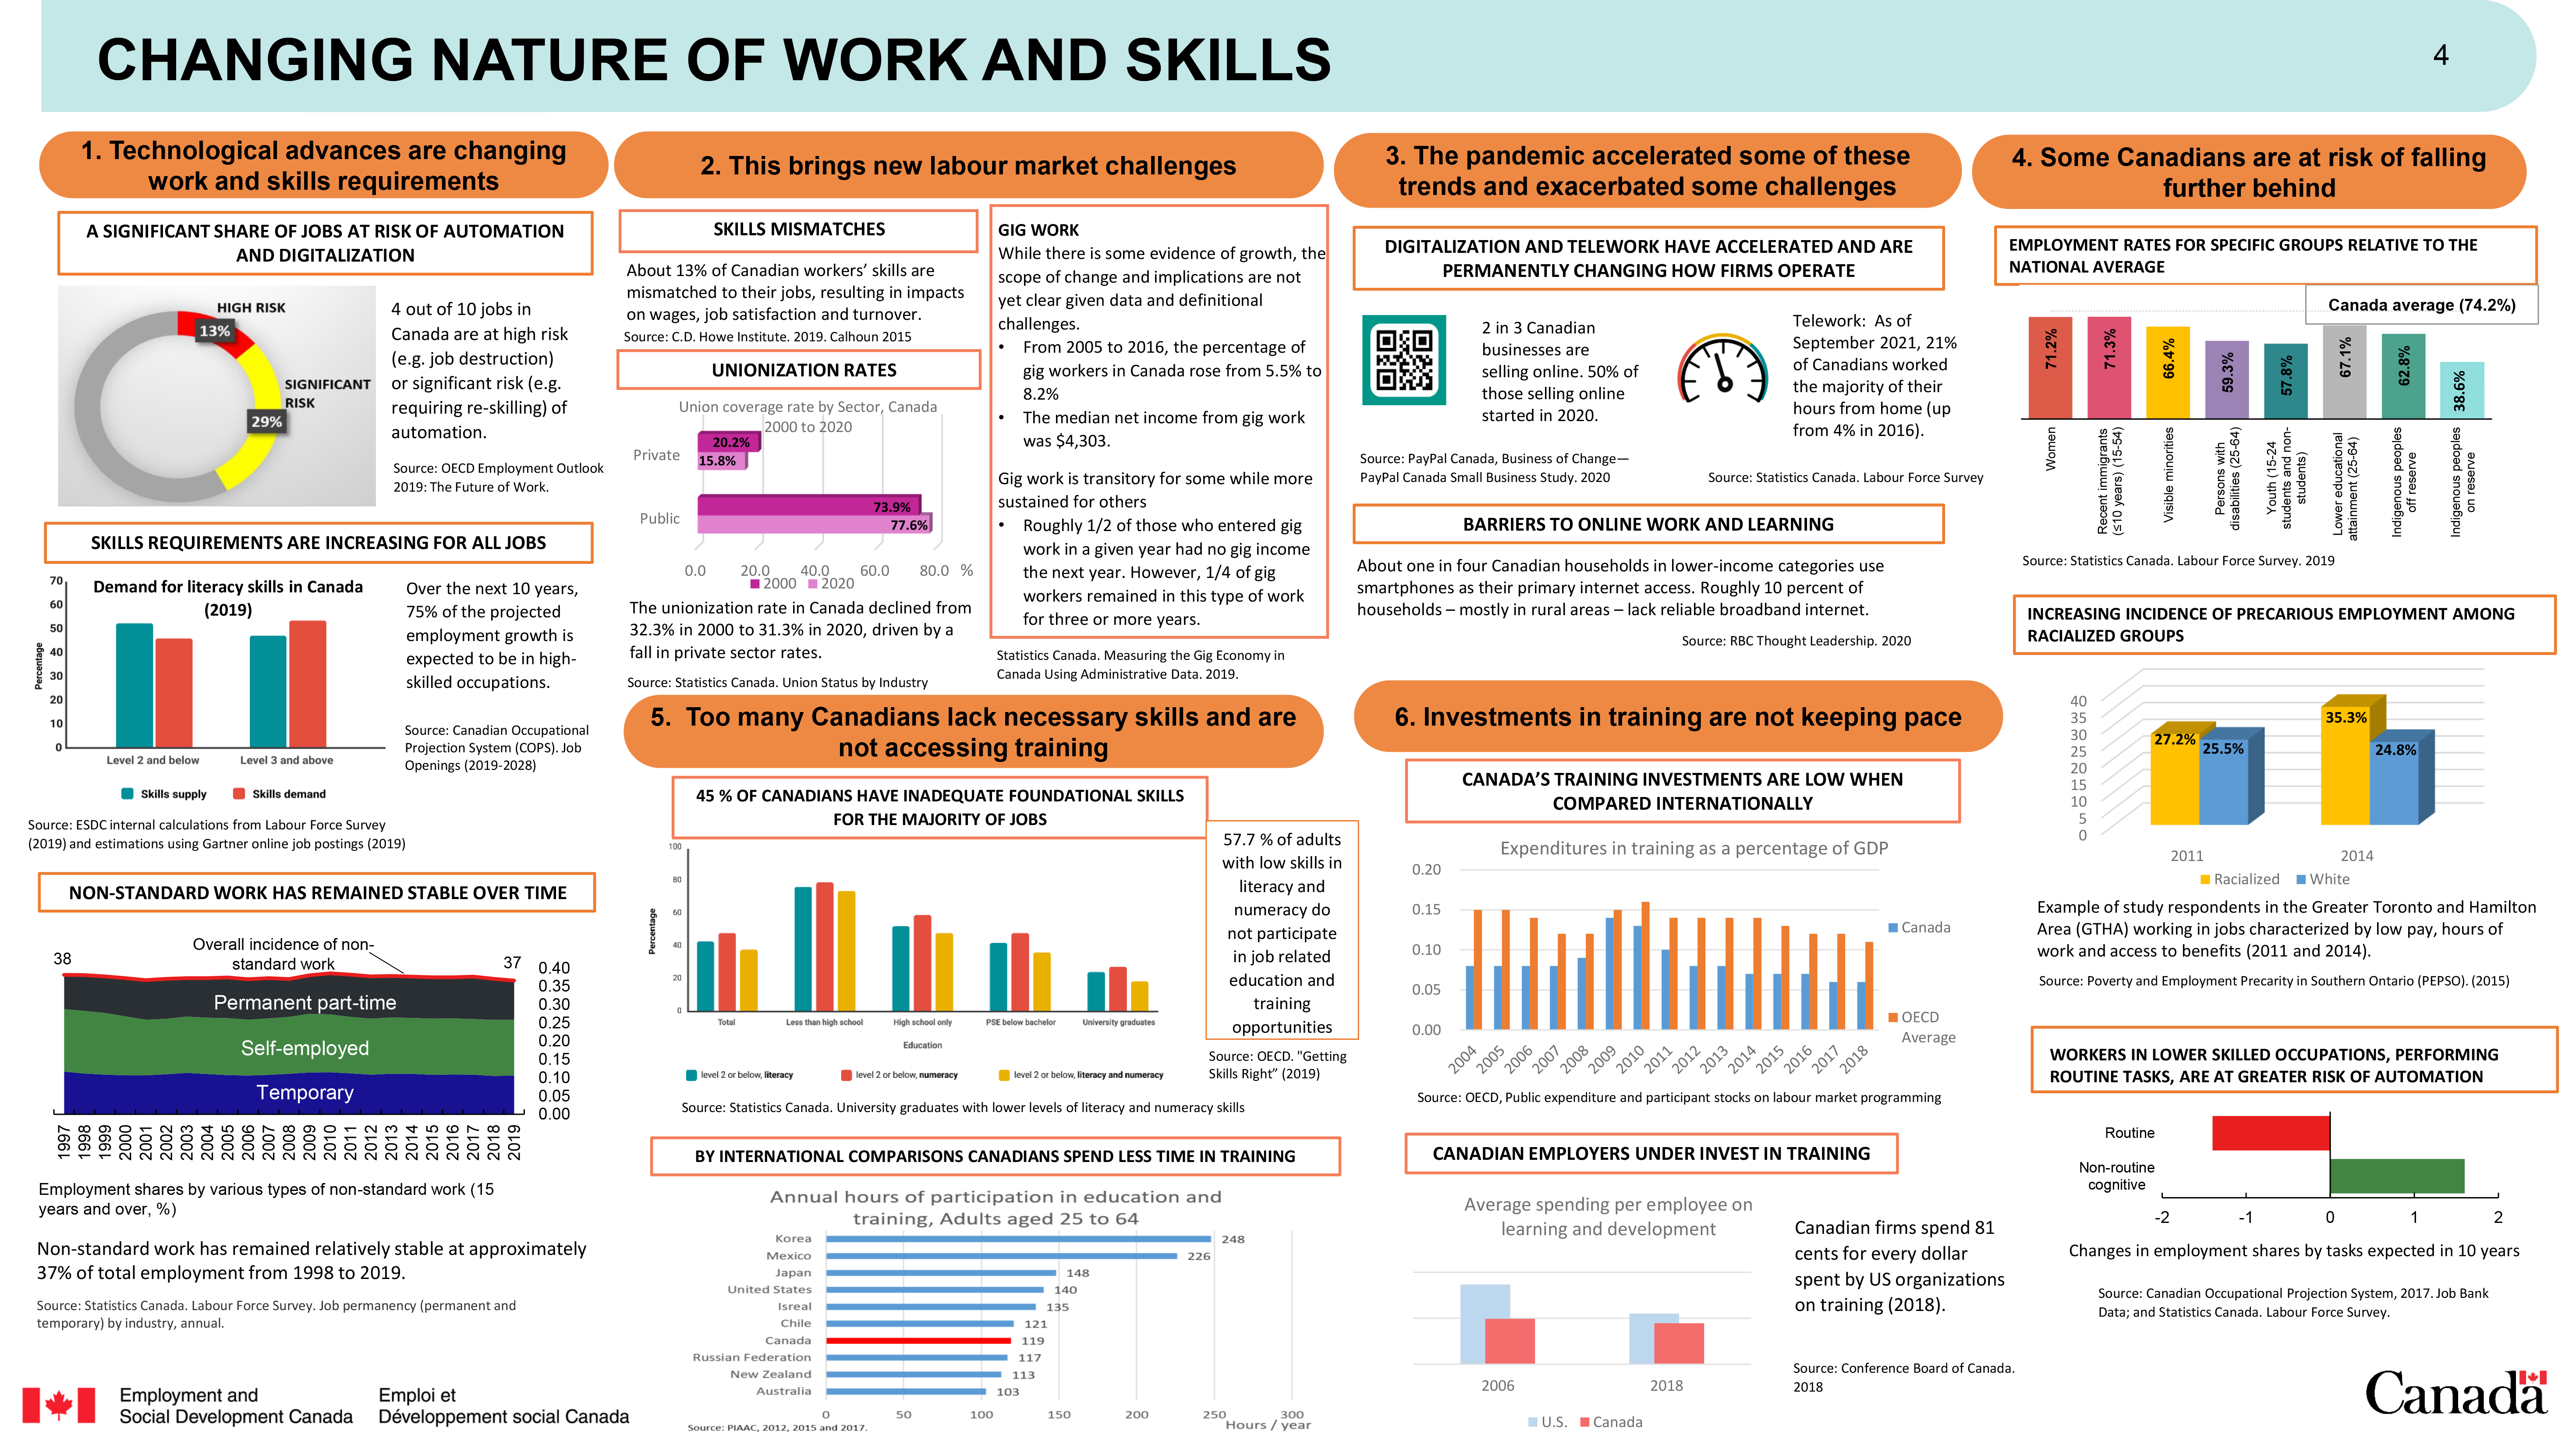
Figure 1: Text description
Changing Nature of Work and Skills
1. Technological advances are changing work and skills requirements
A significant share of jobs are at risk of automation and digitalization
4 out of 10 jobs in Canada are at high risk (for example job destruction) or significant risk (for example requiring re-skilling) of automation
Diagram 1 text: Percentage of jobs at significant or high risk of automation
- 13% of jobs are at high risk
- 29% of jobs are at significant risk
Source: OECD Employment Outlook 2019: The Future of Work.
Skills requirements are increasing for all jobs
Diagram 2 text: Demand for literacy skills in Canada (2019)
- Level 3 and above literacy skills (on a 5-point scale) is generally recognized as the level individuals require to succeed in a knowledge-based economy
- The supply of literacy skills at level 2 or below in Canada is greater than the demand for these skills
- The supply of literacy skills at level 3 and above in Canada is below the demand for these skills
Source: ESDC internal calculations from Labour Force Survey (2019) and estimations using Gartner online job postings (2019)
Over the next 10 years, 75% of the projected employment growth is expected to be in high-skilled occupations.
Source: Canadian Occupational Projection System (COPS). Job Openings (2019 to 2028)
Non-standard work has remained stable over time
Non-Standard work has remained relatively stable at approximately 37% of total employment from 1998 to 2019.
Diagram 3 text: Employment shares by various types of non-standard work (15 years and over, %)
- Permanent part-time employment has remained relatively stable, fluctuating between 10.5% and 11.5% over the reference period
- Self-employment has remained relatively stable, fluctuating between 15.2% and 17.2% over the reference period
- Temporary employment has remained relatively stable, fluctuating between 9.8% and 11.6% over the reference period
Source: Statistics Canada. Temporary employment in Canada. 2019. Job permanency (permanent and temporary) by industry, annual.
2. This brings new labour market challenges
Skills Mismatches
About 13% of Canadian workers’ skills are mismatched to their jobs, resulting in impacts on wages, job satisfaction and turnover.
Source: C.D. Howe Institute. 2019. Calhoun 2015.
Unionization Rates
The unionization rate in Canada declined from 32.3% in 2000 to 31.3% in 2020, driven by a fall in private sector rates.
Diagram 4 text: Union coverage rate by sector, Canada 2000 to 2020
- In the private sector, 20.2% of workers were unionized in 2000 as compared to 15.8% in 2020
- In the public sector, 73.9% of workers were unionized in 2000 as compared to 77.6% in 2020
Source: Statistics Canada. Union Status by Industry.
Gig Work
While there is some evidence of growth, the scope of change and implications are not yet clear given data and definitional challenges.
- From 2005 to 2016, the percentage of gig workers in Canada rose from 5.5% to 8.2%
- The median net income from gig work was $4,303
Gig work is transitory for some while more sustained for others.
- Roughly 1/2 of those who entered gig work in a given year had no gig income the next year. However, 1/4 of gig workers remained in this type of work for three or more years.
Source: Statistics Canada, Measuring the Gig Economy in Canada. Using Administrative Data, 2019.
3. The pandemic accelerated some of these trends and exacerbated some challenges
Digitalization and telework have accelerated and are permanently changing how firms operate
2 in 3 Canadian businesses are selling online. 50% of those selling online started in 2020.
Source: PayPal Canada, Business of Change—PayPal Canada Small Business Study. 2020.
Telework: As of September 2021, 21% of Canadians worked the majority of their hours from home (up from 4% in 2016).
Source: Statistics Canada. Labour Force Survey.
Barriers to online work and learning
About 1 in 4 Canadian households in lower-income categories use smartphones as their primary internet access. Roughly, 10% of households – mostly in rural areas – lack reliable broadband internet.
Source: RBC Thought Leadership. 2020.
4. Some Canadians are at risk of falling further behind
Employment rates for specific groups relative to the national average
Diagram 5 text: Employment rates of specific groups (2019)
| Group | Rate |
|---|---|
| Women | 71.2% |
| Recent immigrants (10 years and under), (15 to 54) | 71.3% |
| Visible Minorities | 66.4% |
| Persons with Disabilities (25 to 64) | 59.3% |
| Youth (15 to 24, students and non-students) | 57.8% |
| Lower educational attainment (25-) | 67.1% |
| Indigenous people off reserve | 62.8% |
| Indigenous people on reserve | 38.6% |
| Canada average | 74.2% |
Source: Statistics Canada, Labour Force Survey. 2019
Increasing incidence of precarious employment among racialized groups
Diagram 6 text: Example of study respondents in the Greater Toronto and Hamilton Area (GTHA) working in jobs characterized by low pay, hours of work and access to benefits (2011 and 2014)
- 27.2% of racialized respondents in a study out of the Greater Toronto and Hamilton Area declared they were working in jobs characterized by low pay, hours of work, and access to benefits, as compared to 25.5% of white respondents that same year (2011)
- In follow-up to the same survey, 35.3% of racialized respondents declared working in jobs characterized by low pay, hours of work, and access to benefits, as compared to 24.8% of white respondents (2014)
Source: Poverty and Employment Precarity in Southern Ontario (PEPSO). (2015). The precarity penalty. PEPSO.
Workers in lower skilled occupations, performing routine tasks, are at greater risk of automation
Diagram 7 text: Changes in employment shares by tasks expected in 10 years
- Employment shares based on routine tasks are expected to decline by 1.4%
- Employment shares based non-routine cognitive tasks are expected to grow by 1.5%
Source: Canadian Occupational Projection System, 2017. Job Bank Data; and, Statistics Canada. Labour Force Survey.
5. Too many Canadians lack necessary skills and are not accessing training
45 % of Canadians have inadequate foundational skills for the majority of jobs
Foundational skills challenges affect many Canadians, regardless of their formal educational attainment. For example, 27% respondents aged 25 to 65 with a university degree had literacy skills in the lower range (level 2 or below).
Diagram 8 text: Percentage of Canadians aged 25 to 65 with literacy and/or numeracy skills at or below level 2, by level of education
| University graduates with lower levels of literacy and numeracy skills | Level 2 or below, literacy | Level 2 or below, numeracy | Level 2 or below, literacy and numeracy |
|---|---|---|---|
| Total | 49.0 | 55.0 | 43.4 |
| Less than high school | 87.8 | 90.9 | 85.3 |
| High school only | 60.0 | 68.0 | 54.8 |
| PSE below bachelor | 48.3 | 55.1 | 41.7 |
| University graduates | 27.2 | 31.8 | 21.6 |
Source: Statistics Canada. University graduates with lower levels of literacy and numeracy skills
57.7% of adults with low skills in literacy and numeracy do not participate in job related education and training opportunities.
Source: OECD, OCDE. "Getting Skills Right" (2019).
By international comparisons, Canadians spend less time in training
Diagram 9 text: Annual hours of participation in education and training, Adults aged 25 to 64
| Country | Hours per year |
|---|---|
| Korea | 248 |
| Mexico | 226 |
| Japan | 148 |
| United States | 140 |
| Israel | 135 |
| Chile | 121 |
| Canada | 119 |
| Russian Federation | 117 |
| New Zealand | 113 |
| Australia | 103 |
Source: OECD, Programme for the International Assessment of Adult Competencies (PIAAC), 2012, 2015 and 2017
6. Investments in training are not keeping pace
Canada’s training investments are low when compared internationally
Between 2004 and 2018, public expenditures in training as a percentage of GDP across OECD countries, on average was 0.14. The average expenditure in Canada for the reference period was 0.08.
Diagram 10 text: Expenditures in training as a percentage of GDP
| Year | Canada | OECD Average |
|---|---|---|
| 2004 | 0.08 | 0.15 |
| 2005 | 0.08 | 0.15 |
| 2006 | 0.08 | 0.14 |
| 2007 | 0.08 | 0.12 |
| 2008 | 0.09 | 0.12 |
| 2009 | 0.14 | 0.15 |
| 2010 | 0.13 | 0.16 |
| 2011 | 0.10 | 0.14 |
| 2012 | 0.08 | 0.14 |
| 2013 | 0.08 | 0.14 |
| 2014 | 0.07 | 0.14 |
| 2015 | 0.07 | 0.13 |
| 2016 | 0.07 | 0.12 |
| 2017 | 0.06 | 0.12 |
| 2018 | 0.06 | 0.11 |
Source: OECD, Public expenditure and participant stocks on labour market programming
Canadian employers under invest in training
Diagram 11 text: Average spending per employee on learning and development
- Data from 2006 and 2018 shows that Canadian organizations were (and remain) behind their U.S. counterparts in workplace training investments
- Canadian firms spend 81 cents for every dollar spent by US organizations on average per employee on learning and development (2018)
Source: Conference Board of Canada. 2018.