
Economic recovery in uncertain times and the future of the labour market - 2021
From: Employment and Social Development Canada
Alternate formats

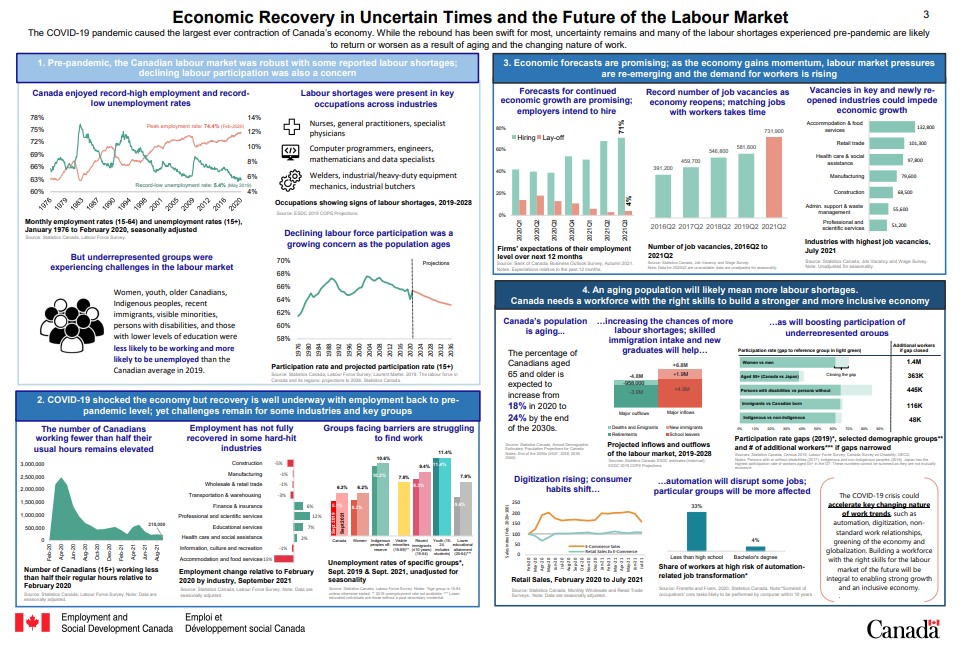
Figure 1: Text version
Economic recovery in uncertain times and the future of the labour market
The COVID-19 pandemic caused the largest ever contraction of Canada’s economy. While the rebound has been swift for most, uncertainty remains and many of the labour shortages experienced pre-pandemic are likely to return or worsen as a result of aging and the changing nature of work.
1. Pre-pandemic, the Canadian labour market was robust with some reported labour shortages; declining labour participation was also a concern
Canada enjoyed record-high employment and record-low unemployment rates
Peak employment rate: 74.4% in February 2020.
Record-low unemployment rate: 5.4% in May 2019.
| Date | Unemployment rate (15+) | Employment rate (15 to 64) |
|---|---|---|
| Jan-76 | 7.1% | 63.0% |
| Feb-76 | 7.0% | 63.1% |
| Mar-76 | 6.7% | 63.2% |
| Apr-76 | 6.8% | 63.3% |
| May-76 | 6.9% | 63.2% |
| Jun-76 | 6.9% | 63.1% |
| Jul-76 | 7.4% | 63.0% |
| Aug-76 | 7.1% | 63.0% |
| Sep-76 | 7.0% | 63.1% |
| Oct-76 | 7.4% | 62.9% |
| Nov-76 | 7.4% | 63.1% |
| Dec-76 | 7.5% | 63.3% |
| Jan-77 | 7.6% | 63.2% |
| Feb-77 | 7.9% | 63.1% |
| Mar-77 | 7.8% | 63.0% |
| Apr-77 | 7.9% | 63.1% |
| May-77 | 7.8% | 63.1% |
| Jun-77 | 7.8% | 62.9% |
| Jul-77 | 8.1% | 62.8% |
| Aug-77 | 8.2% | 62.8% |
| Sep-77 | 8.3% | 62.8% |
| Oct-77 | 8.4% | 62.9% |
| Nov-77 | 8.5% | 62.9% |
| Dec-77 | 8.5% | 63.0% |
| Jan-78 | 8.3% | 63.0% |
| Feb-78 | 8.3% | 63.2% |
| Mar-78 | 8.5% | 63.3% |
| Apr-78 | 8.4% | 63.4% |
| May-78 | 8.6% | 63.4% |
| Jun-78 | 8.4% | 63.6% |
| Jul-78 | 8.3% | 63.9% |
| Aug-78 | 8.4% | 64.0% |
| Sep-78 | 8.4% | 64.0% |
| Oct-78 | 8.2% | 64.3% |
| Nov-78 | 8.3% | 64.4% |
| Dec-78 | 8.3% | 64.5% |
| Jan-79 | 8.2% | 64.8% |
| Feb-79 | 8.0% | 64.7% |
| Mar-79 | 7.9% | 64.9% |
| Apr-79 | 8.0% | 64.9% |
| May-79 | 7.6% | 65.2% |
| Jun-79 | 7.4% | 65.3% |
| Jul-79 | 7.2% | 65.6% |
| Aug-79 | 7.1% | 65.8% |
| Sep-79 | 7.0% | 65.7% |
| Oct-79 | 7.2% | 65.9% |
| Nov-79 | 7.2% | 66.0% |
| Dec-79 | 7.2% | 66.0% |
| Jan-80 | 7.5% | 66.1% |
| Feb-80 | 7.6% | 66.0% |
| Mar-80 | 7.6% | 65.9% |
| Apr-80 | 7.7% | 66.0% |
| May-80 | 7.8% | 65.7% |
| Jun-80 | 7.7% | 65.9% |
| Jul-80 | 7.6% | 65.8% |
| Aug-80 | 7.6% | 66.0% |
| Sep-80 | 7.3% | 66.2% |
| Oct-80 | 7.3% | 66.4% |
| Nov-80 | 7.2% | 66.5% |
| Dec-80 | 7.3% | 66.5% |
| Jan-81 | 7.4% | 66.8% |
| Feb-81 | 7.4% | 67.2% |
| Mar-81 | 7.4% | 67.1% |
| Apr-81 | 7.1% | 67.2% |
| May-81 | 7.2% | 67.4% |
| Jun-81 | 7.2% | 67.5% |
| Jul-81 | 7.2% | 67.3% |
| Aug-81 | 7.1% | 67.3% |
| Sep-81 | 8.1% | 66.9% |
| Oct-81 | 8.3% | 66.7% |
| Nov-81 | 8.3% | 66.6% |
| Dec-81 | 8.7% | 66.1% |
| Jan-82 | 8.6% | 65.9% |
| Feb-82 | 8.9% | 65.6% |
| Mar-82 | 9.3% | 65.4% |
| Apr-82 | 9.8% | 64.8% |
| May-82 | 10.3% | 64.5% |
| Jun-82 | 11.1% | 63.9% |
| Jul-82 | 11.9% | 63.5% |
| Aug-82 | 12.0% | 63.1% |
| Sep-82 | 12.4% | 62.9% |
| Oct-82 | 12.9% | 62.8% |
| Nov-82 | 12.9% | 62.7% |
| Dec-82 | 13.1% | 62.7% |
| Jan-83 | 12.7% | 62.7% |
| Feb-83 | 12.7% | 62.8% |
| Mar-83 | 12.5% | 63.0% |
| Apr-83 | 12.4% | 63.2% |
| May-83 | 12.4% | 63.3% |
| Jun-83 | 12.4% | 63.7% |
| Jul-83 | 11.9% | 63.9% |
| Aug-83 | 11.7% | 64.2% |
| Sep-83 | 11.4% | 64.4% |
| Oct-83 | 11.3% | 64.3% |
| Nov-83 | 11.3% | 64.3% |
| Dec-83 | 11.3% | 64.4% |
| Jan-84 | 11.3% | 64.2% |
| Feb-84 | 11.3% | 64.3% |
| Mar-84 | 11.3% | 64.2% |
| Apr-84 | 11.5% | 64.1% |
| May-84 | 11.7% | 64.3% |
| Jun-84 | 11.3% | 64.7% |
| Jul-84 | 11.2% | 64.8% |
| Aug-84 | 11.3% | 64.7% |
| Sep-84 | 11.8% | 64.9% |
| Oct-84 | 11.3% | 64.9% |
| Nov-84 | 11.4% | 64.9% |
| Dec-84 | 11.1% | 65.1% |
| Jan-85 | 10.6% | 65.3% |
| Feb-85 | 10.8% | 65.4% |
| Mar-85 | 11.0% | 65.5% |
| Apr-85 | 10.8% | 65.6% |
| May-85 | 10.6% | 65.9% |
| Jun-85 | 10.7% | 65.9% |
| Jul-85 | 10.4% | 66.1% |
| Aug-85 | 10.3% | 66.2% |
| Sep-85 | 10.2% | 66.2% |
| Oct-85 | 10.3% | 66.3% |
| Nov-85 | 10.3% | 66.6% |
| Dec-85 | 10.1% | 66.9% |
| Jan-86 | 9.8% | 67.1% |
| Feb-86 | 9.9% | 67.1% |
| Mar-86 | 9.8% | 67.1% |
| Apr-86 | 9.7% | 67.5% |
| May-86 | 9.5% | 67.4% |
| Jun-86 | 9.6% | 67.5% |
| Jul-86 | 9.6% | 67.4% |
| Aug-86 | 9.6% | 67.4% |
| Sep-86 | 9.5% | 67.4% |
| Oct-86 | 9.4% | 67.5% |
| Nov-86 | 9.4% | 67.6% |
| Dec-86 | 9.5% | 67.6% |
| Jan-87 | 9.5% | 67.6% |
| Feb-87 | 9.5% | 67.8% |
| Mar-87 | 9.4% | 68.0% |
| Apr-87 | 9.2% | 68.2% |
| May-87 | 8.9% | 68.5% |
| Jun-87 | 8.9% | 68.5% |
| Jul-87 | 8.7% | 68.6% |
| Aug-87 | 8.6% | 68.7% |
| Sep-87 | 8.4% | 68.9% |
| Oct-87 | 8.3% | 69.2% |
| Nov-87 | 8.2% | 69.4% |
| Dec-87 | 8.0% | 69.7% |
| Jan-88 | 8.1% | 69.7% |
| Feb-88 | 7.8% | 69.9% |
| Mar-88 | 7.8% | 69.9% |
| Apr-88 | 7.7% | 70.0% |
| May-88 | 7.8% | 70.0% |
| Jun-88 | 7.6% | 69.9% |
| Jul-88 | 7.8% | 70.0% |
| Aug-88 | 7.8% | 70.0% |
| Sep-88 | 7.8% | 69.9% |
| Oct-88 | 7.8% | 70.1% |
| Nov-88 | 7.8% | 70.2% |
| Dec-88 | 7.5% | 70.4% |
| Jan-89 | 7.5% | 70.7% |
| Feb-89 | 7.6% | 70.7% |
| Mar-89 | 7.5% | 70.9% |
| Apr-89 | 7.8% | 70.7% |
| May-89 | 7.7% | 70.6% |
| Jun-89 | 7.5% | 70.7% |
| Jul-89 | 7.5% | 70.7% |
| Aug-89 | 7.3% | 70.9% |
| Sep-89 | 7.3% | 70.8% |
| Oct-89 | 7.2% | 70.8% |
| Nov-89 | 7.5% | 70.8% |
| Dec-89 | 7.7% | 70.8% |
| Jan-90 | 7.9% | 70.8% |
| Feb-90 | 7.7% | 70.9% |
| Mar-90 | 7.3% | 70.7% |
| Apr-90 | 7.6% | 70.8% |
| May-90 | 7.8% | 70.5% |
| Jun-90 | 7.6% | 70.6% |
| Jul-90 | 7.9% | 70.5% |
| Aug-90 | 8.1% | 70.4% |
| Sep-90 | 8.5% | 70.2% |
| Oct-90 | 8.8% | 69.9% |
| Nov-90 | 9.1% | 69.5% |
| Dec-90 | 9.5% | 69.2% |
| Jan-91 | 9.8% | 68.8% |
| Feb-91 | 10.2% | 68.5% |
| Mar-91 | 10.5% | 68.2% |
| Apr-91 | 10.3% | 68.4% |
| May-91 | 10.2% | 68.4% |
| Jun-91 | 10.5% | 68.4% |
| Jul-91 | 10.5% | 68.3% |
| Aug-91 | 10.5% | 68.2% |
| Sep-91 | 10.3% | 68.1% |
| Oct-91 | 10.3% | 68.2% |
| Nov-91 | 10.4% | 67.8% |
| Dec-91 | 10.3% | 67.6% |
| Jan-92 | 10.4% | 67.4% |
| Feb-92 | 10.5% | 67.3% |
| Mar-92 | 10.9% | 67.0% |
| Apr-92 | 10.7% | 67.0% |
| May-92 | 10.9% | 66.9% |
| Jun-92 | 11.4% | 66.7% |
| Jul-92 | 11.3% | 66.7% |
| Aug-92 | 11.7% | 66.4% |
| Sep-92 | 11.6% | 66.5% |
| Oct-92 | 11.4% | 66.6% |
| Nov-92 | 12.1% | 66.5% |
| Dec-92 | 11.7% | 66.5% |
| Jan-93 | 11.2% | 66.6% |
| Feb-93 | 11.0% | 66.7% |
| Mar-93 | 11.2% | 66.6% |
| Apr-93 | 11.6% | 66.4% |
| May-93 | 11.6% | 66.3% |
| Jun-93 | 11.7% | 66.4% |
| Jul-93 | 11.6% | 66.4% |
| Aug-93 | 11.2% | 66.4% |
| Sep-93 | 11.5% | 66.5% |
| Oct-93 | 11.3% | 66.5% |
| Nov-93 | 11.2% | 66.6% |
| Dec-93 | 11.4% | 66.4% |
| Jan-94 | 11.4% | 66.3% |
| Feb-94 | 11.1% | 66.5% |
| Mar-94 | 10.6% | 66.5% |
| Apr-94 | 10.9% | 66.6% |
| May-94 | 10.7% | 66.9% |
| Jun-94 | 10.3% | 67.0% |
| Jul-94 | 10.1% | 67.2% |
| Aug-94 | 10.2% | 67.3% |
| Sep-94 | 10.1% | 67.5% |
| Oct-94 | 10.0% | 67.5% |
| Nov-94 | 9.7% | 67.8% |
| Dec-94 | 9.6% | 67.7% |
| Jan-95 | 9.6% | 67.7% |
| Feb-95 | 9.6% | 67.6% |
| Mar-95 | 9.7% | 67.7% |
| Apr-95 | 9.5% | 67.6% |
| May-95 | 9.5% | 67.4% |
| Jun-95 | 9.5% | 67.5% |
| Jul-95 | 9.6% | 67.4% |
| Aug-95 | 9.5% | 67.4% |
| Sep-95 | 9.2% | 67.5% |
| Oct-95 | 9.3% | 67.6% |
| Nov-95 | 9.2% | 67.4% |
| Dec-95 | 9.4% | 67.5% |
| Jan-96 | 9.4% | 67.4% |
| Feb-96 | 9.5% | 67.5% |
| Mar-96 | 9.6% | 67.3% |
| Apr-96 | 9.3% | 67.4% |
| May-96 | 9.2% | 67.4% |
| Jun-96 | 9.8% | 67.4% |
| Jul-96 | 9.7% | 67.4% |
| Aug-96 | 9.4% | 67.5% |
| Sep-96 | 9.9% | 67.1% |
| Oct-96 | 9.9% | 67.1% |
| Nov-96 | 9.9% | 67.2% |
| Dec-96 | 9.7% | 67.3% |
| Jan-97 | 9.5% | 67.5% |
| Feb-97 | 9.5% | 67.5% |
| Mar-97 | 9.3% | 67.6% |
| Apr-97 | 9.4% | 67.5% |
| May-97 | 9.4% | 67.7% |
| Jun-97 | 9.1% | 67.9% |
| Jul-97 | 8.9% | 68.0% |
| Aug-97 | 8.9% | 68.3% |
| Sep-97 | 8.8% | 68.3% |
| Oct-97 | 8.9% | 68.4% |
| Nov-97 | 8.9% | 68.4% |
| Dec-97 | 8.5% | 68.5% |
| Jan-98 | 8.8% | 68.3% |
| Feb-98 | 8.6% | 68.6% |
| Mar-98 | 8.4% | 68.7% |
| Apr-98 | 8.3% | 68.8% |
| May-98 | 8.3% | 68.7% |
| Jun-98 | 8.4% | 68.7% |
| Jul-98 | 8.3% | 68.9% |
| Aug-98 | 8.1% | 69.1% |
| Sep-98 | 8.2% | 69.2% |
| Oct-98 | 8.0% | 69.3% |
| Nov-98 | 8.0% | 69.4% |
| Dec-98 | 8.1% | 69.4% |
| Jan-99 | 7.9% | 69.7% |
| Feb-99 | 7.9% | 69.6% |
| Mar-99 | 7.9% | 69.6% |
| Apr-99 | 8.2% | 69.8% |
| May-99 | 7.9% | 69.9% |
| Jun-99 | 7.6% | 69.9% |
| Jul-99 | 7.6% | 70.1% |
| Aug-99 | 7.4% | 70.1% |
| Sep-99 | 7.5% | 70.2% |
| Oct-99 | 7.2% | 70.3% |
| Nov-99 | 6.9% | 70.5% |
| Dec-99 | 6.8% | 70.7% |
| Jan-00 | 6.8% | 70.8% |
| Feb-00 | 6.9% | 70.9% |
| Mar-00 | 6.9% | 70.9% |
| Apr-00 | 6.7% | 70.9% |
| May-00 | 6.6% | 70.9% |
| Jun-00 | 6.7% | 70.9% |
| Jul-00 | 6.8% | 70.8% |
| Aug-00 | 7.0% | 70.8% |
| Sep-00 | 6.9% | 70.9% |
| Oct-00 | 7.0% | 71.1% |
| Nov-00 | 6.9% | 71.1% |
| Dec-00 | 6.8% | 71.2% |
| Jan-01 | 6.9% | 71.1% |
| Feb-01 | 7.0% | 71.0% |
| Mar-01 | 7.1% | 71.0% |
| Apr-01 | 7.1% | 71.0% |
| May-01 | 7.0% | 71.0% |
| Jun-01 | 7.2% | 70.8% |
| Jul-01 | 7.1% | 70.8% |
| Aug-01 | 7.2% | 70.7% |
| Sep-01 | 7.2% | 70.7% |
| Oct-01 | 7.3% | 70.7% |
| Nov-01 | 7.5% | 70.7% |
| Dec-01 | 8.1% | 70.4% |
| Jan-02 | 8.0% | 70.6% |
| Feb-02 | 8.0% | 70.6% |
| Mar-02 | 7.9% | 70.9% |
| Apr-02 | 7.7% | 71.0% |
| May-02 | 7.8% | 71.2% |
| Jun-02 | 7.6% | 71.4% |
| Jul-02 | 7.6% | 71.5% |
| Aug-02 | 7.4% | 71.8% |
| Sep-02 | 7.5% | 71.8% |
| Oct-02 | 7.6% | 71.7% |
| Nov-02 | 7.4% | 71.9% |
| Dec-02 | 7.5% | 72.0% |
| Jan-03 | 7.5% | 72.1% |
| Feb-03 | 7.5% | 72.2% |
| Mar-03 | 7.4% | 72.2% |
| Apr-03 | 7.6% | 72.0% |
| May-03 | 7.8% | 71.9% |
| Jun-03 | 7.6% | 72.0% |
| Jul-03 | 7.7% | 72.1% |
| Aug-03 | 7.8% | 72.1% |
| Sep-03 | 7.8% | 72.1% |
| Oct-03 | 7.6% | 72.2% |
| Nov-03 | 7.4% | 72.4% |
| Dec-03 | 7.3% | 72.5% |
| Jan-04 | 7.3% | 72.4% |
| Feb-04 | 7.3% | 72.4% |
| Mar-04 | 7.3% | 72.4% |
| Apr-04 | 7.2% | 72.5% |
| May-04 | 7.1% | 72.6% |
| Jun-04 | 7.2% | 72.6% |
| Jul-04 | 7.1% | 72.5% |
| Aug-04 | 7.0% | 72.4% |
| Sep-04 | 6.9% | 72.5% |
| Oct-04 | 7.1% | 72.5% |
| Nov-04 | 7.2% | 72.5% |
| Dec-04 | 7.1% | 72.5% |
| Jan-05 | 7.0% | 72.5% |
| Feb-05 | 7.0% | 72.5% |
| Mar-05 | 6.9% | 72.4% |
| Apr-05 | 6.7% | 72.4% |
| May-05 | 7.0% | 72.3% |
| Jun-05 | 6.8% | 72.3% |
| Jul-05 | 6.7% | 72.4% |
| Aug-05 | 6.7% | 72.5% |
| Sep-05 | 6.7% | 72.4% |
| Oct-05 | 6.7% | 72.5% |
| Nov-05 | 6.4% | 72.6% |
| Dec-05 | 6.6% | 72.5% |
| Jan-06 | 6.6% | 72.4% |
| Feb-06 | 6.4% | 72.5% |
| Mar-06 | 6.4% | 72.6% |
| Apr-06 | 6.3% | 72.7% |
| May-06 | 6.1% | 73.0% |
| Jun-06 | 6.1% | 72.8% |
| Jul-06 | 6.4% | 72.9% |
| Aug-06 | 6.4% | 72.7% |
| Sep-06 | 6.4% | 72.7% |
| Oct-06 | 6.2% | 72.7% |
| Nov-06 | 6.4% | 72.7% |
| Dec-06 | 6.2% | 73.0% |
| Jan-07 | 6.3% | 73.1% |
| Feb-07 | 6.2% | 73.1% |
| Mar-07 | 6.2% | 73.3% |
| Apr-07 | 6.2% | 73.1% |
| May-07 | 6.0% | 73.2% |
| Jun-07 | 6.1% | 73.3% |
| Jul-07 | 6.0% | 73.4% |
| Aug-07 | 5.9% | 73.4% |
| Sep-07 | 5.9% | 73.4% |
| Oct-07 | 5.9% | 73.5% |
| Nov-07 | 6.1% | 73.5% |
| Dec-07 | 6.1% | 73.5% |
| Jan-08 | 5.9% | 73.6% |
| Feb-08 | 6.0% | 73.6% |
| Mar-08 | 6.2% | 73.5% |
| Apr-08 | 6.1% | 73.5% |
| May-08 | 6.1% | 73.4% |
| Jun-08 | 6.1% | 73.3% |
| Jul-08 | 6.1% | 73.1% |
| Aug-08 | 6.1% | 73.2% |
| Sep-08 | 6.1% | 73.3% |
| Oct-08 | 6.2% | 73.4% |
| Nov-08 | 6.6% | 73.1% |
| Dec-08 | 6.9% | 72.9% |
| Jan-09 | 7.4% | 72.2% |
| Feb-09 | 8.0% | 71.9% |
| Mar-09 | 8.2% | 71.7% |
| Apr-09 | 8.3% | 71.4% |
| May-09 | 8.7% | 71.2% |
| Jun-09 | 8.7% | 71.0% |
| Jul-09 | 8.7% | 71.0% |
| Aug-09 | 8.6% | 70.9% |
| Sep-09 | 8.4% | 70.9% |
| Oct-09 | 8.5% | 70.8% |
| Nov-09 | 8.5% | 71.2% |
| Dec-09 | 8.5% | 71.0% |
| Jan-10 | 8.3% | 71.1% |
| Feb-10 | 8.3% | 71.2% |
| Mar-10 | 8.3% | 71.1% |
| Apr-10 | 8.2% | 71.3% |
| May-10 | 8.1% | 71.4% |
| Jun-10 | 8.0% | 71.5% |
| Jul-10 | 8.0% | 71.5% |
| Aug-10 | 8.1% | 71.4% |
| Sep-10 | 8.2% | 71.2% |
| Oct-10 | 8.0% | 71.3% |
| Nov-10 | 7.7% | 71.4% |
| Dec-10 | 7.7% | 71.6% |
| Jan-11 | 7.8% | 71.8% |
| Feb-11 | 7.7% | 71.8% |
| Mar-11 | 7.7% | 71.7% |
| Apr-11 | 7.7% | 71.7% |
| May-11 | 7.6% | 71.6% |
| Jun-11 | 7.6% | 71.7% |
| Jul-11 | 7.3% | 71.8% |
| Aug-11 | 7.3% | 71.9% |
| Sep-11 | 7.4% | 71.9% |
| Oct-11 | 7.4% | 71.7% |
| Nov-11 | 7.6% | 71.6% |
| Dec-11 | 7.5% | 71.7% |
| Jan-12 | 7.7% | 71.6% |
| Feb-12 | 7.5% | 71.5% |
| Mar-12 | 7.3% | 71.7% |
| Apr-12 | 7.3% | 72.0% |
| May-12 | 7.4% | 71.9% |
| Jun-12 | 7.2% | 71.9% |
| Jul-12 | 7.3% | 71.8% |
| Aug-12 | 7.3% | 72.0% |
| Sep-12 | 7.3% | 72.2% |
| Oct-12 | 7.5% | 72.1% |
| Nov-12 | 7.4% | 72.1% |
| Dec-12 | 7.3% | 72.3% |
| Jan-13 | 7.1% | 72.3% |
| Feb-13 | 7.1% | 72.4% |
| Mar-13 | 7.3% | 72.2% |
| Apr-13 | 7.2% | 72.2% |
| May-13 | 7.0% | 72.4% |
| Jun-13 | 7.2% | 72.3% |
| Jul-13 | 7.1% | 72.2% |
| Aug-13 | 7.1% | 72.3% |
| Sep-13 | 7.1% | 72.2% |
| Oct-13 | 7.1% | 72.2% |
| Nov-13 | 7.0% | 72.2% |
| Dec-13 | 7.3% | 72.1% |
| Jan-14 | 7.1% | 72.1% |
| Feb-14 | 7.1% | 72.1% |
| Mar-14 | 7.0% | 72.1% |
| Apr-14 | 7.1% | 72.0% |
| May-14 | 7.1% | 71.9% |
| Jun-14 | 7.1% | 71.9% |
| Jul-14 | 7.1% | 72.1% |
| Aug-14 | 7.0% | 71.9% |
| Sep-14 | 6.9% | 72.2% |
| Oct-14 | 6.7% | 72.3% |
| Nov-14 | 6.7% | 72.4% |
| Dec-14 | 6.7% | 72.3% |
| Jan-15 | 6.7% | 72.3% |
| Feb-15 | 6.8% | 72.4% |
| Mar-15 | 6.9% | 72.4% |
| Apr-15 | 6.9% | 72.3% |
| May-15 | 6.9% | 72.4% |
| Jun-15 | 6.9% | 72.4% |
| Jul-15 | 6.9% | 72.5% |
| Aug-15 | 7.0% | 72.5% |
| Sep-15 | 7.1% | 72.4% |
| Oct-15 | 6.9% | 72.3% |
| Nov-15 | 7.1% | 72.2% |
| Dec-15 | 7.2% | 72.3% |
| Jan-16 | 7.2% | 72.3% |
| Feb-16 | 7.3% | 72.2% |
| Mar-16 | 7.1% | 72.3% |
| Apr-16 | 7.2% | 72.4% |
| May-16 | 7.0% | 72.3% |
| Jun-16 | 6.9% | 72.2% |
| Jul-16 | 7.0% | 72.1% |
| Aug-16 | 7.0% | 72.2% |
| Sep-16 | 7.0% | 72.4% |
| Oct-16 | 7.0% | 72.6% |
| Nov-16 | 6.9% | 72.5% |
| Dec-16 | 7.0% | 72.6% |
| Jan-17 | 6.8% | 73.0% |
| Feb-17 | 6.6% | 73.0% |
| Mar-17 | 6.7% | 73.0% |
| Apr-17 | 6.5% | 73.0% |
| May-17 | 6.6% | 73.1% |
| Jun-17 | 6.5% | 73.1% |
| Jul-17 | 6.3% | 73.2% |
| Aug-17 | 6.2% | 73.2% |
| Sep-17 | 6.2% | 73.1% |
| Oct-17 | 6.3% | 73.3% |
| Nov-17 | 6.0% | 73.5% |
| Dec-17 | 5.9% | 73.7% |
| Jan-18 | 6.0% | 73.3% |
| Feb-18 | 5.9% | 73.4% |
| Mar-18 | 5.9% | 73.6% |
| Apr-18 | 5.9% | 73.4% |
| May-18 | 6.0% | 73.3% |
| Jun-18 | 6.1% | 73.4% |
| Jul-18 | 5.8% | 73.6% |
| Aug-18 | 6.0% | 73.5% |
| Sep-18 | 5.9% | 73.6% |
| Oct-18 | 5.9% | 73.6% |
| Nov-18 | 5.7% | 73.9% |
| Dec-18 | 5.8% | 73.8% |
| Jan-19 | 5.9% | 73.9% |
| Feb-19 | 5.9% | 74.0% |
| Mar-19 | 5.8% | 73.9% |
| Apr-19 | 5.8% | 74.2% |
| May-19 | 5.4% | 74.3% |
| Jun-19 | 5.6% | 74.2% |
| Jul-19 | 5.8% | 74.1% |
| Aug-19 | 5.8% | 74.2% |
| Sep-19 | 5.6% | 74.3% |
| Oct-19 | 5.6% | 74.2% |
| Nov-19 | 5.9% | 74.0% |
| Dec-19 | 5.7% | 74.2% |
| Jan-20 | 5.6% | 74.3% |
| Feb-20 | 5.7% | 74.4% |
Source: Statistics Canada, Labour Force Survey.
Labour shortages were present in key occupations across industries
- Nurses, general practitioners, specialist physicians
- Computer programmers, engineers, mathematicians and data specialists
- Welders, industrial mechanics, heavy-duty equipment mechanics, industrial butchers
Occupations showing signs of labour shortages, 2019 to 2028
Source: ESDC 2019 COPS projections.
But underrepresented groups were experiencing challenges in the labour market
Women, youth, older Canadians, Indigenous peoples, recent immigrants, visible minorities, persons with disabilities, and those with lower levels of education were less likely to be working and more likely to be unemployed than the Canadian average in 2019.
Declining labour force participation was a growing concern as the population ages
| Date | Participation rate | Projected Participation rate |
|---|---|---|
| 1976 | 61.5% | N/A |
| 1977 | 61.9% | N/A |
| 1978 | 62.7% | N/A |
| 1979 | 63.7% | N/A |
| 1980 | 64.3% | N/A |
| 1981 | 65.0% | N/A |
| 1982 | 64.4% | N/A |
| 1983 | 64.7% | N/A |
| 1984 | 65.0% | N/A |
| 1985 | 65.7% | N/A |
| 1986 | 66.1% | N/A |
| 1987 | 66.5% | N/A |
| 1988 | 66.8% | N/A |
| 1989 | 67.3% | N/A |
| 1990 | 67.1% | N/A |
| 1991 | 66.6% | N/A |
| 1992 | 65.7% | N/A |
| 1993 | 65.3% | N/A |
| 1994 | 65.2% | N/A |
| 1995 | 64.8% | N/A |
| 1996 | 64.7% | N/A |
| 1997 | 64.9% | N/A |
| 1998 | 65.1% | N/A |
| 1999 | 65.5% | N/A |
| 2000 | 65.8% | N/A |
| 2001 | 65.9% | N/A |
| 2002 | 66.9% | N/A |
| 2003 | 67.6% | N/A |
| 2004 | 67.5% | N/A |
| 2005 | 67.1% | N/A |
| 2006 | 66.9% | N/A |
| 2007 | 67.2% | N/A |
| 2008 | 67.4% | N/A |
| 2009 | 66.9% | N/A |
| 2010 | 66.7% | N/A |
| 2011 | 66.6% | N/A |
| 2012 | 66.4% | N/A |
| 2013 | 66.3% | N/A |
| 2014 | 65.9% | N/A |
| 2015 | 65.8% | N/A |
| 2016 | 65.6% | N/A |
| 2017 | 65.6% | N/A |
| 2018 | 65.3% | N/A |
| 2019 | 65.6% | N/A |
| 2020 | 64.1% | N/A |
| 2021 | N/A | 65.4% |
| 2022 | N/A | 65.2% |
| 2023 | N/A | 65.1% |
| 2024 | N/A | 64.9% |
| 2025 | N/A | 64.7% |
| 2026 | N/A | 64.5% |
| 2027 | N/A | 64.4% |
| 2028 | N/A | 64.2% |
| 2029 | N/A | 64.0% |
| 2030 | N/A | 63.9% |
| 2031 | N/A | 63.7% |
| 2032 | N/A | 63.6% |
| 2033 | N/A | 63.5% |
| 2034 | N/A | 63.4% |
| 2035 | N/A | 63.3% |
| 2036 | N/A | 63.2% |
Source: Statistics Canada, Labour Force Survey; Laurent Martel. 2019. The labour force in Canada and its regions: projections to 2036. Statistics Canada.
2. COVID-19 shocked the economy but recovery is well underway with employment back to pre-pandemic level; yet challenges remain for some industries and key groups
The number of Canadians working fewer than half their usual hours remains elevated
| Workers impacted by COVID-19 | Working less than half their usual hours |
|---|---|
| Feb-20 | 0 |
| Mar-20 | 2,202,000 |
| Apr-20 | 2,484,000 |
| May-20 | 2,170,000 |
| Jun-20 | 1,340,000 |
| Jul-20 | 944,000 |
| Aug-20 | 684,000 |
| Sep-20 | 574,000 |
| Oct-20 | 428,000 |
| Nov-20 | 444,000 |
| Dec-20 | 485,000 |
| Jan-21 | 529,000 |
| Feb-21 | 406,000 |
| Mar-21 | 247,000 |
| Apr-21 | 534,000 |
| May-21 | 617,000 |
| Jun-21 | 341,000 |
| Jul-21 | 225,000 |
| Aug-21 | 243,000 |
| Sep-21 | 218,000 |
Note: Data are seasonally adjusted;
Source: Statistics Canada, Labour Force Survey.
Employment has not fully recovered in some hard-hit industries
| Industry | Employment change |
|---|---|
| Construction | -5% |
| Manufacturing | -1% |
| Wholesale and retail trade | -1% |
| Transportation and warehousing | -3% |
| Finance and insurance | 6% |
| Professional and scientific services | 12% |
| Educational services | 7% |
| Health care and social assistance | 2% |
| Information, culture and recreation | -1% |
| Accommodation and food services | -15% |
Note: Data are seasonally adjusted.
Source: Statistics Canada, Labour Force Survey.
Groups facing barriers are struggling to find work
| Demographic group | September 2019 | September 2021 |
|---|---|---|
| Canada | 5.1% | 6.3% |
| Women | 5.2% | 6.2% |
| Indigenous peoples off-reserve | 10.2% | 10.6% |
| Visible minorities (15 to 69)** | N/A | 7.8% |
| Recent immigrants (≤10 years) (15 to 54) | 8.3% | 9.4% |
| Youth (15 to 24, includes students) | 11.4% | 11.4% |
| Lower educational attainment (25 to 64)*** | 5.6% | 7.9% |
Notes: *Age group is 15 to 64 unless otherwise stated.
** 2019 unemployment rate not available.
*** Lower-educated individuals are those without a post-secondary credential.
Source: Statistics Canada, Labour Force Survey.
3. Economic forecasts are promising; as the economy gains momentum, labour market pressures are re-emerging and the demand for workers is rising
Forecasts for continued economic growth are promising; employers intend to hire
| Quarter | Hiring | Lay-off |
|---|---|---|
| 2020Q1 | 42.0% | 14.0% |
| 2020Q2 | 40.0% | 18.0% |
| 2020Q3 | 39.0% | 13.0% |
| 2020Q4 | 54.0% | 11.0% |
| 2021Q1 | 51.0% | 6.0% |
| 2021Q2 | 68.0% | 3.0% |
| 2021Q3 | 71.0% | 4.0% |
Note: Expectations relative to the past 12 months.
Sources: Bank of Canada, Business Outlook Survey, Autumn 2021.
Record number of job vacancies as economy reopens; matching jobs with workers takes time
| Quarter | Number of job vacancies |
|---|---|
| 2016Q2 | 391,200 |
| 2017Q2 | 459,700 |
| 2018Q2 | 546,800 |
| 2019Q2 | 581,600 |
| 2021Q2 | 731,900 |
Note: Data for 2020Q2 are unavailable; data are unadjusted for seasonality.
Source: Statistics Canada, Job Vacancy and Wage Survey.
Vacancies in key and newly re-opened industries could impede economic growth
| Industry | Number of vacancies, July 2021 |
|---|---|
| Accommodation and food services | 132,800 |
| Retail trade | 101,300 |
| Health care and social assistance | 97,800 |
| Manufacturing | 79,600 |
| Construction | 68,500 |
| Administrative support and waste management | 55,600 |
| Professional and scientific services | 51,200 |
Note: Unadjusted for seasonality.
Source: Statistics Canada, Job Vacancy and Wage Survey.
4. An aging population will likely mean more labour shortages; Canada needs a workforce with the right skills to build a stronger and more inclusive economy
Canada’s population is aging increasing the chances of more labour shortages; skilled immigration intake and new graduates will help as will boosting participation of underrepresented groups
The percentage of Canadians aged 65 years and older is expected to increase from 18% in 2020 to 24% by the end of the 2030s.
Note: End of the 2030s (2037, 2038, 2039, 2040).
Source: Statistics Canada, Annual Demographic Estimates; Population Projections for Canada.
| Labour force flows | 2019 to 2028 |
|---|---|
| Major outflows total | -4,800,000 |
| Deaths and Emigrants | -958,000 |
| Retirements | -3,900,000 |
| Major inflows total | 6,800,000 |
| New immigrants | 1,900,000 |
| School leavers | 4,900,000 |
Sources: Statistics Canada; ESDC estimates (historical); ESDC 2019 Canadian Occupational Projection System (COPS) Projections.
| Demographic group | Participation rate (percentage) | Participation rate gap (percentage point) | Potential additional workers if the participation rate gap were closed |
|---|---|---|---|
| Women aged 15 years and above | 61.3% | 8.8 p.p | 1,400,000 |
| Men aged 15 years and above | 70.1% | N/A | N/A |
| Canadian older workers aged 55 years and above | 37.9% | 3.1 p.p | 363,000 |
| Japanese older workers aged 55 years and above | 41.0% | N/A | N/A |
| Persons with disabilities with the potential to work aged 25 to 64 years | 64.7% | 20.1 p.p | 445,000 |
| Persons without disabilities aged 25 to 64 years | 84.8% | N/A | N/A |
| Immigrants aged 15 years and above | 64.5% | 1.5 p.p | 116,000 |
| Canadian born aged 15 years and above | 66.0% | N/A | N/A |
| Indigenous people aged 15 yeas and above on and off reserve | 61.4% | 4.0 p.p | 48,000 |
| Non-Indigenous people aged 15 years and above | 65.4% | N/A | N/A |
Notes: *Persons with or without disabilities (2017); Indigenous and non-Indigenous peoples (2016).
** Japan has the highest participation rate of workers aged 55+ in the G7.
*** These numbers cannot be summed as they are not mutually exclusive.
Sources: Statistics Canada, Census 2016; Labour Force Survey; Canadian Survey on Disability; Organization for Economic Cooperation and Development (OECD).
Digitization rising; consumer habits shift automation will disrupt some jobs; particular groups will be more affected
| Type of retail sales, indexed to February 2020 | E-Commerce Sales | Retail Sales Excluding E-Commerce |
|---|---|---|
| Feb-20 | 100 | 100 |
| Mar-20 | 122.5 | 89.6 |
| Apr-20 | 189.8 | 67.3 |
| May-20 | 202.1 | 83.1 |
| Jun-20 | 174.2 | 101.8 |
| Jul-20 | 164.1 | 101.9 |
| Aug-20 | 166.9 | 101.5 |
| Sep-20 | 168.5 | 104.0 |
| Oct-20 | 165.1 | 105.2 |
| Nov-20 | 162.9 | 107.0 |
| Dec-20 | 166.7 | 101.0 |
| Jan-21 | 198.4 | 101.2 |
| Feb-21 | 196.2 | 106.5 |
| Mar-21 | 201.0 | 111.9 |
| Apr-21 | 201.1 | 105.7 |
| May-21 | 205.8 | 103.6 |
| Jun-21 | 196.4 | 108.0 |
| Jul-21 | 158.1 | 107.3 |
Note: Data are seasonally adjusted.
Source: Statistics Canada, Monthly Wholesale and Retail Trade Surveys.
| Workers at risk | Risk |
|---|---|
| Workers with less than high school education | 33% |
| Workers with a Bachelor's degree | 4% |
Note: *Some/all of occupations’ core tasks likely to be performed by computer within 10 years.
Source: Frenette and Frank, 2020. Statistics Canada.
The COVID-19 crisis could accelerate key changing nature of work trends, such as automation, digitization, non-standard work relationships, greening of the economy and globalization. Building a workforce with the right skills for the labour market of the future will be integral to enabling strong growth and an inclusive economy.