
Nunavut Inuit Labour Force Analysis report: Executive summary
Official title: Nunavut Inuit Labour Force Analysis Report. Executive Summary, August 2018
On this page
- 1.0 Introduction
- 2.0 Key findings: demographics and the economy
- 3.0 Key findings: government positions, vacancies and Inuit representation
- 4.0 Key findings: Inuit availability for government employment
- 5.0 Key findings: interest in government employment
- 6.0 Key findings: preparedness among Inuit in Nunavut
- 7.0 Key findings: building preparedness through training
- 8.0 Key findings: Inuit language and culture in the context of government employment
- 9.0 Key findings: profiles of government employees
- 10.0 Key findings: Nunavummiut suggestions and best practices for Inuit government employment
- 11.0 Conclusions: putting Nunavut Inuit Labour Force Analysis findings together to inform Inuit employment plans and pre-employment training
- 12.0 Next steps: Nunavut Inuit Labour Force Analysis
- A1 Annex: Glossary of key terms
Alternate formats

Nunavut Inuit Labour Force Analysis report: Executive summary [PDF - 857 KB]
Large print, braille, MP3 (audio), e-text and DAISY formats are available on demand by ordering online or calling 1 800 O-Canada (1-800-622-6232). If you use a teletypewriter (TTY), call 1-800-926-9105.
1.0 Introduction
1.1 Context
The Nunavut Inuit Labour Force Analysis report provides a "detailed analysis of the labour force of the Nunavut Settlement Area to determine the availability, interest and the level of preparedness of Inuit for government employment" in accordance with Article 23.3.1 of the Nunavut Agreement. According to Article 23.3.2, the purpose of the analysis is "to assess the existing skill level and degree of formal qualification among the Inuit labour force and to assist in formulating Inuit employment plans and pre-employment training." Article 23 reflects the aspirational objective of increasing Inuit participation in government to a representative level.
To obtain a copy of the complete 2018 Nunavut Inuit Labour Force Analysis report, please contact ESDC.NILFA-APAIN.EDSC@HRSDC-RHDCC.GC.CA.
1.2 Outline
This report, similar to the 2014 Nunavut Inuit Labour Force Analysis, is structured around the three areas identified in the Nunavut Agreement—the interest, availability, and level of preparedness of Nunavut Inuit for government employment. This report also includes an analysis of government positions, training, Inuit language and culture in the context of government employment, and Nunavummiut suggestions and best practices for improving Inuit representation in government.
1.3 Sources
This report has drawn upon an analysis of a variety of survey and administrative data sources. Some of the most frequently used sources include:
Nunavut-specific data sources
- 2015 Public Opinion Research Survey
- 2016 Nunavut Government Employee Survey
- 2017 focus groups and key informant interviews
Examples of other primary data sources used
- Aboriginal Peoples Survey
- 2012 Programme for the International Assessment of Adult Competencies - Survey of Adult Skills
- Internal administrative data
- Census 2016
The Nunavut-specific data sources were recently developed for Nunavut Inuit and through collaboration between the Government of Canada, the Government of Nunavut, and Nunavut Tunngavik Inc.
This report is a companion to other documents prepared by Employment and Social Development Canada, such as the Community Profiles and Stakeholder Engagement Report.
1.4 Acknowledgements
The new surveys and the content of this report have greatly benefited from the participation of Nunavut Tunngavik Inc and the Government of Nunavut. The authors of this report would like to acknowledge their active participation, as well as the time and effort that Nunavummiut dedicated to responding to our survey questions and participating in focus groups and key informant interviews.
As well, we would like to acknowledge the support of Pilimmaksaivik, Statistics Canada, Indigenous Services Canada and Crown-Indigenous Relations and Northern Affairs in the development of this report.
2.0 Key findings: demographics and the economy
Nunavut has the youngest, fastest growing population in Canada
- Based on 2016 Census data, Inuit accounted for 85% of Nunavut’s population (30,135 out of 35,580) (Figure 1).

Source: Census 2016
Text description of Figure 1
| Inuit identity | Population | Proportion of population |
|---|---|---|
| Inuit | 30,135 | 85% |
| Non-Inuit | 5,445 | 15% |
| Total | 35,580 | 100% |
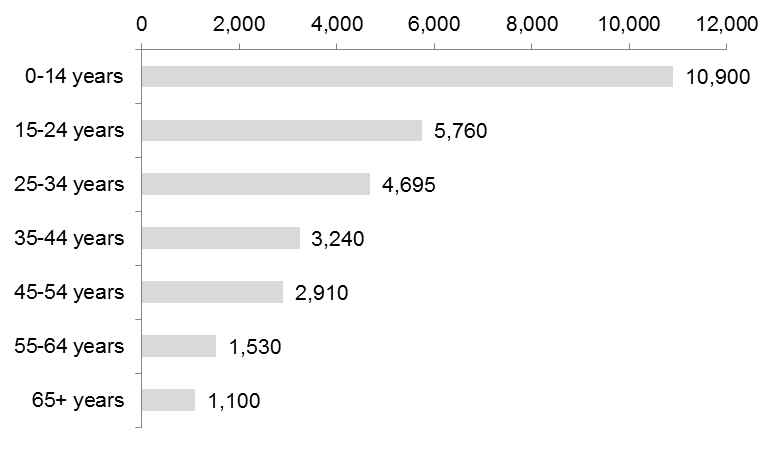
- The Inuit population is relatively young – approximately half of Inuit in Nunavut were under the age of 25. In particular, one-third of Inuit in Nunavut were under the age of 15 (Figure 2).
Source: Census 2016
Text description of Figure 2
| Age group | Population |
|---|---|
| 0-14 years | 10,900 |
| 15-24 years | 5,760 |
| 25-34 years | 4,695 |
| 35-44 years | 3,240 |
| 45-54 years | 2,910 |
| 55-64 years | 1,530 |
| 65+ years | 1,100 |
| Total | 30,135 |
- Steady population growth is projected to continue over the next two decades: by 2036 the total population of Nunavut is projected to grow to 44,000 individuals, with Inuit making up 86% (38,000 Inuit) of the population.
The Nunavut economy is a mix of wage-based and land-based activities linked to Inuit culture
- The vast majority of working age Inuit (90%) were engaged in one or more traditional activities in 2012.
- More than two-thirds (68%) of Inuit (ages 15+) partook in hunting, fishing, and/or trapping, and almost half (45%) gathered wild plants.
The public sector is the largest employer in Nunavut
- In 2016, 44% of employed Inuit were in the public sector (3,835 Inuit).
- Anticipated growth in the public sector is projected to be driven primarily by increased employment in health and education, as well as hiring individuals who speak Inuktitut (e.g. translators).
- Among the occupations with greatest projected demand in Nunavut, positions that are most likely to fall within the public sector include: education, health care, administrative and office work and scientific positions.
Strong growth is projected in the Nunavut economy, with a large amount of expansion anticipated in the resource-extraction industry
- The Nunavut public sector will face competition for top talent over the next few years as many other industries are forecast to grow (e.g., mining, construction).
- Mining production levels in the territory are expected to double what they were in 2016 by 2020. Although the mining industry is projected to have strong growth over the next few years, the industry can experience very sharp cycles caused by fluctuations in global demand for minerals and resources.
3.0 Key findings: government positions, vacancies and Inuit representation
Inuit make up approximately half of federal and territorial government employees in Nunavut
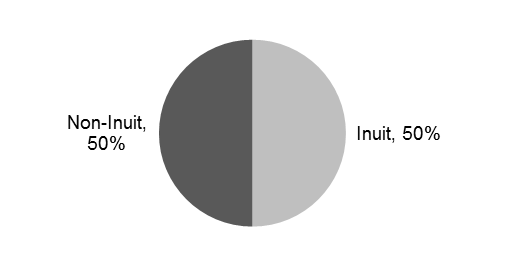
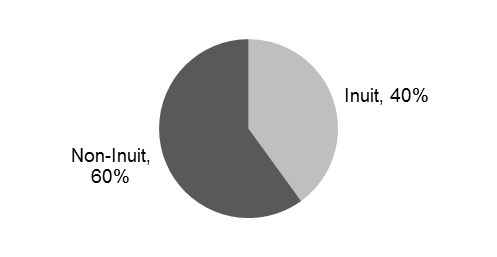
- Inuit account for 50% of Government of Nunavut employees (Figure 3) and 40% of Government of Canada employees in Nunavut (Figure 4). As well, 85% of municipal government employees in Nunavut are Inuit.
Source: Towards a Representative Public Service Report, Government of Nunavut, March 2017
Text description of Figure 3
| Inuit identity | Proportion of Government of Nunavut employees who are Inuit and non-Inuit |
|---|---|
| Inuit | 50% |
| non-Inuit | 50% |
Source: January 2017 Government of Canada Internal human resource data, based on data provided in Pilimmaksaivik’s Whole of Government Inuit Employment Plan
Text description of Figure 4
| Inuit identity | Proportion of Government of Canada employees who are Inuit and non-Inuit |
|---|---|
| Inuit | 40% |
| non-Inuit | 60% |
- Across the Government of Canada and Government of Nunavut, Inuit representation is highest in administrative positions but tends to be lower in management and supervisory positions as well as scientific/professional positions. In municipal government, Inuit representation is highest among positions that usually require high school, workplace training or a college while representation tends to be lower among management occupations and those requiring university.
There are jobs available across levels of government and occupations
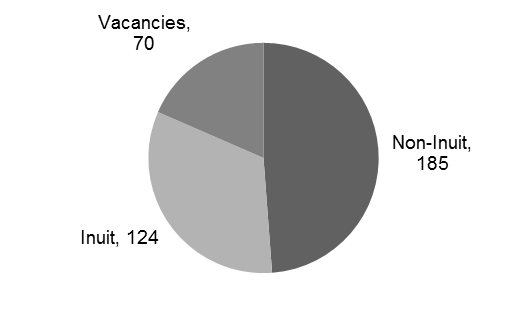
- In 2017, there were 70 Government of Canada vacancies (18% of the 379 positions) (Figure 5) and 1,285 Government of Nunavut vacancies (27%) (Figure 6)Footnote 1. Inuit employees compose 33% of all filled and vacant positions in the Government of Canada and 37% of all filled and vacant positions in the Government of Nunavut.
Source: January 2017 Government of Canada Internal human resource data, based on data provided in Pilimmaksaivik’s Whole of Government Inuit Employment Plan
Text description of Figure 5
| Government of Canada | Number of positions |
|---|---|
| Inuit | 124 |
| Non-Inuit | 185 |
| Vacancies | 70 |
| Total | 379 |
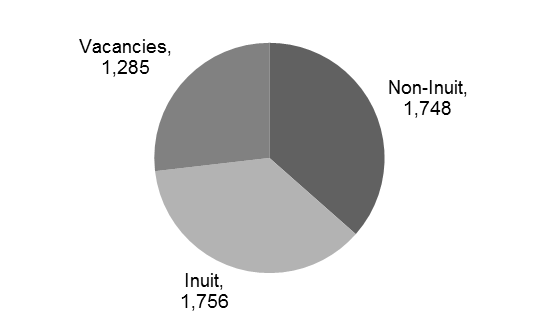
Source: Towards a Representative Public Service Report, Government of Nunavut, March 2017
Text description of Figure 6
| Government of Nunavut | Number of positions |
|---|---|
| Inuit | 1,756 |
| Non-Inuit | 1,748 |
| Vacancies | 1,285 |
| Total | 4,789 |
- In the Government of Canada, almost half of vacancies were for administrative (25 vacancies) or administrative support positions (6) while one-fifth of vacancies were for scientific positions (15).
- In the Government of Nunavut, approximately one-third of vacancies (35% of vacancies; 454) were classified as professional and the second largest proportion of vacancies was administrative support occupations at (28% of vacancies; 358)Footnote 2.
- Scientific positions (i.e., biologists, and other related scientists) as well as health care positions (i.e., registered nurses) were identified as having high demand in the near future.
Post-secondary education is in demand for a large share of vacant positions
- Of the 70 Government of Canada vacancies, 41% of the Government of Canada vacancies required some form of post-secondary education as a minimum requirement. An additional 12% of vacancies require less than high school or did not have educational requirements while 43% required high school or an approved alternative.
- In the Government of Nunavut, over half of vacant positions (54%) usually required university while one quarter (26%) usually required college or apprenticeship training. An additional, 17% of vacancies usually required high school or occupation-specific training while 3% usually require on-the-job training.
Casual and relief workers offer a pool of potential employees who may be interested in permanent work, provided they have the supports and access to training needed to transition
- 2016 Nunavut Government Employee Survey findings show that almost all Inuit non-permanent employees (1,200 or 92%) indicated their interest in permanent work by either applying for a permanent job in the past, or by stating their interest in obtaining an indeterminate position in the future.
- Of those interested in indeterminate positions, over half (51%) said they had little or no knowledge of the interview process, approximately 60% were unfamiliar with the hiring process, and almost half (49%) had little or no knowledge of cover letter or résumé development.
Further formal education/training may help interested Inuit employees prepare for government jobs
- Hiring managers identified the lack of education/equivalencies and work experience among applicants as the most common difficulties for filling vacant positions.
- Post-secondary education is required for a large number of vacant public sector positions.
4.0 Key findings: Inuit availability for government employment
Among Inuit in Nunavut, the number of labour force participants increased between 2001 and 2016
- Between 2001 and 2016, the number of Inuit labour force participants increased (from 8,150 to 12,020) (Figure 7).
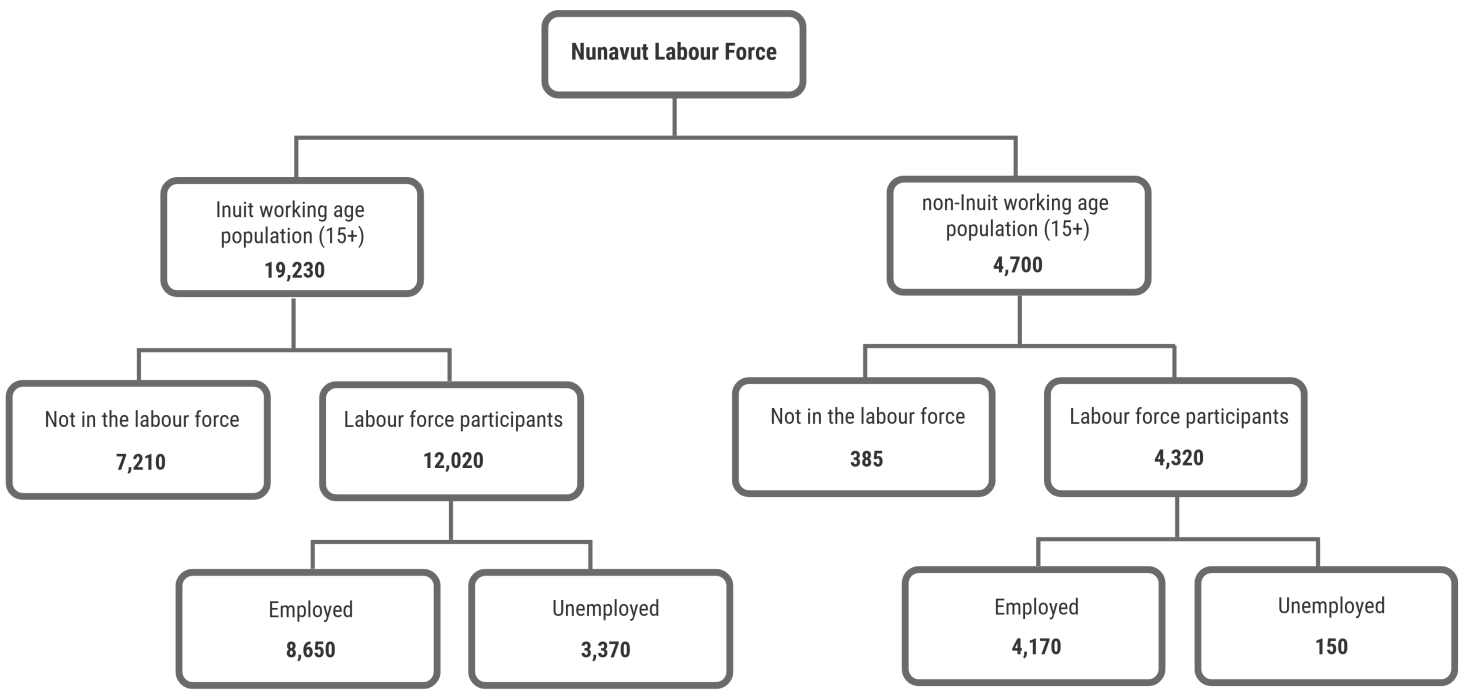
Source: Census 2016
Text description of Figure 7
| Nunavut Labour Force | Population |
|---|---|
| Inuit working age population (15+) | 19,230 |
| Labour force participants | 12,020 |
| Employed | 8,650 |
| Unemployed | 3,370 |
| Not in the labour force | 7,210 |
| Non-Inuit working age population (15+) | 4,700 |
| Labour force participants | 4,320 |
| Employed | 4,170 |
| Unemployed | 150 |
| Not in the labour force | 385 |
- In 2016, over half of Inuit in Nunavut (63%) were labour force participants, of which 8,650 were employed and 3,370 were unemployed. Among the Inuit working age population in Nunavut, 45% were employed while 18% were unemployed and 37% were not in the labour force. Among the non-Inuit working age population in Nunavut, 89% were employed while 3% were unemployed and 8% were not in the labour force.
Unemployed Inuit provide a pool of potential government employees, provided they have the interest in government employment as well as relevant skills and abilities
- The number of Inuit who were unemployed and the Inuit unemployment rate have increased between 2011 and 2016. The number of Inuit who were unemployed increased from 2,295 to 3,370 and the unemployment rate about Inuit increased from 24% to 28%.
- In 2016, about one-third of Inuit looking for work have completed high school (1,190 in total), with the number of unemployed high school graduates being highest in Iqaluit (130), Arviat (130) and Rankin Inlet (120).
- Most unemployed Inuit identified a shortage of jobs (86%) as the most common reason for not finding work, followed by a lack of education/training (56%) or work experience (52%) (2012 Aboriginal Peoples Survey).
Almost two-fifths of Inuit were not in the labour force, however, some of those who are not in the labour force may be interested in obtaining a job
- The number of Inuit not participating in the labour force decreased between 2011 and 2016, from 7,435 to 7,210 Inuit. The proportion of Inuit who were not in the labour force decreased from 43% in 2011 to 37% in 2016.
- Among working age Inuit who were not in the labour force, 29% (2,070 Inuit) attended school in the 2015-2016 year. Approximately half (49% or 1,880) of Inuit aged 15-29 who were not in the labour force were attending school compared to 5% (or 185) of those aged 30 and above who were not in the labour force.
- Based on the Aboriginal Peoples Survey, we know that some Inuit who are not in the labour force were interested in obtaining employment.
Child care, health and historical trauma affect the availability of Inuit for training and employment
- A total of 27% of Inuit employees and 24% of non-Inuit employees identified that ensuring that child care is available was one of the top three solutions for increasing Inuit government employment in Nunavut (2016 Nunavut Government Employee Survey).
- From the Public Opinion Research Survey in 2015, 23% of Inuit non-government employees indicated that they had health problems which would make it impossible to work for the government.
- Historical trauma from residential schools have produced intergenerational impacts on Nunavut Inuit in terms of pursuing traditional activities, education, employment, income, food security, physical and mental health. The collective trauma experienced by Inuit, including colonialism and the residential school experience, are detailed in Truth and Reconciliation Commission of Canada Final Report as and/or the Qikiqtani Truth Commission Final Report: Achieving Saimaqatigiingniq. A full account of these experiences and impacts can be found in these reports.
5.0 Key findings: interest in government employment
Over half of Inuit who are not working in government are interested in working for the Government of Nunavut or Government of Canada, with Inuit women being more likely to apply and to be hired
- As shown in Figure 8, 58% of Inuit respondents to the Public Opinion Research Survey who are not working in government indicated they were interested in working in the Government of Nunavut and 51% were interested in the Government of Canada (Figure 8).
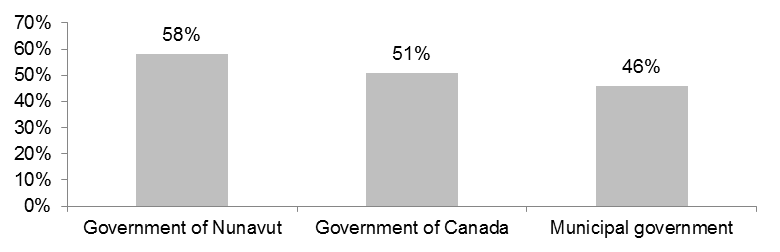
Source: 2015 Public Opinion Research
Note: Interest is calculated based on responses from Inuit who do not currently work in government.
Text description of Figure 8
| Level of government | Proportion of Inuit interested in government work |
|---|---|
| Government of Nunavut | 58% |
| Government of Canada | 51% |
| Municipal government | 46% |
- Inuit were most interested in jobs that involve outdoor work (68%) followed by teaching Inuit cultural activities (60%) and administrative work (51%) (Figure 9). Many Inuit are interested in jobs that involve outdoor work, however, only 5% of Inuit are interested in jobs that only involve outdoor work.
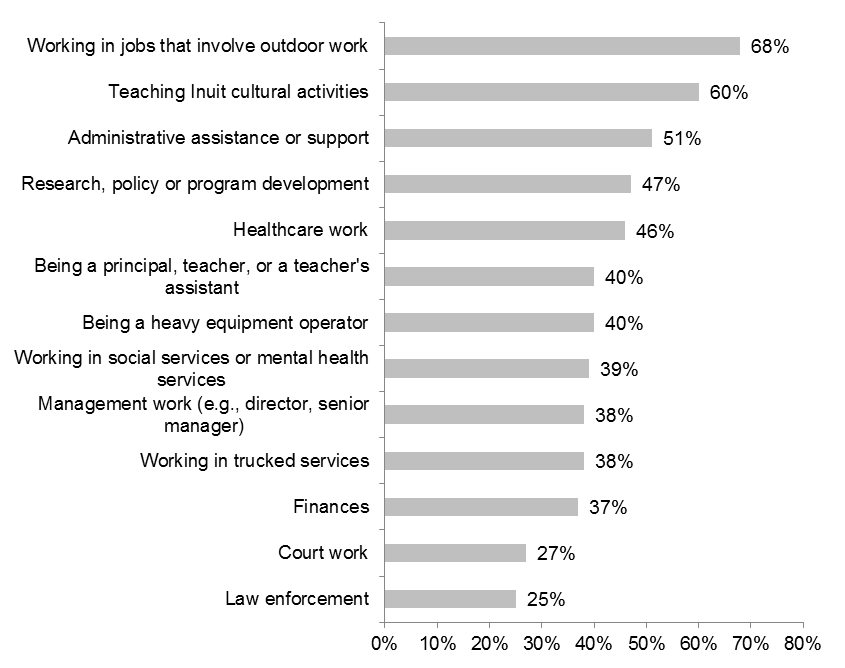
Source: 2015 Public Opinion Research
Note: Interest is calculated based on responses from Inuit who do not currently work in government.
Text description of Figure 9
| Work types | Proportion of Inuit who are interested |
|---|---|
| Working in jobs that involve outdoor work | 68% |
| Teaching Inuit cultural activities | 60% |
| Administrative assistance or support | 51% |
| Research, policy or program development | 47% |
| Healthcare work | 46% |
| Being a heavy equipment operator | 40% |
| Being a principal, teacher, or a teacher's assistant | 40% |
| Working in social services or mental health services | 39% |
| Working in trucked services | 38% |
| Management work (e.g., director, senior manager) | 38% |
| Finances | 37% |
| Court work | 27% |
| Law enforcement | 25% |
- In the Government of Nunavut, on average, there were five Inuit applicants per job competition in 2016-17.
- Of the 2,906 Government of Nunavut applications received from Nunavut Inuit in 2016-2017, 73% were from women and 27% were from men.
- Although female Inuit made up the majority of the Government of Nunavut hires, the proportion of Inuit hired who were men increased between 2015-16 and 2016-17, from 15% to 26%.
- The Government of Canada received 128 applicants to external advertisements from Nunavut Inuit in 2016-2017. The Government of Canada received an average of 3 applications from Nunavut Inuit per advertised position in 2016-2017, which was slightly higher than the average of 1 Nunavut Inuit application per advertised position in 2015-2016.
Inuit interest in government employment can be affected by perceptions of support for Inuit culture, as well as the location of the workplace
- Some Inuit (36% of those not currently working for government) who would not otherwise apply for government work would change their mind if they knew that the workplace was supportive of Inuit culture.
- Many Inuit (25% of those not currently working for government) who would not otherwise apply for government work would change their mind if the workplace was located in their home community.
Although a large majority of Inuit are satisfied with government employment, specific aspects of employment are creating dissatisfaction among employees
- Across the Government of Nunavut and Government of Canada, 92% of Inuit employees reported being satisfied overall with their jobs.
- The top drivers of satisfaction among Inuit government employees included flexibility in work schedules, benefits and relationships with co-workers. Being able to work in the community of choice was also identified by Government of Nunavut employees, while job security and staff housing were identified by Government of Canada employees.
- The availability of childcare, support for career development and advancement, and staff turnover were identified by Government of Canada and Government of Nunavut employees as areas of concern. In the Government of Nunavut, the availability of staff housing and housing allowance were also expressed as areas of concern.
The shortage of quality, adequate, and affordable housing in Nunavut can dampen interest in government employment, especially in cases where relocating for a government job (or training) does not guarantee access to housing
- Nunavut has a shortage of affordable and adequate housing intensified by a fast growing population, remoteness and high material and construction costs, as well as higher deterioration of housing stock due to the northern climate. Stakeholders identified that limited housing can create difficulties for accessing training and education as well as relocating to obtain employment.
- A number of Government of Canada and Government of Nunavut positions offer staff housing to help with recruitment. Many employees – in particular those working for the Government of Canada – are satisfied with the availability of staff housing. Yet, a significant percentage of Government of Nunavut employees are very dissatisfied with the availability of staff housing (37%), which may point to a barrier for building interest in Government of Nunavut employment among Inuit.
- Although the Government of Nunavut housing policy has been designed to allocate housing openly and fairly to eligible employees, the prioritization of housing based on job category has the potential to disproportionately affect Inuit who are more concentrated in administrative job categories.
A larger proportion of Inuit government employees have been promoted in the past 12 months when compared to non-Inuit employees
- Inuit make up 61% of government employees who have received a promotion in the past 12 months.
Interest in permanent employment is high among Inuit who are currently employed in non-permanent government jobs, potentially representing a pool of interested and available Inuit workers
- Of the 1,310 Inuit non-permanent government employees, 1,200 (92%) have indicated their broad interest in permanent government work, either by applying in the past or indicating current interest.
- Of all Inuit non-permanent employees, 720 (55%) applied for a permanent position at some point in the past.
- A total of 590 Inuit non-permanent government employees have never applied to a permanent government job. Of this group, it is estimated that 470e (80%e) are currently interested in a permanent government job in Nunavut.
6.0 Key findings: preparedness among Inuit in Nunavut
Lack of educational and work experience credentials have been highlighted as barriers to entrance and advancement in government among Inuit
- Results from the 2016 Nunavut Government Employee Survey indicate that the majority of employees with hiring responsibilities cited barriers relating to lack of educational requirements (66% or 210 individuals) and work experience credentials (59% or 190 individuals).
- Though many Inuit recognize the need for training, few are engaged in upgrading due to barriers associated with family obligations and lack of local training opportunities. Findings from the 2015 Public Opinion Research Survey report suggest that most of these individuals (90%) would take no-cost education in their communities, with three-quarters willing to complete their education online (75%).
Among government employees, Inuit supervisors were more likely to have higher levels of education compared to their non-supervisor counterparts
- In fact, 90% of supervisors completed high school or post-secondary compared to 79% of non-supervisors.
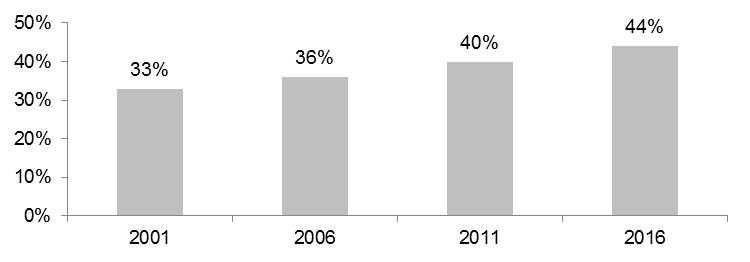
- These completion rates are higher than what is observed among all Nunavut Inuit aged 20 and above (Figure 10). In 2016, 44% of Inuit (aged 20 and above) completed high school or above.
- The proportion of Inuit (aged 20 and above) who have completed high school or above has increased from 33% in 2001 to 44% in 2016 (Figure 10).
Source: Census/National Household Survey 2001, 2006, 2011, 2016
Text description of Figure 10
| Year | Proportion of Inuit in Nunavut |
|---|---|
| 2001 | 33% |
| 2006 | 36% |
| 2011 | 40% |
| 2016 | 44% |
Developing skills may increase Inuit preparedness for government employment
- The largest skills gapsFootnote 3 between Inuit employed in government and those outside of government were in the following skills:
- Research and analysis
- Computer skills and information technology
- Typing and writing
- Data entry and file organization
- Managerial skills
Therefore, developing these skills among Inuit who are interested in government employment may increase their preparedness.
- Inuit who worked in government were more likely than those working outside of government and those interested in government employment to report having these skills. Government positions with higher vacancy rates (e.g., administrative support, science-related positions) are likely to use many of these skills.
Building awareness of hiring processes and requirements for current employment opportunities could increase the opportunity for Inuit entry and advancement through government competitions
- A total of 43% of Inuit employees said that they were either somewhat or not aware of how to effectively do an interview, while 36% were either somewhat or not aware of how to navigate the hiring process and 34% were somewhat or not aware of how to write a detailed résumé and cover letter [2016 Nunavut Government Employee Survey]. Recent focus groups with Nunavummiut stakeholders also found that there was support for expanding this type of training.
7.0 Key findings: building preparedness through training
Inuit who are not working for the government face barriers in accessing education and training
- A total of 57% of Inuit not working for the government (but who were interested in government) believed that they would need more training to be able to apply [2015 Public Opinion Research].
- Inuit not working for the government reported the following as the top reasons why they were not engaged in training or education: Family responsibilities (27%) and lack of post-secondary education or training opportunities in the respondent's home community (15%) [2015 Public Opinion Research Survey].
Math and science skills development could increase the preparedness for in-demand positions
- In the Government of Nunavut, 23% of vacancies require science-related degrees and above. However, relatively few Nunavut Inuit have a science degree (10 individuals as of 2016).
Despite high levels of interest in further training, Inuit report that a lack of awareness about these opportunities is a barrier
- Current Inuit government employees have reported that the second most common barrier to training is a lack of knowledge or awareness about course offerings.
Inuit government employees who took training were more likely to do so based on supervisor and colleague support compared to non-Inuit government employees. Overall, Inuit government employees were less likely to have taken training in the past year compared to non-Inuit
- Almost half of Inuit government employees (45%) identified that they had not taken training in the past year compared to approximately one-fifth of non-Inuit government employees (18%).
- Inuit who had taken formal training in the past year were more likely to identify than non-Inuit that they had taken training because of supervisor encouragement, colleague encouragement or because the supervisor required this training to be taken. Non-Inuit were more likely to have taken training out of personal interest, because it helps with their current job, achieving career goals, or it was mandatory for their job.
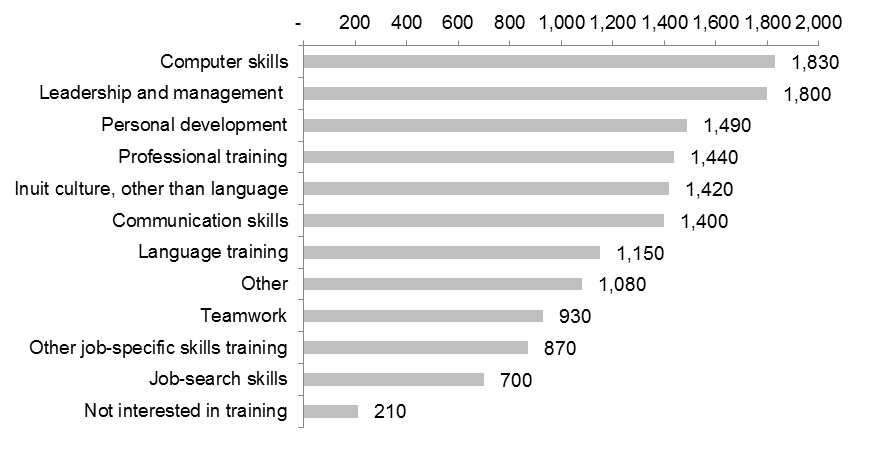
Computer skills and leadership and management training were the types of formal training of interest to the greatest proportion of Inuit government employees
- Types of training that were of greatest interest to Inuit government employees included computer skills (1,830 Inuit government employees were interested) followed by leadership and management (1,800), personal development (1,490) and professional training (1,440) (Figure 11). More than half of Inuit (53%) and non-Inuit (59%) government employees were interested in leadership and management training.
Source: 2016 Nunavut Government Employee Survey
Text description of Figure 11
| Skill type | Number of Inuit government employees interested in this training |
|---|---|
| Computer skills | 1,830 |
| Leadership and management | 1,800 |
| Personal development | 1,490 |
| Professional training | 1,440 |
| Inuit culture, other than language | 1,420 |
| Communication skills | 1,400 |
| Language training | 1,150 |
| Other | 1,080 |
| Teamwork | 930 |
| Other job-specific skills training | 870 |
| Job-search skills | 700 |
| Not interested in training | 210 |
- Despite high levels of interest, comparatively few Inuit had taken these types of training.
- Inuit interested in management and leadership training are more likely to be aged 30 to 39 and high school or college graduates.
Best practices in developing training for Inuit involves constructing holistic and culturally relevant training
- Participants in focus groups and interviews identified the following lessons learned related to training methods and content for building preparedness for government employment:
- Using a diversity of training methods: online, modular, and locally-available options;
- Taking a holistic approach to training with tutors and a strong support network for learners;
- Incorporating culturally-relevant content; and
- Offering training that develops formal skills in addition to personal skills, Inuit values and attitudes.
8.0 Key findings: Inuit language and culture in the context of government employment
Most Inuit government employees feel welcome and use Inuktut at work
Eighty-seven percent of Inuit government employees indicated that they feel welcome and included in their workplace. However, eight percent did not agree with this statement (Table 1).
| ISV and IQ principles | Strongly or somewhat agree | Neither agree nor disagree | Strongly or somewhat disagree |
|---|---|---|---|
| Respect for co-workers, positive working relationships and consideration of others is encouraged (Inuuqatigiitsiarniq) | 81% | 10% | 10% |
| I feel welcome and included (Tunnganarniq) | 87% | 5% | 8% |
| I have the flexibility to be involved in cultural and other activities outside of the workplace during working hours (Pijitsirniq) | 74% | 14% | 12% |
| Decisions are made through teamwork, cooperation, and consensus-based decision-making (Aajiqatgiinniq) | 77% | 11% | 13% |
| I feel supported in developing new job-related skills (Pilimmaksarniq or Pijariuqsarniq) | 74% | 15% | 12% |
| We have a shared understanding of goals and a vision of what we are trying to achieve (Piliriqatgiiniq or Ikajuqtigiiniq) | 78% | 11% | 11% |
| Ideas are welcome and we are encouraged to try new ways of doing things (Qanuqtuurniq) | 83% | 8% | 9% |
| Knowledge of Nunavut’s environment and land is valued (Avatittinnik Kamatsiarniq) | 75% | 15% | 10% |
Source: 2016 Nunavut Government Employee Survey
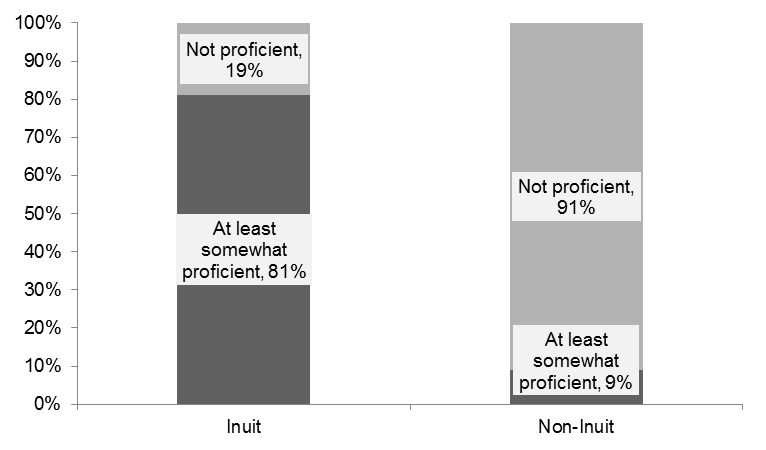
- Four in five Inuit government employees identified that they are at least somewhat proficientFootnote 4 in Inuktitut or Inuinnaqtun (Figure 12). Of these employees, Inuktut is used by 85% at work overall, by only 33% in communicating with their supervisors, and by 83% in communicating with their co-workers.
Source: 2016 Nunavut Government Employee Survey
Text description of Figure 12
| Proficiency in Inuktitut of Inuinnaqtun | Inuit | Non-Inuit |
|---|---|---|
| At least somewhat proficient | 81% | 9% |
| Not proficient | 19% | 91% |
| Total | 100% | 100% |
- In 2016, 86% of Inuit in Nunavut spoke an Inuit language at home either most often or regularly. This is similar to what was observed in 2006 (85%). The proportion who spoke Inuktut as their primary language at home declined from 64% to 60% between 2006 and 2016 [Census 2006 and 2016].
- In 2016, 78% of Inuit in Nunavut used an Inuit language at work either most often or regularly. This is similar to what was reported in 2006 (80%). The proportion who used Inuktut as their primary language at work declined from 41% to 38% between 2006 and 2016 [Census 2006 and 2016].
Workplace Inuit Societal Values (ISV) / Inuit Qaujimajatuqangit (IQ) are connected to Inuit government employees' job satisfaction and retention
- Inuit government employees' perception of workplace ISV/IQ is positively related to their job satisfaction, interest in staying in government, and interest in informal workplace learning.
- Among Inuit government employees who identified that they were considering leaving their current position, one of the most common reasons for seeking alternative employment was wanting to use their knowledge of Inuit society, culture and economy.
- More recent hires were more likely than those with longer job tenure to report that their knowledge of Inuit culture, society and economy was required to obtain their current job.
Being able to use Inuktut at the workplace is important to Inuit government employees
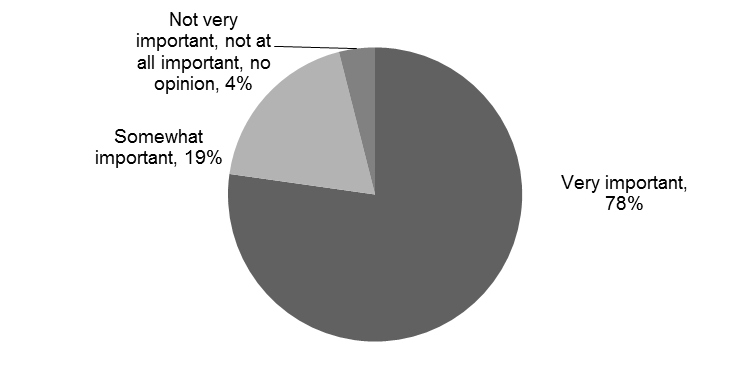
- Among Inuit government employees who indicated that they are at least somewhat proficient in Inuktitut or Inuinnaqtun, most (78%) regard it as being very important to be able to use the languages at their workplace (Figure 13).
Source: 2016 Nunavut Government Employee Survey
Text description of Figure 13
| Importance of using an Inuit Language in the Workplace | Proportion |
|---|---|
| Very important | 78% |
| Somewhat important | 19% |
| Not very important, not at all important, no opinion | 4% |
| Total | 100% |
- Being able to use Inuktut at work is found to be positively related to Inuit government employees' interest in staying in government employment in Nunavut, interest in promotion, interest in further formal education, and interest in management and leadership training.
One in three Inuit government employees are interested in taking job-related language training. However, few Inuit employees took language training in the last year
- Thirty-six percent of Inuit government employees are interested in taking language training. This proportion is 59% for non-Inuit employees.
- Six percent of Inuit government employees took language training in the last year. In comparison, this proportion is 13% for non-Inuit employees.
9.0 Key findings: profiles of government employees
Inuit government employees comprise over half of all government employees, but less than half of all government supervisors
- Overall, 53% of the government employees in Nunavut are Inuit, while 47% of government employees are non-Inuit.
- Over half of the non-permanent employees are Inuit (52%). As well, over one-third of Inuit employees are non-permanent (36%).
- Forty-four percent of government supervisors in Nunavut are Inuit. Inuit government employees are less likely to be in a supervisory position than non-Inuit (23% vs 32%).
Compared to Inuit women, Inuit men are under-represented in government employment in Nunavut overall. Among Inuit government employees, women are over-represented in non-permanent positions and under-represented in supervisor positions
- Inuit government employees are predominantly women (82%). With 88% of Inuit non-permanent employees female, Inuit women are more likely than Inuit men to be in non-permanent positions (39% vs 23%).
- With 70% of Inuit government supervisors female, Inuit men are almost twice as likely as Inuit women to be a supervisor (36% vs 20%).
Most Inuit employees are at least somewhat proficient in Inuktut, regardless of gender
- Nearly 80% of Inuit employees and only 9% of non-Inuit employees are at least somewhat proficient in Inuktitut or Inuinnaqtun. Inuit men and Inuit women are equally likely to be proficient in Inuktitut or Inuinnaqtun.
Self-reported participation in job-related training overall and in management and leadership training in the last year is much lower among Inuit government employees than among non-Inuit government employees, regardless of employment type and gender. Among Inuit employees, there are significant differences by employment type and by gender
- Compared to non-Inuit, Inuit are almost 40% less likely to have taken any job-related training (50% vs 81%) and almost 60% less likely to have taken leadership and management training (9% vs 20%) in the last year.
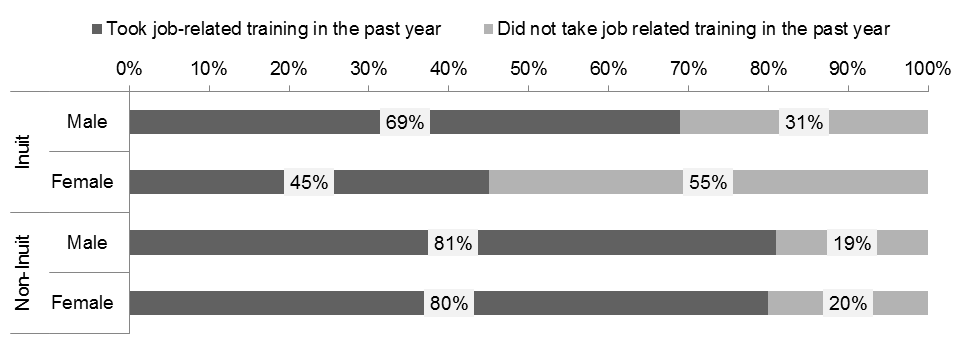
Male Inuit government employees were more likely to have taken job-related training in the past year compared to female Inuit government employees (69% vs 45%). The proportion of non-Inuit government employees who had taken training in the past year was similar by gender (Figure 14).
Source: 2016 Nunavut Government Employee Survey
Text description of Figure 14
| Gender and Inuit identity | Proportion who took job - related training in the past year (%) | Proportion who did not take job - related training in the past year (%) |
|---|---|---|
| Male Inuit | 69% | 31% |
| Female Inuit | 45% | 55% |
| Male Non-Inuit | 81% | 19% |
| Female Non-Inuit | 80% | 20% |
- Male Inuit government employees were more likely to have taken leadership and management training in the past year compared of female Inuit government employees, 14% vs 7% (Figure 15). There was not a statistically significant difference in the proportion of non-Inuit government employees who took leadership and management training by gender.
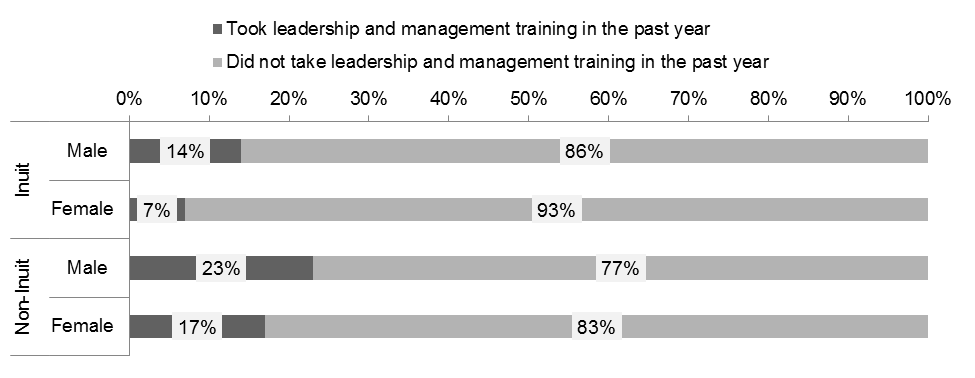
Source: 2016 Nunavut Government Employee Survey
Text description of Figure 15
| Gender and Inuit identity | Proportion who took leadership and management training in the past year (%) | Proportion who did not take leadership and management training in the past year (%) |
|---|---|---|
| Male Inuit | 14% | 86% |
| Female Inuit | 7% | 93% |
| Male Non-Inuit | 23% | 77% |
| Female Non-Inuit | 17% | 83% |
- Among Inuit, 39% of non-permanent employees took job-related training in the past year, compared to 55% of permanent employees at 55% (Figure 16). Approximately 80% of non-Inuit took job-related training in the past year, regardless of the employment type.
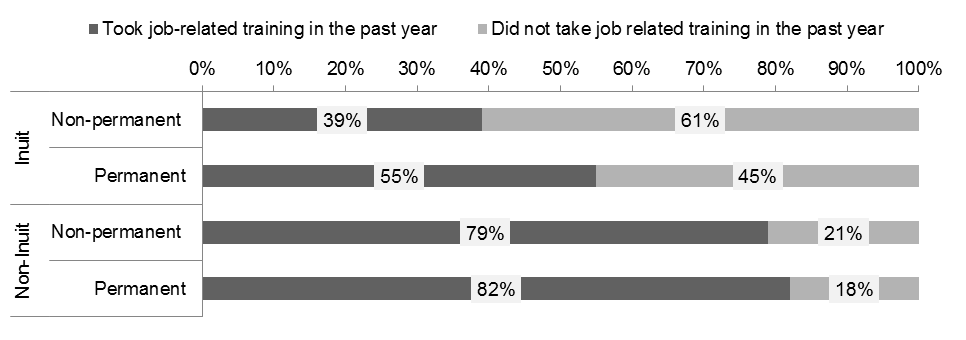
Source: 2016 Nunavut Government Employee Survey
Text description of Figure 16
| Employment status and Inuit identity | Proportion who took leadership and management training in the past year (%) | Proportion who did not take leadership and management training in the past year (%) |
|---|---|---|
| Non-permanent Inuit | 6% | 94% |
| Permanent Inuit | 10% | 90% |
| Non-permanent non-Inuit | 20% | 80% |
| Permanent non-Inuit | 21% | 79% |
- Among Inuit, non-permanent employees are less likely than permanent employees to have taken management and leadership training in the last year, 6% vs 10% (Figure 17). About one in five non-Inuit employees took management and leadership training in the last year whether they are permanent or not.
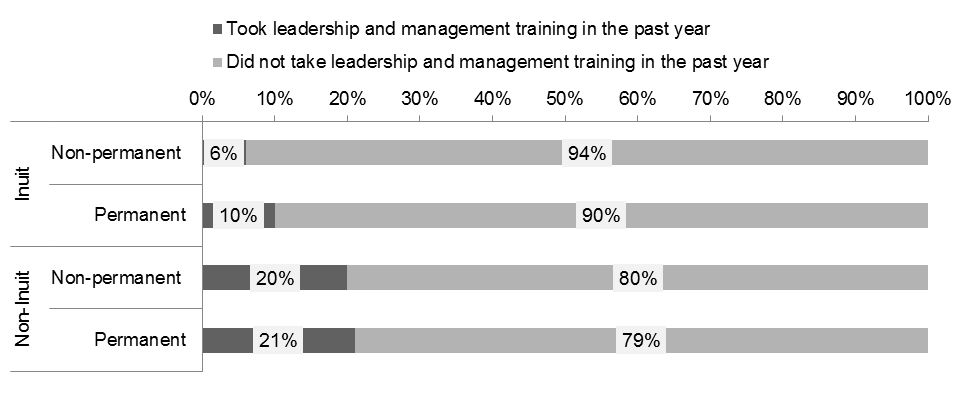
Source: 2016 Nunavut Government Employee Survey
Text description of Figure 17
| Employment status and Inuit identity | Proportion who took leadership and management training in the past year (%) | Proportion who did not take leadership and management training in the past year (%) |
|---|---|---|
| Non-permanent Inuit | 6% | 94% |
| Permanent Inuit | 10% | 90% |
| Non-permanent non-Inuit | 20% | 80% |
| Permanent non-Inuit | 21% | 79% |
10.0 Key findings: Nunavummiut suggestions and best practices for Inuit government employment
Nunavummiut stakeholders are a rich source for identifying existing best practices and suggestions
- While Inuit representation rates in government employment remain below representative levels in Nunavut, there are many instances where Inuit are excelling in public sector careers.
- Through stakeholder engagement sessions and survey participation, Nunavummiut provided examples of best practices and suggestions for how to address barriers to employment and foster a work environment where Inuit can fully participate in government employment.
- In Iqaluit, one-third of federal Inuit employees as well as several Government of Nunavut employees and managers participated in stakeholder engagement sessions.
- Participants in the Kivalliq region included federal, territorial and municipal government employees and managers; casuals, relief workers and substitute teachers; training providers and high school staff; recent graduates and students in training; career development officers; and human resource staff and managers.
Nunavummiut stakeholder suggestions and best practices relate to a wide range of policy areas aimed at increasing Inuit interest, availability, and preparedness for government employment
- Pre-employment suggestions and best practices policy areas include essential skills development, high-school completion, transition to post-secondary education, and fostering success in post-secondary education.
- Suggestions and best practices in the workplace include the following policy areas: hiring and entry into the public service, incorporation of Inuit culture and languages in the workplace, training, and retention and advancement.
- Providing flexibility and creating individualized approaches was seen as an essential condition for creating training programs and career advancement plans that meet the needs of Inuit.
- Investing in cultural awareness Inuit history training for both Inuit and non-Inuit employees was seen as a crucial step to making government workplaces where Inuit feel welcome and are successful.
Nunavut Government Employee Survey data highlight the importance of increasing education or pre-employment training opportunities and increasing awareness of Inuit Employment Plans
- The top three solutions to low Inuit representation rates cited by Inuit employees were:
- increase education or pre-employment training opportunities (56%);
- increase on-the-job training opportunities (50%);
- encourage youth to pursue further education (38%).
- In the Government of Nunavut, 38% of Inuit supervisors and 69% of non-Inuit supervisors were aware there is a departmental Inuit Employment Plan. In the Government of Canada, two-thirds of Inuit supervisors (67%) and all non-Inuit supervisors (100%) were aware there is a departmental Inuit Employment Plan. Just over half of supervisors who were aware of their Inuit Employment Plans were aware of the numerical targets for Inuit employment.
Summary of suggestions and best practices identified by Nunavummiut
The following suggestions and best practices were heard from Nunavummiut during stakeholder engagement sessions with participants held in the Kivalliq and Iqaluit regions.
Suggestions and best practices from Nunavummiut
- Hiring and entry
- Ensure flexibility in hiring for managers
- Offer resume and interview skill development
- Remove administrative barriers for casuals
- Inuit culture and language
- Provide Inuit Qaujimajatuqangit learning opportunities
- Provide compensation for Inuktitut use at work
- Government training
- Provide experiential learning opportunities
- Provide individually-focused training
- Use a diversity of training methods
- Retention and advancement
- Used individually focused career development
- Provide development opportunities
- Create welcoming work environment through Inuit Qaujimajatuqangit
- Essential skills
- Integrate Inuit identity and local knowledge into essential skills training
- Develop literacy skills
- Build confidence and career progression through essential skills training
- High school
- Establish and maintain a strong social network for students
- Provide high school career or guidance counsellors
- Offer flexible and or supported high school completion programs
- Transition to post-secondary education
- Build awareness through career fairs and job talks
- Provide credits to facilitate transition to post-secondary education
- Facilitate transition to post-secondary education through Nunavut Sivuniksavut
- Post-secondary education
- Provide internships and work experiences
- Offer training in communities
- Provide tutors, peer support
- Offer modularized training options
11.0 Conclusions: putting Nunavut Inuit Labour Force Analysis findings together to inform Inuit employment plans and pre-employment training
To demonstrate how cross-cutting Nunavut Inuit Labour Force Analysis findings can be brought together to assist in the formulation of Inuit employment plans and pre-employment training, the Conclusions chapter focuses on the application of this report by summarizing key findings and analysis, organized around four themes.
The first set of key findings provides a basic comparison of the supply of available, interested, and prepared Inuit with the demand for candidates using unemployment, high school attainment, and vacancy information.
At the territorial level, the number of unemployed Inuit with at least a high school diploma is similar to the number of government vacancies. However, there are variations by community
- In communities like Iqaluit or Cambridge Bay, where government vacancies far outnumber Inuit with at least high school, government employers may be challenged to hire local Inuit candidates, while the opposite may be true in Arviat, where the number of vacancies is lower than the number of unemployed Inuit with high school (Table 2).
| Community | Number of unemployed Inuit | Number of unemployed Inuit with a high school diploma or above | Number of vacancies in the Government of Canada | Number of Vacancies in the Government of Nunavut |
|---|---|---|---|---|
| Nunavut | 3,370 | 1,190 | 70 | 1,285 |
| Kugluktuk | 180 | 75 | 0 | 34 |
| Cambridge Bay | 145 | 50 | 8 | 127 |
| Gjoa Haven | 185 | 85 | N/A | 30 |
| Resolute | 15 | 0 | 0 | 8 |
| Baker Lake | 245 | 70 | N/A | 32 |
| Taloyoak | 155 | 40 | N/A | 8 |
| Arviat | 370 | 130 | N/A | 51 |
| Rankin Inlet | 255 | 120 | 0 | 115 |
| Naujaat | 95 | 25 | 1 | 10 |
| Pond Inlet | 155 | 85 | 1 | 52 |
| Clyde River | 180 | 45 | N/A | 12 |
| Iqaluit | 375 | 130 | 57 | 595 |
| Qikiqtarjuaq | 60 | 20 | 1 | 6 |
| Pangnirtung | 130 | 50 | 2 | 46 |
Source: Census 2016; Government of Canada, Whole of Government IEP, prepared by Pilimmaksaivik; March 2017; Government of Nunavut, Towards a Representative Public Service, March 2017
To move beyond more basic definitions of availability, interest, and preparedness of Inuit for government employment, the Conclusions chapter includes the following three compilations of data and analysis, focusing on areas where there is low Inuit representation, a high number of vacancies, or both:
Pre-employment training relevant Nunavut Inuit Labour Force Analysis findings related to science and health government positions
- There are 115 unemployed Inuit with post-secondary education in STEMFootnote 5 or Health Care at the college level (0 at the university level), signifying that pre-employment training will be necessary to increase the pool of Inuit candidates who are prepared for science- and health-related government jobs.
- Nunavut Arctic College graduates could be an important source of candidates – in the 2016-2017 school year, there were 107 students enrolled in science- and health-related programs.
Inuit employment plan relevant Nunavut Inuit Labour Force Analysis findings related to leadership and management positions
- Among the current pool of Inuit government supervisors, there are 90 individuals who are most likely to be interested, prepared, and available for leadership and management positions.
- Of these, 80 are proficient in Inuktitut or Inuinnaqtun, 30 work in Iqaluit, and 50 have recently completed leadership and management training.
Inuit employment plan and pre-employment training relevant Nunavut Inuit Labour Force Analysis findings related to administrative positions
- There is a high number of administrative government vacancies and educational attainment need not always be a barrier to Inuit candidates for these roles.
- There are 120 unemployed (available) Inuit with post-secondary education in business and administration.
- By focusing on experience, rather than educational attainment, potential candidates for pre-employment training or employment could potentially be found among the 60 unemployed Inuit who have experience in administrative and financial supervisor occupations and administrative occupations or the 75 unemployed Inuit with recent experience in office support occupations.
- Many Inuit in current administrative government roles are planning for career development by planning to apply for a higher level job (30%), taking further education (62%), or training (91%).
12.0 Next steps: Nunavut Inuit Labour Force Analysis
ESDC’s Indigenous and Northern Analysis Division looks forward to engaging the participation of Nunavut Tunngavik Inc and the Government of Nunavut (through the Nunavut Inuit Labour Force Analysis Technical Working Group) in the development of the 2020 Nunavut Inuit Labour Force Analysis report. The next Nunavut Inuit Labour Force Analysis report will incorporate the analysis of new data collected using the Aboriginal Peoples Survey 2017 and allow a detailed examination of the relationships between such factors such as gender, health, age, and other socio-economic conditions and Inuit availability, interest, and preparedness for government employment in ways that have previously not been possible, including at the community level.
A1 Annex: Glossary of key terms
A1.1 Population, demographic and geographic
Population
Includes the entire enumerated population in Nunavut, which consists of Canadian citizens (by birth and by naturalization), landed immigrants and non-permanent residents and their families living with them in Canada.
In the Census, all households in Nunavut received the long-form Census, which excludes Canadian citizens living temporarily in other countries; full-time members of the Canadian Forces stationed outside Canada; persons living in institutional collective dwellings such as hospitals, nursing homes and penitentiaries; and persons living in non-institutional collective dwellings such as work camps, hotels and motels, and student residences. For more information, see Census of Population.
Nunavut Inuit
In the Census and Aboriginal Peoples Survey, the Nunavut Inuit population was selected among individuals who identified that they were "Inuk (Inuit) single identity" and reside in Nunavut.
In the Nunavut Government Employee Survey, Nunavut Inuit consisted of individuals who identified that they were enrolled under the Nunavut Agreement. Respondents may have self-identified based on whether they were part of the Nunavut Tunngavik Inc Enrolment List.Footnote 6 Individuals qualify for enrolment if they are:
- A Canadian citizen
- An Inuk according the Inuit customs and usages
- Identify as an Inuk
Community
Communities are defined by Census sub-divisions.
A1.2 Employment and labour force
Labour force
Refers to persons aged 15 and over who, during the reference week, were employed or unemployed.
Labour force = Employed + Unemployed
Experienced labour force
Refers to persons 15 years and over currently in the labour force who are employed or who were employed at some point during the recent past (such as since a year ago).
Employed
Individuals who, during the reference period:
- Did any work at all at a job or business
- Had a job but were not at work due to factors such as their own illness or disability, personal or family responsibilities, vacation or a labour dispute.
Unemployed
Individuals who, during the reference period, were without work and who were actively looking for work, were on temporary layoff, or had a job to start within four weeks.
Unemployment rate
The number of unemployed persons as a share of the total labour force (employed and unemployed).
Labour force participation rate
The total number of individuals who were either employed or unemployed as a share of the working age population.
Not in the labour force
Working age individuals who, during the reference period, were neither employed nor unemployed, for example, persons who were full-time students currently attending school, homemakers, retired workers, seasonal workers in an ‘off' season who were not looking for work, and persons who could not work because of a long-term illness or disability.
Inuit representation rate
The number of Inuit as a share of the total population (Inuit and non-Inuit) in a given labour force group.
- Inuit share of the working age population: the number of Inuit as a share of the total (Inuit + non-Inuit) working age population.
- Inuit share of the labour force: the number of Inuit as a share of the total population in the labour force.
- Inuit share of the employed: the number of Inuit as a share of the total employed population.
- Inuit share of the unemployed: the number of Inuit as a share of the total unemployed population.
- Inuit share of the population not in the labour force: the number of Inuit as a share of the total population not in the labour force.
Inuit representation in government positions is presented as follows:
- The number of Inuit employees as a share of the total filled and vacant positions.
- The number of Inuit employees as a share of the total filled positions.
A1.3 Occupation and industry
Occupation (based on the National Occupational Classification)
"Occupation" refers to the kind of work performed in a job, a job being all the tasks carried out by a particular worker to complete his or her duties. An occupation is a set of jobs that are sufficiently similar in work performed.
Kind of work is described in terms of tasks, duties and responsibilities, often including factors such as materials processed or used, the industrial processes used, the equipment used, and the products or services provided. Occupations are generally homogeneous with respect to skill type and skill level.
Occupations are classified using the National Occupational Classification (NOC) system. In the 2016 Census, the NOC 2016 system was used. See the following link for more information see the National Occupational Classification – Resources and Tools.
Occupation data is available for:
- Employed individuals
- Individuals with recent work experience.
Industry (based on the North American Industry Classification System)
"Industry" refers to a generally homogeneous group of economic producing units, primarily engaged in a specific set of activities. An activity is a particular method of combining goods and services inputs, labour and capital to produce one or more goods and/or services (products). In most cases, the activities that define an industry are homogeneous with respect to the production processes used.
Industries are classified according to the North American Industry Classification System. In the 2016 Census, the NAICS 2012 system was used. For more information, please visit the North American Industry Classification System (NAICS) Canada 2012.
Industry data is available for:
- Employed individuals
- Individuals with recent work experience.
Nunavut public sector
The Nunavut public sector includes public administration (at the federal, territorial, and municipal levels), plus additional occupations in health care and social assistance, educational service and individual and family services.
A1.4 Education
Educational attainment
Measures an individual's highest level of completed schooling.
"Secondary (high) school diploma or equivalency certificate" refers to whether or not a person has completed a secondary school or high school diploma, graduation certificate, or equivalency certificate. Secondary school (high school) diploma or graduation certificate includes academic or vocational high school diplomas or certificates as may be obtained by graduating from a secondary school. High school equivalency certificate includes the successful completion of a high school equivalency test such as the General Education Development (GED) test, or obtaining an Adult Basic Education (ABE) certificate where it is equivalent to the completion of secondary school. For more information on education definitions and concepts, please refer to the Education Reference Guide, Census of Population, 2016.
Field of study
Refers to the discipline or area of learning or training associated with a particular course or program of study. This variable refers to the predominant discipline or area of learning or training of a person's highest completed postsecondary certificate, diploma or degree, classified according to the Classification of Instructional Programs (CIP) Canada 2016.
This variable is reported for persons aged 15 years.
STEM field of study
Refers to science, technology, engineering, and mathematics and computer sciences fields of study.
Programs are classified according to the Classification of Instructional Programs (CIP) Canada 2016. For more information on STEM and changes to the definition over time, see the Education Reference Guide, Census of Population, 2016.