
2017 to 2018 Canada Student Loans Program statistical review
From: Employment and Social Development Canada
On this page
Alternate formats

2017 to 2018 Canada Student Loans Program statistical review [PDF - 1.1 MB]
Large print, braille, MP3 (audio), e-text and DAISY formats are available on demand by ordering online or calling 1 800 O-Canada (1-800-622-6232). If you use a teletypewriter (TTY), call 1-800-926-9105.
List of abbreviations
This is the complete list of abbreviations for the 2017 to 2018 Canada Student Loans Program statistical review.
FY Fiscal Year
LY Loan Year
Introduction
The Government of Canada, through the Department of Employment and Social Development, delivers the Canada Student Loans Program (CSLP). This program helps students attend post-secondary education (PSE) and makes the education more affordable by providing students with Canada Student Grants and Loans.
The Canada Student Grants are upfront, students do not have to pay back this money. Loans are interest-free while students are in school and during the first 6 months after leaving school. Repayment on student loans starts 6 months after graduation. CSLP also offers the Repayment Assistance Plan (RAP) to those borrowers who have difficulty repaying their loans.
The Government of Canada works with provincial and territorial governments to deliver student financial assistance to Canadian students. Students in most provinces and the Yukon Territory use a single application to apply for both federal and provincial grants and loans. Quebec, Nunavut and the Northwest Territories do not participate in the CSLP. Instead, they receive alternative payments from the Government of Canada to operate their own student financial assistance programs.
The Government of Canada funds about 60% of a full-time student’s financial need. The province or territory cover the remaining 40%. The statistics provided in this review only report on federal financial assistance in participating regions.
Since the establishment of the CSLP in 1964, the program has provided a total of $57.4 billion in student loans to 6.0 million students in Canada. Starting in 1995, the program has offered grants. As of July 2018, it provided $8.3 billion in grants to 3.3 million students.
About this report
Each year, Employment and Social Development Canada produces the Canada Student Loans Program Statistical Review. The Statistical Review is a supplementary report to the Canada Student Loans Program Annual Report. The Annual Report informs Parliament and Canadians about student financial assistance for PSE through the CSLP.
The 2017 to 2018 CSLP Statistical Review provides data for the loan year from August 1, 2017 to July 31, 2018, with the exception of a few tables which provide data for the fiscal year from April 1, 2017 to March 31, 2018. This review provides tables on grants, loans, repayment assistance and other program statistics. Most tables include data going back 5 loan years. Some tables also provide historical data dating back to the beginning of the CSLP.
For accessibility reasons, all tables in the web format of this report have been simplified. Consult the PDF version for the full tables.
Tables may contain suppressed cells to ensure confidentiality. In addition, some figures may not add-up to the summary total due to rounding. Unless otherwise specified, tables include data for full- and part-time students.
2017 to 2018 at a glance
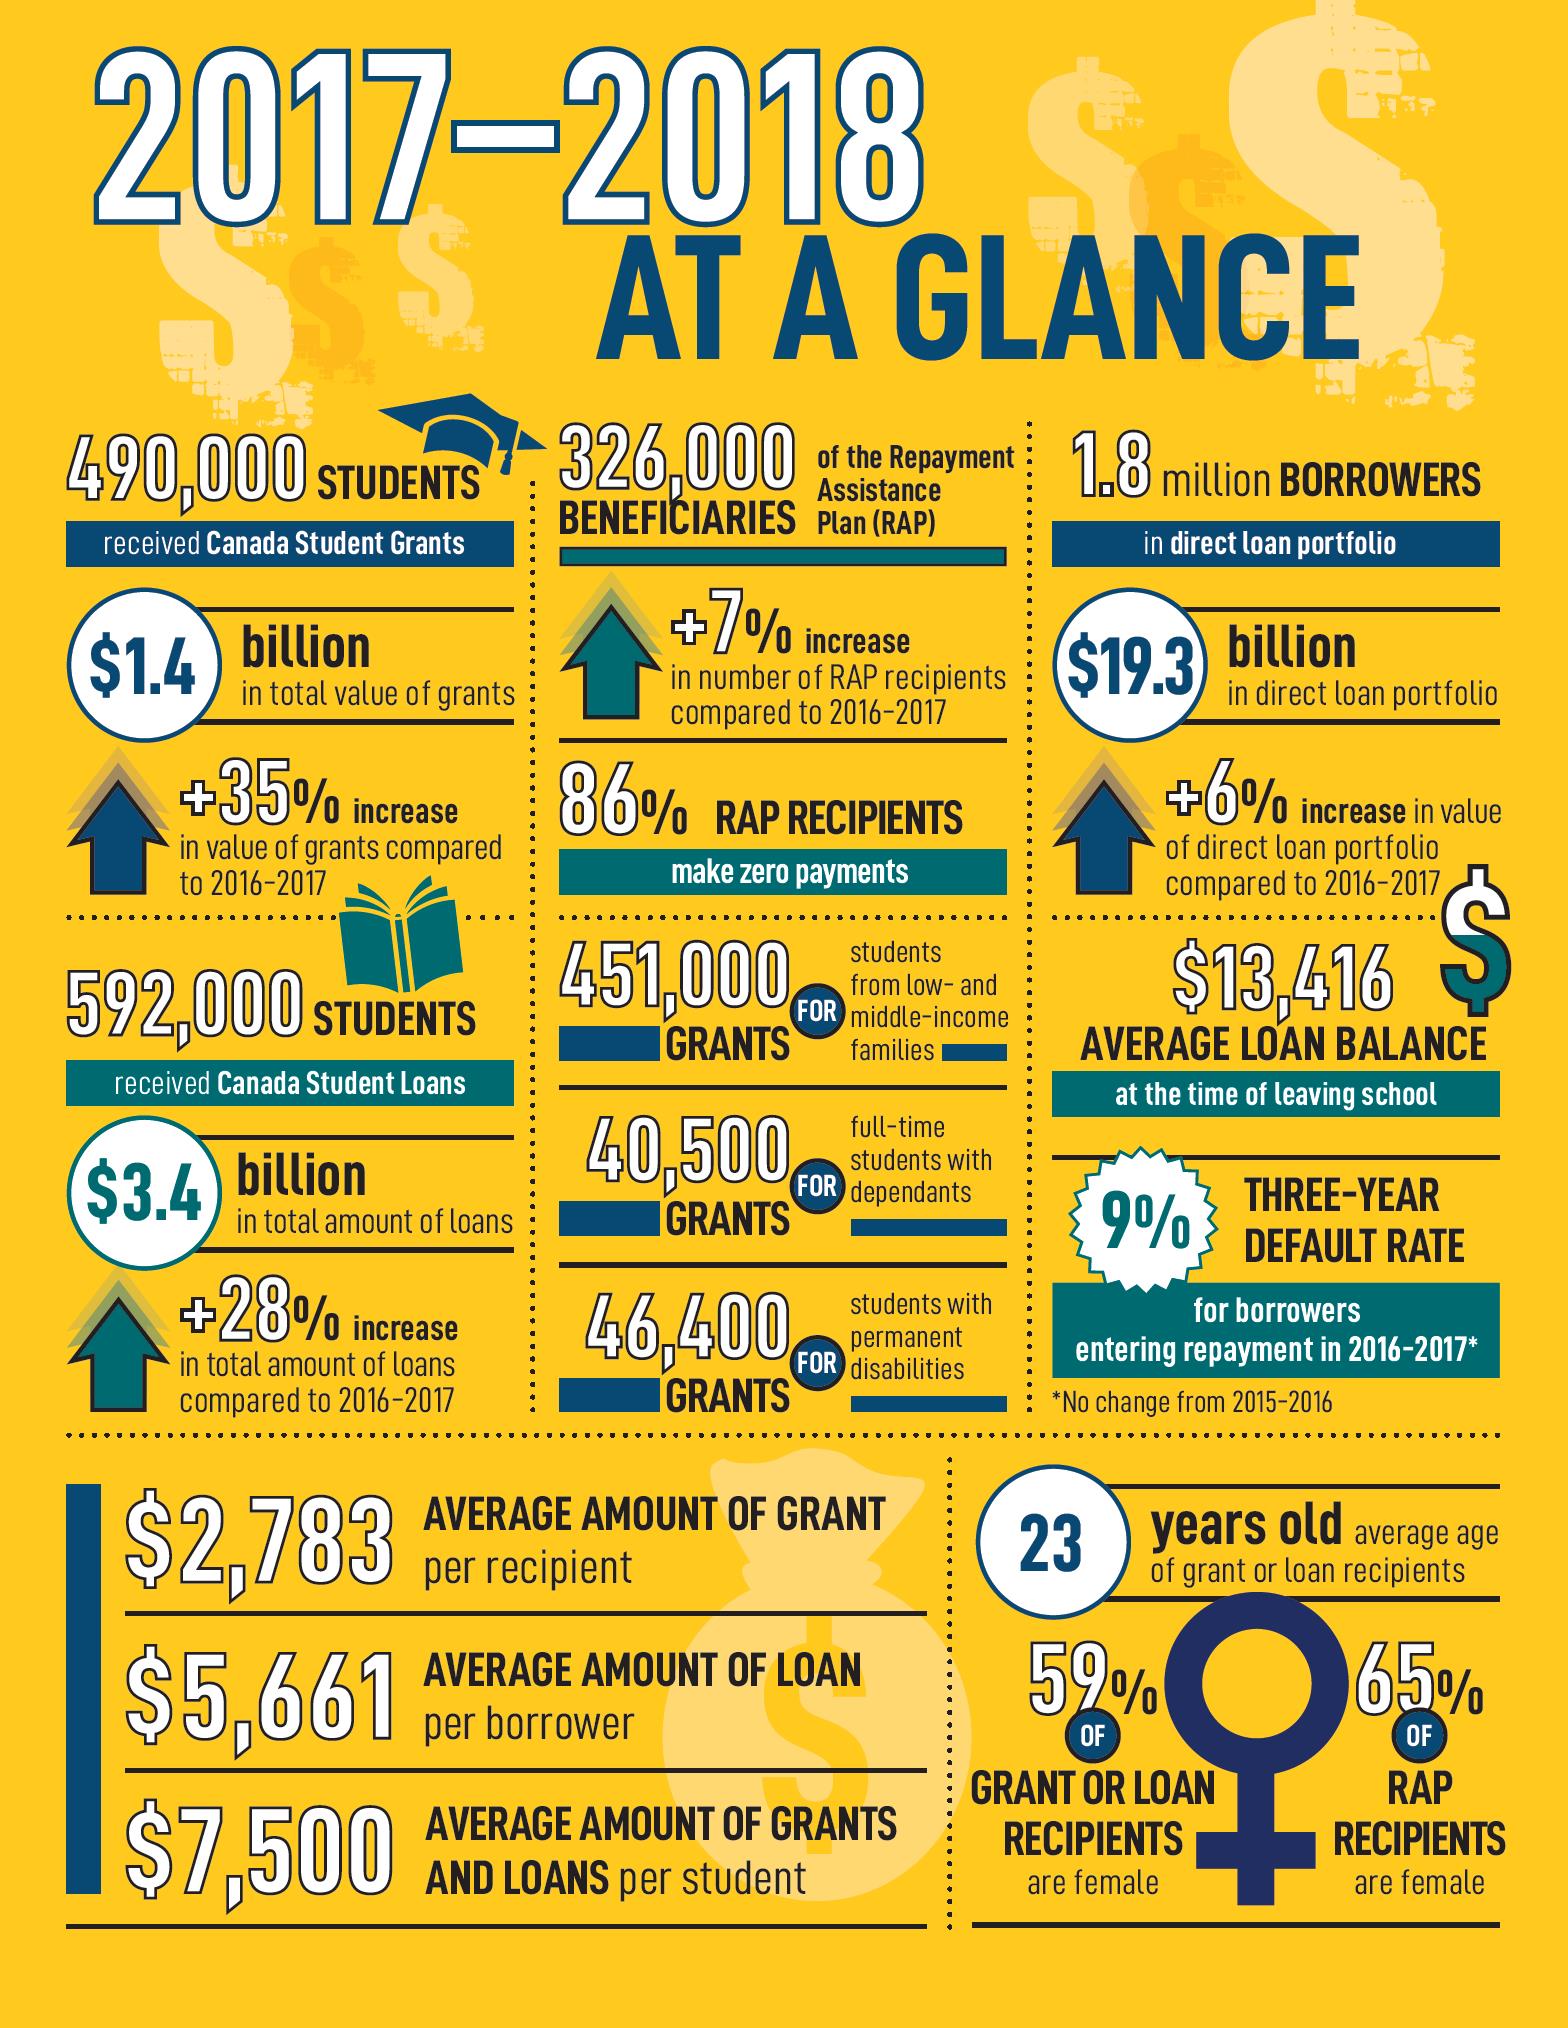
Alternative text: Infographic 2017 to 2018 at a glance
Top left quadrant
- 490,000 students received Canada Student Grants
- $1.4 billion in total value of grants
- +35% increase in value of grants compared to 2016 to 2017
Top middle quadrant
- 326,000 beneficiaries of the Repayment Assistance Plan (RAP)
- +7% increase in number of RAP recipients compared to 2016 to 2017
- 86% of RAP recipients make zero payments
Top right quadrant
- 1.8 million borrowers in direct loan portfolio
- $19.3 billion In direct loan portfolio
- +6% increase in value of direct loan portfolio compared to 2016 to 2017
Middle left quadrant
- 592,000 students received Canada Student Loans
- $3.4 billion in total amount of loans
- +28% increase in total amount of loans compared to 2016 to 2017
Middle-center quadrant
- 451,000 grants for students from low– and middle– income families
- 40,500 grants for full-time students with dependants
- 46,400 grants for students with permanent disabilities
Middle right quadrant
- $13,416 average loan balance at the time of leaving school
- 9% 3-year default rate for borrowers entering repayment in 2016 to 2017, no change from 2015 to 2016
Bottom left quadrant
- $2,783 average amount of grant per recipient
- $5,661 average amount of loan per borrower
- $7,500 average amount of grants and loans per student
Bottom right quadrant
- 23 years old average age of grant or loan recipients
- 59% of grant or loan recipients are female
- 65% of RAP recipients are female
Tables
1 Canada
1.1 Student Financial Assistance: Grants, Loans and Interest Subsidies
Table 1.1.1 Student financial assistance by type
Table 1.1.1A Student financial assistance by type: Number of recipients1
| Type | LY 2013 to 2014 | LY 2014 to 2015 | LY 2015 to 2016 | LY 2016 to 2017 | LY 2017 to 2018 |
|---|---|---|---|---|---|
| Total student financial assistance2 (SFA) | 613,959 | 614,674 | 616,439 | 627,122 | 705,152 |
| SFA- Full-time students | 605,744 | 606,361 | 607,509 | 617,475 | 695,039 |
| SFA- Part-time students | 16,872 | 17,973 | 19,779 | 21,775 | 24,466 |
| Canada Student Grant / Canada Student Loan3 (CSG/CSL) | 515,279 | 513,898 | 516,430 | 530,703 | 628,935 |
| CSG/CSL- Full-time students3 | 506,880 | 505,412 | 507,317 | 520,727 | 618,602 |
| CSG/CSL- Part-time students3 | 16,753 | 17,858 | 19,681 | 21,628 | 24,359 |
| Canada Student Grant (CSG) | 367,586 | 365,832 | 368,940 | 379,606 | 490,377 |
| CSG- Full-time students4 | 359,454 | 357,505 | 360,027 | 369,703 | 480,904 |
| CSG- Part-time students5 | 14,955 | 15,963 | 17,439 | 19,159 | 21,268 |
| Canada Student Loan (CSL) | 497,725 | 495,318 | 497,042 | 497,064 | 592,091 |
| CSL- Full-time students | 491,444 | 488,781 | 489,935 | 490,401 | 585,019 |
| CSL- Part-time students | 11,254 | 12,086 | 13,712 | 11,790 | 13,534 |
| In-study interest subsidy | 596,404 | 596,098 | 597,051 | 593,483 | 668,308 |
| In-study interest subsidy- Full-time students | 590,306 | 589,731 | 590,127 | 587,149 | 661,456 |
| In-study interest subsidy- Part-time students | 11,374 | 12,203 | 13,810 | 11,937 | 13,641 |
1 The number of recipients do not sum to the total, as some recipients can receive multiple products (grants and/or loans and/or in-study interest subsidy) in the same year.
2 Student financial assistance is any form of financial aid provided by the Canada Student Loans Program to students while they enroll in designated post-secondary education institutions, including Canada Student Grants, Canada Student Loans and in-study interest subsidy.
3 Includes students who receive a Canada Student Grant and/or a Canada Student Loan.
4 Includes Canada Student Grant for Full-Time Students, for Full-Time Students with Dependants, for Students with Permanent Disabilities, for Services and Equipment for Students with Permanent Disabilities.
5 Includes Canada Student Grant for Part-Time Studies and for Part-Time Students with Dependants.
Table 1.1.1B Student financial assistance by type: Millions of dollars
| Type | LY 2013 to 2014 | LY 2014 to 2015 | LY 2015 to 2016 | LY 2016 to 2017 | LY 2017 to 2018 |
|---|---|---|---|---|---|
| Total student financial assistance6 (SFA) | N/A | N/A | N/A | N/A | N/A |
| SFA- Full-time students6 | N/A | N/A | N/A | N/A | N/A |
| SFA- Part-time students6 | N/A | N/A | N/A | N/A | N/A |
| Canada Student Grant / Canada Student Loan3 (CSG/CSL) | 3,435.8 | 3,440.8 | 3,441.8 | 3,641.8 | 4,717.0 |
| CSG/CSL- Full-time students3 | 3,398.7 | 3,401.8 | 3,397.9 | 3,593.6 | 4,661.0 |
| CSG/CSL- Part-time students3 | 37.2 | 39.0 | 43.9 | 48.2 | 56.0 |
| Canada Student Grant (CSG) | 715.3 | 717.7 | 719.5 | 1,014.6 | 1,364.9 |
| CSG- Full-time students4 | 698.0 | 699.6 | 699.7 | 985.6 | 1,331.9 |
| CSG- Part-time students5 | 17.3 | 18.1 | 19.8 | 29.0 | 33.0 |
| Canada Student Loan (CSL) | 2,720.6 | 2,723.1 | 2,722.3 | 2,627.2 | 3,352.1 |
| CSL- Full-time students | 2,700.7 | 2,702.2 | 2,698.2 | 2,608.0 | 3,329.1 |
| CSL- Part-time students | 19.9 | 20.9 | 24.1 | 19.2 | 23.0 |
| In-study interest subsidy7 | N/A | N/A | N/A | N/A | N/A |
| In-study interest subsidy- Full-time students7 | N/A | N/A | N/A | N/A | N/A |
| In-study interest subsidy- Part-time students7 | N/A | N/A | N/A | N/A | N/A |
3 Includes students who receive a Canada Student Grant and/or a Canada Student Loan.
4 Includes Canada Student Grant for Full-Time Students, for Full-Time Students with Dependants, for Students with Permanent Disabilities, for Services and Equipment for Students with Permanent Disabilities.
5 Includes Canada Student Grant for Part-Time Studies and for Part-Time Students with Dependants.
6 The dollar amount of total student financial assistance (SFA), SFA for full-time students and SFA for part-time students are not available because one of its components, in-study interest subsidy, has no dollar value.
7The dollar value for in-study interest subsidies is not available.
Table 1.1.2 Canada Student Grants by type
Table 1.1.2A Canada Student Grants by type: Number of recipients1
| Type | LY 2013 to 20142 | LY 2014 to 2015 | LY 2015 to 2016 | LY 2016 to 2017 | LY 2017 to 2018 |
|---|---|---|---|---|---|
| Canada Student Grant (CSG)- Total | 367,586 | 365,832 | 368,940 | 379,606 | 490,377 |
| CSG for Full-Time Students3 | 334,006 | 332,495 | 335,231 | 344,165 | 451,296 |
| CSG for Full-Time Students with Dependants | 38,317 | 36,676 | 35,347 | 35,322 | 40,523 |
| CSG for Students with Permanent Disabilities | 29,222 | 31,356 | 34,104 | 37,263 | 46,432 |
| CSG for Services and Equipment for Students with Permanent Disabilities | 8,622 | 9,544 | 9,894 | 10,125 | 10,550 |
| CSG for Part-Time Studies | 14,938 | 15,958 | 17,432 | 19,155 | 21,261 |
| CSG for Part-Time Students with Dependants | 739 | 378 | 408 | 332 | 376 |
1 The number of recipients do not sum to the total, as some recipients can receive multiple grants and/or loans in the same year.
2 The Millennium Excellence Award is reflected in the total, but is not separately shown as a grant.
3 In 2017 to 2018, the Canada Student Grant for Full-Time Students replaced two separate grants, the Canada Student Grant for low-income students (CSG-LI) and the Canada Student Grant for middle-income students (CSG-MI). The values prior to 2017 to 2018 are the sum of CSG-LI and CSG-MI.
Table 1.1.2B Canada Student Grants by type: Millions of dollars
| Type | LY 2013 to 20142 | LY 2014 to 2015 | LY 2015 to 2016 | LY 2016 to 2017 | LY 2017 to 2018 |
|---|---|---|---|---|---|
| Canada Student Grant (CSG)- Total | 715.3 | 717.7 | 719.5 | 1,014.6 | 1,364.9 |
| CSG for Full-Time Students3 | 527.3 | 526.3 | 524.8 | 803.6 | 1,118.90 |
| CSG for Full-Time Students with Dependants | 93.4 | 90.4 | 86.3 | 87.7 | 102.6 |
| CSG for Students with Permanent Disabilities | 55.3 | 59.4 | 65.0 | 71.0 | 88.3 |
| CSG for Services and Equipment for Students with Permanent Disabilities | 21.9 | 23.6 | 23.5 | 23.3 | 22.0 |
| CSG for Part-Time Studies | 16.6 | 17.7 | 19.4 | 28.6 | 32.6 |
| CSG for Part-Time Students with Dependants | 0.7 | 0.4 | 0.4 | 0.3 | 0.4 |
2 The Millennium Excellence Award is reflected in the total, but is not separately shown as a grant.
3 In 2017 to 2018, the Canada Student Grant for Full-Time Students replaced two separate grants, the Canada Student Grant for low-income students (CSG-LI) and the Canada Student Grant for middle-income students (CSG-MI). The values prior to 2017 to 2018 are the sum of CSG-LI and CSG-MI.
Table 1.1.3 Profile of students who received student financial assistance: grants, loans and interest subsidies
Table 1.1.3A Profile of students who received student financial assistance: grants, loans and interest subsidies: LY 2017 to 2018 by Gender
| Gender | Number | Percent |
|---|---|---|
| Female | 418,085 | 59 |
| Male | 287,067 | 41 |
| Total | 705,152 | 100 |
Table 1.1.3B Profile of students who received student financial assistance: grants, loans and interest subsidies: LY 2017 to 2018 by Age group
| Age group | Number | Percent |
|---|---|---|
| Younger than 20 years | 187,230 | 27 |
| 20 to 24 years | 314,721 | 45 |
| 25 to 29 years | 103,613 | 15 |
| 30 to 34 years | 41,987 | 6 |
| 35 to 39 years | 25,169 | 4 |
| 40 to 44 years | 15,699 | 2 |
| 45 to 49 years | 9,239 | 1 |
| 50 years and older | 7,494 | 1 |
| Total | 705,152 | 100 |
Table 1.1.3C Profile of students who received student financial assistance: grants, loans and interest subsidies: LY 2017 to 2018 by Level of study
| Level of study | Number | Percent |
|---|---|---|
| Certificate or diploma | 253,610 | 36 |
| Undergraduate | 409,294 | 58 |
| Master | 34,316 | 5 |
| Doctorate | 7,932 | 1 |
| Total | 705,152 | 100 |
Table 1.1.3D Profile of students who received student financial assistance: grants, loans and interest subsidies: LY 2017 to 2018 by Type of institution
| Type of institution | Number | Percent |
|---|---|---|
| University | 404,321 | 57 |
| College | 228,063 | 32 |
| Private | 72,768 | 10 |
| Total | 705,152 | 100 |
Table 1.1.4 Profile of students who received Canada Student Grants and/or Canada Student Loans
Table 1.1.4A Profile of students who received Canada Student Grants and/or Canada Student Loans: LY 2017 to 2018 by Gender: Number
| Gender | Number | Percent |
|---|---|---|
| Female | 372,474 | 59 |
| Male | 256,461 | 41 |
| Total | 628,935 | 100 |
Table 1.1.4B Profile of students who received Canada Student Grants and/or Canada Student Loans: LY 2017 to 2018 by Gender: Millions of dollars
| Gender | Millions of dollars | Percent |
|---|---|---|
| Female | 2,844.4 | 60 |
| Male | 1,872.6 | 40 |
| Total | 4,717.0 | 100 |
Table 1.1.4C Profile of students who received Canada Student Grants and/or Canada Student Loans: LY 2017 to 2018 by Age group: Number
| Age group | Number | Percent |
|---|---|---|
| Younger than 20 years | 180,611 | 29 |
| 20 to 24 years | 280,929 | 45 |
| 25 to 29 years | 85,488 | 14 |
| 30 to 34 years | 33,769 | 5 |
| 35 to 39 years | 20,918 | 3 |
| 40 to 44 years | 13,254 | 2 |
| 45 to 49 years | 7,789 | 1 |
| 50 years and older | 6,177 | 1 |
| Total | 628,935 | 100 |
Table 1.1.4D Profile of students who received Canada Student Grants and/or Canada Student Loans: LY 2017 to 2018 by Age group: Millions of dollars
| Age group | Millions of dollars | Percent |
|---|---|---|
| Younger than 20 years | 1,191.0 | 25 |
| 20 to 24 years | 2,072.4 | 44 |
| 25 to 29 years | 722.2 | 15 |
| 30 to 34 years | 302.2 | 6 |
| 35 to 39 years | 193.2 | 4 |
| 40 to 44 years | 119.2 | 3 |
| 45 to 49 years | 67.6 | 1 |
| 50 years and older | 49.2 | 1 |
| Total | 4,717.0 | 100 |
Table 1.1.4E Profile of students who received Canada Student Grants and/or Canada Student Loans: LY 2017 to 2018 by Level of study: Number
| Level of study | Number | Percent |
|---|---|---|
| Certificate or diploma | 224,766 | 36 |
| Undergraduate | 373,261 | 59 |
| Master | 25,555 | 4 |
| Doctorate | 5,353 | 1 |
| Total | 628,935 | 100 |
Table 1.1.4F Profile of students who received Canada Student Grants and/or Canada Student Loans: LY 2017 to 2018 by Level of study: Millions of dollars
| Level of study | Millions of dollars | Percent |
|---|---|---|
| Certificate or diploma | 1,596.8 | 34 |
| Undergraduate | 2,862.4 | 61 |
| Master | 209.9 | 4 |
| Doctorate | 47.9 | 1 |
| Total | 4,717.0 | 100 |
Table 1.1.4G Profile of students who received Canada Student Grants and/or Canada Student Loans: LY 2017 to 2018 by Type of institution: Number
| Type of institution | Number | Percent |
|---|---|---|
| University | 359,785 | 57 |
| College | 211,526 | 34 |
| Private | 57,624 | 9 |
| Total | 628,935 | 100 |
Table 1.1.4H Profile of students who received Canada Student Grants and/or Canada Student Loans: LY 2017 to 2018 by Type of institution: Millions of dollars
| Type of institution | Millions of dollars | Percent |
|---|---|---|
| University | 2,776.9 | 59 |
| College | 1,437.1 | 30 |
| Private | 503.0 | 11 |
| Total | 4,717.0 | 100 |
Table 1.1.5 Profile of students who received Canada Student Grants
Table 1.1.5A Profile of students who received Canada Student Grants: LY 2017 to 2018 by Gender: Number
| Gender | Number | Percent |
|---|---|---|
| Female | 287,497 | 59 |
| Male | 202,880 | 41 |
| Total | 490,377 | 100 |
Table 1.1.5B Profile of students who received Canada Student Grants: LY 2017 to 2018 by Gender: Millions of dollars
| Gender | Millions of dollars | Percent |
|---|---|---|
| Female | 817.8 | 60 |
| Male | 547.1 | 40 |
| Total | 1,364.9 | 100 |
Table 1.1.5C Profile of students who received Canada Student Grants: LY 2017 to 2018 by Age group: Number
| Age group | Number | Percent |
|---|---|---|
| Younger than 20 years | 137,632 | 28 |
| 20 to 24 years | 228,770 | 47 |
| 25 to 29 years | 65,539 | 13 |
| 30 to 34 years | 25,074 | 5 |
| 35 to 39 years | 15,593 | 3 |
| 40 to 44 years | 9,316 | 2 |
| 45 to 49 years | 4,952 | 1 |
| 50 years and older | 3,501 | 1 |
| Total | 490,377 | 100 |
Table 1.1.5D Profile of students who received Canada Student Grants: LY 2017 to 2018 by Age group: Millions of dollars
| Age group | Millions of dollars | Percent |
|---|---|---|
| Younger than 20 years | 330.2 | 24 |
| 20 to 24 years | 627.3 | 46 |
| 25 to 29 years | 204.3 | 15 |
| 30 to 34 years | 86.9 | 6 |
| 35 to 39 years | 56.8 | 4 |
| 40 to 44 years | 32.6 | 2 |
| 45 to 49 years | 16.3 | 1 |
| 50 years and older | 10.5 | 1 |
| Total | 1,364.9 | 100 |
Table 1.1.5E Profile of students who received Canada Student Grants: LY 2017 to 2018 by Level of study: Number
| Level of study | Number | Percent |
|---|---|---|
| Certificate or diploma | 161,424 | 33 |
| Undergraduate | 324,473 | 66 |
| Master | 3,439 | 1 |
| Doctorate | 1,041 | 0s |
| Total | 490,377 | 100 |
0s: value rounded to 0 (zero).
Table 1.1.5F Profile of students who received Canada Student Grants: LY 2017 to 2018 by Level of study: Millions of dollars
| Level of study | Millions of dollars | Percent |
|---|---|---|
| Certificate or diploma | 457.4 | 34 |
| Undergraduate | 895.1 | 66 |
| Master | 8.9 | 1 |
| Doctorate | 3.4 | 0s |
| Total | 1,364.9 | 100 |
0s: value rounded to 0 (zero).
Table 1.1.5G Profile of students who received Canada Student Grants: LY 2017 to 2018 by Type of institution: Number
| Type of institution | Number | Percent |
|---|---|---|
| University | 288,314 | 59 |
| College | 170,081 | 35 |
| Private | 31,982 | 7 |
| Total | 490,377 | 100 |
Table 1.1.5H Profile of students who received Canada Student Grants: LY 2017 to 2018 by Type of institution: Millions of dollars
| Type of institution | Millions of dollars | Percent |
|---|---|---|
| University | 791.3 | 58 |
| College | 481.4 | 35 |
| Private | 92.2 | 7 |
| Total | 1,364.9 | 100 |
Table 1.1.6 Profile of students who received Canada Student Loans
Table 1.1.6A Profile of students who received Canada Student Loans: LY 2017 to 2018 by Gender: Number
| Gender | Number | Percent |
|---|---|---|
| Female | 350,363 | 59 |
| Male | 241,728 | 41 |
| Total | 592,091 | 100 |
Table 1.1.6B Profile of students who received Canada Student Loans: LY 2017 to 2018 by Gender: Millions of dollars
| Gender | Millions of dollars | Percent |
|---|---|---|
| Female | 2,026.6 | 60 |
| Male | 1,325.5 | 40 |
| Total | 3,352.1 | 100 |
Table 1.1.6C Profile of students who received or Canada Student Loans: LY 2017 to 2018 by Age group: Number
| Age group | Number | Percent |
|---|---|---|
| Younger than 20 years | 170,398 | 29 |
| 20 to 24 years | 263,746 | 45 |
| 25 to 29 years | 81,282 | 14 |
| 30 to 34 years | 31,789 | 5 |
| 35 to 39 years | 19,533 | 3 |
| 40 to 44 years | 12,352 | 2 |
| 45 to 49 years | 7,313 | 1 |
| 50 years and older | 5,678 | 1 |
| Total | 592,091 | 100 |
Table 1.1.6D Profile of students who received Canada Student Loans: LY 2017 to 2018 by Age group: Millions of dollars
| Age group | Millions of dollars | Percent |
|---|---|---|
| Younger than 20 years | 860.5 | 26 |
| 20 to 24 years | 1,445.5 | 43 |
| 25 to 29 years | 517.9 | 15 |
| 30 to 34 years | 215.3 | 6 |
| 35 to 39 years | 136.5 | 4 |
| 40 to 44 years | 86.5 | 3 |
| 45 to 49 years | 51.3 | 2 |
| 50 years and older | 38.6 | 1 |
| Total | 3,352.1 | 100 |
Table 1.1.6E Profile of students who received Canada Student Loans: LY 2017 to 2018 by Level of study: Number
| Level of study | Number | Percent |
|---|---|---|
| Certificate or diploma | 209,779 | 35 |
| Undergraduate | 351,779 | 59 |
| Master | 25,286 | 4 |
| Doctorate | 5,247 | 1 |
| Total | 592,091 | 100 |
Table 1.1.6F Profile of students who received Canada Student Loans: LY 2017 to 2018 by Level of study: Millions of dollars
| Level of study | Millions of dollars | Percent |
|---|---|---|
| Certificate or diploma | 1,136.6 | 34 |
| Undergraduate | 1,972.1 | 59 |
| Master | 199.2 | 6 |
| Doctorate | 44.2 | 1 |
| Total | 3,352.1 | 100 |
Table 1.1.6G Profile of students who received Canada Student Loans: LY 2017 to 2018 by Type of institution: Number
| Type of institution | Number | Percent |
|---|---|---|
| University | 339,839 | 57 |
| College | 198,114 | 33 |
| Private | 54,138 | 9 |
| Total | 592,091 | 100 |
Table 1.1.6H Profile of students who received Canada Student Loans: LY 2017 to 2018 by Type of institution: Millions of dollars
| Type of institution | Millions of dollars | Percent |
|---|---|---|
| University | 1,985.6 | 59 |
| College | 957.0 | 29 |
| Private | 409.5 | 12 |
| Total | 3,352.1 | 100 |
Table 1.1.7 Canada Apprentice Loan
Table 1.1.7A Canada Apprentice Loan
| Item | LY 2014 to 20151 | LY 2015 to 2016 | LY 2016 to 2017 | LY 2017 to 2018 |
|---|---|---|---|---|
| Canada Apprentice Loans (number) | 8,095 | 16,422 | 15,310 | 13,955 |
| Canada Apprentice Loans disbursed (millions of dollars) | 32.3 | 69.4 | 65.6 | 58.8 |
1 Canada Apprentice Loan program came into effect on January 1st, 2015. The program statistics are reported by the loan year. The 2014 to 2015 loan year reports on the period from January 1st, 2015 to July 31st, 2015.
Table 1.1.7B Canada Apprentice Loan recipients by Gender: Percent
| Gender | LY 2014 to 20151 | LY 2015 to 2016 | LY 2016 to 2017 | LY 2017 to 2018 |
|---|---|---|---|---|
| Female | 5 | 5 | 5 | 6 |
| Male | 95 | 95 | 95 | 94 |
| Total | 100 | 100 | 100 | 100 |
1 Canada Apprentice Loan program came into effect on January 1st, 2015. The program statistics are reported by the loan year. The 2014 to 2015 loan year reports on the period from January 1st, 2015 to July 31st, 2015.
Table 1.1.7C Canada Apprentice Loan recipients by Age group: Percent
| Age group | LY 2014 to 20151 | LY 2015 to 2016 | LY 2016 to 2017 | LY 2017 to 2018 |
|---|---|---|---|---|
| Younger than 20 years | 3 | 3 | 3 | 2 |
| 20 to 24 years | 32 | 32 | 30 | 29 |
| 25 to 29 years | 29 | 29 | 31 | 31 |
| 30 to 34 years | 17 | 18 | 18 | 18 |
| 35 to 39 years | 9 | 9 | 9 | 10 |
| 40 to 44 years | 5 | 4 | 5 | 5 |
| 45 to 49 years | 3 | 2 | 2 | 2 |
| 50 years and older | 2 | 2 | 2 | 2 |
| Total | 100 | 100 | 100 | 100 |
1 Canada Apprentice Loan program came into effect on January 1st, 2015. The program statistics are reported by the loan year. The 2014 2015 loan year reports on the period from January 1sh, 2015 to July 31sh, 2015.
1.2 Loan Balance
Table 1.2.1 Number of full-time students leaving school and their average loan balance at time of leaving school
| Item | LY 2013 to 2014 | LY 2014 to 2015 | LY 2015 to 2016 | LY 2016 to 2017 | LY 2017 to 2018 |
|---|---|---|---|---|---|
| Number of students leaving school | 198,613 | 203,732 | 203,909 | 201,516 | 203,459 |
| Average loan balance at time of leaving school (dollars) | 12,480 | 12,783 | 13,306 | 13,456 | 13,416 |
Table 1.2.2 Profile of average loan balance at time of leaving school for full-time students
Table 1.2.2A Profile of average loan balance at time of leaving school for full-time students by Gender: Dollars
| Gender | LY 2013 to 2014 | LY 2014 to 2015 | LY 2015 to 2016 | LY 2016 to 2017 | LY 2017 to 2018 |
|---|---|---|---|---|---|
| Female | 12,863 | 13,141 | 13,648 | 13,796 | 13,767 |
| Male | 11,918 | 12,258 | 12,803 | 12,964 | 12,910 |
Table 1.2.2B Profile of average loan balance at time of leaving school for full-time students by Age group: Dollars
| Age group | LY 2013 to 2014 | LY 2014 to 2015 | LY 2015 to 2016 | LY 2016 to 2017 | LY 2017 to 2018 |
|---|---|---|---|---|---|
| Younger than 20 years | 5,288 | 5,442 | 5,463 | 5,466 | 5,191 |
| 20 to 24 years | 11,415 | 11,776 | 12,354 | 12,633 | 12,796 |
| 25 to 29 years | 15,949 | 16,212 | 16,770 | 16,801 | 16,780 |
| 30 to 34 years | 15,823 | 15,933 | 16,414 | 16,262 | 15,928 |
| 35 to 39 years | 14,070 | 14,361 | 14,696 | 14,202 | 13,865 |
| 40 to 44 years | 13,440 | 13,917 | 14,289 | 14,016 | 13,542 |
| 45 to 49 years | 13,117 | 13,519 | 13,755 | 13,794 | 13,240 |
| 50 years and older | 11,986 | 12,754 | 13,026 | 13,032 | 12,772 |
Table 1.2.2C Profile of average loan balance at time of leaving school for full-time students by Level of study: Dollars
| Level of study | LY 2013 to 2014 | LY 2014 to 2015 | LY 2015 to 2016 | LY 2016 to 2017 | LY 2017 to 2018 |
|---|---|---|---|---|---|
| Certificate or diploma | 9,317 | 9,626 | 9,890 | 9,968 | 9,698 |
| Undergraduate | 15,144 | 15,478 | 16,152 | 16,535 | 16,541 |
| Master | 20,366 | 20,531 | 21,207 | 20,976 | 20,280 |
| Doctorate | 28,463 | 29,289 | 29,040 | 28,604 | 29,251 |
Table 1.2.2D Profile of average loan balance at time of leaving school for full-time students by Type of institution: Dollars
| Type of institution | LY 2013 to 2014 | LY 2014 to 2015 | LY 2015 to 2016 | LY 2016 to 2017 | LY 2017 to 2018 |
|---|---|---|---|---|---|
| University | 15,655 | 15,989 | 16,727 | 17,113 | 17,167 |
| College | 9,452 | 9,794 | 10,172 | 10,358 | 10,032 |
| Private | 10,739 | 11,082 | 11,137 | 10,994 | 10,912 |
Table 1.2.3 Distribution of loan balance at time of leaving school for full-time students: LY 2017 to 2018
| Item | Less than $5,000 | $5,000 to $9,999 | $10,000 to $14,999 | $15,000 to $19,999 | $20,000 to $24,999 | $25,000 to $29,999 | $30,000 and over | Total |
|---|---|---|---|---|---|---|---|---|
| Number of students by debt level | 48,011 | 53,807 | 32,851 | 21,604 | 16,313 | 12,336 | 18,537 | 203,459 |
| Percentage of students by debt level | 24 | 26 | 16 | 11 | 8 | 6 | 9 | 100 |
Table 1.2.4 Profile of loan balance distribution at time of leaving school for full-time students
Table 1.2.4A Profile of loan balance distribution at time of leaving school for full-time students: LY 2017 to 2018 by Gender: Percent
| Gender | Less than $5,000 | $5,000 to $9,999 | $10,000 to $14,999 | $15,000 to $19,999 | $20,000 to $24,999 | $25,000 to $29,999 | $30,000 and over | Total |
|---|---|---|---|---|---|---|---|---|
| Female | 21 | 27 | 16 | 11 | 8 | 6 | 9 | 100 |
| Male | 27 | 26 | 16 | 10 | 8 | 6 | 9 | 100 |
Table 1.2.4B Profile of loan balance distribution at time of leaving school for full-time students: LY 2017 to 2018 by Age group: Percent
| Age group | Less than $5,000 | $5,000 to $9,999 | $10,000 to $14,999 | $15,000 to $19,999 | $20,000 to $24,999 | $25,000 to $29,999 | $30,000 and over | Total |
|---|---|---|---|---|---|---|---|---|
| Younger than 20 years | 55 | 35 | 8 | 1 | 0s | x | x | 100 |
| 20 to 24 years | 24 | 25 | 17 | 12 | 9 | 7 | 6 | 100 |
| 25 to 29 years | 17 | 22 | 16 | 12 | 10 | 7 | 16 | 100 |
| 30 to 34 years | 17 | 27 | 17 | 10 | 8 | 5 | 15 | 100 |
| 35 to 39 years | 17 | 34 | 19 | 10 | 6 | 4 | 11 | 100 |
| 40 to 44 years | 17 | 34 | 19 | 11 | 6 | 3 | 9 | 100 |
| 45 to 49 years | 19 | 35 | 18 | 9 | 6 | 4 | 9 | 100 |
| 50 years and older | 20 | 35 | 19 | 9 | 5 | x | x | 100 |
x: cells are suppressed to prevent statistical disclosure of number of recipients greater than 0 but less than 10.
0s: value rounded to 0 (zero).
Table 1.2.4C Profile of loan balance distribution at time of leaving school for full-time students: LY 2017 to 2018 by Level of study: Percent
| Level of study | Less than $5,000 | $5,000 to $9,999 | $10,000 to $14,999 | $15,000 to $19,999 | $20,000 to $24,999 | $25,000 to $29,999 | $30,000 and over | Total |
|---|---|---|---|---|---|---|---|---|
| Certificate or diploma | 30 | 35 | 17 | 9 | 4 | 2 | 3 | 100 |
| Undergraduate | 18 | 18 | 15 | 13 | 12 | 10 | 13 | 100 |
| Master | 13 | 15 | 18 | 11 | 11 | 8 | 24 | 100 |
| Doctorate | 13 | 8 | 9 | 7 | 8 | 9 | 45 | 100 |
Table 1.2.4D Profile of loan balance distribution at time of leaving school for full-time students: LY 2017 to 2018 by Type of institution: Percent
| Type of institution | Less than $5,000 | $5,000 to $9,999 | $10,000 to $14,999 | $15,000 to $19,999 | $20,000 to $24,999 | $25,000 to $29,999 | $30,000 and over | Total |
|---|---|---|---|---|---|---|---|---|
| University | 18 | 18 | 15 | 12 | 12 | 10 | 15 | 100 |
| College | 34 | 29 | 16 | 9 | 5 | 3 | 4 | 100 |
| Private | 16 | 45 | 19 | 10 | 4 | 2 | 4 | 100 |
1.3 Repayment Assistance Plan (RAP)
Table 1.3.1 Number of RAP recipients by RAP stage and payment type
Table 1.3.1A Number of RAP recipients by RAP stage and payment type: Number
| RAP stage | LY 2013 to 2014 | LY 2014 to 2015 | LY 2015 to 2016 | LY 2016 to 2017 | LY 2017 to 2018 |
|---|---|---|---|---|---|
| All Stages- Total | 233,684 | 256,164 | 276,133 | 305,769 | 326,467 |
| All Stages - Zero Payment | 203,887 | 221,605 | 236,907 | 268,883 | 281,461 |
| All Stages - Affordable Payment | 29,797 | 34,559 | 39,226 | 36,886 | 45,006 |
| Stage 1- Total | 203,028 | 217,256 | 228,661 | 248,459 | 257,875 |
| Stage 1- Zero Payment | 178,479 | 189,208 | 197,829 | 218,183 | 221,627 |
| Stage 1- Affordable Payment | 24,549 | 28,048 | 30,832 | 30,276 | 36,248 |
| Stage 2- Total | 17,041 | 22,391 | 28,199 | 35,195 | 44,015 |
| Stage 2- Zero Payment | 13,613 | 17,985 | 22,540 | 30,760 | 37,996 |
| Stage 2- Affordable Payment | 3,428 | 4,406 | 5,659 | 4,435 | 6,019 |
| Permanent Disability- Total | 13,615 | 16,517 | 19,273 | 22,115 | 24,577 |
| Permanent Disability - Zero Payment | 11,795 | 14,412 | 16,538 | 19,940 | 21,838 |
| Permanent Disability - Affordable Payment | 1,820 | 2,105 | 2,735 | 2,175 | 2,739 |
Table 1.3.1B Number of RAP recipients by RAP stage and payment type: Percent
| RAP stage | LY 2013 to 2014 | LY 2014 to 2015 | LY 2015 to 2016 | LY 2016 to 2017 | LY 2017 to 2018 |
|---|---|---|---|---|---|
| All Stages- Total | 100 | 100 | 100 | 100 | 100 |
| All Stages - Zero Payment | 87 | 87 | 86 | 88 | 86 |
| All Stages - Affordable Payment | 13 | 13 | 14 | 12 | 14 |
| Stage 1- Total | 100 | 100 | 100 | 100 | 100 |
| Stage 1- Zero Payment | 88 | 87 | 87 | 88 | 86 |
| Stage 1- Affordable Payment | 12 | 13 | 13 | 12 | 14 |
| Stage 2- Total | 100 | 100 | 100 | 100 | 100 |
| Stage 2- Zero Payment | 80 | 80 | 80 | 87 | 86 |
| Stage 2- Affordable Payment | 20 | 20 | 20 | 13 | 14 |
| Permanent Disability- Total | 100 | 100 | 100 | 100 | 100 |
| Permanent Disability - Zero Payment | 87 | 87 | 86 | 90 | 89 |
| Permanent Disability - Affordable Payment | 13 | 13 | 14 | 10 | 11 |
Table 1.3.2 Profile of students benefiting from RAP
Table 1.3.2A Profile of students benefitting from RAP: LY 2017 to 2018 by Gender
| Gender | Number | Percent |
|---|---|---|
| Female | 213,390 | 65 |
| Male | 113,077 | 35 |
| Total | 326,467 | 100 |
Table 1.3.2B Profile of students benefitting from RAP: LY 2017 to 2018 by Age group
| Age group | Number | Percent |
|---|---|---|
| Younger than 20 years | 2,732 | 1 |
| 20 to 24 years | 76,810 | 24 |
| 25 to 29 years | 106,312 | 33 |
| 30 to 34 years | 63,012 | 19 |
| 35 to 39 years | 33,807 | 10 |
| 40 to 44 years | 17,577 | 5 |
| 45 to 49 years | 11,675 | 4 |
| 50 years and older | 14,542 | 4 |
| Total | 326,467 | 100 |
Table 1.3.2C Profile of students benefitting from RAP: LY 2017 to 2018 by Level of study
| Level of study | Number | Percent |
|---|---|---|
| Certificate or diploma | 175,771 | 54 |
| Undergraduate | 130,521 | 40 |
| Master | 16,840 | 5 |
| Doctorate | 3,335 | 1 |
| Total | 326,467 | 100 |
Table 1.3.2D Profile of students benefitting from RAP: LY 2017 to 2018 by Type of institution
| Type of institution | Number | Percent |
|---|---|---|
| University | 136,941 | 42 |
| College | 123,213 | 38 |
| Private | 66,313 | 20 |
| Total | 326,467 | 100 |
Table 1.3.3 First year RAP uptake rate for full-time students
| Item | LY 2013 to 2014 | LY 2014 to 2015 | LY 2015 to 2016 | LY 2016 to 2017 | LY 2017 to 2018 |
|---|---|---|---|---|---|
| Number of borrowers entering repayment | 198,613 | 203,732 | 203,909 | 201,516 | 203,459 |
| Number of borrowers on RAP during the first year in repayment | 54,727 | 56,660 | 56,620 | 62,053 | 59,510 |
| First year RAP uptake rate (percent) | 28 | 28 | 28 | 31 | 29 |
1.4 Loan Forgiveness
Table 1.4.1 Canada Student Loan Forgiveness for Family Doctors and Nurses by profession and by fiscal year
Table 1.4.1A Canada Student Loan Forgiveness for Family Doctors and Nurses by profession and by fiscal year: Number
| Profession | FY 2013 to 2014 | FY 2014 to 2015 | FY 2015 to 2016 | FY 2016 to 2017 | FY 2017 to 2018 |
|---|---|---|---|---|---|
| Family Doctor | 42 | 94 | 144 | 202 | 248 |
| Family Medicine Resident | 80 | 221 | 333 | 515 | 585 |
| Licensed Practical Nurse | 261 | 445 | 620 | 687 | 702 |
| Nurse Practitioner | 11 | 22 | 24 | 27 | 34 |
| Registered Nurse | 1,022 | 1,750 | 2,298 | 2,706 | 3,033 |
| Registered Practical Nurse | 120 | 238 | 333 | 426 | 459 |
| Registered Psychiatric Nurse | 44 | 79 | 101 | 119 | 134 |
| Total | 1,580 | 2,849 | 3,853 | 4,682 | 5,195 |
Table 1.4.1B Canada Student Loan Forgiveness for Family Doctors and Nurses by profession and by fiscal year: Amount Forgiven: Thousands of dollars
| Profession | FY 2013 to 2014 | FY 2014 to 2015 | FY 2015 to 2016 | FY 2016 to 2017 | FY 2017 to 2018 |
|---|---|---|---|---|---|
| Family Doctor | 331.8 | 757.5 | 1,068.8 | 1,403.2 | 1,764.6 |
| Family Medicine Resident | 634.0 | 1,738.4 | 2,561.7 | 3,984.7 | 4,580.9 |
| Licensed Practical Nurse | 1,016.3 | 1,735.8 | 2,230.7 | 2,562.6 | 2,619.9 |
| Nurse Practitioner | 44.0 | 83.3 | 79.8 | 97.7 | 128.3 |
| Registered Nurse | 4,007.1 | 6,808.0 | 8,899.3 | 10,501.4 | 11,621.3 |
| Registered Practical Nurse | 461.4 | 918.3 | 1,249.4 | 1,611.0 | 1,676.7 |
| Registered Psychiatric Nurse | 176.0 | 322.4 | 405.5 | 474.8 | 497.8 |
| Total | 6,670.5 | 12,363.8 | 16,495.2 | 20,635.5 | 22,889.5 |
Table 1.4.2 Canada Student Loan Forgiveness for Family Doctors and Nurses by place of work1 and by fiscal year
Table 1.4.2A Canada Student Loan Forgiveness for Family Doctors and Nurses by place of work1 and by fiscal year: Number
| Jurisdictions | FY 2013 to 2014 | FY 2014 to 2015 | FY 2015 to 2016 | FY 2016 to 2017 | FY 2017 to 2018 |
|---|---|---|---|---|---|
| Newfoundland and Labrador | 99 | 154 | 199 | 226 | 256 |
| Prince Edward Island | 36 | 59 | 80 | 104 | 102 |
| Nova Scotia | 154 | 290 | 435 | 509 | 602 |
| New Brunswick | 95 | 144 | 186 | 240 | 307 |
| Quebec | x | x | x | x | x |
| Ontario | 300 | 643 | 921 | 1,262 | 1,440 |
| Manitoba | 70 | 122 | 170 | 197 | 216 |
| Saskatchewan | 137 | 231 | 271 | 310 | 367 |
| Alberta | 230 | 443 | 595 | 690 | 710 |
| British Columbia | 404 | 675 | 878 | 1,011 | 1,052 |
| Yukon | 20 | 36 | 46 | 39 | 50 |
| Northwest Territories and Nunavut | x | x | x | x | x |
| Canada | 1,580 | 2,849 | 3,853 | 4,682 | 5,195 |
x: cells are suppressed to prevent statistical disclosure of number of recipients greater than 0 but less than 10.
1 Eligibility for the Canada Student Loan Forgiveness for Family Doctors and Nurses is based on the borrower's place of work, which can be different from where they live or where they borrowed their loans.
Table 1.4.2B Canada Student Loan Forgiveness for Family Doctors and Nurses by place of work1 and by fiscal year: Amount forgiven: Thousands of dollars
| Jurisdictions | FY 2013 to 2014 | FY 2014 to 2015 | FY 2015 to 2016 | FY 2016 to 2017 | FY 2017 to 2018 |
|---|---|---|---|---|---|
| Newfoundland and Labrador | 447.9 | 760.4 | 934.2 | 1,068.1 | 1,234.0 |
| Prince Edward Island | 159.7 | 261.2 | 347.9 | 436.0 | 443.5 |
| Nova Scotia | 643.1 | 1,208.9 | 1,873.0 | 2,164.0 | 2,544.1 |
| New Brunswick | 415.2 | 618.1 | 747.3 | 1,000.5 | 1,272.9 |
| Quebec | x | x | x | x | x |
| Ontario | 1,232.5 | 2,804.0 | 4,009.2 | 5,767.6 | 6,580.8 |
| Manitoba | 306.8 | 539.9 | 744.1 | 871.1 | 970.8 |
| Saskatchewan | 630.8 | 1,020.3 | 1,142.7 | 1,299.5 | 1,565.4 |
| Alberta | 961.1 | 1,905.9 | 2,539.2 | 3,044.2 | 3,103.6 |
| British Columbia | 1,659.8 | 2,850.3 | 3,636.9 | 4,345.6 | 4,503.2 |
| Yukon | 82.7 | 149.4 | 185.5 | 194.9 | 220.0 |
| Northwest Territories and Nunavut | x | x | x | x | x |
| Canada | 6,670.5 | 12,363.8 | 16,495.2 | 20,635.5 | 22,889.5 |
x: cells are suppressed to prevent statistical disclosure of number of recipients greater than 0 but less than 10.
1 Eligibility for the Canada Student Loan Forgiveness for Family Doctors and Nurses is based on the borrower's place of work, which can be different from where they live or where they borrowed their loans.
Table 1.4.3 Severe Permanent Disability Benefit1
| Item | LY 2013 to 2014 | LY 2014 to 2015 | LY 2015 to 2016 | LY 2016 to 2017 | LY 2017 to 2018 |
|---|---|---|---|---|---|
| Number of recipients | 550 | 545 | 706 | 577 | 503 |
| Total value of loans forgiven (millions of dollars) | 8.2 | 8.0 | 11.7 | 8.7 | 7.7 |
| Average value of loans forgiven (dollars) | 15,093 | 14,691 | 16,526 | 15,099 | 15,295 |
1 The data represents all loan balances at the beginning of the assessment process by CSLP for the purposes of the Severe Permanent
Disability Benefit.
1.5 Default rates
Table 1.5.1 3-year default rates for direct loans for full-time students
Table 1.5.1A 3-year default rates for direct loans for full-time students: Percent
| Item | LY 2012 to 2013 | LY 2013 to 2014 | LY 2014 to 2015 | LY 2015 to 2016 | LY 2016 to 2017 |
|---|---|---|---|---|---|
| Three year default rate for direct loans | 12 | 11 | 10 | 9 | 9 |
Table 1.5.1B 3-year default rates for direct loans for full-time students by Gender: Percent
| Gender | LY 2012 to 2013 | LY 2013 to 2014 | LY 2014 to 2015 | LY 2015 to 2016 | LY 2016 to 2017 |
|---|---|---|---|---|---|
| Female | 11 | 10 | 10 | 9 | 9 |
| Male | 13 | 12 | 11 | 10 | 10 |
Table 1.5.1C 3-year default rates for direct loans for full-time students by Age group: Percent
| Age group | LY 2012 to 2013 | LY 2013 to 2014 | LY 2014 to 2015 | LY 2015 to 2016 | LY 2016 to 2017 |
|---|---|---|---|---|---|
| Younger than 20 years | 23 | 21 | 20 | 19 | 19 |
| 20 to 24 years | 12 | 10 | 9 | 9 | 8 |
| 25 to 29 years | 10 | 9 | 9 | 8 | 8 |
| 30 to 34 years | 13 | 12 | 11 | 10 | 10 |
| 35 to 39 years | 15 | 13 | 13 | 11 | 11 |
| 40 to 44 years | 14 | 14 | 12 | 10 | 11 |
| 45 to 49 years | 14 | 13 | 13 | 11 | 10 |
| 50 years and older | 14 | 15 | 13 | 12 | 12 |
Table 1.5.1D 3-year default rates for direct loans for full-time students by Level of study: Percent
| Level of study | LY 2012 to 2013 | LY 2013 to 2014 | LY 2014 to 2015 | LY 2015 to 2016 | LY 2016 to 2017 |
|---|---|---|---|---|---|
| Certificate or diploma | 18 | 16 | 15 | 14 | 14 |
| Undergraduate | 8 | 7 | 6 | 6 | 6 |
| Master | 5 | 4 | 4 | 3 | 3 |
| Doctorate | 8 | 8 | 7 | 5 | 7 |
Table 1.5.1E 3-year default rates for direct loans for full-time students by Type of institution: Percent
| Type of institution | LY 2012 to 2013 | LY 2013 to 2014 | LY 2014 to 2015 | LY 2015 to 2016 | LY 2016 to 2017 |
|---|---|---|---|---|---|
| University | 8 | 7 | 6 | 6 | 6 |
| College | 14 | 13 | 12 | 11 | 11 |
| Private | 22 | 21 | 19 | 18 | 17 |
1.6 Loan Portfolio
Table 1.6.1 Overall portfolio by loan regime at the end of the fiscal year: Millions of dollars
| Item | FY 2013 to 2014 | FY 2014 to 2015 | FY 2015 to 2016 | FY 2016 to 2017 | FY 2017 to 2018 |
|---|---|---|---|---|---|
| Total | 15,699.9 | 16,417.5 | 16,984.1 | 17,476.4 | 18,490.5 |
| Total- In study | 6,664.2 | 6,888.2 | 7,006.2 | 7,050.6 | 7,719.4 |
| Total- In repayment | 9,035.8 | 9,529.4 | 9,977.9 | 10,425.8 | 10,771.1 |
| Guaranteed Loans- Total | 11.5 | 7.9 | 5.5 | 3.9 | 2.8 |
| Guaranteed Loans- In study | 1.4 | 1.1 | 0.8 | 0.6 | 0.4 |
| Guaranteed Loans- In repayment | 10.1 | 6.8 | 4.7 | 3.3 | 2.4 |
| Risk Shared Loans- Total | 1,193.0 | 1,086.2 | 966.9 | 905.6 | 794.9 |
| Risk Shared Loans- In study | 13.0 | 9.3 | 5.8 | 3.9 | 2.3 |
| Risk Shared Loans- In repayment | 1,180.0 | 1,076.9 | 961.1 | 901.7 | 792.6 |
| Direct Loans- Total | 14,495.5 | 15,323.4 | 16,011.6 | 16,566.9 | 17,692.8 |
| Direct Loans- In study | 6,649.8 | 6,877.7 | 6,999.5 | 7,046.1 | 7,716.7 |
| Direct Loans- In repayment | 7,845.7 | 8,445.7 | 9,012.1 | 9,520.8 | 9,976.1 |
Table 1.6.2 Direct loan portfolio at the end of loan year
Table 1.6.2A Direct loan portfolio at the end of loan year: Number of borrowers
| Loan status | LY 2013 to 2014 | LY 2014 to 2015 | LY 2015 to 2016 | LY 2016 to 2017 | LY 2017 to 2018 |
|---|---|---|---|---|---|
| In study | 517,187 | 519,004 | 519,627 | 522,982 | 585,374 |
| In repayment | 743,479 | 773,592 | 806,822 | 841,406 | 868,041 |
| In repayment- Current | 547,437 | 554,955 | 572,788 | 581,790 | 580,096 |
| In repayment-RAP | 133,504 | 159,336 | 171,855 | 201,802 | 209,428 |
| In repayment-Delinquency | 62,538 | 59,301 | 62,179 | 57,814 | 78,517 |
| In default | 322,319 | 315,593 | 325,634 | 338,044 | 344,880 |
| Total direct loan portfolio | 1,582,985 | 1,608,189 | 1,652,083 | 1,702,432 | 1,798,295 |
Table 1.6.2B Direct loan portfolio at the end of loan year: Millions of dollars
| Loan status | LY 2013 to 2014 | LY 2014 to 2015 | LY 2015 to 2016 | LY 2016 to 2017 | LY 2017 to 2018 |
|---|---|---|---|---|---|
| In study | 6,251.7 | 6,473.4 | 6,589.3 | 6,625.8 | 7,379.3 |
| In repayment | 7,776.1 | 8,360.9 | 8,981.3 | 9,398.9 | 9,770.1 |
| In repayment- Current | 4,852.8 | 5,022.7 | 5,352.1 | 5,333.4 | 5,322.6 |
| In repayment-RAP | 2,258.0 | 2,700.1 | 2,945.8 | 3,429.7 | 3,588.6 |
| In repayment-Delinquency | 665.2 | 638.1 | 683.3 | 635.8 | 858.9 |
| In default | 2,099.1 | 2,073.0 | 2,125.9 | 2,149.1 | 2,148.3 |
| Total direct loan portfolio | 16,126.9 | 16,907.3 | 17,696.5 | 18,173.8 | 19,297.6 |
2 Provinces and Territories
2.1 Student Financial Assistance: Grants, Loans and Interest Subsidies
Table 2.1.1 Student financial assistance by type
Table 2.1.1A Student financial assistance by type: LY 2017 to 2018: Number of recipients1
| Type | Canada | N.L. | P.E.I. | N.S. | N.B. | Ont. | Man. | Sask. | Alta. | B.C. | Y.T. |
|---|---|---|---|---|---|---|---|---|---|---|---|
| Total student financial assistance2 (SFA) | 705,152 | 7,182 | 3,479 | 19,890 | 15,838 | 462,525 | 13,924 | 16,757 | 94,092 | 71,185 | 280 |
| SFA- Full-time students | 695,039 | x | 3,128 | 19,783 | 15,771 | 457,909 | 13,662 | 16,618 | 92,701 | 68,050 | x |
| SFA- Part-time students | 24,466 | x | 637 | 243 | 123 | 14,276 | 360 | 237 | 2,647 | 5,832 | x |
| Canada Student Grant / Canada Student Loan3 (CSG/CSL) | 628,935 | 6,080 | 3,052 | 17,478 | 14,125 | 420,008 | 11,291 | 15,135 | 81,711 | 59,819 | 236 |
| CSG/CSL- Full-time students3 | 618,602 | x | 2,686 | 17,370 | 14,058 | 415,284 | 11,027 | 14,995 | 80,301 | 56,612 | x |
| CSG/CSL- Part-time students3 | 24,359 | x | 636 | 239 | 122 | 14,225 | 359 | 237 | 2,638 | 5,792 | x |
| Canada Student Grant (CSG) | 490,377 | 4,875 | 2,514 | 13,763 | 10,585 | 331,701 | 9,306 | 12,168 | 58,230 | 47,062 | 173 |
| CSG- Full-time students4 | 480,904 | x | 2,123 | 13,677 | 10,529 | 327,192 | 9,106 | 12,087 | 57,143 | 44,038 | x |
| CSG- Part-time students5 | 21,268 | x | 620 | 186 | 99 | 12,627 | 281 | 160 | 1,940 | 5,267 | x |
| Canada Student Loan (CSL) | 592,091 | 5,956 | 2,565 | 17,261 | 13,866 | 392,484 | 9,724 | 14,882 | 79,265 | 55,895 | 193 |
| CSL- Full-time students | 585,019 | x | 2,549 | 17,164 | 13,818 | 388,408 | 9,493 | 14,764 | 78,120 | 54,585 | x |
| CSL- Part-time students | 13,534 | x | 32 | 164 | 72 | 8,604 | 259 | 137 | 1,980 | 2,235 | x |
| In-study interest subsidy | 668,308 | 7,058 | 2,992 | 19,673 | 15,579 | 435,003 | 12,358 | 16,503 | 91,644 | 67,261 | 237 |
| In-study interest subsidy- Full-time students | 661,456 | x | 2,991 | 19,577 | 15,531 | 431,035 | 12,129 | 16,387 | 90,518 | 66,022 | x |
| In-study interest subsidy- Part-time students | 13,641 | x | 33 | 168 | 73 | 8,655 | 261 | 137 | 1,989 | 2,274 | x |
x: cells are suppressed to prevent statistical disclosure of number of recipients greater than 0 but less than 10.
1 The number of recipients do not sum to the total, as some recipients can receive multiple products (grants and/or loans and/or in-study interest subsidy) in the same year.
2 Student financial assistance is any form of financial aid provided by the Canada Student Loans Program to students while they enroll in designated post-secondary education institutions, including Canada Student Grants, Canada Student Loans and in-study interest subsidy.
3 Includes students who receive a Canada Student Grant and/or a Canada Student Loan.
4 Includes Canada Student Grant for Full-Time Students, for Full-Time Students with Dependants, for Students with Permanent Disabilities, for Services and Equipment for Students with Permanent Disabilities.
5 Includes Canada Student Grant for Part-Time Studies and for Part-Time Students with Dependants.
Table 2.1.1B Student financial assistance by type: LY 2017 to 2018: Millions of dollars
| Type | Canada | N.L. | P.E.I. | N.S. | N.B. | Ont. | Man. | Sask. | Alta. | B.C. | Y.T. |
|---|---|---|---|---|---|---|---|---|---|---|---|
| Total student financial assistance6 (SFA) | N/A | N/A | N/A | N/A | N/A | N/A | N/A | N/A | N/A | N/A | N/A |
| SFA- Full-time students6 | N/A | N/A | N/A | N/A | N/A | N/A | N/A | N/A | N/A | N/A | N/A |
| SFA- Part-time students6 | N/A | N/A | N/A | N/A | N/A | N/A | N/A | N/A | N/A | N/A | N/A |
| Canada Student Grant / Canada Student Loan3 (CSG/CSL) | 4,717.0 | 52.0 | 23.3 | 165.5 | 96.8 | 3,045.6 | 69.4 | 131.9 | 655.8 | 474.9 | 1.8 |
| CSG/CSL- Full-time students3 | 4,661.0 | x | 22.4 | 164.9 | 96.6 | 3,011.5 | 68.3 | 131.1 | 650.2 | 462.5 | x |
| CSG/CSL- Part-time students3 | 56.0 | x | 0.9 | 0.6 | 0.3 | 34.1 | 1.1 | 0.8 | 5.6 | 12.5 | x |
| Canada Student Grant (CSG) | 1,364.9 | 14.9 | 7.2 | 42.6 | 29.9 | 903.7 | 27.7 | 38.2 | 168.7 | 131.5 | 0.5 |
| CSG- Full-time students4 | 1,331.9 | x | 6.4 | 42.2 | 29.8 | 883.6 | 27.3 | 37.9 | 166.6 | 123.0 | x |
| CSG- Part-time students5 | 33.0 | x | 0.8 | 0.3 | 0.2 | 20.2 | 0.5 | 0.3 | 2.1 | 8.6 | x |
| Canada Student Loan (CSL) | 3,352.1 | 37.1 | 16.1 | 123.0 | 66.9 | 2,141.9 | 41.6 | 93.7 | 487.1 | 343.4 | 1.3 |
| CSL- Full-time students | 3,329.1 | x | 16.1 | 122.7 | 66.8 | 2,127.9 | 41.0 | 93.2 | 483.7 | 339.5 | x |
| CSL- Part-time students | 23.0 | x | 0.1 | 0.3 | 0.1 | 13.9 | 0.7 | 0.5 | 3.4 | 3.9 | x |
| In-study interest subsidy7 | N/A | N/A | N/A | N/A | N/A | N/A | N/A | N/A | N/A | N/A | N/A |
| In-study interest subsidy- Full-time students7 | N/A | N/A | N/A | N/A | N/A | N/A | N/A | N/A | N/A | N/A | N/A |
| In-study interest subsidy- Part-time students7 | N/A | N/A | N/A | N/A | N/A | N/A | N/A | N/A | N/A | N/A | N/A |
x: cells are suppressed to prevent statistical disclosure of number of recipients greater than 0 but less than 10.
3 Includes students who receive a Canada Student Grant and/or a Canada Student Loan.
4 Includes Canada Student Grant for Full-Time Students, for Full-Time Students with Dependants, for Students with Permanent Disabilities, for Services and Equipment for Students with Permanent Disabilities.
5 Includes Canada Student Grant for Part-Time Studies and for Part-Time Students with Dependants
6 The dollar amount of total student financial assistance (SFA), SFA for full-time students and SFA for part-time students are not available because one of its components, in-study interest subsidy, has no dollar value.
7 The dollar value for in-study interest subsidies is not available.
Table 2.1.2 Canada Student Grants for full-time and part-time students by type
Table 2.1.2A Canada Student Grants for full-time and part-time students by type: LY 2017 to 2018: Number of recipients
| Jurisdiction | Canada Student Grant for Full-Time Students | Canada Student Grant for Full-Time Students with Dependants | Canada Student Grant for Students with Permanent Disabilities | Canada Student Grant for Services and Equipment for Students with Permanent Disabilities | Canada Student Grant for Part-Time Studies | Canada Student Grant for Part-Time Students with Dependants | Total1 |
|---|---|---|---|---|---|---|---|
| Newfoundland and Labrador | 4,506 | 364 | 701 | 257 | x | 0 | 4,875 |
| Prince Edward Island | 1,991 | 83 | 352 | x | 620 | 0 | 2,514 |
| Nova Scotia | 12,799 | 923 | 2,086 | 981 | 186 | x | 13,763 |
| New Brunswick | 9,924 | 758 | 981 | 436 | 99 | x | 10,585 |
| Ontario | 308,634 | 25,613 | 31,932 | 5,397 | 12,622 | 195 | 331,701 |
| Manitoba | 8,568 | 1,078 | 608 | 310 | 281 | 21 | 9,306 |
| Saskatchewan | 11,339 | 1,539 | 1,441 | 447 | 159 | 39 | 12,168 |
| Alberta | 51,811 | 7,397 | 4,381 | 1,358 | 1,939 | 42 | 58,230 |
| British Columbia | 41,561 | 2,753 | 3,939 | 1,203 | 5,267 | 70 | 47,062 |
| Yukon | 163 | 15 | 11 | x | x | 0 | 173 |
| Canada | 451,296 | 40,523 | 46,432 | 10,550 | 21,261 | 376 | 490,377 |
x: cells are suppressed to prevent statistical disclosure of number of recipients greater than 0 but less than 10.
1 The number of recipients do not sum to the total, as some recipients can receive more than one grant in the same year.
Table 2.1.2B Canada Student Grants for full-time and part-time students by type: LY 2017 to 2018: Millions of dollars
| Jurisdiction | Canada Student Grant for Full-Time Students | Canada Student Grant for Full-Time Students with Dependants | Canada Student Grant for Students with Permanent Disabilities | Canada Student Grant for Services and Equipment for Students with Permanent Disabilities | Canada Student Grant for Part-Time Studies | Canada Student Grant for Part-Time Students with Dependants | Total |
|---|---|---|---|---|---|---|---|
| Newfoundland and Labrador | 11.5 | 0.8 | 1.4 | 1.1 | x | 0.0 | 14.9 |
| Prince Edward Island | 5.0 | 0.2 | 0.7 | x | 0.8 | 0.0 | 7.2 |
| Nova Scotia | 33.6 | 2.4 | 4.2 | 2.0 | 0.3 | x | 42.6 |
| New Brunswick | 25.2 | 1.7 | 1.8 | 1.1 | 0.2 | x | 29.9 |
| Ontario | 750.7 | 64.8 | 60.0 | 8.1 | 20.0 | 0.2 | 903.7 |
| Manitoba | 22.1 | 2.8 | 1.2 | 1.3 | 0.4 | 0.0s | 27.7 |
| Saskatchewan | 29.2 | 4.3 | 2.8 | 1.6 | 0.3 | 0.0s | 38.2 |
| Alberta | 135.9 | 18.9 | 8.5 | 3.3 | 2.1 | 0.0s | 168.7 |
| British Columbia | 105.5 | 6.6 | 7.8 | 3.1 | 8.5 | 0.1 | 131.5 |
| Yukon | 0.4 | 0.0s | 0.0s | x | x | 0.0 | 0.5 |
| Canada | 1,118.9 | 102.6 | 88.3 | 22.0 | 32.6 | 0.4 | 1,364.9 |
x: cells are suppressed to prevent statistical disclosure of number of recipients greater than 0 but less than 10.
0.0s: value rounded to 0.0 (zero).
Table 2.1.3 Profile of students who received Canada Student Grants and/or Canada Student Loans
Table 2.1.3A Profile of students who received Canada Student Grants and/or Canada Student Loans: LY 2017 to 2018 by Gender: Percent
| Gender | Canada | N.L. | P.E.I. | N.S. | N.B. | Ont. | Man. | Sask. | Alta. | B.C. | Y.T. |
|---|---|---|---|---|---|---|---|---|---|---|---|
| Female | 59 | 64 | 62 | 62 | 61 | 58 | 63 | 64 | 62 | 61 | 69 |
| Male | 41 | 36 | 38 | 38 | 39 | 42 | 37 | 36 | 38 | 39 | 31 |
| Total | 100 | 100 | 100 | 100 | 100 | 100 | 100 | 100 | 100 | 100 | 100 |
Table 2.1.3B Profile of students who received Canada Student Grants and/or Canada Student Loans: LY 2017 to 2018 by Age group: Percent
| Age group | Canada | N.L. | P.E.I. | N.S. | N.B. | Ont. | Man. | Sask. | Alta. | B.C. | Y.T. |
|---|---|---|---|---|---|---|---|---|---|---|---|
| Younger than 20 years | 29 | 29 | 35 | 31 | 34 | 32 | 23 | 23 | 18 | 19 | 10 |
| 20 to 24 years | 45 | 47 | 45 | 45 | 43 | 45 | 42 | 43 | 42 | 44 | 38 |
| 25 to 29 years | 14 | 17 | 13 | 15 | 12 | 11 | 18 | 18 | 18 | 20 | 24 |
| 30 to 34 years | 5 | 4 | 3 | 4 | 4 | 4 | 8 | 8 | 9 | 8 | 16 |
| 35 to 39 years | 3 | 2 | 2 | 2 | 2 | 3 | 4 | 4 | 6 | 4 | 6 |
| 40 to 44 years | 2 | 1 | x | 1 | 2 | 2 | 3 | 2 | 4 | 3 | x |
| 45 to 49 years | 1 | 1 | x | 1 | 1 | 1 | 1 | 1 | 2 | 1 | x |
| 50 years and older | 1 | 0s | x | 1 | 1 | 1 | 1 | 1 | 2 | 1 | x |
| Total | 100 | 100 | 100 | 100 | 100 | 100 | 100 | 100 | 100 | 100 | 100 |
x: cells are suppressed to prevent statistical disclosure of number of recipients greater than 0 but less than 10.
0s: value rounded to 0 (zero).
Table 2.1.3C Profile of students who received Canada Student Grants and/or Canada Student Loans: LY 2017 to 2018 by Level of study: Percent
| Level of study | Canada | N.L. | P.E.I. | N.S. | N.B. | Ont. | Man. | Sask. | Alta. | B.C. | Y.T. |
|---|---|---|---|---|---|---|---|---|---|---|---|
| Certificate or diploma | 36 | 43 | 28 | 36 | 40 | 34 | 30 | 28 | 42 | 38 | 30 |
| Undergraduate | 59 | 52 | 68 | 60 | 56 | 60 | 66 | 68 | 53 | 57 | 59 |
| Master | 4 | 4 | x | 4 | 3 | 4 | 3 | 3 | 4 | 4 | x |
| Doctorate | 1 | 1 | x | 1 | 0s | 1 | 0s | 1 | 1 | 1 | x |
| Total | 100 | 100 | 100 | 100 | 100 | 100 | 100 | 100 | 100 | 100 | 100 |
x: cells are suppressed to prevent statistical disclosure of number of recipients greater than 0 but less than 10.
0s: value rounded to 0 (zero).
Table 2.1.3D Profile of students who received Canada Student Grants and/or Canada Student Loans: LY 2017 to 2018 by Type of institution: Percent
| Type of institution | Canada | N.L. | P.E.I. | N.S. | N.B. | Ont. | Man. | Sask. | Alta. | B.C. | Y.T. |
|---|---|---|---|---|---|---|---|---|---|---|---|
| University | 57 | 56 | 71 | 64 | 59 | 59 | 66 | 69 | 42 | 60 | 50 |
| College | 34 | 27 | 23 | 25 | 26 | 36 | 19 | 22 | 38 | 24 | 42 |
| Private | 9 | 17 | 5 | 10 | 15 | 6 | 16 | 9 | 20 | 16 | 8 |
| Total | 100 | 100 | 100 | 100 | 100 | 100 | 100 | 100 | 100 | 100 | 100 |
Table 2.1.4 Average age of students who received student financial assistance: LY 2017 to 2018
| Student financial assistance | Canada | N.L. | P.E.I. | N.S. | N.B. | Ont. | Man. | Sask. | Alta. | B.C. | Y.T. |
|---|---|---|---|---|---|---|---|---|---|---|---|
| Total student financial assistance | 24 | 23 | 23 | 23 | 23 | 23 | 25 | 24 | 26 | 25 | 27 |
| Canada Student Grant / Canada Student Loan (CSG/CSL) | 23 | 23 | 22 | 23 | 23 | 23 | 24 | 24 | 26 | 25 | 27 |
| CSG/CSL- Full-time students | 23 | 23 | 22 | 23 | 23 | 23 | 24 | 24 | 25 | 25 | 27 |
| CSG/CSL- Part-time students | 25 | 25 | 21 | 25 | 25 | 24 | 29 | 28 | 28 | 25 | 29 |
| Canada Student Grant (CSG) | 23 | 23 | 22 | 23 | 23 | 23 | 24 | 24 | 25 | 24 | 26 |
| CSG- Full-time students | 23 | 23 | 22 | 23 | 23 | 23 | 24 | 24 | 25 | 24 | 26 |
| CSG- Part-time students | 24 | 24 | 21 | 24 | 24 | 23 | 28 | 27 | 27 | 25 | 24 |
| Canada Student Loan (CSL) | 23 | 23 | 22 | 23 | 23 | 23 | 24 | 24 | 25 | 25 | 27 |
| CSL- Full-time students | 23 | 23 | 22 | 23 | 23 | 23 | 24 | 24 | 25 | 25 | 27 |
| CSL- Part-time students | 26 | 26 | 27 | 26 | 26 | 25 | 30 | 31 | 28 | 26 | 31 |
| Entering repayment | 26 | 24 | 25 | 25 | 25 | 25 | 27 | 26 | 28 | 27 | 28 |
| Repayment assistance plan | 30 | 29 | 28 | 28 | 29 | 30 | 32 | 31 | 31 | 32 | 32 |
| Canada Apprentice Loan | 28 | 29 | 26 | 28 | 28 | 28 | 28 | 28 | 29 | 28 | 31 |
Table 2.1.5 Canada Apprentice Loan
Table 2.1.5A Canada Apprentice Loan: Number of recipients
| Jurisdiction | LY 2014 to 20151 | LY 2015 to 2016 | LY 2016 to 2017 | LY 2017 to 2018 |
|---|---|---|---|---|
| Newfoundland and Labrador | 124 | 261 | 245 | 136 |
| Prince Edward Island | 22 | 71 | 83 | 81 |
| Nova Scotia | 266 | 520 | 503 | 555 |
| New Brunswick | 335 | 485 | 496 | 498 |
| Ontario | 1,210 | 2,072 | 1,974 | 1,820 |
| Manitoba | 440 | 1,031 | 954 | 934 |
| Saskatchewan | 438 | 1,095 | 952 | 866 |
| Alberta | 3,562 | 7,975 | 7,152 | 6,097 |
| British Columbia | 1,670 | 2,860 | 2,884 | 2,893 |
| Yukon | 13 | 25 | 32 | 24 |
| Northwest Territories | x | x | x | x |
| Nunavut | x | x | x | x |
| Canada | 8,095 | 16,422 | 15,310 | 13,955 |
x: cells are suppressed to prevent statistical disclosure of number of recipients greater than 0 but less than 10.
1 The Canada Apprentice Loan program came into effect on January 1st, 2015 and this program is calculated by the loan year. The 2014 to 2015 loan year reports on the period from January 1st, 2015 to July 31st, 2015.
Table 2.1.5B Canada Apprentice Loan: Millions of dollars
| Jurisdiction | LY 2014 to 20151 | LY 2015 to 2016 | LY 2016 to 2017 | LY 2017 to 2018 |
|---|---|---|---|---|
| Newfoundland and Labrador | 0.5 | 1.1 | 1.1 | 0.6 |
| Prince Edward Island | 0.1 | 0.3 | 0.3 | 0.3 |
| Nova Scotia | 1.1 | 2.3 | 2.3 | 2.5 |
| New Brunswick | 1.3 | 1.9 | 2.0 | 2.0 |
| Ontario | 4.8 | 8.5 | 8.1 | 7.4 |
| Manitoba | 1.7 | 4.1 | 3.8 | 3.7 |
| Saskatchewan | 1.7 | 4.3 | 3.8 | 3.4 |
| Alberta | 14.2 | 33.9 | 31.1 | 26.0 |
| British Columbia | 6.8 | 12.6 | 12.7 | 12.5 |
| Yukon | 0.1 | 0.1 | 0.1 | 0.1 |
| Northwest Territories | x | x | x | x |
| Nunavut | x | x | x | x |
| Canada | 32.3 | 69.4 | 65.6 | 58.8 |
x: cells are suppressed to prevent statistical disclosure of number of recipients greater than 0 but less than 10.
1 The Canada Apprentice Loan program came into effect on January 1st, 2015 and this program is calculated by the loan year. The 2014 to 2015 loan year reports on the period from January 1st, 2015 to July 31st, 2015.
2.2 Loan Balance
Table 2.2.1 Number of full-time students leaving school and their average loan balance at time of leaving school
Table 2.2.1A Number of full-time students leaving school and their average loan balance at time of leaving school: Number1
| Jurisdiction | LY 2013 to 2014 | LY 2014 to 2015 | LY 2015 to 2016 | LY 2016 to 2017 | LY 2017 to 2018 |
|---|---|---|---|---|---|
| Newfoundland and Labrador | 3,340 | 3,190 | 3,052 | 3,047 | 2,863 |
| Prince Edward Island | 1,454 | 1,407 | 1,341 | 1,166 | 1,145 |
| Nova Scotia | 7,145 | 7,473 | 7,284 | 7,384 | 7,373 |
| New Brunswick | 6,427 | 6,232 | 5,627 | 5,383 | 5,861 |
| Ontario | 118,452 | 124,131 | 125,750 | 122,483 | 121,575 |
| Manitoba | 5,131 | 5,136 | 5,127 | 5,064 | 5,164 |
| Saskatchewan | 5,204 | 4,908 | 5,046 | 5,084 | 5,336 |
| Alberta | 23,429 | 23,445 | 23,731 | 26,090 | 29,223 |
| British Columbia | 27,932 | 27,711 | 26,864 | 25,709 | 24,833 |
| Yukon | 99 | 99 | 87 | 106 | 86 |
| Canada | 198,613 | 203,732 | 203,909 | 201,516 | 203,459 |
1 Number of students leaving school.
Table 2.2.1B Number of full-time students leaving school and their average loan balance at time of leaving school: dollars
| Jurisdiction | LY 2013 to 2014 | LY 2014 to 2015 | LY 2015 to 2016 | LY 2016 to 2017 | LY 2017 to 2018 |
|---|---|---|---|---|---|
| Newfoundland and Labrador | 11,320 | 11,001 | 11,134 | 10,587 | 11,249 |
| Prince Edward Island | 16,823 | 16,741 | 17,704 | 17,749 | 17,349 |
| Nova Scotia | 16,602 | 16,534 | 17,090 | 16,855 | 17,358 |
| New Brunswick | 12,614 | 12,916 | 13,806 | 13,576 | 12,192 |
| Ontario | 12,240 | 12,657 | 13,308 | 13,604 | 13,697 |
| Manitoba | 8,972 | 9,263 | 9,710 | 9,853 | 9,642 |
| Saskatchewan | 13,389 | 13,750 | 14,279 | 14,415 | 14,353 |
| Alberta | 11,853 | 11,975 | 12,142 | 11,830 | 11,538 |
| British Columbia | 13,328 | 13,477 | 13,728 | 14,079 | 14,027 |
| Yukon | 12,239 | 10,968 | 11,118 | 11,336 | 12,488 |
| Canada | 12,480 | 12,783 | 13,306 | 13,456 | 13,416 |
Table 2.2.2 Distribution of loan balance at time of leaving school for full-time students: LY 2017 to 2018: percent
| Jurisdiction | Less than $5,000 | $5,000 to $9,999 | $10,000 to $14,999 | $15,000 to $19,999 | $20,000 to $24,999 | $25,000 to $29,999 | $30,000 and over | Total |
|---|---|---|---|---|---|---|---|---|
| Newfoundland and Labrador | 27 | 31 | 15 | 11 | 7 | 5 | 4 | 100 |
| Prince Edward Island | 13 | 27 | 16 | 10 | x | x | x | 100 |
| Nova Scotia | 9 | 28 | 17 | 13 | 9 | 8 | 17 | 100 |
| New Brunswick | 30 | 27 | 13 | 10 | 6 | 5 | 9 | 100 |
| Ontario | 24 | 24 | 16 | 11 | 9 | 7 | 9 | 100 |
| Manitoba | 34 | 33 | 14 | 7 | 4 | 3 | 4 | 100 |
| Saskatchewan | 18 | 31 | 15 | 10 | 8 | 6 | 11 | 100 |
| Alberta | 27 | 32 | 16 | 10 | 6 | 4 | 6 | 100 |
| British Columbia | 21 | 29 | 16 | 11 | 8 | 5 | 11 | 100 |
| Yukon | 22 | 31 | 14 | 16 | x | x | x | 100 |
| Canada | 24 | 26 | 16 | 11 | 8 | 6 | 9 | 100 |
x: cells are suppressed to prevent statistical disclosure of number of recipients greater than 0 but less than 10.
2.3 Repayment Assistance Plan (RAP)
Table 2.3.1 Number of RAP recipients by RAP stage and payment type
Table 2.3.1A Number of RAP recipients by RAP stage and payment type: LY 2017 to 2018: Number
| RAP stage | Canada | N.L. | P.E.I. | N.S. | N.B. | Ont. | Man. | Sask. | Alta. | B.C. | Y.T. |
|---|---|---|---|---|---|---|---|---|---|---|---|
| All Stages | 326,467 | 5,163 | 2,220 | 15,243 | 14,485 | 200,710 | 4,658 | 5,913 | 35,247 | 42,738 | 90 |
| All Stages - Zero Payment | 281,461 | 4,447 | 1,845 | 12,819 | 11,650 | 175,389 | 4,243 | 4,996 | 30,343 | 35,653 | 76 |
| All Stages - Affordable Payment | 45,006 | 716 | 375 | 2,424 | 2,835 | 25,321 | 415 | 917 | 4,904 | 7,085 | 14 |
| Stage 1 | 257,875 | 3,852 | 1,721 | 11,682 | 10,461 | 157,446 | 3,839 | 4,503 | 31,094 | 33,200 | 77 |
| Stage 1- Zero Payment | 221,627 | 3,320 | 1,436 | 9,859 | 8,458 | 136,885 | 3,504 | 3,833 | 26,703 | 27,563 | 66 |
| Stage 1- Affordable Payment | 36,248 | 532 | 285 | 1,823 | 2,003 | 20,561 | 335 | 670 | 4,391 | 5,637 | 11 |
| Stage 2 | 44,015 | 1,001 | x | 2,283 | 3,263 | 26,692 | 548 | 705 | 2,430 | 6,748 | x |
| Stage 2- Zero Payment | 37,996 | 834 | x | 1,832 | 2,528 | 23,631 | 489 | 575 | 2,145 | 5,683 | x |
| Stage 2- Affordable Payment | 6,019 | 167 | x | 451 | 735 | 3,061 | 59 | 130 | 285 | 1,065 | x |
| Permanent Disability | 24,577 | 310 | x | 1,278 | 761 | 16,572 | 271 | 705 | 1,723 | 2,790 | x |
| Permanent Disability - Zero Payment | 21,838 | 293 | x | 1,128 | 664 | 14,873 | 250 | 588 | 1,495 | 2,407 | x |
| Permanent Disability - Affordable Payment | 2,739 | 17 | x | 150 | 97 | 1,699 | 21 | 117 | 228 | 383 | x |
x: cells are suppressed to prevent statistical disclosure of number of recipients greater than 0 but less than 10.
Table 2.3.1B Number of RAP recipients by RAP stage and payment type: LY 2017 to 2018: Percent
| RAP stage | Canada | N.L. | P.E.I. | N.S. | N.B. | Ont. | Man. | Sask. | Alta. | B.C. | Y.T. |
|---|---|---|---|---|---|---|---|---|---|---|---|
| All Stages | 100 | 100 | 100 | 100 | 100 | 100 | 100 | 100 | 100 | 100 | 100 |
| All Stages - Zero Payment | 86 | 86 | 83 | 84 | 80 | 87 | 91 | 84 | 86 | 83 | 84 |
| All Stages - Affordable Payment | 14 | 14 | 17 | 16 | 20 | 13 | 9 | 16 | 14 | 17 | 16 |
| Stage 1 | 100 | 100 | 100 | 100 | 100 | 100 | 100 | 100 | 100 | 100 | 100 |
| Stage 1- Zero Payment | 86 | 86 | 83 | 84 | 81 | 87 | 91 | 85 | 86 | 83 | 86 |
| Stage 1- Affordable Payment | 14 | 14 | 17 | 16 | 19 | 13 | 9 | 15 | 14 | 17 | 14 |
| Stage 2 | 100 | 100 | x | 100 | 100 | 100 | 100 | 100 | 100 | 100 | x |
| Stage 2- Zero Payment | 86 | 83 | x | 80 | 77 | 89 | 89 | 82 | 88 | 84 | x |
| Stage 2- Affordable Payment | 14 | 17 | x | 20 | 23 | 11 | 11 | 18 | 12 | 16 | x |
| Permanent Disability | 100 | 100 | x | 100 | 100 | 100 | 100 | 100 | 100 | 100 | x |
| Permanent Disability - Zero Payment | 89 | 95 | x | 88 | 87 | 90 | 92 | 83 | 87 | 86 | x |
| Permanent Disability - Affordable Payment | 11 | 5 | x | 12 | 13 | 10 | 8 | 17 | 13 | 14 | x |
x: cells are suppressed to prevent statistical disclosure of number of recipients greater than 0 but less than 10.
Table 2.3.2 Profile of students who were on RAP
Table 2.3.2A Profile of students who were on RAP: LY 2017 to 2018 by Gender: Percent
| Gender | Canada | N.L. | P.E.I. | N.S. | N.B. | Ont. | Man. | Sask. | Alta. | B.C. | Y.T. |
|---|---|---|---|---|---|---|---|---|---|---|---|
| Female | 65 | 69 | 74 | 72 | 69 | 64 | 67 | 70 | 68 | 66 | 67 |
| Male | 35 | 31 | 26 | 28 | 31 | 36 | 33 | 30 | 32 | 34 | 33 |
| Total | 100 | 100 | 100 | 100 | 100 | 100 | 100 | 100 | 100 | 100 | 100 |
Table 2.3.2B Profile of students who were on RAP: LY 2017 to 2018 by Age group: Percent
| Age group | Canada | N.L. | P.E.I. | N.S. | N.B. | Ont. | Man. | Sask. | Alta. | B.C. | Y.T. |
|---|---|---|---|---|---|---|---|---|---|---|---|
| Younger than 20 years | 1 | 1 | 1 | 1 | 1 | 1 | 1 | 1 | 1 | 1 | 0 |
| 20 to 24 years | 24 | 24 | x | 28 | 25 | 25 | 19 | 19 | 21 | 17 | x |
| 25 to 29 years | 33 | 34 | 39 | 36 | 34 | 33 | 27 | 29 | 31 | 30 | 33 |
| 30 to 34 years | 19 | 24 | 19 | 20 | 20 | 18 | 21 | 24 | 19 | 22 | 23 |
| 35 to 39 years | 10 | 11 | 8 | 8 | 10 | 9 | 14 | 14 | 12 | 13 | 18 |
| 40 to 44 years | 5 | 3 | x | 3 | 4 | 5 | 7 | 7 | 7 | 7 | x |
| 45 to 49 years | 4 | 1 | x | 2 | 2 | 4 | 5 | 3 | 4 | 4 | x |
| 50 years and older | 4 | 2 | x | 2 | 3 | 5 | 6 | 4 | 5 | 6 | x |
| Total | 100 | 100 | 100 | 100 | 100 | 100 | 100 | 100 | 100 | 100 | 100 |
x: cells are suppressed to prevent statistical disclosure of number of recipients greater than 0 but less than 10.
Table 2.3.2C Profile of students who were on RAP: LY 2017 to 2018 by Level of study: Percent
| Level of study | Canada | N.L. | P.E.I. | N.S. | N.B. | Ont. | Man. | Sask. | Alta. | B.C. | Y.T. |
|---|---|---|---|---|---|---|---|---|---|---|---|
| Certificate or diploma | 54 | 59 | 49 | 54 | 57 | 54 | 46 | 43 | 56 | 52 | 41 |
| Undergraduate | 40 | 38 | 45 | 41 | 39 | 40 | 48 | 51 | 38 | 41 | 48 |
| Master | 5 | x | 5 | 4 | 4 | 5 | 5 | 5 | 5 | 6 | x |
| Doctorate | 1 | x | 0s | 0s | 0s | 1 | 1 | 1 | 1 | 1 | x |
| Total | 100 | 100 | 100 | 100 | 100 | 100 | 100 | 100 | 100 | 100 | 100 |
x: cells are suppressed to prevent statistical disclosure of number of recipients greater than 0 but less than 10.
0s: value rounded to 0 (zero).
Table 2.3.2D Profile of students who were on RAP: LY 2017 to 2018 by Type of institution: Percent
| Type of institution | Canada | N.L. | P.E.I. | N.S. | N.B. | Ont. | Man. | Sask. | Alta. | B.C. | Y.T. |
|---|---|---|---|---|---|---|---|---|---|---|---|
| University | 42 | 40 | 50 | 46 | 41 | 41 | 50 | 54 | 32 | 48 | 41 |
| College | 38 | 29 | 32 | 31 | 29 | 44 | 20 | 26 | 33 | 23 | 46 |
| Private | 20 | 31 | 18 | 23 | 31 | 15 | 30 | 20 | 35 | 29 | 13 |
| Total | 100 | 100 | 100 | 100 | 100 | 100 | 100 | 100 | 100 | 100 | 100 |
Table 2.3.3 First year RAP uptake rate for full-time students: LY 2017 to 2018
| Jurisdiction | Number of borrowers entering repayment | Number of borrowers on RAP during the first year of repayment | First year RAP uptake rate |
|---|---|---|---|
| Newfoundland and Labrador | 2,864 | 742 | 26 |
| Prince Edward Island | 1,147 | 327 | 29 |
| Nova Scotia | 7,366 | 2,784 | 38 |
| New Brunswick | 5,866 | 2,027 | 35 |
| Ontario | 121,573 | 36,667 | 30 |
| Manitoba | 5,163 | 890 | 17 |
| Saskatchewan | 5,341 | 1,145 | 21 |
| Alberta | 29,225 | 8,291 | 28 |
| British Columbia | 24,828 | 6,619 | 27 |
| Yukon | 86 | 18 | 21 |
| Canada | 203,459 | 59,510 | 29 |
2.4 Default rates
Table 2.4.1 3-year default rates for direct loans for full-time students: Percent
| Jurisdiction | LY 2012 to 2013 | LY 2013 to 2014 | LY 2014 to 2015 | LY 2015 to 2016 | LY 2016 to 2017 |
|---|---|---|---|---|---|
| Newfoundland and Labrador | 10 | 9 | 10 | 9 | 8 |
| Prince Edward Island | 13 | 10 | 9 | 7 | 9 |
| Nova Scotia | 13 | 11 | 11 | 11 | 10 |
| New Brunswick | 13 | 10 | 10 | 10 | 9 |
| Ontario | 12 | 11 | 10 | 9 | 9 |
| Manitoba | 12 | 11 | 10 | 10 | 9 |
| Saskatchewan | 11 | 10 | 11 | 9 | 11 |
| Alberta | 12 | 11 | 11 | 11 | 11 |
| British Columbia | 11 | 10 | 9 | 8 | 7 |
| Yukon | x | 11 | x | 18 | 11 |
| Canada | 12 | 11 | 10 | 9 | 9 |
x: cells are suppressed to prevent statistical disclosure of number of borrowers greater than 0 but less than 10.
Table 2.4.2 Profile of 3-year default rates for direct loans for full-time students
Table 2.4.2A Profile of 3-year default rates for direct loans for full-time students: LY 2016 to 2017: Percent
| Item | Canada | N.L. | P.E.I. | N.S. | N.B. | Ont. | Man. | Sask. | Alta. | B.C. | Y.T. |
|---|---|---|---|---|---|---|---|---|---|---|---|
| Three-year default rate for direct loans | 9 | 8 | 9 | 10 | 9 | 9 | 9 | 11 | 11 | 7 | 11 |
Table 2.4.2B Profile of 3-year default rates for direct loans for full-time students: LY 2016 to 2017 by Gender: Percent
| Gender | Canada | N.L. | P.E.I. | N.S. | N.B. | Ont. | Man. | Sask. | Alta. | B.C. | Y.T. |
|---|---|---|---|---|---|---|---|---|---|---|---|
| Female | 9 | 8 | 9 | 9 | 8 | 8 | 8 | 11 | 11 | 7 | x |
| Male | 10 | 8 | 10 | 12 | 11 | 10 | 9 | 10 | 11 | 8 | x |
x: cells are suppressed to prevent statistical disclosure of number of borrowers greater than 0 but less than 10.
Table 2.4.2C Profile of 3-year default rates for direct loans for full-time students: LY 2016 to 2017 by Age group: Percent
| Age group | Canada | N.L. | P.E.I. | N.S. | N.B. | Ont. | Man. | Sask. | Alta. | B.C. | Y.T. |
|---|---|---|---|---|---|---|---|---|---|---|---|
| Younger than 20 years | 19 | 16 | 17 | 19 | 17 | 21 | 8 | 13 | 21 | 12 | x |
| 20 to 24 years | 8 | 8 | 10 | 11 | 8 | 8 | 9 | 7 | 10 | 7 | x |
| 25 to 29 years | 8 | 7 | 8 | 7 | 8 | 8 | 7 | 9 | 9 | 6 | x |
| 30 to 34 years | 10 | 7 | x | 12 | 11 | 10 | 10 | 18 | 13 | 5 | x |
| 35 to 39 years | 11 | 9 | x | 12 | 15 | 10 | 10 | 14 | 13 | 11 | x |
| 40 to 44 years | 11 | x | x | 17 | 17 | 10 | 11 | 20 | 14 | 9 | x |
| 45 to 49 years | 10 | x | x | 15 | 13 | 9 | x | 20 | 16 | 10 | x |
| 50 years and older | 12 | x | 0 | 11 | x | 11 | x | 25 | 16 | 12 | x |
x: cells are suppressed to prevent statistical disclosure of number of borrowers greater than 0 but less than 10.
Table 2.4.2D Profile of 3-year default rates for direct loans for full-time students: LY 2016 to 2017 by Level of study: Percent
| Level of study | Canada | N.L. | P.E.I. | N.S. | N.B. | Ont. | Man. | Sask. | Alta. | B.C. | Y.T. |
|---|---|---|---|---|---|---|---|---|---|---|---|
| Certificate or diploma | 14 | 12 | 15 | 16 | 15 | 13 | 11 | 16 | 18 | 11 | x |
| Undergraduate | 6 | 4 | 7 | 6 | 6 | 6 | 8 | 8 | 5 | 5 | x |
| Master | 3 | x | x | x | x | 3 | x | x | 3 | 3 | x |
| Doctorate | 7 | x | x | x | x | 7 | x | x | x | x | x |
x: cells are suppressed to prevent statistical disclosure of number of borrowers greater than 0 but less than 10.
Table 2.4.2E Profile of 3-year default rates for direct loans for full-time students: LY 2016 to 2017 by Type of institution: Percent
| Type of institution | Canada | N.L. | P.E.I. | N.S. | N.B. | Ont. | Man. | Sask. | Alta. | B.C. | Y.T. |
|---|---|---|---|---|---|---|---|---|---|---|---|
| University | 6 | 4 | 6 | 6 | 6 | 6 | 7 | 8 | 5 | 5 | x |
| College | 11 | 9 | 14 | 13 | 12 | 12 | 9 | 13 | 7 | 7 | x |
| Private | 17 | 15 | 18 | 20 | 17 | 16 | 13 | 18 | 24 | 13 | x |
x: cells are suppressed to prevent statistical disclosure of number of borrowers greater than 0 but less than 10.
3 Mobility
Table 3.1.1 Number of full-time students studying inside and outside of Canada
Table 3.1.1A Number of full-time students studying inside and outside Canada: LY 2017 to 2018: Number
| Jurisdiction | Study in home province or territory | Study in Canada but away from home province or territory | Study in the United States | Study outside Canada and the United States | Total |
|---|---|---|---|---|---|
| Newfoundland and Labrador | 4,969 | 876 | 28 | 57 | 5,930 |
| Prince Edward Island | x | 1,030 | x | x | 2,549 |
| Nova Scotia | 13,864 | 3,090 | 93 | 117 | 17,164 |
| New Brunswick | 10,898 | 2,784 | 87 | 49 | 13,818 |
| Ontario | 370,687 | 10,545 | 3,198 | 3,978 | 388,408 |
| Manitoba | 7,781 | 1,455 | 162 | 95 | 9,493 |
| Saskatchewan | 11,812 | 2,659 | 185 | 108 | 14,764 |
| Alberta | 65,342 | 9,919 | 1,518 | 1,341 | 78,120 |
| British Columbia | 46,788 | 6,079 | 719 | 999 | 54,585 |
| Yukon | x | 139 | x | x | 188 |
| Canada | 533,672 | 38,576 | 6,005 | 6,766 | 585,019 |
x: cells are suppressed to prevent statistical disclosure of number of borrowers greater than 0 but less than 10.
Table 3.1.1B Number of full-time students studying inside and outside Canada: LY 2017 to 2018: Percent
| Jurisdiction | Study in home province or territory | Study in Canada but away from home province or territory | Study in the United States | Study outside Canada and the United States | Total |
|---|---|---|---|---|---|
| Newfoundland and Labrador | 83.8 | 14.8 | 0.5 | 1.0 | 100.0 |
| Prince Edward Island | x | 40.4 | x | x | 100.0 |
| Nova Scotia | 80.8 | 18.0 | 0.5 | 0.7 | 100.0 |
| New Brunswick | 78.9 | 20.1 | 0.6 | 0.4 | 100.0 |
| Ontario | 95.4 | 2.7 | 0.8 | 1.0 | 100.0 |
| Manitoba | 82.0 | 15.3 | 1.7 | 1.0 | 100.0 |
| Saskatchewan | 80.0 | 18.0 | 1.3 | 0.7 | 100.0 |
| Alberta | 83.6 | 12.7 | 1.9 | 1.7 | 100.0 |
| British Columbia | 85.7 | 11.1 | 1.3 | 1.8 | 100.0 |
| Yukon | x | 73.9 | x | x | 100.0 |
| Canada | 91.2 | 6.6 | 1.0 | 1.2 | 100.0 |
x: cells are suppressed to prevent statistical disclosure of number of borrowers greater than 0 but less than 10.
Table 3.2.1 Number of full-time students studying inside their home province or territory
Table 3.2.1A Number of full-time students studying inside their home province or territory: Number
| Jurisdiction | LY 2013 to 2014 | LY 2014 to 2015 | LY 2015 to 2016 | LY 2016 to 2017 | LY 2017 to 2018 |
|---|---|---|---|---|---|
| Newfoundland and Labrador | 5,172 | 4,950 | 5,229 | 5,090 | 4,969 |
| Prince Edward Island | 1,849 | 1,666 | 1,507 | 1,492 | x |
| Nova Scotia | 13,340 | 13,116 | 13,130 | 13,329 | 13,864 |
| New Brunswick | 9,899 | 9,126 | 8,667 | 9,164 | 10,898 |
| Ontario | 307,236 | 307,401 | 306,728 | 302,452 | 370,687 |
| Manitoba | 8,336 | 8,054 | 8,383 | 8,160 | 7,781 |
| Saskatchewan | 8,740 | 8,818 | 9,271 | 9,959 | 11,812 |
| Alberta | 40,870 | 41,939 | 46,526 | 51,220 | 65,342 |
| British Columbia | 50,566 | 48,345 | 45,561 | 43,434 | 46,788 |
| Yukon | 25 | 31 | 26 | 30 | x |
| Canada | 446,033 | 443,446 | 445,028 | 444,330 | 533,672 |
x: cells are suppressed to prevent statistical disclosure of number of students greater than 0 but less than 10.
Table 3.2.1B Number of full-time students studying inside their home province or territory: Percent
| Jurisdiction | LY 2013 to 2014 | LY 2014 to 2015 | LY 2015 to 2016 | LY 2016 to 2017 | LY 2017 to 2018 |
|---|---|---|---|---|---|
| Newfoundland and Labrador | 85.1 | 85.0 | 85.7 | 84.7 | 83.8 |
| Prince Edward Island | 59.4 | 57.4 | 56.6 | 57.4 | x |
| Nova Scotia | 80.2 | 80.4 | 80.5 | 80.4 | 80.8 |
| New Brunswick | 77.0 | 75.7 | 75.4 | 76.7 | 78.9 |
| Ontario | 95.1 | 95.1 | 95.1 | 95.2 | 95.4 |
| Manitoba | 84.8 | 83.6 | 83.4 | 82.6 | 82.0 |
| Saskatchewan | 78.0 | 78.7 | 79.6 | 79.4 | 80.0 |
| Alberta | 82.9 | 82.4 | 83.2 | 82.7 | 83.6 |
| British Columbia | 85.6 | 85.5 | 85.6 | 85.2 | 85.7 |
| Yukon | 16.2 | 18.9 | 15.3 | 21.6 | x |
| Canada | 90.8 | 90.7 | 90.8 | 90.6 | 91.2 |
x: cells are suppressed to prevent statistical disclosure of number of students greater than 0 but less than 10.
Table 3.2.2 Number of full-time students studying in Canada but away from their home province or territory
Table 3.2.2A Number of full-time students studying in Canada but away from their home province or territory: Number
| Jurisdiction | LY 2013 to 2014 | LY 2014 to 2015 | LY 2015 to 2016 | LY 2016 to 2017 | LY 2017 to 2018 |
|---|---|---|---|---|---|
| Newfoundland and Labrador | 822 | 780 | 764 | 819 | 876 |
| Prince Edward Island | 1,233 | 1,208 | 1,132 | 1,084 | 1,030 |
| Nova Scotia | 3,054 | 2,967 | 2,955 | 3,040 | 3,090 |
| New Brunswick | 2,793 | 2,777 | 2,696 | 2,639 | 2,784 |
| Ontario | 9,077 | 9,114 | 8,962 | 8,743 | 10,545 |
| Manitoba | 1,202 | 1,272 | 1,365 | 1,421 | 1,455 |
| Saskatchewan | 2,136 | 2,083 | 2,085 | 2,303 | 2,659 |
| Alberta | 6,547 | 6,972 | 7,208 | 8,286 | 9,919 |
| British Columbia | 6,654 | 6,413 | 6,012 | 5,921 | 6,079 |
| Yukon | 117 | 125 | 134 | 105 | 139 |
| Canada | 33,635 | 33,711 | 33,313 | 34,361 | 38,576 |
Table 3.2.2B Number of full-time students studying in Canada but away from their home province or territory: Percent
| Jurisdiction | LY 2013 to 2014 | LY 2014 to 2015 | LY 2015 to 2016 | LY 2016 to 2017 | LY 2017 to 2018 |
|---|---|---|---|---|---|
| Newfoundland and Labrador | 13.5 | 13.4 | 12.5 | 13.6 | 14.8 |
| Prince Edward Island | 39.6 | 41.7 | 42.5 | 41.7 | 40.4 |
| Nova Scotia | 18.4 | 18.2 | 18.1 | 18.3 | 18.0 |
| New Brunswick | 21.7 | 23.0 | 23.4 | 22.1 | 20.1 |
| Ontario | 2.8 | 2.8 | 2.8 | 2.8 | 2.7 |
| Manitoba | 12.2 | 13.2 | 13.6 | 14.4 | 15.3 |
| Saskatchewan | 19.1 | 18.6 | 17.9 | 18.4 | 18.0 |
| Alberta | 13.3 | 13.7 | 12.9 | 13.4 | 12.7 |
| British Columbia | 11.3 | 11.3 | 11.3 | 11.6 | 11.1 |
| Yukon | 76.0 | 76.2 | 78.8 | 75.5 | 73.9 |
| Canada | 6.8 | 6.9 | 6.8 | 7.0 | 6.6 |
Table 3.2.3 Number of full-time students studying outside of Canada
Table 3.2.3A Number of full-time students studying outside of Canada: Number
| Jurisdiction | LY 2013 to 2014 | LY 2014 to 2015 | LY 2015 to 2016 | LY 2016 to 2017 | LY 2017 to 2018 |
|---|---|---|---|---|---|
| Newfoundland and Labrador | 87 | 96 | 109 | 100 | 85 |
| Prince Edward Island | 33 | x | 24 | x | x |
| Nova Scotia | 243 | 228 | 228 | 214 | 210 |
| New Brunswick | 167 | 156 | 137 | 143 | 136 |
| Ontario | 6,887 | 6,717 | 6,696 | 6,608 | 7,176 |
| Manitoba | 291 | 305 | 304 | 294 | 257 |
| Saskatchewan | 326 | 298 | 286 | 280 | 293 |
| Alberta | 1,892 | 1,974 | 2,166 | 2,419 | 2,859 |
| British Columbia | 1,838 | 1,816 | 1,634 | 1,623 | 1,718 |
| Yukon | 12 | x | 10 | x | x |
| Canada | 11,776 | 11,624 | 11,594 | 11,710 | 12,771 |
x: cells are suppressed to prevent statistical disclosure of number of students greater than 0 but less than 10.
Table 3.2.3B Number of full-time students studying outside of Canada: Percent
| Jurisdiction | LY 2013 to 2014 | LY 2014 to 2015 | LY 2015 to 2016 | LY 2016 to 2017 | LY 2017 to 2018 |
|---|---|---|---|---|---|
| Newfoundland and Labrador | 1.4 | 1.6 | 1.8 | 1.7 | 1.4 |
| Prince Edward Island | 1.1 | x | 0.9 | x | x |
| Nova Scotia | 1.5 | 1.4 | 1.4 | 1.3 | 1.2 |
| New Brunswick | 1.3 | 1.3 | 1.2 | 1.2 | 1.0 |
| Ontario | 2.1 | 2.1 | 2.1 | 2.1 | 1.8 |
| Manitoba | 3.0 | 3.2 | 3.0 | 3.0 | 2.7 |
| Saskatchewan | 2.9 | 2.7 | 2.5 | 2.2 | 2.0 |
| Alberta | 3.8 | 3.9 | 3.9 | 3.9 | 3.7 |
| British Columbia | 3.1 | 3.2 | 3.1 | 3.2 | 3.1 |
| Yukon | 7.8 | x | 5.9 | x | x |
| Canada | 2.4 | 2.4 | 2.4 | 2.4 | 2.2 |
x: cells are suppressed to prevent statistical disclosure of number of students greater than 0 but less than 10.
4 Historical Data
4.1 Loans
Table 4.1.1 Canada Student Loans for full-time students, by province and territory, number of recipients
| Loan Year | Canada | N.L. | P.E.I. | N.S. | N.B. | Ont. | Man. | Sask. | Alta. | B.C. | Y.T. | N.W.T. |
|---|---|---|---|---|---|---|---|---|---|---|---|---|
| 1964 to 1965 | 42,113 | 737 | 437 | 2,513 | 2,027 | 21,920 | 2,272 | 2,992 | 4,519 | 4,675 | x | x |
| 1965 to 1966 | 53,702 | 1,392 | 1,100 | 3,943 | 3,170 | 21,368 | 3,523 | 4,965 | 6,439 | 7,770 | 22 | 10 |
| 1966 to 1967 | 67,401 | 1,488 | 881 | 5,029 | 3,939 | 27,640 | 4,183 | 6,210 | 8,245 | 9,753 | 21 | 12 |
| 1967 to 1968 | 94,758 | 1,980 | 969 | 6,387 | 5,766 | 45,225 | 4,694 | 7,726 | 10,716 | 11,270 | 14 | 11 |
| 1968 to 1969 | 103,735 | 2,176 | 958 | 6,640 | 6,178 | 52,165 | 4,694 | 8,015 | 12,878 | 10,000 | x | x |
| 1969 to 1970 | 128,070 | 5,051 | 1,242 | 9,248 | 7,613 | 62,761 | 5,584 | 10,203 | 17,565 | 8,768 | 22 | 13 |
| 1970 to 1971 | 126,567 | 5,371 | 1,630 | 9,155 | 7,605 | 60,523 | 4,597 | 9,757 | 19,308 | 8,585 | x | x |
| 1971 to 1972 | 133,501 | 7,903 | 2,000 | 9,897 | 8,504 | 63,549 | 5,430 | 10,012 | 17,286 | 8,869 | 35 | 16 |
| 1972 to 1973 | 132,012 | 7,553 | 1,869 | 9,966 | 8,440 | 66,390 | 5,710 | 9,361 | 15,462 | 7,208 | 22 | 31 |
| 1973 to 1974 | 137,150 | 7,933 | 1,649 | 9,243 | 8,524 | 69,510 | 6,155 | 8,205 | 15,577 | 10,289 | 30 | 35 |
| 1974 to 1975 | 151,349 | 7,828 | 1,560 | 9,579 | 7,653 | 79,340 | 7,267 | 6,901 | 14,703 | 16,421 | 42 | 55 |
| 1975 to 1976 | 144,893 | 4,529 | 1,494 | 9,505 | 6,591 | 80,708 | 7,527 | 5,317 | 12,761 | 16,318 | 72 | 71 |
| 1976 to 1977 | 140,870 | 4,795 | 1,395 | 9,201 | 6,210 | 77,823 | 7,052 | 4,886 | 13,283 | 16,103 | 75 | 47 |
| 1977 to 1978 | 114,827 | 4,583 | 1,281 | 8,111 | 6,135 | 56,063 | 5,569 | 5,334 | 12,568 | 15,031 | 90 | 62 |
| 1978 to 1979 | 122,438 | 4,106 | 1,207 | 7,577 | 6,121 | 66,313 | 4,613 | 5,322 | 12,177 | 14,870 | 78 | 54 |
| 1979 to 1980 | 118,374 | 4,390 | 1,143 | 7,720 | 6,067 | 63,412 | 4,181 | 4,637 | 12,139 | 14,544 | 91 | 50 |
| 1980 to 1981 | 128,362 | 4,906 | 1,228 | 7,955 | 6,404 | 70,963 | 4,224 | 4,933 | 13,476 | 14,130 | 86 | 57 |
| 1981 to 1982 | 138,539 | 5,432 | 1,442 | 8,962 | 6,981 | 74,537 | 5,390 | 5,211 | 15,530 | 14,886 | 120 | 48 |
| 1982 to 1983 | 172,506 | 7,829 | 1,688 | 10,179 | 8,777 | 93,874 | 7,237 | 6,400 | 16,051 | 20,339 | 122 | 10 |
| 1983 to 1984 | 196,154 | 7,183 | 1,873 | 11,403 | 9,911 | 104,451 | 8,439 | 7,819 | 25,589 | 19,332 | x | x |
| 1984 to 1985 | 207,184 | 8,240 | 1,992 | 12,378 | 10,275 | 105,028 | 9,722 | 8,083 | 33,331 | 17,936 | x | x |
| 1985 to 1986 | 217,746 | 10,333 | 2,143 | 12,829 | 11,219 | 101,713 | 10,842 | 9,234 | 38,438 | 20,794 | 188 | 13 |
| 1986 to 1987 | 234,164 | 11,843 | 2,272 | 13,547 | 11,241 | 101,332 | 11,329 | 14,032 | 45,256 | 23,095 | 201 | 16 |
| 1987 to 1988 | 222,370 | 10,840 | 2,294 | 13,000 | 11,445 | 91,995 | 12,013 | 14,596 | 39,568 | 26,413 | 190 | 14 |
| 1988 to 1989 | 203,047 | 10,303 | 2,070 | 12,779 | 10,917 | 83,868 | 11,596 | 14,360 | 35,698 | 21,247 | 209 | N/A |
| 1989 to 1990 | 215,034 | 10,588 | 2,484 | 13,361 | 11,707 | 87,999 | 10,752 | 14,961 | 36,637 | 26,379 | 166 | N/A |
| 1990 to 1991 | 240,543 | 12,960 | 2,451 | 14,957 | 13,040 | 100,623 | 11,801 | 15,306 | 37,193 | 31,911 | 301 | N/A |
| 1991 to 1992 | 268,305 | 12,132 | 2,399 | 14,674 | 13,472 | 128,270 | 11,707 | 15,480 | 35,513 | 34,292 | 366 | N/A |
| 1992 to 1993 | 281,312 | 11,740 | 2,211 | 13,905 | 13,427 | 139,299 | 12,066 | 16,280 | 36,649 | 35,350 | 385 | N/A |
| 1993 to 1994 | 304,942 | 11,936 | 2,132 | 14,165 | 12,775 | 162,794 | 10,305 | 15,479 | 38,305 | 36,685 | 366 | N/A |
| 1994 to 1995 | 315,670 | 12,478 | 2,065 | 13,430 | 10,422 | 180,644 | 9,629 | 14,663 | 32,656 | 39,397 | 286 | N/A |
| 1995 to 1996 | 324,165 | 15,236 | 2,107 | 14,608 | 9,455 | 178,771 | 9,199 | 13,705 | 37,439 | 43,361 | 284 | N/A |
| 1996 to 1997 | 343,224 | 18,717 | 2,169 | 16,201 | 13,437 | 185,297 | 9,208 | 12,951 | 38,900 | 46,103 | 241 | N/A |
| 1997 to 1998 | 350,774 | 18,796 | 2,312 | 16,748 | 14,127 | 188,108 | 9,488 | 13,051 | 36,973 | 50,904 | 267 | N/A |
| 1998 to 1999 | 336,342 | 17,645 | 2,650 | 17,463 | 14,448 | 177,451 | 9,957 | 13,865 | 36,141 | 46,493 | 229 | N/A |
| 1999 to 2000 | 335,103 | 14,842 | 2,306 | 16,553 | 13,782 | 169,990 | 10,558 | 15,203 | 39,683 | 51,918 | 268 | N/A |
| 2000 to 2001 | 343,588 | 15,953 | 3,047 | 16,903 | 15,708 | 158,256 | 10,860 | 16,358 | 43,294 | 62,953 | 256 | N/A |
| 2001 to 2002 | 328,674 | 13,912 | 3,068 | 17,234 | 15,614 | 145,287 | 10,267 | 16,246 | 42,323 | 64,467 | 256 | N/A |
| 2002 to 2003 | 328,991 | 12,554 | 3,238 | 16,945 | 15,439 | 148,195 | 9,930 | 15,392 | 42,052 | 64,993 | 253 | N/A |
| 2003 to 2004 | 340,203 | 11,541 | 3,385 | 16,697 | 15,902 | 159,684 | 9,649 | 15,163 | 42,501 | 65,425 | 256 | N/A |
| 2004 to 2005 | 337,256 | 10,395 | 3,280 | 16,044 | 15,434 | 167,354 | 9,180 | 14,132 | 41,422 | 59,764 | 251 | N/A |
| 2005 to 2006 | 343,638 | 9,640 | 3,239 | 15,895 | 15,918 | 182,016 | 9,305 | 13,245 | 37,844 | 56,306 | 230 | N/A |
| 2006 to 2007 | 343,261 | 8,887 | 3,206 | 15,477 | 15,676 | 192,875 | 8,496 | 12,346 | 33,779 | 52,298 | 221 | N/A |
| 2007 to 2008 | 352,708 | 8,570 | 3,297 | 15,137 | 15,446 | 207,694 | 8,212 | 11,000 | 33,183 | 49,966 | 203 | N/A |
| 2008 to 2009 | 365,363 | 7,646 | 3,286 | 15,158 | 14,943 | 219,632 | 7,871 | 9,688 | 35,356 | 51,570 | 213 | N/A |
| 2009 to 2010 | 401,734 | 7,382 | 3,286 | 14,631 | 14,727 | 243,515 | 8,213 | 9,708 | 42,006 | 58,066 | 200 | N/A |
| 2010 to 2011 | 424,575 | 6,950 | 3,326 | 14,835 | 14,604 | 256,692 | 8,823 | 11,038 | 47,503 | 60,593 | 211 | N/A |
| 2011 to 2012 | 446,582 | 6,635 | 3,307 | 15,351 | 14,586 | 273,614 | 9,410 | 11,510 | 49,882 | 62,087 | 200 | N/A |
| 2012 to 2013 | 472,167 | 6,354 | 3,280 | 15,790 | 13,619 | 302,355 | 9,858 | 11,469 | 49,114 | 60,158 | 170 | N/A |
| 2013 to 2014 | 491,444 | 6,081 | 3,115 | 16,637 | 12,859 | 323,200 | 9,829 | 11,202 | 49,309 | 59,058 | 154 | N/A |
| 2014 to 2015 | 488,781 | 5,826 | 2,900 | 16,311 | 12,059 | 323,232 | 9,631 | 11,199 | 50,885 | 56,574 | 164 | N/A |
| 2015 to 2016 | 489,935 | 6,102 | 2,663 | 16,313 | 11,500 | 322,386 | 10,052 | 11,642 | 55,900 | 53,207 | 170 | N/A |
| 2016 to 2017 | 490,401 | 6,009 | 2,601 | 16,583 | 11,946 | 317,803 | 9,875 | 12,542 | 61,925 | 50,978 | 139 | N/A |
| 2017 to 2018 | 585,019 | 5,930 | 2,549 | 17,164 | 13,818 | 388,408 | 9,493 | 14,764 | 78,120 | 54,585 | 188 | N/A |
x: cells are suppressed to prevent statistical disclosure of number of recipients greater than 0 but less than 10.
Table 4.1.2 Canada Student Loans for full-time students, by province and territory, amount disbursed: Millions of dollars
| Loan Year | Canada | N.L. | P.E.I. | N.S. | N.B. | Ont. | Man. | Sask. | Alta. | B.C. | Y.T. | N.W.T. |
|---|---|---|---|---|---|---|---|---|---|---|---|---|
| 1964 to 1965 | 26.7 | 0.5 | 0.3 | 1.8 | 1.4 | 14.4 | 1.4 | 1.9 | 2.1 | 3.1 | x | x |
| 1965 to 1966 | 34.6 | 0.9 | 0.4 | 2.9 | 2.3 | 14.6 | 2.2 | 3.4 | 3.1 | 4.8 | 0 | 0 |
| 1966 to 1967 | 40.5 | 0.8 | 0.6 | 3.3 | 3 | 14.4 | 2.8 | 4.5 | 4.4 | 6.6 | 0 | 0 |
| 1967 to 1968 | 57.3 | 1.1 | 0.7 | 4.3 | 4.2 | 23.6 | 3.2 | 5.8 | 6.3 | 8 | 0 | 0 |
| 1968 to 1969 | 63.9 | 1.5 | 0.8 | 5.1 | 4.8 | 26.6 | 3.4 | 6.4 | 8.1 | 7.3 | x | x |
| 1969 to 1970 | 78.1 | 3.1 | 0.9 | 7 | 5.4 | 31.8 | 4.3 | 8.4 | 10.5 | 6.6 | 0 | 0 |
| 1970 to 1971 | 86.1 | 4.9 | 1.4 | 7.9 | 6.5 | 32.3 | 3.4 | 8.5 | 14.3 | 6.8 | x | x |
| 1971 to 1972 | 87.5 | 5.5 | 1.6 | 8.8 | 6.7 | 33.5 | 4.1 | 7.3 | 13.8 | 6.1 | 0 | 0 |
| 1972 to 1973 | 102.3 | 6.7 | 2.1 | 10.2 | 7.5 | 45.1 | 3.7 | 6.8 | 14.9 | 5.3 | 0 | 0 |
| 1973 to 1974 | 108.7 | 5.2 | 1.9 | 10.8 | 6.9 | 50.8 | 4.5 | 6.1 | 15.2 | 7.2 | 0 | 0 |
| 1974 to 1975 | 121 | 4.4 | 1.8 | 11.8 | 7.3 | 60.1 | 5.5 | 5.4 | 14.9 | 9.7 | 0 | 0.1 |
| 1975 to 1976 | 148.3 | 4.3 | 2 | 13.1 | 8.9 | 74.4 | 6.3 | 5.4 | 18.1 | 15.7 | 0.1 | 0.1 |
| 1976 to 1977 | 160.9 | 4.8 | 2.1 | 12.6 | 7.9 | 80.4 | 10 | 5.2 | 18.6 | 19.2 | 0.1 | 0.1 |
| 1977 to 1978 | 134.6 | 4.4 | 1.7 | 10.9 | 8 | 57.7 | 8 | 7.2 | 17.6 | 19 | 0.1 | 0.1 |
| 1978 to 1979 | 147.9 | 4.8 | 1.7 | 10.7 | 8.2 | 70.2 | 6.9 | 7.6 | 18 | 19.6 | 0.1 | 0.1 |
| 1979 to 1980 | 142.7 | 4.9 | 1.6 | 11.1 | 8.5 | 65.9 | 6.5 | 6.5 | 17.7 | 19.8 | 0.1 | 0.1 |
| 1980 to 1981 | 162.1 | 5.9 | 1.8 | 11.6 | 9 | 80.2 | 6.7 | 7 | 19.8 | 19.9 | 0.1 | 0.1 |
| 1981 to 1982 | 199.9 | 7 | 2.3 | 13.7 | 10.1 | 99.8 | 9.9 | 7.7 | 25.4 | 23.6 | 0.2 | 0.1 |
| 1982 to 1983 | 280.3 | 10.8 | 2.8 | 18.6 | 15.3 | 144.3 | 13.6 | 10.5 | 30.3 | 34.1 | 0.2 | 0 |
| 1983 to 1984 | 454.9 | 13.7 | 4.1 | 30.4 | 21.8 | 224.9 | 25 | 18 | 67.9 | 48.7 | x | x |
| 1984 to 1985 | 526.7 | 22.3 | 4.6 | 34.4 | 24.2 | 247.1 | 30.8 | 18.4 | 95.5 | 48.9 | x | x |
| 1985 to 1986 | 576.9 | 29.8 | 5.1 | 35.8 | 31.2 | 239.8 | 35.6 | 24.6 | 114.5 | 60 | 0.5 | 0 |
| 1986 to 1987 | 621 | 35.9 | 5.7 | 39.9 | 33.2 | 231.2 | 37.6 | 39.6 | 126.1 | 71.1 | 0.6 | 0 |
| 1987 to 1988 | 612 | 33.9 | 5.8 | 39.5 | 34.4 | 200 | 40.4 | 47.3 | 120.6 | 89.6 | 0.6 | 0 |
| 1988 to 1989 | 551 | 31.1 | 5.3 | 39.3 | 32.9 | 183 | 39.3 | 47 | 108.4 | 64 | 0.6 | N/A |
| 1989 to 1990 | 599.2 | 32.1 | 6.9 | 40.9 | 35.8 | 201.5 | 36 | 48.9 | 112 | 84.6 | 0.5 | N/A |
| 1990 to 1991 | 665.8 | 36.4 | 6.1 | 43.6 | 39.2 | 238.1 | 38.8 | 48.6 | 114.1 | 100.1 | 0.8 | N/A |
| 1991 to 1992 | 797.2 | 34.2 | 6.1 | 44.9 | 41.7 | 351.2 | 38.8 | 52.3 | 112.2 | 114.9 | 0.9 | N/A |
| 1992 to 1993 | 846.6 | 35.9 | 6.4 | 42.9 | 42.4 | 395.7 | 35.3 | 56.3 | 117.9 | 113.1 | 0.8 | N/A |
| 1993 to 1994 | 986.7 | 38 | 6.1 | 42.7 | 44.1 | 511.7 | 35.5 | 50.7 | 127.1 | 129.5 | 1.1 | N/A |
| 1994 to 1995 | 1,214.60 | 54.1 | 7.5 | 51.2 | 33 | 681.9 | 35.5 | 56.3 | 117.2 | 176.9 | 0.9 | N/A |
| 1995 to 1996 | 1,340.00 | 74.1 | 8.4 | 51.1 | 29.3 | 741.6 | 35.7 | 54.9 | 140.7 | 202.9 | 1.2 | N/A |
| 1996 to 1997 | 1,583.90 | 91.5 | 13.4 | 62.8 | 82.5 | 880.8 | 30.6 | 56.1 | 147.6 | 217.5 | 1.2 | N/A |
| 1997 to 1998 | 1,567.80 | 86.1 | 11.4 | 62.8 | 79.7 | 856 | 37.1 | 57.5 | 133.3 | 243 | 1 | N/A |
| 1998 to 1999 | 1,557.20 | 88.8 | 11.9 | 94.7 | 67.6 | 817.3 | 38.2 | 67.3 | 146.9 | 223.4 | 1 | N/A |
| 1999 to 2000 | 1,549.60 | 70 | 10.1 | 90.2 | 61.9 | 780.9 | 44.3 | 72.8 | 170.5 | 247.7 | 1.1 | N/A |
| 2000 to 2001 | 1,564.70 | 69.5 | 13.5 | 90.7 | 77.6 | 704.5 | 46.9 | 78.2 | 184.2 | 298.6 | 1.2 | N/A |
| 2001 to 2002 | 1,507.40 | 61.3 | 16.1 | 92.9 | 77.7 | 643.7 | 44.5 | 79 | 181.3 | 309.5 | 1.3 | N/A |
| 2002 to 2003 | 1,544.70 | 56.2 | 17 | 92.5 | 77.9 | 664.6 | 43.4 | 74.5 | 187.3 | 330 | 1.3 | N/A |
| 2003 to 2004 | 1,643.00 | 52 | 17.9 | 92.6 | 82.5 | 734.5 | 44.1 | 76 | 200.1 | 342 | 1.3 | N/A |
| 2004 to 2005 | 1,628.80 | 46.5 | 17.3 | 88.8 | 80 | 768.9 | 41.5 | 71.3 | 198.9 | 314.4 | 1.2 | N/A |
| 2005 to 2006 | 1,935.00 | 49.3 | 21.2 | 107.1 | 88.8 | 971.2 | 48.7 | 80.8 | 215 | 351.5 | 1.4 | N/A |
| 2006 to 2007 | 1,927.10 | 45.7 | 22.6 | 102.6 | 91.4 | 1,034.90 | 44.3 | 74 | 189.4 | 320.9 | 1.3 | N/A |
| 2007 to 2008 | 2,012.50 | 43.9 | 24.6 | 102.1 | 88.2 | 1,146.00 | 43.1 | 66 | 190.5 | 306.9 | 1.2 | N/A |
| 2008 to 2009 | 2,077.80 | 39.7 | 21.7 | 101.7 | 83.2 | 1,210.00 | 41.3 | 58.8 | 204.8 | 315.3 | 1.3 | N/A |
| 2009 to 2010 | 2,083.20 | 33.3 | 21 | 97.5 | 74.3 | 1,208.80 | 36.4 | 56.1 | 216.5 | 338.3 | 1.1 | N/A |
| 2010 to 2011 | 2,218.90 | 31.1 | 21.2 | 98.5 | 73.2 | 1,285.00 | 40.3 | 65.1 | 252.3 | 351 | 1.1 | N/A |
| 2011 to 2012 | 2,400.70 | 29.9 | 21.1 | 106.1 | 74.1 | 1,420.00 | 44.6 | 66.2 | 275.8 | 361.9 | 1.1 | N/A |
| 2012 to 2013 | 2,566.40 | 29.9 | 21.3 | 110.5 | 71.7 | 1,603.90 | 47.8 | 66.6 | 269.3 | 344.5 | 0.9 | N/A |
| 2013 to 2014 | 2,700.70 | 29 | 20.3 | 116.7 | 70.4 | 1,735.30 | 47.3 | 66.1 | 274.1 | 340.5 | 0.9 | N/A |
| 2014 to 2015 | 2,702.20 | 28 | 18.8 | 115.1 | 66.4 | 1,736.60 | 46 | 68.6 | 285.9 | 335.7 | 1 | N/A |
| 2015 to 2016 | 2,698.20 | 28.9 | 17 | 113.9 | 63.6 | 1,722.70 | 48 | 71 | 318.3 | 313.8 | 1 | N/A |
| 2016 to 2017 | 2,608.00 | 27.9 | 16.3 | 114.9 | 56 | 1,636.50 | 45.6 | 75 | 338.7 | 296.4 | 0.8 | N/A |
| 2017 to 2018 | 3,329.10 | 37 | 16 | 122.7 | 66.8 | 2,127.90 | 41 | 93.2 | 483.6 | 339.5 | 1.2 | N/A |
x: cells are suppressed to prevent statistical disclosure of number of recipients greater than 0 but less than 10.
Table 4.1.3 Canada Student Loans for part-time students
Table 4.1.3A Canada Student Loans for part-time students: Number of recipients
| Loan Year | Number of recipients |
|---|---|
| 1987 to 1988 | 620 |
| 1988 to 1989 | 320 |
| 1989 to 1990 | 730 |
| 1990 to 1991 | 803 |
| 1991 to 1992 | 757 |
| 1992 to 1993 | 1,280 |
| 1993 to 1994 | 1,414 |
| 1994 to 1995 | 2,112 |
| 1995 to 1996 | 1,887 |
| 1996 to 1997 | 1,859 |
| 1997 to 1998 | 3,205 |
| 1998 to 1999 | 3,128 |
| 1999 to 2000 | 1,302 |
| 2000 to 2001 | 2,980 |
| 2001 to 2002 | 2,867 |
| 2002 to 2003 | 2,772 |
| 2003 to 2004 | 2,779 |
| 2004 to 2005 | 2,572 |
| 2005 to 2006 | 2,127 |
| 2006 to 2007 | 1,863 |
| 2007 to 2008 | 1,436 |
| 2008 to 2009 | 1,425 |
| 2009 to 2010 | 2,698 |
| 2010 to 2011 | 3,974 |
| 2011 to 2012 | 6,470 |
| 2012 to 2013 | 9,601 |
| 2013 to 2014 | 11,254 |
| 2014 to 2015 | 12,086 |
| 2015 to 2016 | 13,712 |
| 2016 to 2017 | 11,790 |
| 2017 to 2018 | 13,534 |
Table 4.1.3B Canada Student Loans for part-time students: Millions of dollars
| Loan Year | Millions of dollars |
|---|---|
| 1987 to 1988 | 0.9 |
| 1988 to 1989 | 0.5 |
| 1989 to 1990 | 1.2 |
| 1990 to 1991 | 1.4 |
| 1991 to 1992 | 1.3 |
| 1992 to 1993 | 2.5 |
| 1993 to 1994 | 3.0 |
| 1994 to 1995 | 5.9 |
| 1995 to 1996 | 5.4 |
| 1996 to 1997 | 5.4 |
| 1997 to 1998 | 7.7 |
| 1998 to 1999 | 7.8 |
| 1999 to 2000 | 3.5 |
| 2000 to 2001 | 5.5 |
| 2001 to 2002 | 4.9 |
| 2002 to 2003 | 4.6 |
| 2003 to 2004 | 4.7 |
| 2004 to 2005 | 4.6 |
| 2005 to 2006 | 3.8 |
| 2006 to 2007 | 3.5 |
| 2007 to 2008 | 2.8 |
| 2008 to 2009 | 2.8 |
| 2009 to 2010 | 4.6 |
| 2010 to 2011 | 6.9 |
| 2011 to 2012 | 11.2 |
| 2012 to 2013 | 16.6 |
| 2013 to 2014 | 19.9 |
| 2014 to 2015 | 20.9 |
| 2015 to 2016 | 24.1 |
| 2016 to 2017 | 19.2 |
| 2017 to 2018 | 23.0 |
4.2 Grants
Table 4.2.1 Canada Student Grants for full- and part-time students, by province and territory, number of recipients
Table 4.2.1A Canada Student Grants for full- and part-time students, by province and territory, number of recipients: Canada Study Grant
| Loan Year | Canada | N.L. | P.E.I. | N.S. | N.B. | Ont. | Man. | Sask. | Alta. | B.C. | Y.T. |
|---|---|---|---|---|---|---|---|---|---|---|---|
| 1995 to 19961 | 1,677 | N/A | N/A | N/A | N/A | N/A | N/A | N/A | N/A | N/A | N/A |
| 1996 to 19971 | 6,273 | N/A | N/A | N/A | N/A | N/A | N/A | N/A | N/A | N/A | N/A |
| 1997 to 19981 | 7,354 | N/A | N/A | N/A | N/A | N/A | N/A | N/A | N/A | N/A | N/A |
| 1998 to 19991 | 56,899 | N/A | N/A | N/A | N/A | N/A | N/A | N/A | N/A | N/A | N/A |
| 1999 to 20001 | 63,793 | N/A | N/A | N/A | N/A | N/A | N/A | N/A | N/A | N/A | N/A |
| 2000 to 2001 | 55,830 | 1,242 | 343 | 1,389 | 1,174 | 26,375 | 1,037 | 3,609 | 6,441 | 13,636 | 34 |
| 2001 to 2002 | 48,730 | 977 | 354 | 1,541 | 1,643 | 23,440 | 1,088 | 2,387 | 6,206 | 11,054 | 40 |
| 2002 to 2003 | 55,625 | 703 | 425 | 1,598 | 1,383 | 25,259 | 1,317 | 2,727 | 6,443 | 15,732 | 38 |
| 2003 to 2004 | 53,272 | 1,245 | 295 | 1,703 | 1,701 | 22,107 | 1,428 | 2,236 | 6,977 | 15,528 | 52 |
| 2004 to 2005 | 53,404 | 588 | 296 | 1,548 | 1,419 | 24,384 | 1,434 | 3,342 | 6,589 | 13,762 | 42 |
| 2005 to 2006 | 49,500 | 481 | 308 | 2,280 | 1,311 | 25,833 | 1,482 | 2,754 | 5,574 | 9,442 | 35 |
| 2006 to 2007 | 47,853 | 559 | 288 | 1,437 | 1,275 | 26,632 | 1,194 | 2,489 | 4,385 | 9,551 | 43 |
| 2007 to 2008 | 40,402 | 523 | 363 | 1,343 | 1,539 | 21,787 | 1,079 | 1,955 | 3,999 | 7,785 | 29 |
| 2008 to 2009 | 42,489 | 482 | 410 | 1,411 | 1,195 | 23,128 | 1,074 | 1,707 | 4,054 | 8,997 | 31 |
1 Provincial and territorial statistics are not available.
Table 4.2.1B Canada Student Grants for full- and part-time students, by province and territory, number of recipients: Canada Access Grant
| Loan Year | Canada | N.L. | P.E.I. | N.S. | N.B. | Ont. | Man. | Sask. | Alta. | B.C. | Y.T. |
|---|---|---|---|---|---|---|---|---|---|---|---|
| 2005 to 2006 | 31,882 | 664 | 11 | 1,760 | 39 | 21,684 | 718 | 1,120 | 2,026 | 3,848 | 12 |
| 2006 to 2007 | 39,515 | 1,073 | x | 1,842 | 1,881 | 26,674 | 737 | 1,128 | 1,867 | 3,942 | x |
| 2007 to 2008 | 40,279 | 1,034 | x | 1,916 | 1,088 | 28,373 | 748 | 1,042 | 1,935 | 3,632 | x |
| 2008 to 2009 | 41,757 | 816 | 317 | 1,818 | 415 | 30,855 | 758 | 920 | 1,780 | 4,065 | 13 |
x: cells are suppressed to prevent statistical disclosure of number of recipients greater than 0 but less than 10.
Table 4.2.1C Canada Student Grants for full- and part-time students, by province and territory, number of recipients: Canada Student Grant
| Loan Year | Canada | N.L. | P.E.I. | N.S. | N.B. | Ont. | Man. | Sask. | Alta. | B.C. | Y.T. |
|---|---|---|---|---|---|---|---|---|---|---|---|
| 2009 to 20102 | 295,153 | 4,823 | 2,305 | 10,184 | 8,592 | 181,270 | 6,272 | 7,270 | 30,696 | 43,542 | 160 |
| 2010 to 20112 | 320,154 | 4,394 | 2,399 | 10,364 | 8,584 | 194,333 | 6,928 | 8,101 | 36,247 | 47,463 | 179 |
| 2011 to 20122 | 336,173 | 4,215 | 2,323 | 10,616 | 8,448 | 207,364 | 7,757 | 8,661 | 36,573 | 49,284 | 164 |
| 2012 to 20132 | 356,894 | 4,063 | 2,406 | 10,917 | 8,199 | 226,772 | 7,788 | 8,659 | 37,647 | 50,036 | 152 |
| 2013 to 2014 | 367,586 | 3,879 | 2,370 | 11,321 | 7,919 | 239,781 | 7,922 | 8,374 | 36,559 | 49,336 | 125 |
| 2014 to 2015 | 365,832 | 3,665 | 2,271 | 11,104 | 7,418 | 240,701 | 7,800 | 8,214 | 37,515 | 47,009 | 135 |
| 2015 to 2016 | 368,940 | 4,038 | 2,177 | 11,169 | 7,009 | 243,772 | 8,116 | 8,524 | 39,544 | 44,463 | 128 |
| 2016 to 2017 | 379,606 | 4,143 | 2,232 | 11,238 | 7,627 | 248,306 | 8,245 | 9,100 | 45,160 | 43,432 | 123 |
| 2017 to 2018 | 490,377 | 4,875 | 2,514 | 13,763 | 10,585 | 331,701 | 9,306 | 12,168 | 58,230 | 47,062 | 173 |
2 Total may not equal the sum of the provinces and territories for the following loan years: 2009 to 2010, 2010 to 2011, 2011 to 2012 and 2012 to 2013 since the total includes students who receive a Millennium Excellence Award. Millennium Excellence Awards breakdowns are not available by province or territory.
Table 4.2.2 Canada Student Grants for full- and part-time students, by province and territory, amount disbursed
Table 4.2.2A Canada Student Grants for full- and part-time students, by province and territory, amount disbursed: Canada Study Grant: Millions of dollars
| Loan Year | Canada | N.L. | P.E.I. | N.S. | N.B. | Ont. | Man. | Sask. | Alta. | B.C. | Y.T. |
|---|---|---|---|---|---|---|---|---|---|---|---|
| 1995 to 19961 | 3.6 | N/A | N/A | N/A | N/A | N/A | N/A | N/A | N/A | N/A | N/A |
| 1996 to 19971 | 8.9 | N/A | N/A | N/A | N/A | N/A | N/A | N/A | N/A | N/A | N/A |
| 1997 to 19981 | 11.2 | N/A | N/A | N/A | N/A | N/A | N/A | N/A | N/A | N/A | N/A |
| 1998 to 19991 | 73.9 | N/A | N/A | N/A | N/A | N/A | N/A | N/A | N/A | N/A | N/A |
| 1999 to 20001 | 82.9 | N/A | N/A | N/A | N/A | N/A | N/A | N/A | N/A | N/A | N/A |
| 2000 to 2001 | 81.1 | 1.6 | 0.5 | 2.3 | 2.3 | 37.8 | 1.7 | 5.1 | 8.4 | 21.4 | 0.1 |
| 2001 to 2002 | 67.4 | 1.3 | 0.4 | 2.6 | 2.3 | 33.7 | 1.7 | 5.3 | 8.2 | 11.8 | 0.1 |
| 2002 to 2003 | 75.5 | 1.1 | 0.6 | 3.0 | 2.1 | 36.1 | 2.0 | 5.2 | 9.0 | 16.6 | 0.1 |
| 2003 to 2004 | 76.8 | 1.0 | 0.4 | 3.7 | 2.4 | 36.0 | 2.2 | 5.5 | 10.1 | 15.3 | 0.1 |
| 2004 to 2005 | 83.9 | 0.9 | 0.5 | 3.0 | 2.4 | 38.2 | 2.3 | 5.6 | 9.9 | 21.0 | 0.1 |
| 2005 to 2006 | 79.5 | 0.6 | 0.5 | 3.3 | 2.3 | 41.3 | 2.5 | 4.5 | 9.0 | 15.5 | 0.1 |
| 2006 to 2007 | 72.9 | 0.9 | 0.4 | 3.0 | 2.4 | 38.5 | 2.0 | 4.3 | 7.7 | 13.6 | 0.1 |
| 2007 to 2008 | 69.8 | 0.8 | 0.5 | 2.9 | 2.4 | 38.0 | 1.9 | 3.7 | 7.7 | 11.9 | 0.0s |
| 2008 to 2009 | 72.9 | 0.7 | 0.5 | 2.5 | 2.2 | 40.6 | 1.8 | 3.1 | 7.9 | 13.4 | 0.1 |
0.0s: value rounded to 0.0 (zero).
1 Provincial and territorial statistics are not available.
Table 4.2.2B Canada Student Grants for full- and part-time students, by province and territory, amount disbursed: Canada Access Grant: Millions of dollars
| Loan Year | Canada | N.L. | P.E.I. | N.S. | N.B. | Ont. | Man. | Sask. | Alta. | B.C. | Y.T. |
|---|---|---|---|---|---|---|---|---|---|---|---|
| 2005 to 2006 | 58.9 | 1.0 | 0.0 | 3.9 | 0.1 | 38.6 | 1.2 | 2.4 | 4.0 | 7.7 | 0.0s |
| 2006 to 2007 | 68.8 | 0.9 | x | 4.0 | 3.8 | 45.4 | 1.1 | 2.3 | 3.6 | 6.9 | x |
| 2007 to 2008 | 72.0 | 0.9 | x | 4.0 | 2.3 | 50.0 | 1.2 | 2.2 | 3.9 | 6.6 | x |
| 2008 to 2009 | 74.7 | 0.8 | 0.7 | 3.7 | 0.8 | 55.0 | 1.2 | 1.9 | 3.6 | 7.0 | 0.0s |
x: cells are suppressed to prevent statistical disclosure of number of recipients greater than 0 but less than 10.
0.0s: value rounded to 0.0 (zero).
Table 4.2.2C Canada Student Grants for full- and part-time students, by province and territory, amount disbursed: Canada Student Grant: Millions of dollars
| Loan Year | Canada | N.L. | P.E.I. | N.S. | N.B. | Ont. | Man. | Sask. | Alta. | B.C. | Y.T. |
|---|---|---|---|---|---|---|---|---|---|---|---|
| 2009 to 20102 | 593.4 | 8.8 | 4.7 | 21.4 | 16.6 | 354.8 | 16.3 | 18.6 | 65.7 | 85.9 | 0.4 |
| 2010 to 20112 | 630.0 | 7.9 | 4.7 | 21.6 | 16.0 | 370.5 | 16.5 | 18.7 | 75.7 | 91.4 | 0.5 |
| 2011 to 20122 | 646.7 | 7.5 | 4.3 | 21.7 | 15.6 | 386.7 | 16.6 | 19.8 | 74.2 | 95.8 | 0.4 |
| 2012 to 20132 | 695.0 | 7.5 | 4.5 | 22.8 | 15.9 | 431.8 | 17.7 | 20.0 | 76.4 | 96.7 | 0.3 |
| 2013 to 2014 | 715.3 | 7.6 | 4.6 | 23.6 | 16.1 | 457.1 | 17.3 | 18.9 | 73.7 | 96.1 | 0.3 |
| 2014 to 2015 | 717.7 | 7.4 | 4.4 | 23.3 | 15.2 | 463.6 | 16.8 | 19.1 | 76.1 | 91.7 | 0.3 |
| 2015 to 2016 | 719.5 | 8.3 | 4.5 | 23.7 | 14.0 | 464.1 | 17.2 | 19.6 | 80.9 | 87.0 | 0.2 |
| 2016 to 2017 | 1,014.6 | 12.2 | 5.9 | 32.7 | 19.9 | 653.3 | 24.2 | 27.2 | 122.7 | 116.2 | 0.4 |
| 2017 to 2018 | 1,364.9 | 14.0 | 6.8 | 41.2 | 29.3 | 910.3 | 26.9 | 37.2 | 168.2 | 130.5 | 0.5 |
2 Total may not equal the sum of the provinces and territories for the following loan years: 2009 to 2010, 2010 to 2011, 2011 to 2012 and 2012 to 2013 since the total includes students who receive a Millennium Excellence Award. Millennium Excellence Awards breakdowns are not available by province or territory.
Table 4.2.3 Canada Student Grants for part-time students
Table 4.2.3A Canada Student Grants for part-time students: High need part-time students: Number of recipients
| Loan Year | Number of recipients |
|---|---|
| 1995 to 1996 | 438 |
| 1996 to 1997 | 3,037 |
| 1997 to 1998 | 4,567 |
| 1998 to 1999 | 5,675 |
| 1999 to 2000 | 5,728 |
| 2000 to 2001 | 5,441 |
| 2001 to 2002 | 4,786 |
| 2002 to 2003 | 4,451 |
| 2003 to 2004 | 4,215 |
| 2004 to 2005 | 3,977 |
| 2005 to 2006 | 2,847 |
| 2006 to 2007 | 2,848 |
| 2007 to 2008 | 2,570 |
| 2008 to 2009 | 2,721 |
Table 4.2.3B Canada Student Grants for part-time students: High need part-time students: Millions of dollars
| Loan Year | Millions of dollars |
|---|---|
| 1995 to 1996 | 0.4 |
| 1996 to 1997 | 2.0 |
| 1997 to 1998 | 3.5 |
| 1998 to 1999 | 4.6 |
| 1999 to 2000 | 4.7 |
| 2000 to 2001 | 4.6 |
| 2001 to 2002 | 4.1 |
| 2002 to 2003 | 3.8 |
| 2003 to 2004 | 3.7 |
| 2004 to 2005 | 3.6 |
| 2005 to 2006 | 3.0 |
| 2006 to 2007 | 2.7 |
| 2007 to 2008 | 2.6 |
| 2008 to 2009 | 2.8 |
Table 4.2.3C Canada Student Grants for part-time students: Canada Student Grant: Number of recipients
| Loan Year | Number of recipients |
|---|---|
| 2009 to 2010 | 4,189 |
| 2010 to 2011 | 6,208 |
| 2011 to 2012 | 8,849 |
| 2012 to 2013 | 13,208 |
| 2013 to 2014 | 14,955 |
| 2014 to 2015 | 15,963 |
| 2015 to 2016 | 17,439 |
| 2016 to 2017 | 19,159 |
| 2017 to 2018 | 21,268 |
Table 4.2.3D Canada Student Grants for part-time students: Canada Student Grant: Millions of dollars
| Loan Year | Millions of dollars |
|---|---|
| 2009 to 2010 | 4.5 |
| 2010 to 2011 | 6.8 |
| 2011 to 2012 | 10.0 |
| 2012 to 2013 | 14.9 |
| 2013 to 2014 | 17.3 |
| 2014 to 2015 | 18.1 |
| 2015 to 2016 | 19.8 |
| 2016 to 2017 | 29.0 |
| 2017 to 2018 | 33.0 |
Table 4.2.4 Canada Student Grants for part-time students, by province and territory, number of recipients
Table 4.2.4A Canada Student Grants for part-time students by province and territory, number of recipients: High need part-time students
| Loan Year | Canada | N.L. | P.E.I. | N.S. | N.B. | Ont. | Man. | Sask. | Alta. | B.C. | Y.T. |
|---|---|---|---|---|---|---|---|---|---|---|---|
| 1995 to 19961 | 438 | N/A | N/A | N/A | N/A | N/A | N/A | N/A | N/A | N/A | N/A |
| 1996 to 19971 | 3,037 | N/A | N/A | N/A | N/A | N/A | N/A | N/A | N/A | N/A | N/A |
| 1997 to 19981 | 4,567 | N/A | N/A | N/A | N/A | N/A | N/A | N/A | N/A | N/A | N/A |
| 1998 to 19991 | 5,675 | N/A | N/A | N/A | N/A | N/A | N/A | N/A | N/A | N/A | N/A |
| 1999 to 20001 | 5,728 | N/A | N/A | N/A | N/A | N/A | N/A | N/A | N/A | N/A | N/A |
| 2000 to 20011 | 5,441 | N/A | N/A | N/A | N/A | N/A | N/A | N/A | N/A | N/A | N/A |
| 2001 to 2002 | 4,786 | x | 151 | 76 | 50 | 455 | 33 | 273 | 954 | 2,786 | x |
| 2002 to 2003 | 4,451 | x | 189 | 67 | 24 | 410 | 37 | 134 | 971 | 2,608 | x |
| 2003 to 2004 | 4,215 | x | 103 | 60 | 28 | 328 | 47 | 117 | 963 | 2,553 | x |
| 2004 to 2005 | 3,977 | x | 83 | 37 | 19 | 334 | 49 | 99 | 849 | 2,498 | x |
| 2005 to 2006 | 2,847 | x | 104 | 14 | 29 | 293 | 47 | 56 | 610 | 1,691 | x |
| 2006 to 2007 | 2,848 | x | 96 | 15 | 0 | 269 | 35 | 36 | 336 | 2,018 | x |
| 2007 to 2008 | 2,570 | x | 146 | 12 | 32 | 229 | 44 | 32 | 193 | 1,871 | x |
| 2008 to 2009 | 2,721 | x | 163 | 11 | 15 | 231 | 35 | 19 | 194 | 2,043 | x |
x: cells are suppressed to prevent statistical disclosure of number of recipients greater than 0 but less than 10.
1 Provincial and territorial statistics are not available.
Table 4.2.4B Canada Student Grants for part-time students by province and territory, number of recipients: Canada Student Grant
| Loan Year | Canada | N.L. | P.E.I. | N.S. | N.B. | Ont. | Man. | Sask. | Alta. | B.C. | Y.T. |
|---|---|---|---|---|---|---|---|---|---|---|---|
| 2009 to 2010 | 4,189 | x | 205 | 83 | 68 | 1,055 | 140 | 49 | 551 | 2,020 | x |
| 2010 to 2011 | 6,208 | x | 282 | 122 | 77 | 1,897 | 194 | 55 | 756 | 2,791 | x |
| 2011 to 2012 | 8,849 | x | 323 | 132 | 79 | 3,902 | 253 | 67 | 607 | 3,447 | x |
| 2012 to 2013 | 13,208 | x | 466 | 123 | 97 | 6,138 | 339 | 79 | 1,273 | 4,654 | x |
| 2013 to 2014 | 14,955 | 54 | 501 | 141 | 114 | 7,335 | 393 | 73 | 1,285 | 5,059 | 0 |
| 2014 to 2015 | 15,963 | x | 555 | 202 | 108 | 8,387 | 335 | 79 | 1,356 | 4,885 | x |
| 2015 to 2016 | 17,439 | x | 568 | 185 | 124 | 9,193 | 395 | 111 | 1,454 | 5,322 | x |
| 2016 to 2017 | 19,159 | x | 622 | 174 | 138 | 9,857 | 365 | 135 | 1,913 | 5,869 | x |
| 2017 to 2018 | 21,268 | x | 620 | 186 | 99 | 12,627 | 281 | 160 | 1,940 | 5,267 | x |
x: cells are suppressed to prevent statistical disclosure of number of recipients greater than 0 but less than 10.
Table 4.2.5 Canada Student Grants for part-time students, by province and territory, amount disbursed
Table 4.2.5A Canada Student Grants for part-time students by province and territory, amount disbursed: High need part-time students: Millions of dollars
| Loan Year | Canada | N.L. | P.E.I. | N.S. | N.B. | Ont. | Man. | Sask. | Alta. | B.C. | Y.T. |
|---|---|---|---|---|---|---|---|---|---|---|---|
| 1995 to 19961 | 0.4 | N/A | N/A | N/A | N/A | N/A | N/A | N/A | N/A | N/A | N/A |
| 1996 to 19971 | 2.0 | N/A | N/A | N/A | N/A | N/A | N/A | N/A | N/A | N/A | N/A |
| 1997 to 19981 | 3.5 | N/A | N/A | N/A | N/A | N/A | N/A | N/A | N/A | N/A | N/A |
| 1998 to 19991 | 4.6 | N/A | N/A | N/A | N/A | N/A | N/A | N/A | N/A | N/A | N/A |
| 1999 to 20001 | 4.7 | N/A | N/A | N/A | N/A | N/A | N/A | N/A | N/A | N/A | N/A |
| 2000 to 20011 | 4.6 | N/A | N/A | N/A | N/A | N/A | N/A | N/A | N/A | N/A | N/A |
| 2001 to 2002 | 4.1 | x | 0.1 | 0.1 | 0.1 | 0.4 | 0.0s | 0.3 | 0.7 | 2.3 | x |
| 2002 to 2003 | 3.8 | x | 0.2 | 0.1 | 0.0s | 0.4 | 0.0s | 0.2 | 0.7 | 2.3 | x |
| 2003 to 2004 | 3.7 | x | 0.1 | 0.1 | 0.0s | 0.3 | 0.0s | 0.1 | 0.7 | 2.2 | x |
| 2004 to 2005 | 3.6 | x | 0.1 | 0.0s | 0.0s | 0.3 | 0.1 | 0.1 | 0.6 | 2.3 | x |
| 2005 to 2006 | 3.0 | x | 0.1 | 0.0s | 0.0s | 0.3 | 0.1 | 0.1 | 0.5 | 1.9 | x |
| 2006 to 2007 | 2.7 | x | 0.1 | 0.0s | 0.0 | 0.2 | 0.0s | 0.0s | 0.3 | 2.0 | x |
| 2007 to 2008 | 2.6 | x | 0.1 | 0.0s | 0.0s | 0.2 | 0.0s | 0.0s | 0.1 | 1.9 | x |
| 2008 to 2009 | 2.8 | x | 0.2 | 0.0s | 0.0s | 0.2 | 0.0s | 0.0s | 0.1 | 2.2 | x |
x: cells are suppressed to prevent statistical disclosure of number of recipients greater than 0 but less than 10.
0.0s: value rounded to 0.0 (zero).
1 Provincial and territorial statistics are not available.
Table 4.2.5B Canada Student Grants for part-time students by province and territory, amount disbursed: Canada Student Grant: Millions of dollars
| Loan Year | Canada | N.L. | P.E.I. | N.S. | N.B. | Ont. | Man. | Sask. | Alta. | B.C. | Y.T. |
|---|---|---|---|---|---|---|---|---|---|---|---|
| 2009 to 2010 | 4.5 | x | 0.2 | 0.1 | 0.1 | 1.2 | 0.2 | 0.1 | 0.4 | 2.3 | x |
| 2010 to 2011 | 6.8 | x | 0.3 | 0.1 | 0.1 | 2.2 | 0.2 | 0.1 | 0.6 | 3.2 | x |
| 2011 to 2012 | 10.0 | x | 0.3 | 0.1 | 0.1 | 4.6 | 0.3 | 0.1 | 0.4 | 4.0 | x |
| 2012 to 2013 | 14.9 | x | 0.5 | 0.1 | 0.1 | 7.1 | 0.4 | 0.1 | 1.0 | 5.5 | x |
| 2013 to 2014 | 17.3 | 0.1 | 0.5 | 0.2 | 0.1 | 8.6 | 0.5 | 0.1 | 1.0 | 6.2 | 0.0 |
| 2014 to 2015 | 18.1 | x | 0.5 | 0.2 | 0.1 | 9.8 | 0.4 | 0.1 | 1.1 | 5.7 | x |
| 2015 to 2016 | 19.8 | x | 0.6 | 0.2 | 0.1 | 10.7 | 0.5 | 0.2 | 1.1 | 6.3 | x |
| 2016 to 2017 | 29.0 | x | 0.8 | 0.3 | 0.2 | 15.2 | 0.5 | 0.2 | 2.0 | 9.5 | x |
| 2017 to 2018 | 33.0 | x | 0.8 | 0.3 | 0.2 | 20.2 | 0.5 | 0.3 | 2.1 | 8.6 | x |
x: cells are suppressed to prevent statistical disclosure of number of recipients greater than 0 but less than 10.
5 Appendix
5.1 Profiles - Canada
Table 5.1.1 Profile of full-time students who received Canada Student Grants and/or Canada Student Loans
Table 5.1.1A Profile of full-time students who received Canada Student Grants and/or Canada Student Loans: LY 2017 to 2018 by Gender
| Gender | Number | Percent |
|---|---|---|
| Female | 365,729 | 59 |
| Male | 252,873 | 41 |
| Total | 618,602 | 100 |
Table 5.1.1B Profile of full-time students who received Canada Student Grants and/or Canada Student Loans: LY 2017 to 2018 by Age group
| Age group | Number | Percent |
|---|---|---|
| Younger than 20 years | 179,220 | 29 |
| 20 to 24 years | 276,593 | 45 |
| 25 to 29 years | 83,627 | 14 |
| 30 to 34 years | 32,787 | 5 |
| 35 to 39 years | 20,198 | 3 |
| 40 to 44 years | 12,755 | 2 |
| 45 to 49 years | 7,494 | 1 |
| 50 years and older | 5,928 | 1 |
| Total | 618,602 | 100 |
Table 5.1.1C Profile of full-time students who received Canada Student Grants and/or Canada Student Loans: LY 2017 to 2018 by Level of study
| Level of study | Number | Percent |
|---|---|---|
| Certificate or diploma | 220,516 | 36 |
| Undergraduate | 367,966 | 59 |
| Master | 24,814 | 4 |
| Doctorate | 5,306 | 1 |
| Total | 618,602 | 100 |
Table 5.1.1D Profile of full-time students who received Canada Student Grants and/or Canada Student Loans: LY 2017 to 2018 by Type of institution
| Type of institution | Number | Percent |
|---|---|---|
| University | 353,734 | 57 |
| College | 207,561 | 34 |
| Private | 57,307 | 9 |
| Total | 618,602 | 100 |
Table 5.1.2 Profile of part-time students who received Canada Student Grants and/or Canada Student Loans
Table 5.1.2A Profile of part-time students who received Canada Student Grants and/or Canada Student Loans: LY 2017 to 2018 by Gender
| Gender | Number | Percent |
|---|---|---|
| Female | 15,438 | 63 |
| Male | 8,921 | 37 |
| Total | 24,359 | 100 |
Table 5.1.2B Profile of part-time students who received Canada Student Grants and/or Canada Student Loans: LY 2017 to 2018 by Age group
| Age group | Number | Percent |
|---|---|---|
| Younger than 20 years | 5,762 | 24 |
| 20 to 24 years | 10,890 | 45 |
| 25 to 29 years | 3,379 | 14 |
| 30 to 34 years | 1,632 | 7 |
| 35 to 39 years | 1,107 | 5 |
| 40 to 44 years | 753 | 3 |
| 45 to 49 years | 448 | 2 |
| 50 years and older | 388 | 2 |
| Total | 24,359 | 100 |
Table 5.1.2C Profile of part-time students who received Canada Student Grants and/or Canada Student Loans: LY 2017 to 2018 by Level of study
| Level of study | Number | Percent |
|---|---|---|
| Certificate or diploma | 7,359 | 30 |
| Undergraduate | 16,010 | 66 |
| Master | 930 | 4 |
| Doctorate | 60 | 0s |
| Total | 24,359 | 100 |
0s: value rounded to 0 (zero).
Table 5.1.2D Profile of part-time students who received Canada Student Grants and/or Canada Student Loans: LY 2017 to 2018 by Type of institution
| Type of institution | Number | Percent |
|---|---|---|
| University | 16,260 | 67 |
| College | 7,669 | 31 |
| Private | 430 | 2 |
| Total | 24,359 | 100 |
Table 5.1.3 Profile of full-time students who received Canada Student Grants
Table 5.1.3A Profile of full-time students who received Canada Student Grants: LY 2017 to 2018 by Gender
| Gender | Number | Percent |
|---|---|---|
| Female | 281,471 | 59 |
| Male | 199,433 | 41 |
| Total | 480,904 | 100 |
Table 5.1.3B Profile of full-time students who received Canada Student Grants: LY 2017 to 2018 by Age group
| Age group | Number | Percent |
|---|---|---|
| Younger than 20 years | 135,742 | 28 |
| 20 to 24 years | 224,322 | 47 |
| 25 to 29 years | 64,188 | 13 |
| 30 to 34 years | 24,432 | 5 |
| 35 to 39 years | 15,120 | 3 |
| 40 to 44 years | 9,004 | 2 |
| 45 to 49 years | 4,770 | 1 |
| 50 years and older | 3,326 | 1 |
| Total | 480,904 | 100 |
Table 5.1.3C Profile of full-time students who received Canada Student Grants: LY 2017 to 2018 by Level of study
| Level of study | Number | Percent |
|---|---|---|
| Certificate or diploma | 157,820 | 33 |
| Undergraduate | 319,157 | 66 |
| Master | 2,929 | 1 |
| Doctorate | 998 | 0s |
| Total | 480,904 | 100 |
0s: value rounded to 0 (zero).
Table 5.1.3D Profile of full-time students who received Canada Student Grants: LY 2017 to 2018 by Type of institution
| Type of institution | Number | Percent |
|---|---|---|
| University | 282,432 | 59 |
| College | 166,714 | 35 |
| Private | 31,758 | 7 |
| Total | 480,904 | 100 |
Table 5.1.4 Profile of part-time students who received Canada Student Grants
Table 5.1.4A Profile of part-time students who received Canada Student Grants: LY 2017 to 2018 by Gender
| Gender | Number | Percent |
|---|---|---|
| Female | 13,217 | 62 |
| Male | 8,051 | 38 |
| Total | 21,268 | 100 |
Table 5.1.4B Profile of part-time students who received Canada Student Grants: LY 2017 to 2018 by Age group
| Age group | Number | Percent |
|---|---|---|
| Younger than 20 years | 5,746 | 27 |
| 20 to 24 years | 10,153 | 48 |
| 25 to 29 years | 2,502 | 12 |
| 30 to 34 years | 1,076 | 5 |
| 35 to 39 years | 741 | 3 |
| 40 to 44 years | 486 | 2 |
| 45 to 49 years | 289 | 1 |
| 50 years and older | 275 | 1 |
| Total | 21,268 | 100 |
Table 5.1.4C Profile of part-time students who received Canada Student Grants: LY 2017 to 2018 by Level of study
| Level of study | Number | Percent |
|---|---|---|
| Certificate or diploma | 6,025 | 28 |
| Undergraduate | 14,608 | 69 |
| Master | 584 | 3 |
| Doctorate | 51 | 0s |
| Total | 21,268 | 100 |
0s: value rounded to 0 (zero).
Table 5.1.4D Profile of part-time students who received Canada Student Grants: LY 2017 to 2018 by Type of institution
| Type of institution | Number | Percent |
|---|---|---|
| University | 14,611 | 69 |
| College | 6,364 | 30 |
| Private | 293 | 1 |
| Total | 21,268 | 100 |
Table 5.1.5 Profile of full-time students who received Canada Student Loans
Table 5.1.5A Profile of full-time students who received Canada Student Loans: LY 2017 to 2018 by Gender
| Gender | Number | Percent |
|---|---|---|
| Female | 345,726 | 59 |
| Male | 239,293 | 41 |
| Total | 585,019 | 100 |
Table 5.1.5B Profile of full-time students who received Canada Student Loans: LY 2017 to 2018 by Age group
| Age group | Number | Percent |
|---|---|---|
| Younger than 20 years | 169,814 | 29 |
| 20 to 24 years | 260,902 | 45 |
| 25 to 29 years | 79,821 | 14 |
| 30 to 34 years | 30,983 | 5 |
| 35 to 39 years | 18,974 | 3 |
| 40 to 44 years | 11,957 | 2 |
| 45 to 49 years | 7,076 | 1 |
| 50 years and older | 5,492 | 1 |
| Total | 585,019 | 100 |
Table 5.1.5C Profile of full-time students who received Canada Student Loans: LY 2017 to 2018 by Level of study
| Level of study | Number | Percent |
|---|---|---|
| Certificate or diploma | 206,985 | 35 |
| Undergraduate | 348,243 | 60 |
| Master | 24,587 | 4 |
| Doctorate | 5,204 | 1 |
| Total | 585,019 | 100 |
Table 5.1.5D Profile of full-time students who received Canada Student Loans: LY 2017 to 2018 by Type of institution
| Type of institution | Number | Percent |
|---|---|---|
| University | 335,682 | 57 |
| College | 195,500 | 33 |
| Private | 53,837 | 9 |
| Total | 585,019 | 100 |
Table 5.1.6 Profile of part-time students who received Canada Student Loans
Table 5.1.6A Profile of part-time students who received Canada Student Loans: LY 2017 to 2018 by Gender
| Gender | Number | Percent |
|---|---|---|
| Female | 8,624 | 64 |
| Male | 4,910 | 36 |
| Total | 13,534 | 100 |
Table 5.1.6B Profile of part-time students who received Canada Student Loans: LY 2017 to 2018 by Age group
| Age group | Number | Percent |
|---|---|---|
| Younger than 20 years | 2,328 | 17 |
| 20 to 24 years | 5,909 | 44 |
| 25 to 29 years | 2,274 | 17 |
| 30 to 34 years | 1,176 | 9 |
| 35 to 39 years | 772 | 6 |
| 40 to 44 years | 531 | 4 |
| 45 to 49 years | 314 | 2 |
| 50 years and older | 230 | 2 |
| Total | 13,534 | 100 |
Table 5.1.6C Profile of part-time students who received Canada Student Loans: LY 2017 to 2018 by Level of study
| Level of study | Number | Percent |
|---|---|---|
| Certificate or diploma | 4,158 | 31 |
| Undergraduate | 8,518 | 63 |
| Master | 807 | 6 |
| Doctorate | 51 | 0s |
| Total | 13,534 | 100 |
0s: value rounded to 0 (zero).
Table 5.1.6D Profile of part-time students who received Canada Student Loans: LY 2017 to 2018 by Type of institution
| Type of institution | Number | Percent |
|---|---|---|
| University | 8,848 | 65 |
| College | 4,314 | 32 |
| Private | 372 | 3 |
| Total | 13,534 | 100 |
Table 5.1.7 Profile of students who received Canada Student Grant for Full-Time Students
Table 5.1.7A Profile of students who received Canada Student Grant for Full-Time Students: LY 2017 to 2018 by Gender
| Gender | Number | Percent |
|---|---|---|
| Female | 261,066 | 58 |
| Male | 190,230 | 42 |
| Total | 451,296 | 100 |
Table 5.1.7B Profile of students who received Canada Student Grant for Full-Time Students: LY 2017 to 2018 by Age group
| Age group | Number | Percent |
|---|---|---|
| Younger than 20 years | 131,635 | 29 |
| 20 to 24 years | 217,628 | 48 |
| 25 to 29 years | 59,113 | 13 |
| 30 to 34 years | 19,633 | 4 |
| 35 to 39 years | 10,865 | 2 |
| 40 to 44 years | 6,361 | 1 |
| 45 to 49 years | 3,558 | 1 |
| 50 years and older | 2,503 | 1 |
| Total | 451,296 | 100 |
Table 5.1.7C Profile of students who received Canada Student Grant for Full-Time Students: LY 2017 to 2018 by Level of study
| Level of study | Number | Percent |
|---|---|---|
| Certificate or diploma | 136,202 | 30 |
| Undergraduate | 315,084 | 70 |
| Master | x | x |
| Doctorate | x | x |
| Total | 451,296 | 100 |
x: cells are suppressed to prevent statistical disclosure of number of recipients greater than 0 but less than 10.
Table 5.1.7D Profile of students who received Canada Student Grant for Full-Time Students: LY 2017 to 2018 by Type of institution
| Type of institution | Number | Percent |
|---|---|---|
| University | 274,690 | 61 |
| College | 156,199 | 35 |
| Private | 20,407 | 5 |
| Total | 451,296 | 100 |
Table 5.1.8 Profile of students who received Canada Student Grant for Full-Time Students with Dependants
Table 5.1.8A Profile of students who received Canada Student Grant for Full-Time Students with Dependants: LY 2017 to 2018 by Gender
| Gender | Number | Percent |
|---|---|---|
| Female | 31,468 | 78 |
| Male | 9,055 | 22 |
| Total | 40,523 | 100 |
Table 5.1.8B Profile of students who received Canada Student Grant for Full-Time Students with Dependants: LY 2017 to 2018 by Age group
| Age group | Number | Percent |
|---|---|---|
| Younger than 20 years | 551 | 1 |
| 20 to 24 years | 6,160 | 15 |
| 25 to 29 years | 9,046 | 22 |
| 30 to 34 years | 9,419 | 23 |
| 35 to 39 years | 8,104 | 20 |
| 40 to 44 years | 4,720 | 12 |
| 45 to 49 years | 1,880 | 5 |
| 50 years and older | 643 | 2 |
| Total | 40,523 | 100 |
Table 5.1.8C Profile of students who received Canada Student Grant for Full-Time Students with Dependants: LY 2017 to 2018 by Level of study
| Level of study | Number | Percent |
|---|---|---|
| Certificate or diploma | 29,137 | 72 |
| Undergraduate | 9,328 | 23 |
| Master | 1,335 | 3 |
| Doctorate | 723 | 2 |
| Total | 40,523 | 100 |
Table 5.1.8D Profile of students who received Canada Student Grant for Full-Time Students with Dependants: LY 2017 to 2018 by Type of institution
| Type of institution | Number | Percent |
|---|---|---|
| University | 9,234 | 23 |
| College | 17,934 | 44 |
| Private | 13,355 | 33 |
| Total | 40,523 | 100 |
Table 5.1.9 Profile of students who received Canada Student Grant for Students with Permanent Disabilities
Table 5.1.9A Profile of students who received Canada Student Grant for Students with Permanent Disabilities: LY 2017 to 2018 by Gender
| Gender | Number | Percent |
|---|---|---|
| Female | 28,053 | 60 |
| Male | 18,379 | 40 |
| Total | 46,432 | 100 |
Table 5.1.9B Profile of students who received Canada Student Grant for Students with Permanent Disabilities: LY 2017 to 2018 by Age group
| Age group | Number | Percent |
|---|---|---|
| Younger than 20 years | 10,043 | 22 |
| 20 to 24 years | 19,427 | 42 |
| 25 to 29 years | 8,274 | 18 |
| 30 to 34 years | 3,558 | 8 |
| 35 to 39 years | 1,967 | 4 |
| 40 to 44 years | 1,192 | 3 |
| 45 to 49 years | 874 | 2 |
| 50 years and older | 1,097 | 2 |
| Total | 46,432 | 100 |
Table 5.1.9C Profile of students who received Canada Student Grant for Students with Permanent Disabilities: LY 2017 to 2018 by Level of study
| Level of study | Number | Percent |
|---|---|---|
| Certificate or diploma | 19,968 | 43 |
| Undergraduate | 24,462 | 53 |
| Master | 1,698 | 4 |
| Doctorate | 304 | 1 |
| Total | 46,432 | 100 |
Table 5.1.9D Profile of students who received Canada Student Grant for Students with Permanent Disabilities: LY 2017 to 2018 by Type of institution
| Type of institution | Number | Percent |
|---|---|---|
| University | 22,886 | 49 |
| College | 21,029 | 45 |
| Private | 2,517 | 5 |
| Total | 46,432 | 100 |
Table 5.1.10 Profile of students who received Canada Student Grant for Services and Equipment for Students with Permanent Disabilities
Table 5.1.10A Profile of students who received Canada Student Grant for Services and Equipment for Students with Permanent Disabilities: LY 2017 to 2018 by Gender
| Gender | Number | Percent |
|---|---|---|
| Female | 6,477 | 61 |
| Male | 4,073 | 39 |
| Total | 10,550 | 100 |
Table 5.1.10B Profile of students who received Canada Student Grant for Services and Equipment for Students with Permanent Disabilities: LY 2017 to 2018 by Age group
| Age group | Number | Percent |
|---|---|---|
| Younger than 20 years | 3,122 | 30 |
| 20 to 24 years | 3,531 | 33 |
| 25 to 29 years | 1,666 | 16 |
| 30 to 34 years | 834 | 8 |
| 35 to 39 years | 523 | 5 |
| 40 to 44 years | 316 | 3 |
| 45 to 49 years | 245 | 2 |
| 50 years and older | 313 | 3 |
| Total | 10,550 | 100 |
Table 5.1.10C Profile of students who received Canada Student Grant for Services and Equipment for Students with Permanent Disabilities: LY 2017 to 2018 by Level of study
| Level of study | Number | Percent |
|---|---|---|
| Certificate or diploma | 5,289 | 50 |
| Undergraduate | 4,963 | 47 |
| Master | 253 | 2 |
| Doctorate | 45 | 0s |
| Total | 10,550 | 100 |
0s: value rounded to 0 (zero).
Table 5.1.10D Profile of students who received Canada Student Grant for Services and Equipment for Students with Permanent Disabilities: LY 2017 to 2018 by Type of institution
| Type of institution | Number | Percent |
|---|---|---|
| University | 4,708 | 45 |
| College | 5,468 | 52 |
| Private | 374 | 4 |
| Total | 10,550 | 100 |
Table 5.1.11 Profile of students who received Canada Student Grant for Part-Time Studies
Table 5.1.11A Profile of students who received Canada Student Grant for Part-Time Studies: LY 2017 to 2018 by Gender
| Gender | Number | Percent |
|---|---|---|
| Female | 13,213 | 62 |
| Male | 8,048 | 38 |
| Total | 21,261 | 100 |
Table 5.1.11B Profile of students who received Canada Student Grant for Part-Time Studies: LY 2017 to 2018 by Age group
| Age group | Number | Percent |
|---|---|---|
| Younger than 20 years | 5,746 | 27 |
| 20 to 24 years | 10,153 | 48 |
| 25 to 29 years | 2,500 | 12 |
| 30 to 34 years | 1,075 | 5 |
| 35 to 39 years | 738 | 3 |
| 40 to 44 years | 486 | 2 |
| 45 to 49 years | 289 | 1 |
| 50 years and older | 274 | 1 |
| Total | 21,261 | 100 |
Table 5.1.11C Profile of students who received Canada Student Grant for Part-Time Studies: LY 2017 to 2018 by Level of study
| Level of study | Number | Percent |
|---|---|---|
| Certificate or diploma | 6,023 | 28 |
| Undergraduate | 14,607 | 69 |
| Master | 581 | 3 |
| Doctorate | 50 | 0s |
| Total | 21,261 | 100 |
0s: value rounded to 0 (zero).
Table 5.1.11D Profile of students who received Canada Student Grant for Part-Time Studies: LY 2017 to 2018 by Type of institution
| Type of institution | Number | Percent |
|---|---|---|
| University | 14,605 | 69 |
| College | 6,364 | 30 |
| Private | 292 | 1 |
| Total | 21,261 | 100 |
Table 5.1.12 Profile of students who received Canada Student Grant for Part-Time Students with Dependants
Table 5.1.12A Profile of students who received Canada Student Grant for Part-Time Students with Dependants: LY 2017 to 2018 by Gender
| Gender | Number | Percent |
|---|---|---|
| Female | 285 | 76 |
| Male | 91 | 24 |
| Total | 376 | 100 |
Table 5.1.12B Profile of students who received Canada Student Grant for Part-Time Students with Dependants: LY 2017 to 2018 by Age group
| Age group | Number | Percent |
|---|---|---|
| Younger than 20 years | x | x |
| 20 to 24 years | 29 | 8 |
| 25 to 29 years | 63 | 17 |
| 30 to 34 years | 96 | 26 |
| 35 to 39 years | 92 | 24 |
| 40 to 44 years | 56 | 15 |
| 45 to 49 years | 26 | 7 |
| 50 years and older | x | x |
| Total | 376 | 100 |
x: cells are suppressed to prevent statistical disclosure of number of recipients greater than 0 but less than 10.
Table 5.1.12C Profile of students who received Canada Student Grant for Part-Time Students with Dependants: LY 2017 to 2018 by Level of study
| Level of study | Number | Percent |
|---|---|---|
| Certificate or diploma | 195 | 52 |
| Undergraduate | 96 | 26 |
| Master | x | x |
| Doctorate | x | x |
| Total | 376 | 100 |
x: cells are suppressed to prevent statistical disclosure of number of recipients greater than 0 but less than 10.
Table 5.1.12D Profile of students who received Canada Student Grant for Part-Time Students with Dependants: LY 2017 to 2018 by Type of institution
| Type of institution | Number | Percent |
|---|---|---|
| University | 159 | 42 |
| College | 161 | 43 |
| Private | 56 | 15 |
| Total | 376 | 100 |
Glossary
Canada Apprentice Loans (CAL)
In January 2015, the Government launched the CAL initiative. Borrowers can apply for up to $4,000 in loans per period of technical training, for up to 5 technical training periods. Loans are available to help pay for tuition, tools, equipment and living expenses, to cover forgone wages and to help support family during training.
Canada Student Grants
Canada Student Grants (CSG) are non-repayable student financial assistance. In LY 2017 to 2018, CSG are available for:
- students from low- and middle-income families: up to $375 per month of study
- low- and middle-income full-time students with dependants: $200 per month of study for each dependant under 12 years of age. If the dependant has a permanent disability, this also applies to dependants over the age of 12 years
- low- and middle-income part-time students with dependants: Up to a maximum of $1,920
- part-time studies: For students from low- and middle- income families, up to $1,800 per loan year, depending on assessed need
- students with permanent disabilities: $2,000 per year for full-time or part-time students with permanent disabilities
- services and equipment for students with permanent disabilities: Up to $8,000 per year to cover exceptional education-related costs. Costs can include (but are not limited to) tutors, note-takers, sign interpreters, braillers and technical aids
Canada Student Loan Forgiveness for Family Doctors and Nurses
Family doctors, residents in family medicine, nurse practitioners, and nurses that practice in under-served rural or remote communities may be eligible to have some of their Canada Student Loans (CSL) forgiven. Family doctors and residents in family medicine may receive up to $8,000 per year and all nurses may receive up to $4,000 per year. The program operates on a fiscal year basis (April 1st to March 31st).
Consolidation
Borrowers consolidate their student loan(s) 6 months after completing their post-secondary studies (or ending full-time studies). Repayment begins once they have consolidated their loans.
Default
A loan is in default when it is in arrears for greater than 270 days under the direct lending regime.
Default rate
The CSLP measures default using a 3 year cohort default rate. This rate is defined as the percentage of loan dollars that enter repayment in a given loan year (cohort) and default within 3 years. For example, the 3 year default rate for the LY 2016 to 2017 cohort represents the proportion of loan dollars that entered repayment in LY 2016 to 2017 and defaulted before August 1, 2019.
Designated
A designated post-secondary educational institution meets provincial and federal eligibility criteria. Students attending these schools can apply for government-sponsored student financial assistance, such as Canada Student Loans.
Direct loans
As of August 2000, the Federal Government issues Canada Student Loans under the direct loans regime. The Government directly finances the loans, and a third-party service provider administers the loan process.
Fiscal year
April 1 to March 31.
Full-time
A full-time student is a student enrolled with at least a 60% course load (or 40% for students with permanent disabilities) in a program of study for at least 12 consecutive weeks, at a designated post-secondary educational institution.
Guaranteed loans
Until 1995, financial institutions such as banks provided Canada Student Loans under the guaranteed loans regime. If a student defaulted on a guaranteed loan, the Government paid out the bank. In this case, the student owed their debt directly to the Government.
Integrated province
In integrated provinces, borrowers receive and repay one federal-provincial integrated loan. The federal and provincial governments work together to make applying for, managing and repaying loans easier. The CSLP has integration agreements with 5 provinces: Ontario, New Brunswick, Newfoundland and Labrador, Saskatchewan and British Columbia.
In-study
The status of borrowers attending full-time or part-time studies at a post-secondary educational institution.
In-study interest subsidy
This is the Canada Student Loan interest covered by the Government of Canada during the post-secondary study period.
Loan year
August 1 to July 31.
National Student Loans Service Centre (NSLSC)
The NSLSC is the main point of contact for borrowers in managing their Canada Student loans, from loan disbursement to repayment and repayment assistance. A third-party service provider administers the service centre. The service centre manages all Canada Student Loans issued on or after August 1, 2000, as well as integrated student loans for:
- New Brunswick and Newfoundland and Labrador issued on or after August 1, 2000
- Ontario and Saskatchewan issued on or after August 1, 2001, and
- British Columbia issued on or after August 1, 2011
Part-time
A part-time student is a student taking between 20% and 59% of a full course load. Students with permanent disabilities are part-time if they are taking between 20% and 39% of a full course load. If these students are taking between 40% and 59% of a full course load, they can choose to be a full- or part-time student for the purpose of the CSLP.
Participating provinces/territories
The provinces and territories that choose to deliver financial assistance to students within the framework of the CSLP include Newfoundland and Labrador, Prince Edward Island, Nova Scotia, New Brunswick, Ontario, Manitoba, Saskatchewan, Alberta, British Columbia and Yukon.
Province/territory of residence
A student’s province or territory of residence is the province or territory where they have most recently lived for at least 12 consecutive months. This does not include time spent in a province or territory as a full-time student at a post-secondary institution. For example, an individual from Manitoba studying in Ontario resides in Manitoba.
Post-secondary education
Levels of education following secondary school (high school) at all designated public or private post-secondary institutions.
Repayment
The status of borrowers who have begun repaying their Canada Student Loans. Repayment begins 6 months following the end of studies.
Repayment Assistance Plan (RAP)
On August 1, 2009, the RAP replaced the CSLP’s previous debt management programs (Interest Relief and Debt Reduction in Repayment). RAP is a temporary repayment assistance measure where a borrower repays an affordable monthly amount. Eligible borrowers make either a reduced (affordable) or zero payment, based on family income and family size. RAP ensures that the repayment period will not exceed 15 years (or 10 years for a borrower with a permanent disability). Under RAP, eligible borrowers receive RAP for periods of 6 months and can reapply as long as they remain eligible. RAP has 2 stages:
- RAP Stage 1: The Government of Canada and the relevant provincial government pay the interest owing, that the borrower’s payment does not cover. This stage can last up to 10 6-month periods or 60 months during the 10-year period after a borrower leaves school
- RAP Stage 2: This stage begins once the borrower completes Stage 1. If the borrower cannot meet their repayment obligations, the Government will cover both the principal and interest that exceeds the borrowers reduced monthly payments
Repayment Assistance Plan for Borrowers with a Permanent Disability (RAP-PD)
RAP-PD assists borrowers experiencing difficulty meeting their repayment obligations. RAP-PD provides accelerated repayment assistance that considers the additional living costs faced by people with permanent disabilities. RAP-PD recipients can obtain the following benefits:
- RAP-PD borrowers proceed directly to Stage 2 whereby the government covers the principal and interest not covered by the borrower’s monthly RAP payments
- eligible RAP-PD borrowers can claim disability-related expenses; this is taken into consideration during RAP-PD application assessment
Repayment Assistance Plan (RAP) First Year Uptake Rate
The first year RAP uptake rate is the ratio of the number of full-time students who entered repayment and used RAP in the same year to the total number of full-time students who entered repayment during the year.
Risk-shared loans
Between 1995 and 2000, financial institutions such as banks provided Canada Student Loans under this regime. Here, financial institutions assumed responsibility for some of the risk of defaulted loans, in return for a payment from the Government.
Severe Permanent Disability Benefit
In certain cases, some borrowers may be eligible for loan cancellation. This benefit allows the cancellation of repayment obligations for those with permanent disabilities. Beneficiaries are those whose permanent disability, expected to remain with them for life, prevents them from studying at a post-secondary level and taking part in the labour force.
Student financial assistance
Student financial assistance is any form of financial aid provided by the Canada Student Loans Program to students while they enroll in designated post-secondary education institutions. Assistance includes Canada Student Grants, Canada Student Loans and in-study interest subsidy.