
EI Monitoring and Assessment Report 2012 Annex 1 - Key Labour Market Statistics
Notice: Refer to the Table of contents to navigate through the EI Monitoring and Assessment Report .
Annex 1.1 Labour Force Estimates
Annex 1.1 Labour Force Estimates
| % Change1 | Annual Labour Force Estimates, by Fiscal Year (000s)2 | ||||||||||
|---|---|---|---|---|---|---|---|---|---|---|---|
| 2010/11–2011/12 | 2011/12 | 2010/11 | 2009/10 | 2008/09 | 2007/08 | 2006/07 | 2005/06 | 2004/05 | 2003/04 | 2002/03 | |
| Population | 1.2 | 28,066.4 | 27,743.9 | 27,391.7 | 27,006.9 | 26,613.4 | 26,239.1 | 25,871.4 | 25,515.8 | 25,180.0 | 24,865.3 |
| Labour force | 0.8 | 18,724.0 | 18,584.2 | 18,363.9 | 18,248.3 | 17,968.1 | 17,612.5 | 17,335.7 | 17,189.7 | 17,008.0 | 16,683.9 |
| Employment3 | 1.3 | 17,344.3 | 17,121.3 | 16,827.6 | 17,038.2 | 16,896.3 | 16,513.3 | 16,187.5 | 15,971.1 | 15,722.8 | 15,426.1 |
| Unemployment | -5.7 | 1,379.7 | 1,463.0 | 1,536.3 | 1,210.1 | 1,071.8 | 1,099.2 | 1,148.2 | 1,218.6 | 1,285.2 | 1,257.8 |
| % Point Change4 | Annual Labour Force Estimates, by Fiscal Year (%)2 | ||||||||||
| 2010/11–2011/12 | 2011/12 | 2010/11 | 2009/10 | 2008/09 | 2007/08 | 2006/07 | 2005/06 | 2004/05 | 2003/04 | 2002/03 | |
| Unemployment rate | -0.5 | 7.4 | 7.9 | 8.4 | 6.6 | 6.0 | 6.3 | 6.6 | 7.1 | 7.5 | 7.5 |
| Participation rate | -0.3 | 66.7 | 67.0 | 67.0 | 67.5 | 67.5 | 67.1 | 67.0 | 67.4 | 67.5 | 67.1 |
| Employment rate | 0.1 | 61.8 | 61.7 | 61.4 | 63.1 | 63.5 | 62.9 | 62.6 | 62.6 | 62.5 | 62.0 |
Source: Statistics Canada, Labour Force Survey.
- Percentage growth between 2010/11 and 2011/12.
- Fiscal year data calculated using annual averages of unadjusted monthly data.
- Employment includes those who are self-employed.
- Percentage point difference between 2010/11 and 2011/12.
Annex 1.2 Employment, by Province, Gender and Age
Annex 1.2 Employment, by Province, Gender and Age
| % Change | Annual Employment, by Fiscal Year (000s)1 | ||||||||||
|---|---|---|---|---|---|---|---|---|---|---|---|
| 2010/11–2011/12 | 2011/12 | 2010/11 | 2009/10 | 2008/09 | 2007/08 | 2006/07 | 2005/06 | 2004/05 | 2003/04 | 2002/03 | |
| NATIONAL | 1.3 | 17,344.3 | 17,121.3 | 16,827.6 | 17,038.2 | 16,896.3 | 16,513.3 | 16,187.5 | 15,971.1 | 15,722.8 | 15,426.1 |
| Province | |||||||||||
| Newfoundland and Labrador | 1.5 | 225.6 | 222.3 | 213.2 | 216.8 | 217.9 | 215.9 | 212.5 | 213.6 | 212.7 | 208.7 |
| Prince Edward Island | 2.6 | 72.3 | 70.5 | 69.5 | 69.1 | 68.9 | 68.5 | 67.9 | 67.0 | 66.2 | 64.9 |
| Nova Scotia | 0.2 | 454.1 | 453.2 | 451.0 | 452.5 | 448.5 | 443.3 | 441.5 | 442.0 | 433.2 | 425.1 |
| New Brunswick | -0.9 | 351.6 | 354.7 | 359.4 | 359.0 | 358.7 | 350.5 | 348.8 | 348.7 | 342.8 | 344.4 |
| Quebec | 0.3 | 3,946.3 | 3,934.6 | 3,857.1 | 3,869.6 | 3,856.5 | 3,759.1 | 3,709.7 | 3,684.6 | 3,630.6 | 3,590.2 |
| Ontario | 1.5 | 6,747.1 | 6,646.1 | 6,507.8 | 6,635.8 | 6,595.8 | 6,478.5 | 6,390.0 | 6,317.4 | 6,236.5 | 6,088.8 |
| Manitoba | 0.4 | 625.0 | 622.7 | 610.0 | 609.2 | 600.9 | 590.8 | 582.4 | 580.4 | 572.7 | 569.4 |
| Saskatchewan | 0.4 | 527.1 | 524.8 | 520.3 | 515.6 | 505.5 | 498.4 | 482.1 | 485.2 | 477.6 | 473.8 |
| Alberta | 3.9 | 2,110.7 | 2,032.2 | 2,013.8 | 2,057.6 | 2,006.8 | 1,939.9 | 1,844.5 | 1,787.3 | 1,745.4 | 1,691.6 |
| British Columbia | 1.1 | 2,284.5 | 2,260.1 | 2,225.4 | 2,253.0 | 2,236.8 | 2,168.4 | 2,108.0 | 2,044.9 | 2,005.2 | 1,969.2 |
| Gender | |||||||||||
| Men | 1.5 | 9,106.8 | 8,969.7 | 8,760.6 | 8,958.5 | 8,920.6 | 8,738.9 | 8,621.8 | 8,503.5 | 8,366.8 | 8,244.8 |
| Women | 1.1 | 8,237.5 | 8,151.5 | 8,067.0 | 8,079.7 | 7,975.7 | 7,774.5 | 7,565.8 | 7,467.6 | 7,356.0 | 7,181.3 |
| Age | |||||||||||
| 15 to 24 years (youth) | 0.3 | 2,460.9 | 2,454.7 | 2,454.5 | 2,617.8 | 2,628.9 | 2,560.6 | 2,498.5 | 2,465.4 | 2,433.8 | 2,416.2 |
| 25 to 54 years (core age) | 0.8 | 11,784.7 | 11,685.8 | 11,573.7 | 11,740.5 | 11,715.4 | 11,579.2 | 11,440.9 | 11,387.4 | 11,286.0 | 11,192.4 |
| 55 years and over (older workers) | 4.0 | 3,098.7 | 2,980.8 | 2,799.4 | 2,679.8 | 2,551.9 | 2,373.5 | 2,248.1 | 2,118.3 | 2,003.0 | 1,817.5 |
Source: Statistics Canada, Labour Force Survey.
- Fiscal year data calculated using annual averages of unadjusted monthly data.
Annex 1.3 Employment, by Industry, Employment Type, Class of Worker and Job Permanency
Annex 1.3 Employment, by Industry, Employment Type, Class of Worker and Job Permanency
| % Change | Annual Employment, by Fiscal Year (000s)1 | ||||||||||
|---|---|---|---|---|---|---|---|---|---|---|---|
| 2010/11–2011/12 | 2011/12 | 2010/11 | 2009/10 | 2008/09 | 2007/08 | 2006/07 | 2005/06 | 2004/05 | 2003/04 | 2002/03 | |
| NATIONAL | 1.3 | 17,344.3 | 17,121.3 | 16,827.6 | 17,038.2 | 16,896.3 | 16,513.3 | 16,187.5 | 15,971.1 | 15,722.8 | 15,426.1 |
| Industry | |||||||||||
| Goods-Producing Sector | 0.9 | 3,805.9 | 3,770.6 | 3,701.8 | 3,962.3 | 3,978.9 | 3,982.6 | 3,999.2 | 4,003.7 | 3,932.3 | 3,915.2 |
| Agriculture | 0.5 | 304.2 | 302.8 | 313.9 | 318.8 | 334.8 | 343.5 | 350.5 | 328.8 | 329.5 | 333.1 |
| Forestry, fishing, mining, quarrying, oil and gas | 4.2 | 345.7 | 331.7 | 315.9 | 342.4 | 340.6 | 339.8 | 317.4 | 292.1 | 280.8 | 271.7 |
| Utilities | -7.0 | 137.7 | 148.1 | 147.3 | 150.5 | 143.4 | 123.1 | 123.6 | 129.6 | 130.8 | 131.0 |
| Construction | 2.9 | 1,266.5 | 1,231.4 | 1,164.0 | 1,222.4 | 1,155.1 | 1,078.1 | 1,034.8 | 967.8 | 915.4 | 872.7 |
| Manufacturing | -0.3 | 1,751.9 | 1,756.6 | 1,760.7 | 1,928.3 | 2,004.9 | 2,098.2 | 2,172.8 | 2,285.4 | 2,275.8 | 2,306.7 |
| Services-Producing Sector | 1.4 | 13,538.4 | 13,350.7 | 13,125.8 | 13,075.9 | 12,917.4 | 12,530.7 | 12,188.3 | 11,967.4 | 11,790.6 | 11,510.8 |
| Trade | -0.5 | 2,663.6 | 2,677.1 | 2,655.1 | 2,675.9 | 2,686.5 | 2,621.2 | 2,580.2 | 2,513.9 | 2,467.5 | 2,403.2 |
| Transportation and warehousing | 3.4 | 844.9 | 817.4 | 803.6 | 845.5 | 828.7 | 799.0 | 798.5 | 799.0 | 799.6 | 769.0 |
| Finance, insurance, real estate and leasing | -0.9 | 1,077.9 | 1,087.9 | 1,098.7 | 1,075.6 | 1,061.7 | 1,046.8 | 989.3 | 976.7 | 931.2 | 906.7 |
| Professional, scientific and technical services | 2.4 | 1,313.1 | 1,282.1 | 1,203.1 | 1,188.3 | 1,150.0 | 1,088.0 | 1,057.8 | 1,014.3 | 1,001.4 | 987.2 |
| Business, building and other support services | -0.1 | 677.5 | 678.0 | 654.2 | 671.4 | 703.6 | 690.0 | 659.9 | 633.1 | 615.4 | 598.1 |
| Educational services | 0.7 | 1,226.5 | 1,218.2 | 1,203.9 | 1,181.3 | 1,183.5 | 1,161.3 | 1,120.7 | 1,041.4 | 1,033.2 | 1,012.6 |
| Health care and social assistance | 2.3 | 2,096.8 | 2,050.1 | 1,961.7 | 1,915.2 | 1,843.6 | 1,802.0 | 1,725.0 | 1,719.6 | 1,687.8 | 1,635.4 |
| Information, culture and recreation | 2.8 | 790.8 | 769.5 | 772.1 | 753.2 | 776.0 | 748.9 | 732.6 | 733.3 | 723.5 | 710.7 |
| Accommodation and food services | 5.2 | 1,106.6 | 1,052.0 | 1,057.2 | 1,087.3 | 1,069.0 | 1,031.4 | 998.0 | 1,007.2 | 994.4 | 992.8 |
| Other services | 2.4 | 770.8 | 752.8 | 782.0 | 755.8 | 728.7 | 707.4 | 694.2 | 702.6 | 709.5 | 699.3 |
| Public administration | 0.5 | 970.1 | 965.6 | 934.3 | 926.4 | 886.3 | 834.5 | 832.2 | 826.3 | 827.0 | 795.9 |
| Employment Type | |||||||||||
| Full-time | 1.8 | 14,041.3 | 13,790.9 | 13,592.1 | 13,849.6 | 13,812.8 | 13,511.9 | 13,215.1 | 13,011.0 | 12,763.2 | 12,515.4 |
| Part-time | -0.8 | 3,302.9 | 3,330.4 | 3,235.5 | 3,188.6 | 3,083.4 | 3,001.4 | 2,972.4 | 2,960.1 | 2,959.7 | 2,910.6 |
| Class of Worker | |||||||||||
| Employees | 1.5 | 14,677.0 | 14,457.1 | 14,130.0 | 14,404.6 | 14,276.7 | 14,006.6 | 13,654.4 | 13,481.3 | 13,304.3 | 13,071.7 |
| Public sector employees | 0.8 | 3,563.9 | 3,535.2 | 3,439.5 | 3,409.2 | 3,319.8 | 3,191.3 | 3,130.4 | 3,055.5 | 2,968.8 | 2,915.5 |
| Private sector employees | 1.8 | 11,113.1 | 10,921.9 | 10,690.5 | 10,995.4 | 10,956.8 | 10,815.4 | 10,524.0 | 10,425.8 | 10,335.6 | 10,156.2 |
| Self-employed2 | 0.1 | 2,667.3 | 2,664.2 | 2,697.6 | 2,633.6 | 2,619.6 | 2,506.7 | 2,533.1 | 2,489.8 | 2,418.5 | 2,354.4 |
| Job Permanency | |||||||||||
| Employees | 1.5 | 14,677.0 | 14,457.1 | 14,130.0 | 14,404.6 | 14,276.7 | 14,006.6 | 13,654.4 | 13,481.3 | 13,304.3 | 13,071.7 |
| Permanent employees3 | 1.2 | 12,665.7 | 12,518.1 | 12,322.4 | 12,640.4 | 12,453.3 | 12,174.2 | 11,850.1 | 11,748.1 | 11,653.1 | 11,394.2 |
| Temporary employees4 | 3.7 | 2,011.3 | 1,939.0 | 1,807.6 | 1,764.2 | 1,823.4 | 1,832.5 | 1,804.3 | 1,733.3 | 1,651.3 | 1,677.5 |
Source: Statistics Canada, Labour Force Survey.
- Fiscal year data calculated using annual averages of unadjusted monthly data.
- Includes both incorporated and unincorporated working owners, self-employed persons who do not have a business, and persons working in a family business without pay.
- A permanent job is one that is expected to last as long as the employee wants it, if business conditions permit—that is, there is no predetermined end date.
- A temporary job has a predetermined end date or will end as soon as a specified project is completed. This category includes seasonal jobs; temporary, term or contract jobs, including work done through a temporary help agency; casual jobs; and other temporary work.
Annex 1.4 Unemployment Rate, by Province, Gender, Age, Educational Level and Industry
Annex 1.4 Unemployment Rate, by Province, Gender, Age, Educational Level and Industry
| % Point Change1 | Annual Unemployment Rate, by Fiscal Year (%)2 | ||||||||||
|---|---|---|---|---|---|---|---|---|---|---|---|
| 2010/11–2011/12 | 2011/12 | 2010/11 | 2009/10 | 2008/09 | 2007/08 | 2006/07 | 2005/06 | 2004/05 | 2003/04 | 2002/03 | |
| NATIONAL | -0.5 | 7.4 | 7.9 | 8.3 | 6.6 | 6.0 | 6.3 | 6.6 | 7.1 | 7.5 | 7.5 |
| Province | |||||||||||
| Newfoundland and Labrador | -0.7 | 12.9 | 13.6 | 15.6 | 14.0 | 13.1 | 14.5 | 15.4 | 15.4 | 16.2 | 16.6 |
| Prince Edward Island | -0.1 | 11.4 | 11.5 | 11.4 | 11.4 | 10.3 | 10.8 | 11.1 | 11.1 | 11.1 | 11.7 |
| Nova Scotia | -0.7 | 8.6 | 9.3 | 9.2 | 8.0 | 7.9 | 7.8 | 8.2 | 8.8 | 9.2 | 9.4 |
| New Brunswick | 0.3 | 9.7 | 9.4 | 8.8 | 8.8 | 7.8 | 8.2 | 9.5 | 9.7 | 10.1 | 10.0 |
| Quebec | 0.0 | 7.9 | 7.9 | 8.4 | 7.6 | 7.1 | 7.9 | 8.3 | 8.4 | 9.2 | 8.6 |
| Ontario | -0.7 | 7.7 | 8.4 | 9.1 | 7.1 | 6.3 | 6.4 | 6.5 | 6.8 | 6.9 | 7.0 |
| Manitoba | 0.1 | 5.4 | 5.3 | 5.3 | 4.4 | 4.4 | 4.4 | 4.5 | 5.3 | 5.0 | 5.0 |
| Saskatchewan | -0.5 | 4.8 | 5.3 | 4.8 | 4.2 | 4.2 | 4.3 | 5.1 | 5.1 | 5.6 | 5.7 |
| Alberta | -1.0 | 5.2 | 6.2 | 6.9 | 4.2 | 3.5 | 3.5 | 3.8 | 4.4 | 5.0 | 5.4 |
| British Columbia | -0.6 | 7.1 | 7.7 | 7.9 | 5.3 | 4.3 | 4.6 | 5.3 | 6.9 | 8.0 | 8.2 |
| Gender | |||||||||||
| Men | -0.7 | 7.7 | 8.4 | 9.5 | 7.3 | 6.3 | 6.5 | 6.8 | 7.4 | 7.9 | 7.9 |
| Women | -0.3 | 6.9 | 7.2 | 7.1 | 5.9 | 5.6 | 6.0 | 6.4 | 6.8 | 7.1 | 7.1 |
| Age | |||||||||||
| 15 to 24 years (youth) | -0.4 | 14.1 | 14.5 | 15.4 | 12.4 | 11.1 | 11.5 | 12.2 | 13.1 | 13.9 | 13.4 |
| 25 to 54 years (core age) | -0.6 | 6.1 | 6.7 | 7.1 | 5.5 | 5.0 | 5.2 | 5.6 | 6.0 | 6.4 | 6.4 |
| 55 years and over (older workers) | -0.2 | 6.2 | 6.4 | 6.6 | 5.5 | 4.7 | 5.1 | 5.0 | 5.4 | 5.8 | 5.9 |
| Educational level | |||||||||||
| Less than high school3 | -0.6 | 15.1 | 15.7 | 16.1 | 12.9 | 12.0 | 12.3 | 12.3 | 13.2 | 13.7 | 13.7 |
| High school graduate4 | -0.7 | 8.2 | 8.9 | 9.5 | 7.3 | 6.3 | 6.5 | 6.9 | 7.3 | 7.8 | 7.7 |
| Post-secondary certificate or diploma5 | -0.4 | 5.9 | 6.4 | 6.9 | 5.3 | 4.8 | 5.0 | 5.3 | 5.5 | 5.8 | 5.8 |
| University degree6 | -0.2 | 4.9 | 5.1 | 5.2 | 4.3 | 3.7 | 3.8 | 4.5 | 4.8 | 5.4 | 5.0 |
| Industry | |||||||||||
| Goods-producing sector | -1.0 | 6.2 | 7.2 | 9.3 | 7.3 | 5.9 | 6.2 | 6.1 | 6.4 | 6.9 | 7.0 |
| Agriculture | -0.1 | 6.1 | 6.2 | 5.6 | 5.3 | 4.8 | 4.8 | 5.4 | 5.9 | 6.0 | 6.0 |
| Forestry, fishing, mining, quarrying, oil and gas | -1.1 | 6.5 | 7.6 | 11.4 | 9.0 | 7.2 | 7.5 | 8.2 | 8.8 | 10.4 | 10.6 |
| Utilities | 0.4 | 2.5 | 2.1 | 3.1 | 1.7 | 1.8 | 2.0 | 1.9 | 2.2 | 2.6 | 2.5 |
| Construction | -1.4 | 7.8 | 9.2 | 10.8 | 8.0 | 6.6 | 7.5 | 7.2 | 8.3 | 9.2 | 9.7 |
| Manufacturing | -0.9 | 5.3 | 6.2 | 9.1 | 7.3 | 5.8 | 5.8 | 5.6 | 5.5 | 6.0 | 5.9 |
| Services-producing sector | -0.4 | 4.2 | 4.6 | 5.0 | 4.1 | 3.8 | 3.8 | 4.1 | 4.4 | 4.8 | 4.8 |
| Trade | -0.2 | 4.9 | 5.1 | 5.8 | 4.7 | 4.1 | 3.9 | 4.4 | 4.6 | 4.8 | 5.0 |
| Transportation and warehousing | -0.6 | 4.0 | 4.6 | 5.7 | 3.9 | 3.3 | 3.7 | 3.3 | 4.2 | 4.1 | 4.3 |
| Finance, insurance, real estate and leasing | 0.0 | 2.7 | 2.7 | 3.4 | 2.1 | 2.0 | 1.9 | 2.5 | 2.3 | 2.6 | 2.6 |
| Professional, scientific and technical services | -0.2 | 3.1 | 3.3 | 4.3 | 3.0 | 2.7 | 2.9 | 3.1 | 3.6 | 4.0 | 4.6 |
| Business, building and other support services | -1.2 | 8.7 | 9.9 | 11.0 | 9.5 | 7.7 | 7.9 | 8.5 | 9.3 | 10.7 | 8.9 |
| Educational services | -0.2 | 4.0 | 4.2 | 4.1 | 3.6 | 3.8 | 3.4 | 3.4 | 4.2 | 4.1 | 3.7 |
| Health care and social assistance | -0.5 | 1.8 | 2.3 | 2.0 | 1.8 | 1.7 | 1.8 | 2.0 | 2.4 | 2.3 | 2.2 |
| Information, culture and recreation | -0.5 | 6.4 | 6.9 | 6.3 | 5.9 | 4.9 | 5.2 | 5.5 | 5.8 | 6.7 | 7.6 |
| Accommodation and food services | -0.9 | 7.0 | 7.9 | 8.6 | 7.2 | 6.9 | 7.0 | 7.6 | 7.5 | 8.6 | 7.9 |
| Other services | -0.3 | 4.1 | 4.4 | 5.3 | 4.2 | 3.6 | 3.9 | 3.9 | 4.6 | 5.1 | 5.2 |
| Public administration | 0.2 | 2.6 | 2.4 | 2.4 | 2.1 | 2.3 | 2.6 | 2.7 | 2.9 | 2.9 | 2.8 |
Source: Statistics Canada, Labour Force Survey.
- Percentage point difference between 2010/11 and 2011/12.
- Fiscal year data calculated using annual averages of unadjusted monthly data.
- Includes 0 to 8 years of education and some high school.
- Includes high school graduation and some post-secondary education (not completed).
- Completed a certificate (including a trade certificate) or diploma from an educational institution beyond the secondary level. This includes a certificate from a vocational school, apprenticeship training, community college, collège d'enseignement général et professionnel (CEGEP) or school of nursing. Also included are certificates below a bachelor's degree obtained at a university.
- Includes at least a university bachelor's degree.
Annex 1.5 Unemployment Rate, by EI Region (%)
Annex 1.5 Unemployment Rate, by EI Region (%)1
| Mar | Dec | Sep | Jun | Mar | Dec | Sep | Jun | ||||
|---|---|---|---|---|---|---|---|---|---|---|---|
| 2012 | 2011 | 2011 | 2011 | 2011 | 2010 | 2010 | 2010 | ||||
| Newfoundland and Labrador | |||||||||||
| St. John’s | 7.1 | 7.1 | 6.3 | 5.5 | 6.8 | 7.1 | 7.9 | 7.4 | |||
| Newfoundland and Labrador | 18.2 | 18.6 | 18.2 | 16.5 | 17.8 | 17.9 | 19.8 | 20.6 | |||
| Prince Edward Island | |||||||||||
| Prince Edward Island | 11.5 | 11.3 | 12.0 | 11.5 | 11.7 | 13.1 | 11.9 | 10.3 | |||
| Nova Scotia | |||||||||||
| Eastern Nova Scotia | 14.1 | 16.6 | 15.8 | 17.2 | 16.5 | 15.8 | 15.7 | 14.8 | |||
| Western Nova Scotia | 9.5 | 10.0 | 10.0 | 10.4 | 11.1 | 10.8 | 10.9 | 10.7 | |||
| Halifax | 5.7 | 5.7 | 6.3 | 6.4 | 6.8 | 6.6 | 6.0 | 5.7 | |||
| New Brunswick | |||||||||||
| Fredericton–Moncton–Saint John | 7.3 | 7.0 | 7.0 | 7.1 | 7.1 | 7.4 | 7.3 | 6.7 | |||
| Madawaska–Charlotte2 | 11.2 | 10.6 | 11.4 | 12.1 | 10.8 | 12.0 | 11.2 | 10.4 | |||
| Restigouche–Albert | 14.5 | 15.4 | 15.3 | 15.3 | 14.9 | 15.5 | 13.9 | 13.0 | |||
| Quebec | |||||||||||
| Gaspésie–Îles-de-la-Madeleine | 12.9 | 13.7 | 13.5 | 13.9 | 14.8 | 14.4 | 18.0 | 16.7 | |||
| Québec | 5.2 | 4.5 | 4.9 | 6.9 | 5.3 | 4.5 | 5.4 | 5.8 | |||
| Trois-Rivières | 8.0 | 8.8 | 8.4 | 8.3 | 8.3 | 8.7 | 9.3 | 9.1 | |||
| South Central Quebec | 4.6 | 5.2 | 5.1 | 5.8 | 4.6 | 4.8 | 5.4 | 6.0 | |||
| Sherbrooke | 7.1 | 6.3 | 6.8 | 7.0 | 7.4 | 7.6 | 7.9 | 8.6 | |||
| Montérégie | 9.1 | 8.7 | 6.6 | 7.0 | 7.7 | 7.3 | 7.2 | 7.2 | |||
| Montréal | 9.3 | 8.2 | 8.5 | 7.9 | 8.2 | 8.7 | 8.5 | 9.0 | |||
| Central Quebec | 9.6 | 8.2 | 7.8 | 8.2 | 7.8 | 8.7 | 8.4 | 8.0 | |||
| Northwestern Quebec | 10.1 | 9.9 | 9.2 | 10.3 | 9.7 | 10.9 | 11.8 | 9.6 | |||
| Lower St. Lawrence and North Shore2 | 9.9 | 9.2 | 9.3 | 10.2 | 11.3 | 10.5 | 11.9 | 10.6 | |||
| Hull | 6.0 | 7.1 | 6.3 | 6.8 | 6.5 | 6.7 | 6.7 | 6.1 | |||
| Chicoutimi–Jonquière | 6.2 | 5.7 | 7.0 | 7.7 | 8.2 | 7.8 | 8.2 | 7.6 | |||
| Ontario | |||||||||||
| Ottawa | 6.0 | 6.0 | 4.9 | 5.8 | 6.6 | 6.7 | 6.7 | 5.8 | |||
| Eastern Ontario | 8.6 | 8.6 | 8.5 | 8.4 | 7.9 | 8.8 | 8.3 | 9.6 | |||
| Kingston | 6.9 | 6.0 | 6.8 | 7.1 | 6.3 | 6.4 | 5.7 | 5.6 | |||
| Central Ontario | 7.6 | 8.8 | 8.9 | 8.6 | 9.9 | 9.0 | 9.3 | 8.9 | |||
| Oshawa | 7.5 | 7.1 | 7.5 | 10.1 | 8.9 | 9.7 | 10.5 | 9.8 | |||
| Toronto | 8.6 | 8.5 | 8.1 | 8.6 | 8.3 | 8.8 | 9.1 | 9.4 | |||
| Hamilton | 5.9 | 6.5 | 6.9 | 5.6 | 6.7 | 6.7 | 7.9 | 8.0 | |||
| St. Catharines | 7.7 | 7.7 | 8.4 | 9.2 | 9.7 | 9.4 | 9.2 | 8.8 | |||
| London | 8.8 | 9.9 | 8.9 | 8.3 | 8.3 | 8.8 | 8.4 | 8.5 | |||
| Niagara | 10.2 | 9.9 | 10.4 | 10.1 | 10.2 | 10.6 | 9.7 | 11.3 | |||
| Windsor | 11.1 | 11.2 | 8.7 | 10.8 | 9.7 | 11.2 | 11.9 | 12.5 | |||
| Kitchener | 6.7 | 6.9 | 6.2 | 7.1 | 6.7 | 7.8 | 6.8 | 8.0 | |||
| Huron | 9.7 | 7.5 | 7.4 | 8.1 | 10.1 | 10.7 | 9.0 | 9.2 | |||
| South Central Ontario | 5.4 | 5.4 | 5.9 | 7.5 | 7.0 | 7.4 | 8.2 | 7.7 | |||
| Sudbury | 6.5 | 5.3 | 6.3 | 8.1 | 7.4 | 9.2 | 9.7 | 9.1 | |||
| Thunder Bay | 5.7 | 7.3 | 6.7 | 7.2 | 6.8 | 6.8 | 6.9 | 5.3 | |||
| Northern Ontario | 11.4 | 12.1 | 12.1 | 12.4 | 11.7 | 11.4 | 12.8 | 12.7 | |||
| Manitoba | |||||||||||
| Winnipeg | 5.8 | 5.9 | 5.9 | 5.7 | 5.6 | 5.3 | 5.9 | 5.9 | |||
| Southern Manitoba | 5.9 | 6.2 | 6.3 | 6.0 | 5.5 | 5.7 | 5.7 | 5.5 | |||
| Northern Manitoba | 28.7 | 28.4 | 28.1 | 28.1 | 26.4 | 29.7 | 30.0 | 28.5 | |||
| Saskatchewan | |||||||||||
| Regina | 4.3 | 3.7 | 4.7 | 5.5 | 4.9 | 4.8 | 4.9 | 4.6 | |||
| Saskatoon | 5.9 | 5.7 | 5.2 | 6.1 | 5.7 | 5.7 | 5.6 | 5.3 | |||
| Southern Saskatchewan | 6.1 | 6.7 | 6.7 | 6.2 | 7.0 | 7.2 | 6.8 | 6.6 | |||
| Northern Saskatchewan | 18.5 | 17.6 | 17.4 | 17.7 | 18.9 | 18.0 | 17.3 | 17.5 | |||
| Alberta | |||||||||||
| Calgary | 5.1 | 5.4 | 6.2 | 5.8 | 6.1 | 6.3 | 6.8 | 7.7 | |||
| Edmonton | 5.6 | 5.6 | 5.5 | 6.0 | 6.2 | 5.8 | 7.0 | 7.8 | |||
| Northern Alberta | 8.8 | 9.0 | 8.9 | 8.7 | 8.8 | 9.8 | 9.6 | 9.5 | |||
| Southern Alberta | 5.8 | 6.0 | 6.6 | 6.8 | 6.7 | 7.0 | 7.1 | 7.8 | |||
| British Columbia | |||||||||||
| Southern Interior B.C. | 8.2 | 8.7 | 8.4 | 9.2 | 9.3 | 11.1 | 9.6 | 9.5 | |||
| Abbotsford | 10.8 | 8.7 | 8.4 | 9.2 | 10.3 | 9.1 | 8.0 | 7.9 | |||
| Vancouver | 6.8 | 6.7 | 7.3 | 7.7 | 8.2 | 7.3 | 7.5 | 7.6 | |||
| Victoria | 6.0 | 6.9 | 7.0 | 6.9 | 6.9 | 6.4 | 6.4 | 6.8 | |||
| Southern Coastal B.C. | 8.1 | 8.3 | 10.0 | 10.2 | 9.6 | 7.4 | 9.1 | 7.9 | |||
| Northern B.C. | 12.0 | 11.2 | 11.1 | 10.4 | 12.2 | 10.9 | 11.4 | 10.6 | |||
| Territories3 | |||||||||||
| Yukon | 25.0 | 25.0 | 25.0 | 25.0 | 25.0 | 25.0 | 25.0 | 25.0 | |||
| Northwest Territories | 25.0 | 25.0 | 25.0 | 25.0 | 25.0 | 25.0 | 25.0 | 25.0 | |||
| Nunavut | 25.0 | 25.0 | 25.0 | 25.0 | 25.0 | 25.0 | 25.0 | 25.0 | |||
| NATIONAL | 8.0 | 7.9 | 7.9 | 8.1 | 8.2 | 8.4 | 8.5 | 8.6 | |||
Source: HRSDC, EI administrative data; Statistics Canada, Labour Force Survey.
- Unemployment rates used by the Employment Insurance program are a three-month moving average of seasonally adjusted rates for the ending month.
- Unemployment rates for these regions have been determined using a transition formula prescribed in the Employment Insurance Regulations.
- Yukon, the Northwest Territories and Nunavut unemployment rates are set at 25% for EI purposes.
Annex 1.6 Duration of Unemployment, by Province, Gender and Age
Annex 1.6 Duration of Unemployment, by Province, Gender and Age1
| Change | Average Weeks Unemployed, by Fiscal Year2,3 | ||||||||||
|---|---|---|---|---|---|---|---|---|---|---|---|
| 2010/11–2011/12 | 2011/12 | 2010/11 | 2009/10 | 2008/09 | 2007/08 | 2006/07 | 2005/06 | 2004/05 | 2003/04 | 2002/03 | |
| NATIONAL | 0.0 | 18.6 | 18.6 | 16.7 | 13.6 | 13.9 | 14.4 | 15.2 | 15.6 | 15.8 | 16.0 |
| Province | |||||||||||
| Newfoundland and Labrador | 0.1 | 15.7 | 15.6 | 15.2 | 14.5 | 15.1 | 15.6 | 16.4 | 15.8 | 18.2 | 17.4 |
| Prince Edward Island | -0.8 | 12.3 | 13.1 | 13.5 | 13.1 | 12.0 | 13.4 | 12.9 | 12.8 | 10.7 | 11.3 |
| Nova Scotia | -2.1 | 15.6 | 17.7 | 14.9 | 13.0 | 13.6 | 12.8 | 13.7 | 14.8 | 13.8 | 14.3 |
| New Brunswick | 0.6 | 15.9 | 15.3 | 13.9 | 13.5 | 11.5 | 12.9 | 13.4 | 13.8 | 13.1 | 14.2 |
| Quebec | 1.3 | 18.8 | 17.5 | 17.1 | 16.2 | 17.0 | 17.4 | 17.5 | 17.8 | 17.8 | 18.7 |
| Ontario | -0.6 | 20.4 | 21.0 | 18.5 | 14.0 | 13.8 | 14.1 | 14.7 | 15.5 | 15.5 | 15.3 |
| Manitoba | -0.3 | 13.6 | 13.9 | 11.8 | 10.2 | 10.6 | 11.3 | 13.5 | 13.1 | 12.2 | 11.8 |
| Saskatchewan | -0.4 | 13.6 | 14.0 | 11.4 | 9.6 | 10.4 | 10.0 | 12.8 | 13.8 | 13.2 | 13.9 |
| Alberta | -1.7 | 14.8 | 16.5 | 13.9 | 7.9 | 8.2 | 8.0 | 10.4 | 10.3 | 9.4 | 10.0 |
| British Columbia | 0.8 | 18.8 | 18.0 | 14.7 | 11.0 | 12.0 | 12.4 | 15.3 | 15.4 | 17.7 | 17.6 |
| Gender | |||||||||||
| Men | 0.1 | 19.4 | 19.3 | 17.4 | 14.3 | 15.0 | 14.6 | 15.6 | 16.3 | 16.9 | 16.8 |
| Women | -0.2 | 17.6 | 17.8 | 15.7 | 12.8 | 12.6 | 14.1 | 14.7 | 14.7 | 14.5 | 14.9 |
| Age | |||||||||||
| 15 to 24 years (youth) | 0.0 | 10.9 | 10.9 | 10.3 | 7.8 | 7.7 | 7.9 | 8.8 | 8.8 | 9.3 | 9.1 |
| 25 to 54 years (core age) | -0.2 | 20.6 | 20.8 | 18.3 | 15.5 | 16.2 | 16.4 | 17.2 | 17.9 | 17.9 | 18.0 |
| 55 years and over (older workers) | 1.0 | 26.7 | 25.7 | 23.9 | 19.8 | 19.3 | 21.3 | 22.7 | 22.6 | 24.2 | 25.4 |
Source: Statistics Canada, Labour Force Survey.
- Duration of unemployment is the number of continuous weeks during which a person has been without work and is looking for work or is on temporary layoff.
- Fiscal year data calculated using annual averages of unadjusted monthly data.
- For comparison with data from previous recessions, the data on the duration of unemployment have been coded with a maximum value of 99 weeks.
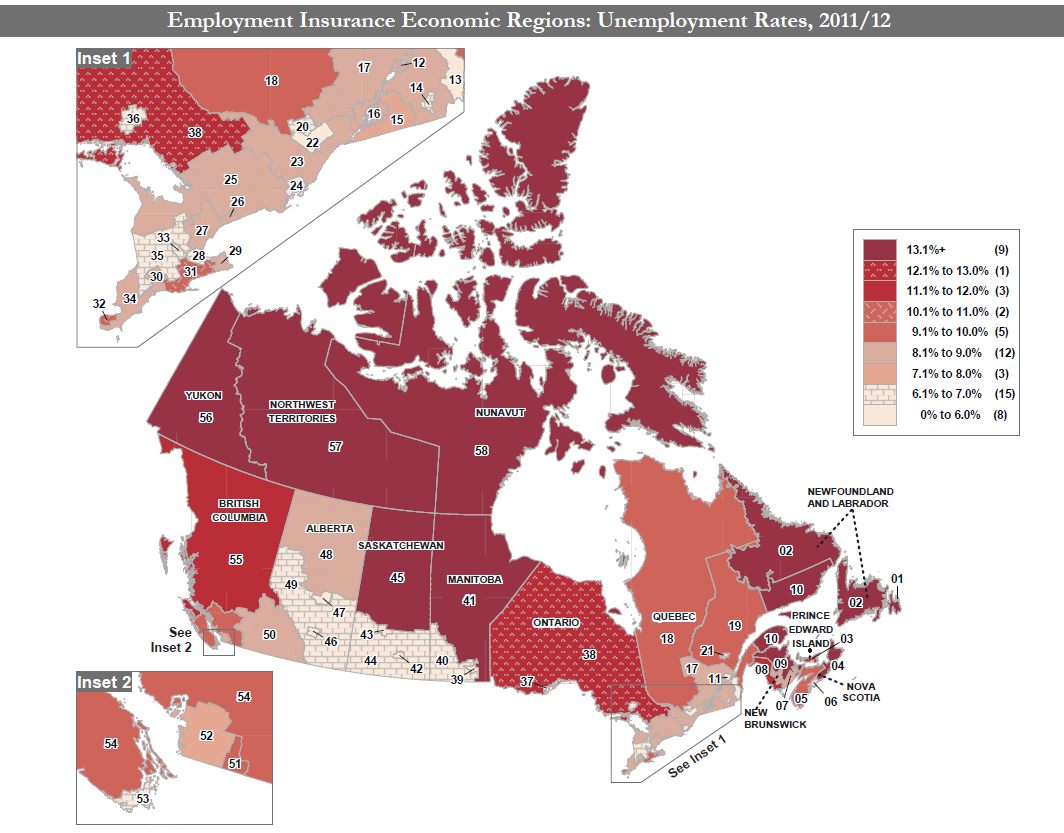
Annex 1.7 Employment Insurance Economic Regions: Unemployment Rates, 2011/12
Annex 1.7 Employment Insurance Economic Regions: Unemployment Rates, 2011/12
| Region # | Region | Rate |
|---|---|---|
| Newfoundland and Labrador | ||
| 1 | St. John's | 6.5% (6.1% – 7.0%) |
| 2 | Newfoundland and Labrador | 17.8% (13.1%+) |
| Prince Edward Island | ||
| 3 | Prince Edward Island | 11.6% (11.1% – 12.0%) |
| Nova Scotia | ||
| 4 | Eastern Nova Scotia | 16.3% (13.1%+) |
| 5 | Western Nova Scotia | 10.0% (9.1% – 10.0%) |
| 6 | Halifax | 6.1% (6.1% – 7.0%) |
| New Brunswick | ||
| 7 | Fredericton–Moncton–Saint John | 7.1% (7.1% – 8.0%) |
| 8 | Madawaska–Charlotte1 | 11.3% (11.1% – 12.0%) |
| 9 | Restigouche–Albert | 15.1% (13.1%+) |
| Quebec | ||
| 10 | Gaspésie–Îles-de-la-Madeleine | 13.7% (13.1%+) |
| 11 | Québec | 5.4% (0% – 6.0%) |
| 12 | Trois-Rivières | 8.5% (8.1% – 9.0%) |
| 13 | South Central Quebec | 5.1% (0% – 6.0%) |
| 14 | Sherbrooke | 6.8% (6.1% – 7.0%) |
| 15 | Montérégie | 7.8% (7.1% – 8.0%) |
| 16 | Montréal | 8.4% (8.1% – 9.0%) |
| 17 | Central Quebec | 8.3% (8.1% – 9.0%) |
| 18 | Northwestern Quebec | 9.9% (9.1% – 10.0%) |
| 19 | Lower St. Lawrence and North Shore1 | 9.9% (9.1% – 10.0%) |
| 20 | Hull | 6.7% (6.1% – 7.0%) |
| 21 | Chicoutimi–Jonquière | 6.8% (6.1% – 7.0%) |
| Ontario | ||
| 22 | Ottawa | 5.7% (0% – 6.0%) |
| 23 | Eastern Ontario | 8.5% (8.1% – 9.0%) |
| 24 | Kingston | 6.6% (6.1% – 7.0%) |
| 25 | Central Ontario | 8.7% (8.1% – 9.0%) |
| 26 | Oshawa | 8.2% (8.1% – 9.0%) |
| 27 | Toronto | 8.4% (8.1% – 9.0%) |
| 28 | Hamilton | 6.2% (6.1% – 7.0%) |
| 29 | St. Catharines | 8.4% (8.1% – 9.0%) |
| 30 | London | 9.0% (8.1% – 9.0%) |
| 31 | Niagara | 10.1% (10.1% – 11.0%) |
| 32 | Windsor | 10.3% (10.1% – 11.0%) |
| 33 | Kitchener | 6.8% (6.1% – 7.0%) |
| 34 | Huron | 8.2% (8.1% – 9.0%) |
| 35 | South Central Ontario | 6.2% (6.1% – 7.0%) |
| 36 | Sudbury | 6.6% (6.1% – 7.0%) |
| 37 | Thunder Bay | 6.9% (6.1% – 7.0%) |
| 38 | Northern Ontario | 12.1% (12.1% – 13.0%) |
| Manitoba | ||
| 39 | Winnipeg | 5.8% (0% – 6.0%) |
| 40 | Southern Manitoba | 6.1% (6.1% – 7.0%) |
| 41 | Northern Manitoba | 28.1% (13.1%+) |
| Saskatchewan | ||
| 42 | Regina | 4.7% (0% – 6.0%) |
| 43 | Saskatoon | 5.8% (0% – 6.0%) |
| 44 | Southern Saskatchewan | 6.5% (6.1% – 7.0%) |
| 45 | Northern Saskatchewan | 17.8% (13.1%+) |
| Alberta | ||
| 46 | Calgary | 5.7% (0% – 6.0%) |
| 47 | Edmonton | 5.7% (0% – 6.0%) |
| 48 | Northern Alberta | 8.9% (8.1% – 9.0%) |
| 49 | Southern Alberta | 6.4% (6.1% – 7.0%) |
| British Columbia | ||
| 50 | Southern Interior B.C. | 8.7% (8.1% – 9.0%) |
| 51 | Abbotsford | 9.2% (9.1% – 10.0%) |
| 52 | Vancouver | 7.3% (7.1% – 8.0%) |
| 53 | Victoria | 6.8% (6.1% – 7.0%) |
| 54 | Southern Coastal B.C. | 9.3% (9.1% – 10.0%) |
| 55 | Northern B.C. | 11.2% (11.1% – 12.0%) |
| Territories2 | ||
| 56 | Yukon | 25.0% (13.1%+) |
| 57 | Northwest Territories | 25.0% (13.1%+) |
| 58 | Nunavut | 25.0% (13.1%+) |
| Canada | ||
| Canada | 8.0% (7.1% – 8.0%) | |
- Unemployment rates for these regions have been determined using a transition formula prescribed in the EI Regulations.
- Yukon, Northwest Territories and Nunavut unemployment rates are set at 25% for EI purposes.