
EI Monitoring and Assessment Report 2012VI. EI INCOME BENEFITS AND FIRMS
Notice: Refer to the Table of contents to navigate through the EI Monitoring and Assessment Report .
1. Firms and EI Income Benefits
In 2010, 986,650 firms Footnote 109 operated in Canada, which was a 1.0% decrease from the number of firms in 2009. Footnote 110 From 2005 to 2007, the number of firms operating in Canada increased each year, peaking in 2007. As shown in Chart 38 below, from the peak in 2007, the number of firms had decreased by a cumulative total of 8.8%, or 95,100 firms, by 2010.
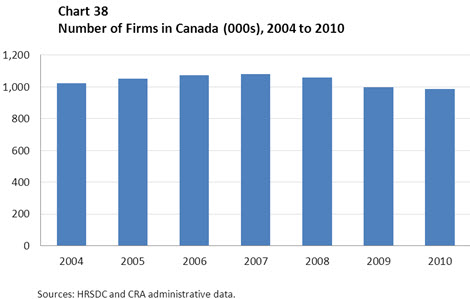
Table equivalent of Chart 38
| Year | Number of Firms |
|---|---|
| 2004 | 1,024,468 |
| 2005 | 1,050,761 |
| 2006 | 1,075,060 |
| 2007 | 1,081,732 |
| 2008 | 1,060,632 |
| 2009 | 996,734 |
| 2010 | 986,650 |
The proportion of firms with an employee receiving EI income benefits decreased by 1.9 percentage points in 2010, to 31.9% of all firms. Footnote 111 Table 16 on the firm’s utilization (i.e., usage by their employees) of EI income benefits shows that from 2005 to 2007, prior to the recession of the late-2000s, the proportion of firms with employees receiving EI income benefits decreased; in 2008 and 2009, during the recession, this proportion increased. This rise was largely driven by the utilization of EI regular benefits. The proportion of firms that had a employee in receipt of EI regular benefits was 27.2% in 2010, compared with 29.3% in 2009. There were 268,100 firms that had at least one employee receiving EI regular benefits, or 85.2% of the 314,800 firms that had an employee in receipt of EI income benefits. There were 143,400 firms that had at least one employee who collected EI special benefits in 2010, or 14.5% of all firms in operation. While this percentage went up slightly (to 15.0%) in 2009, this percentage has remained relatively stable since 2004.
| 2004 | 2005 | 2006 | 2007 | 2008 | 2009 | 2010 | |
|---|---|---|---|---|---|---|---|
| Number of Firms with Employees Receiving EI Income Benefits (000s) | 332.6 | 329.4 | 320.6 | 317.2 | 326.6 | 336.7 | 314.8 |
| % of Firms with Employees Receiving EI Income Benefits | 32.5% | 31.3% | 29.8% | 29.3% | 30.8% | 33.8% | 31.9% |
| Within Firms with EI Income Benefits,% of Workers Receiving EI Income Benefits | 12.8% | 12.5% | 11.9% | 11.5% | 12.7% | 14.8% | 11.9% |
| % of All Workers Employed by Firms with Employees Receiving EI Income Benefits | 86.4% | 85.9% | 85.3% | 85.3% | 86.2% | 87.7% | 86.9% |
| % of All EI Premiums Paid by Firms with Employees Receiving EI Income Benefits | 90.8% | 90.5% | 89.9% | 89.8% | 90.7% | 92.0% | 91.1% |
Source: EI and CRA administrative data
Firms with employees receiving EI income benefits accounted for 86.9% of total employment and these firms and their employees paid 91.1% of all EI premiums. The percentage of workers employed by firms with employees who were in receipt of EI income benefits, as well as the proportion of EI premiums paid by these firms increased during the late-2000s recession and has remained above pre-recession levels.
In addition, as illustrated in Table 16, within firms with employees receiving EI income benefits, 11.9% of workers Footnote 112 received EI income benefits in 2010, a decrease of 2.9 percentage points from the previous year. Similarly, within firms with employees who received EI regular benefits, 9.5% of workers received EI regular benefits – a decrease of 2.2 percentage points since 2009. Within firms with employees receiving EI special benefits, 3.8% collected EI special benefits in 2010. Only 41,200 firms in Canada, or 4.2%, had employees who accessed the EI program exclusively for EI special benefits.
These findings point to the fact that there were fewer firms in 2010 and that firms laid off a smaller proportion of their employees in 2010 than they did during the late-2000s recession. These factors may have contributed to the decrease in utilization of EI income benefits by employers in 2010. Further analysis of the profile of firms and their EI utilization in 2011 will be included in upcoming EI Monitoring and Assessment Report(s).
2. Firms and EI Regular Benefits
Employers’ utilization of EI income benefits in 2010 can also be examined in more detail based on the geographic location by province or territory, on the size and industry of their firms. Analysis in this section examines EI regular benefits, as they typically account for approximately three quarters of EI income benefits paid (75.5% in 2011/12) and are paid to individuals who have lost their job through no fault of their own, rather than EI special benefits, which are paid to individuals in association with life events, such as the birth or adoption of a child.
2.1 Firms and EI Regular Benefits, by Firm Location
2.1.1 Firms, by Firm Location
Table 17 shows that 86.5% of firms in Canada were located Footnote 113 in Ontario, Quebec, British Columbia or Alberta in 2010. Comparing the provincial distribution of firms to that of the labour force, Footnote 114 British Columbia and Alberta are overrepresented in their number of firms, while Ontario and Quebec are underrepresented. All other locations have approximately equal proportions of firms and members of the labour force.
| Province* | Distribution of Labour Force January 2010 |
Distribution of Firms |
Labour Force - Firms |
|---|---|---|---|
| Newfoundland and Labrador | 1.3% | 1.5% | -0.2% |
| Prince Edward Island | 0.4% | 0.5% | -0.1% |
| Nova Scotia | 2.7% | 2.6% | 0.1% |
| New Brunswick | 2.1% | 2.3% | -0.1% |
| Quebec | 22.8% | 21.3% | 1.5% |
| Ontario | 39.1% | 35.1% | 4.0% |
| Manitoba | 3.5% | 3.2% | 0.3% |
| Saskatchewan | 3.0% | 3.4% | -0.4% |
| Alberta | 11.8% | 14.3% | -2.5% |
| British Columbia | 13.3% | 15.8% | -2.5% |
| Canada | 100.0% | 100.0% | 0.0% |
*Excludes firms in Yukon, the Northwest Territories, Nunavut, and Outside Canada
Sources: EI and CRA administrative data.
With the exception of firms with headquarters outside of Canada, the number of firms in all provinces and territories (P/Ts) decreased during the recession (between 2007 and 2010). The P/Ts with decreases in the number of firms less than the national average (-8.8%) were Ontario (-7.2%), Saskatchewan (-7.4%), Manitoba (-7.9%) and Yukon (-8.4%).
2.1.2 Firms and EI Regular Benefits, by Firm Location
Table 18 indicates that over half the firms in Prince Edward Island (53.5%), Newfoundland and Labrador (53.3%), and Nunavut (51.7%) had employees who received EI regular benefits in 2010. In contrast, the national proportion of firms with employees receiving EI regular benefits was 27.2%. Alberta and Saskatchewan, the provinces with the lowest proportion of firms with EI employees receiving EI regular benefits, had proportions of 16.0% and 19.6%, respectively.
| Province and Territory | % of Firms with Employees Receiving EI Regular Benefits | Within Firms With EI Regular Benefits, % of Workers Receiving EI Regular Benefits |
Distribution of EI Claimants |
Distribution of Workers |
% EI Claimants - % Workers |
|---|---|---|---|---|---|
| Newfoundland and Labrador | 53.3% | 27.3% | 3.5% | 1.2% | 2.4% |
| Prince Edward Island | 53.5% | 27.5% | 1.0% | 0.3% | 0.6% |
| Nova Scotia | 44.8% | 13.2% | 4.4% | 3.0% | 1.5% |
| New Brunswick | 48.5% | 20.1% | 4.6% | 2.0% | 2.5% |
| Quebec | 40.1% | 12.6% | 30.6% | 22.3% | 8.3% |
| Ontario | 22.5% | 7.0% | 31.5% | 42.2% | -10.6% |
| Manitoba | 22.8% | 7.7% | 2.6% | 3.4% | -0.8% |
| Saskatchewan | 19.6% | 8.0% | 1.8% | 2.5% | -0.7% |
| Alberta | 16.0% | 7.8% | 8.5% | 11.0% | -2.5% |
| British Columbia | 23.4% | 9.6% | 10.6% | 11.3% | -0.8% |
| Yukon | 31.2% | 11.1% | 0.1% | 0.1% | 0.0% |
| Northwest Territories | 38.0% | 10.1% | 0.2% | 0.2% | 0.0% |
| Nunavut | 51.7% | 11.2% | 0.1% | 0.1% | 0.0% |
| Outside Canada | 23.9% | 9.4% | 0.4% | 0.4% | 0.0% |
| Canada | 27.2% | 9.5% | 100.0% | 100.0% | 0.0% |
*The location of EI claimants and workers is based on the location of the firm's headquarters.
Sources: EI and CRA administrative data.
Within firms with employees in receipt of EI regular benefits, Prince Edward Island (27.5%) and Newfoundland and Labrador (27.3%) had the highest percentages of workers receiving EI regular benefits, approximately three times the national average of 9.5%. New Brunswick, where 20.1% of workers who were in receipt of EI regular benefits, was also well above the national average. Firms in Ontario had the lowest proportion of workers who received EI regular benefits, at 7.0%, followed by the Prairie provinces; these were the only four provinces below the national average.
Comparing the distribution of employment and EI regular claims by P/T indicates that individuals employed by firms in Quebec, New Brunswick, Newfoundland and Labrador and Nova Scotia were the most overrepresented in terms of EI regular claimants. Individuals employed by firms in Ontario had the greatest degree of underrepresentation among EI regular claimants by a very large margin, followed by employees of firms in Alberta. Individuals working for firms in all other P/Ts had approximately proportional representation among EI regular claimants.
2.2 Firms and EI Regular Benefits, by Firm Size
Consistent with the distribution of firm size Footnote 115 in 2009, small-sized firms represented 90.2% of all firms in Canada in 2010. The remainder of firms were small-to-medium-sized firms (8.0%), medium-to-large-sized firms (1.5%) and large-sized firms (0.3%).
Table 19 indicates that workers in small firms and small-to-medium-sized firms are overrepresented among EI claimants, while workers in medium-to-large-size firms and large firms are underrepresented among EI claimants. For example, while small-sized firms represented 18.1% of workers in 2010, they accounted for 30.7% of EI regular claimants. While large firms represented 46.5% of workers, they accounted for 30.0% of EI regular claimants. This is similar to the results found in last year’s report, which analyzed EI income benefits.
| Firm Size | % of Firms with Employees Receiving EI Regular Benefits | Within Firms With EI Regular Benefits, % of Workers Receiving EI Regular Benefits |
Distribution of EI Claimants |
Distribution of Workers |
% EI Claimants - % Workers |
|---|---|---|---|---|---|
| Small | 22.0% | 36.0% | 30.7% | 18.1% | 12.6% |
| Small-Medium | 70.8% | 13.1% | 23.3% | 18.7% | 4.6% |
| Medium-Large | 92.9% | 8.0% | 16.1% | 16.7% | -0.6% |
| Large | 98.9% | 5.1% | 30.0% | 46.5% | -16.5% |
| Total | 27.2% | 9.5% | 100.0% | 100.0% | 0.0% |
Sources: EI and CRA administrative data.
These findings can be explained by an analysis of EI utilization of EI regular benefits both across and within firms by firm size category. First, EI regular benefits were received by employees of 22.0% of small-sized firms in 2010. By comparison, 70.8% and 92.9% of small-to-medium-sized and and 92.9% of medium-to-large-sized firms had employees who received EI regular benefits, respectively. Further analysis of EI utilization from the perspective of firms will be included in future Monitoring and Assessment Report (s).
Second, among firms with employees who were in receipt of EI regular benefits, roughly one-third of employees (36.0%) in small firms received EI regular benefits. Small-to-medium sized firms also recorded figures above the national average, with 13.1% of employees receiving EI regular benefits. Although almost all large firms had employees in receipt of EI regular benefits in 2010, 5.1% of workers in these firms received EI regular benefits. While this trend reflects the mathematical law of small numbers in the case of analyzing small-sized firms, it points to a useful measure of EI regular benefit utilization with regards to large firms.
Overall, this analysis of the utilization of EI regular benefits by firm size suggests that various factors contribute to the overrepresentation of both small and large firms among firms with EI regular claimants. In the case of smaller firms, it may be due to the fact that fewer small firms utilized EI regular benefits; however, given their smaller size, it is more likely that a higher proportion of their employees will be in receipt of EI regular benefits. At the opposite end of the spectrum, there is a higher probability that large firms will have employees that are in receipt of EI regular benefits, but they will represent a smaller percentage of their employees.
2.3 Firms and EI Regular Benefits, by Industry
As shown in Table 20, only one industry, public administration, had over half of its firms (66.7%) employed an individual who received EI regular benefits. The industries with the next highest proportions of firms employing individuals in receipt of EI regular benefits were manufacturing and construction, at 44.9% and 41.8%, respectively. Firms in public administration tend to be very large, which may explain the high proportion of firms in this industry with employees in receipt of EI regular benefits. The industries with the lowest percentages of firms with employees receiving EI regular benefits were management of companies and enterprises (11.5%), professional, scientific and technical services (12.8%), and finance and insurance (13.7%).
Within firms with employees who received EI regular benefits, agricultural, forestry, fishing and hunting (33.0%), and construction (29.1%) were the industries with the greatest percentage of workers in receipt of EI regular benefits. By comparison, no other industry had more than 14% of their employees in receipt of EI regular benefits. At the other end of the spectrum, only 2.9% of the employees in the finance and insurance industry were in receipt of EI regular benefits.
A comparison of the distributions of EI regular claimants and employment reveals that employees working for firms in the construction industry were highly overrepresented among EI regular claimants. The industries with the next largest overrepresentation were agriculture, forestry, fishing and hunting; manufacturing; and educational services. Seasonal industries and industries particularly affected by the recession, such as manufacturing, were the most overrepresented among EI regular claimants in 2010. On the other hand, employees working in health care and social assistance and public administration were the most underrepresented among EI regular claimants.
| Industry | % of Firms with Employees Receiving EI Regular Benefits | Within Firms With EI Regular Benefits, % of Workers Receiving EI Regular Benefits |
Distribution of EI Claimants |
Distribution of Workers |
% EI Claimants - % Workers |
|---|---|---|---|---|---|
| Accommodation and Food Services | 36.9% | 8.8% | 5.5% | 7.1% | -1.7% |
| Administrative and Support, Waste Management and Remediation Services | 34.5% | 11.4% | 7.0% | 5.6% | 1.4% |
| Agriculture, Forestry, Fishing and Hunting | 33.8% | 33.0% | 5.2% | 1.8% | 3.4% |
| Arts, Entertainment and Recreation | 36.3% | 13.7% | 2.6% | 1.7% | 0.8% |
| Construction | 41.8% | 29.1% | 19.4% | 6.3% | 13.1% |
| Educational Services | 33.9% | 9.7% | 9.3% | 7.7% | 1.6% |
| Finance and Insurance | 13.7% | 2.9% | 1.3% | 4.0% | -2.8% |
| Health Care and Social Assistance | 21.0% | 4.2% | 4.1% | 9.3% | -5.2% |
| Information and Culture | 22.7% | 4.6% | 1.0% | 2.0% | -1.0% |
| Management of Companies and Enterprises | 11.5% | 9.1% | 0.4% | 0.6% | -0.2% |
| Manufacturing | 44.9% | 11.0% | 12.6% | 10.0% | 2.6% |
| Mining | 21.7% | 9.8% | 1.5% | 1.3% | 0.2% |
| Professional, Scientific and Technical Services | 12.8% | 8.0% | 4.0% | 5.7% | -1.7% |
| Public Administration | 66.7% | 4.8% | 5.5% | 9.0% | -3.5% |
| Real Estate and Rental and Leasing | 15.3% | 9.9% | 1.3% | 1.7% | -0.3% |
| Trade | 29.5% | 6.1% | 10.6% | 17.0% | -6.4% |
| Transportation and Warehousing | 25.7% | 10.3% | 4.7% | 4.1% | 0.6% |
| Utilities | 34.7% | 4.0% | 0.4% | 0.7% | -0.4% |
| Other Services (except Public Administration) | 18.0% | 12.6% | 3.7% | 4.1% | -0.4% |
| Total | 27.2% | 9.5% | 100.0% | 100.0% | 0.0% |
* EI claimants and workers are based on the location of the firm's headquarters
** Trade includes Wholesale Trade and Retail Trade.
Sources: EI and CRA administrative data.
Overall, the administrative data show that not all employers within an industry utilized EI regular benefits. Depending on the industry and the impact of the late-2000s recession on the industry, the extent to which firms had employees in receipt of EI regular benefits, as well as the extent to which these employers laid off employees within the firm, varied in 2010.
3. Firms and Benefits-to-Contributions Ratios
The EI premiums paid by a firm and its employees can be compared with the EI income benefits received by the employees of the firm to identify firms that are net contributors to the EI program (EI premiums paid are greater than EI income benefits) or net beneficiaries of the EI program (EI premiums paid are less than EI income benefits). Footnote 116
In 2010, approximately three-quarters (74.4%) of firms operating in Canada had B/C ratios less than 1, indicating that they were net contributors to the EI program, with the amount of EI premiums paid by the firm and their employees outweighing the amount of EI income benefits received by the employees. 61.4% of firms had no employees who received EI income benefits in 2010 and another 13.0% of firms had at least one employee who was in receipt of EI income benefits, but still had a B/C ratio below 1.
Of the firms that were net beneficiaries of the EI program, 20.5% had B/C ratios between 1 and 10 and 5.1% had very high B/C ratios of 10 or greater. In the latter group, the average number of workers per firm was approximately equal to the number of EI claims submitted by employees of the firm. This suggests that the firm may have ceased operations or that all of the firm’s workers were laid off for a period of time during 2010 and received EI regular benefits.
3.1 Firms and Benefits-to-Contributions Ratios, by Firm Location
Analysis of B/C ratios also indicates that there is a strong association between a firm’s location and its status as a net contributor or net beneficiary of the EI program in 2010. As shown in Table 21, firms located in Atlantic Canada, Quebec and the territories were more likely to be net beneficiaries, while firms in Ontario, the Prairies and British Columbia were more likely to be net contributors. In Prince Edward Island and Newfoundland and Labrador, over half of firms were net beneficiaries of the EI program, with 55.9% and 55.0% of firms respectively having B/C ratios greater than 1.
Overall, this analysis shows that, in 2010, there was a high concentration of utilization within a small number of firms, and that this is the pattern across all geographic locations. Further analysis of patterns in B/C ratios will be included in future EI Monitoring and Assessment Report(s).
| Province and Territory | % Distribution of Benefits-to-Contributions Ratios | ||||||
|---|---|---|---|---|---|---|---|
| 0.00 | 0.01 - 0.99 | 1.00 - 9.99 | ≥ 10.00 | Total | < 1 | ≥ 1 | |
| Newfoundland and Labrador | 36.3% | 8.7% | 32.4% | 22.6% | 100.0% | 45.0% | 55.0% |
| Prince Edward Island | 35.9% | 8.2% | 33.3% | 22.7% | 100.0% | 44.1% | 55.9% |
| Nova Scotia | 43.8% | 12.6% | 28.7% | 14.9% | 100.0% | 56.4% | 43.6% |
| New Brunswick | 40.3% | 11.1% | 29.8% | 18.8% | 100.0% | 51.3% | 48.7% |
| Quebec | 49.7% | 14.0% | 27.6% | 8.6% | 100.0% | 63.7% | 36.3% |
| Ontario | 65.4% | 13.5% | 18.2% | 3.0% | 100.0% | 78.8% | 21.2% |
| Manitoba | 64.0% | 15.8% | 17.9% | 2.3% | 100.0% | 79.8% | 20.2% |
| Saskatchewan | 67.7% | 13.0% | 16.4% | 2.8% | 100.0% | 80.7% | 19.3% |
| Alberta | 73.3% | 11.5% | 13.6% | 1.6% | 100.0% | 84.8% | 15.2% |
| British Columbia | 64.8% | 12.5% | 19.4% | 3.3% | 100.0% | 77.3% | 22.7% |
| Yukon | 54.1% | 11.9% | 28.9% | 5.2% | 100.0% | 66.0% | 34.0% |
| Northwest Territories | 45.8% | 18.9% | 32.8% | 2.5% | 100.0% | 64.7% | 35.3% |
| Nunavut | 31.8% | 19.6% | 44.7% | 3.9% | 100.0% | 51.4% | 48.6% |
| Outside Canada | 63.8% | 16.3% | 16.3% | 3.6% | 100.0% | 80.2% | 19.8% |
| Canada | 61.4% | 13.0% | 20.5% | 5.1% | 100.0% | 74.4% | 25.6% |
Sources: EI and CRA administrative data.
3.2 Firms and Benefits–to-Contributions Ratios, by Firm Size
As shown in Table 22, large firms and small firms both had higher proportions of net contributors than the national average of 74.4%, at 79.3% and 75.6%, respectively. Mid-size firms, made up of small-to-medium-sized firms and medium-to-large-sized firms had lower proportions of net contributors, and therefore higher proportions of net beneficiaries, than the national average.
In 2010, the largest relative beneficiaries of the EI program, based on B/C ratios of 10 or greater, were most likely to be small firms. Among small firms, 5.6% had B/C ratios of at least 10. Combined with the lower-than-average proportion of small firms that were net beneficiaries of the EI program, this suggests that while small firms are less likely to be net beneficiaries of the EI program, if they are net beneficiaries, they benefit to a greater extent. All other firm sizes had less than 1% of their firms post B/C ratios of 10 or more.
This analysis suggests that, similar to the analysis of the previous two indicators by firm sizes, there is a distinct pattern across firm sizes. The smaller the firm, the less likely that the firm will have employees who are in receipt of EI income benefits; however, smaller firms with employees who received regular benefits are more likely to have a larger percentage of their employees in receipt of EI income benefits and are more likely to be net beneficiaries of the EI program. Trends in B/C ratios are influenced not only by the number of claims but also by the duration of EI benefits and wage levels. Further analysis of patterns in B/C ratios will be included in future Monitoring and Assessment Report (s).
| Firm Size | % Distribution of Benefits-to-Contributions Ratios | ||||||
|---|---|---|---|---|---|---|---|
| 0.00 | 0.01– 0.99 | 1.00–9.99 | ≥ 10.00 | Total | < 1 | ≥ 1 | |
| Small | 67.1% | 8.5% | 18.8% | 5.6% | 100.0% | 75.6% | 24.4% |
| Small - Medium | 10.3% | 51.1% | 37.7% | 0.9% | 100.0% | 61.4% | 38.6% |
| Medium - Large | 1.5% | 67.8% | 29.9% | 0.7% | 100.0% | 69.3% | 30.7% |
| Large | 0.4% | 78.9% | 20.3% | 0.4% | 100.0% | 79.3% | 20.7% |
| Total | 61.4% | 13.0% | 20.5% | 5.1% | 100.0% | 74.4% | 25.6% |
Sourced: EI and CRA administrative data.
3.3 Firms and Benefits-to-Contributions Ratios, by Industry
On an industrial basis, firms in public administration and construction were most likely to be net beneficiaries of the EI program, at 43.1% and 40.8%, respectively. In comparison, the last two columns in Table 23 point to the fact that 90.0% of firms in the management of companies and enterprises industry were net contributors to the EI program and only 10.0% were net beneficiaries in 2010.
| Industry | % Distribution of Benefits-to-Contributions Ratios | ||||||
|---|---|---|---|---|---|---|---|
| 0.00 | 0.01–0.99 | 1.00–9.99 | ≥ 10.00 | Total | < 1 | ≥ 1 | |
| Accommodation and Food Services | 45.0% | 21.0% | 26.5% | 7.4% | 100.0% | 66.1% | 33.9% |
| Administrative and Support, Waste Management and Remediation Services | 54.3% | 12.4% | 26.7% | 6.5% | 100.0% | 66.8% | 33.2% |
| Agriculture, Forestry, Fishing and Hunting | 58.7% | 5.0% | 19.8% | 16.4% | 100.0% | 63.8% | 36.2% |
| Arts, Entertainment and Recreation | 55.2% | 9.8% | 27.7% | 7.3% | 100.0% | 65.0% | 35.0% |
| Construction | 47.6% | 11.6% | 32.3% | 8.5% | 100.0% | 59.2% | 40.8% |
| Educational Services | 55.8% | 18.9% | 22.8% | 2.5% | 100.0% | 74.7% | 25.3% |
| Finance and Insurance | 77.0% | 11.8% | 9.7% | 1.6% | 100.0% | 88.8% | 11.2% |
| Health Care and Social Assistance | 64.7% | 14.9% | 18.6% | 1.8% | 100.0% | 79.7% | 20.3% |
| Information and Culture | 67.3% | 15.6% | 14.3% | 2.7% | 100.0% | 82.9% | 17.1% |
| Management of Companies and Enterprises | 82.5% | 7.6% | 8.6% | 1.4% | 100.0% | 90.0% | 10.0% |
| Manufacturing | 39.2% | 23.5% | 31.9% | 5.4% | 100.0% | 62.7% | 37.3% |
| Mining | 69.8% | 12.7% | 15.0% | 2.5% | 100.0% | 82.5% | 17.5% |
| Professional, Scientific and Technical Services | 79.2% | 8.2% | 10.4% | 2.2% | 100.0% | 87.4% | 12.6% |
| Public Administration | 23.4% | 33.4% | 38.8% | 4.3% | 100.0% | 56.9% | 43.1% |
| Real Estate and Rental and Leasing | 76.7% | 8.1% | 12.2% | 3.0% | 100.0% | 84.8% | 15.2% |
| Trade | 56.1% | 18.4% | 21.4% | 4.0% | 100.0% | 74.5% | 25.5% |
| Transportation and Warehousing | 65.5% | 10.4% | 19.0% | 5.1% | 100.0% | 75.9% | 24.1% |
| Utilities | 51.6% | 28.6% | 15.9% | 4.0% | 100.0% | 80.2% | 19.8% |
| Other Services (Except Public Administration) | 70.6% | 9.5% | 15.9% | 3.9% | 100.0% | 80.1% | 19.9% |
| Total | 61.4% | 13.0% | 20.5% | 5.1% | 100.0% | 74.4% | 25.6% |
* Trade includes Wholesale Trade and Retail Trade.
Sources: EI and CRA administrative data.
Given a national average of 5.1% of firms with B/C ratios of at least 10, the agriculture, forestry, fishing and hunting industry has the greatest proportion of B/C ratios of at least 10. The industry with the second greatest proportion of high B/C ratios was construction, at 8.5%. Industries with small percentages of firms with B/C ratios of at least 10 include management of companies and enterprises, finance and insurance and health care, and social assistance, all with less than 2% of firms with B/C ratios of 10 or greater.
Overall, these findings seem to suggest that there is variation in the B/C ratios across firms within industries. For instance, over half of the firms in construction are net contributors–to the point of having a zero B/C ratio–and the remainder are net beneficiaries. Moreover, the analysis points to a high concentration of utilization among a small number of firms that have a B/C ratio of 10 or more in construction. The fact that a large number of net contributors seems to coexist with a concentration of net beneficiaries with B/C ratios over 10 is found not only across all industries, but also across all geographic locations and firm sizes. It should be noted that trends in B/C ratios are influenced not only by the number of claims but also by the duration of EI benefits and wage levels. Further analysis of patterns in B/C ratios will be included in future EI Monitoring and Assessment Report(s).
VII. EI Finances
The EI program is financed entirely by contributions from employees and employers, via premiums paid on insured earnings up to the maximum insurable earnings threshold (MIE). Under the Employment Insurance Act, the MIE is indexed annually based on the average industrial earnings published by Statistics Canada. The MIE also represents the maximum amount considered in applications for EI benefits. The EI program is based on the principle of universal coverage of all employees in insurable employment, which helps ensure that premiums remain low and relatively stable over time.
Employee premiums apply to every $100 of insurable earnings, up to the MIE. Employers pay premiums that are 1.4 times those of employees. Employee premiums increased in 2012 to $1.83 per $100 of insurable earnings, from $1.78 in 2011 and $1.73 in both 2009 and 2010. Accordingly, employer premiums increased in 2012 to $2.56 per $100 of insurable earnings, increasing from $2.49 in 2011. Footnote 117
According to the 2012 Public Accounts of Canada, in 2011/12, EI expenditures ($19.677 billion) exceeded EI revenues ($19.009 billion) and additional funding from the Government of Canada ($0.118 billion) by $0.551 billion. The cumulative deficit in the EI Operating Account was reported to be $7.948 billion as of March 31, 2012. Annex 5 summarizes EI expenditures and revenues, as credited to the EI Operating Account and consistent with the financial statements in the Public Accounts of Canada.