
Canada’s Poverty Reduction Strategy – An Update
On this page
- Implementation of the Poverty Reduction Strategy – Timeline
- Opportunity for All – Canada’s First Poverty Reduction Strategy
- Canada Child Benefit
- Canada Workers Benefit
- Increase to the Guaranteed Income Supplement top-up benefit
- National Housing Strategy
- Poverty Indicators
- Provincial trends
- Poverty rates across vulnerable groups
Implementation of the Poverty Reduction Strategy – Timeline
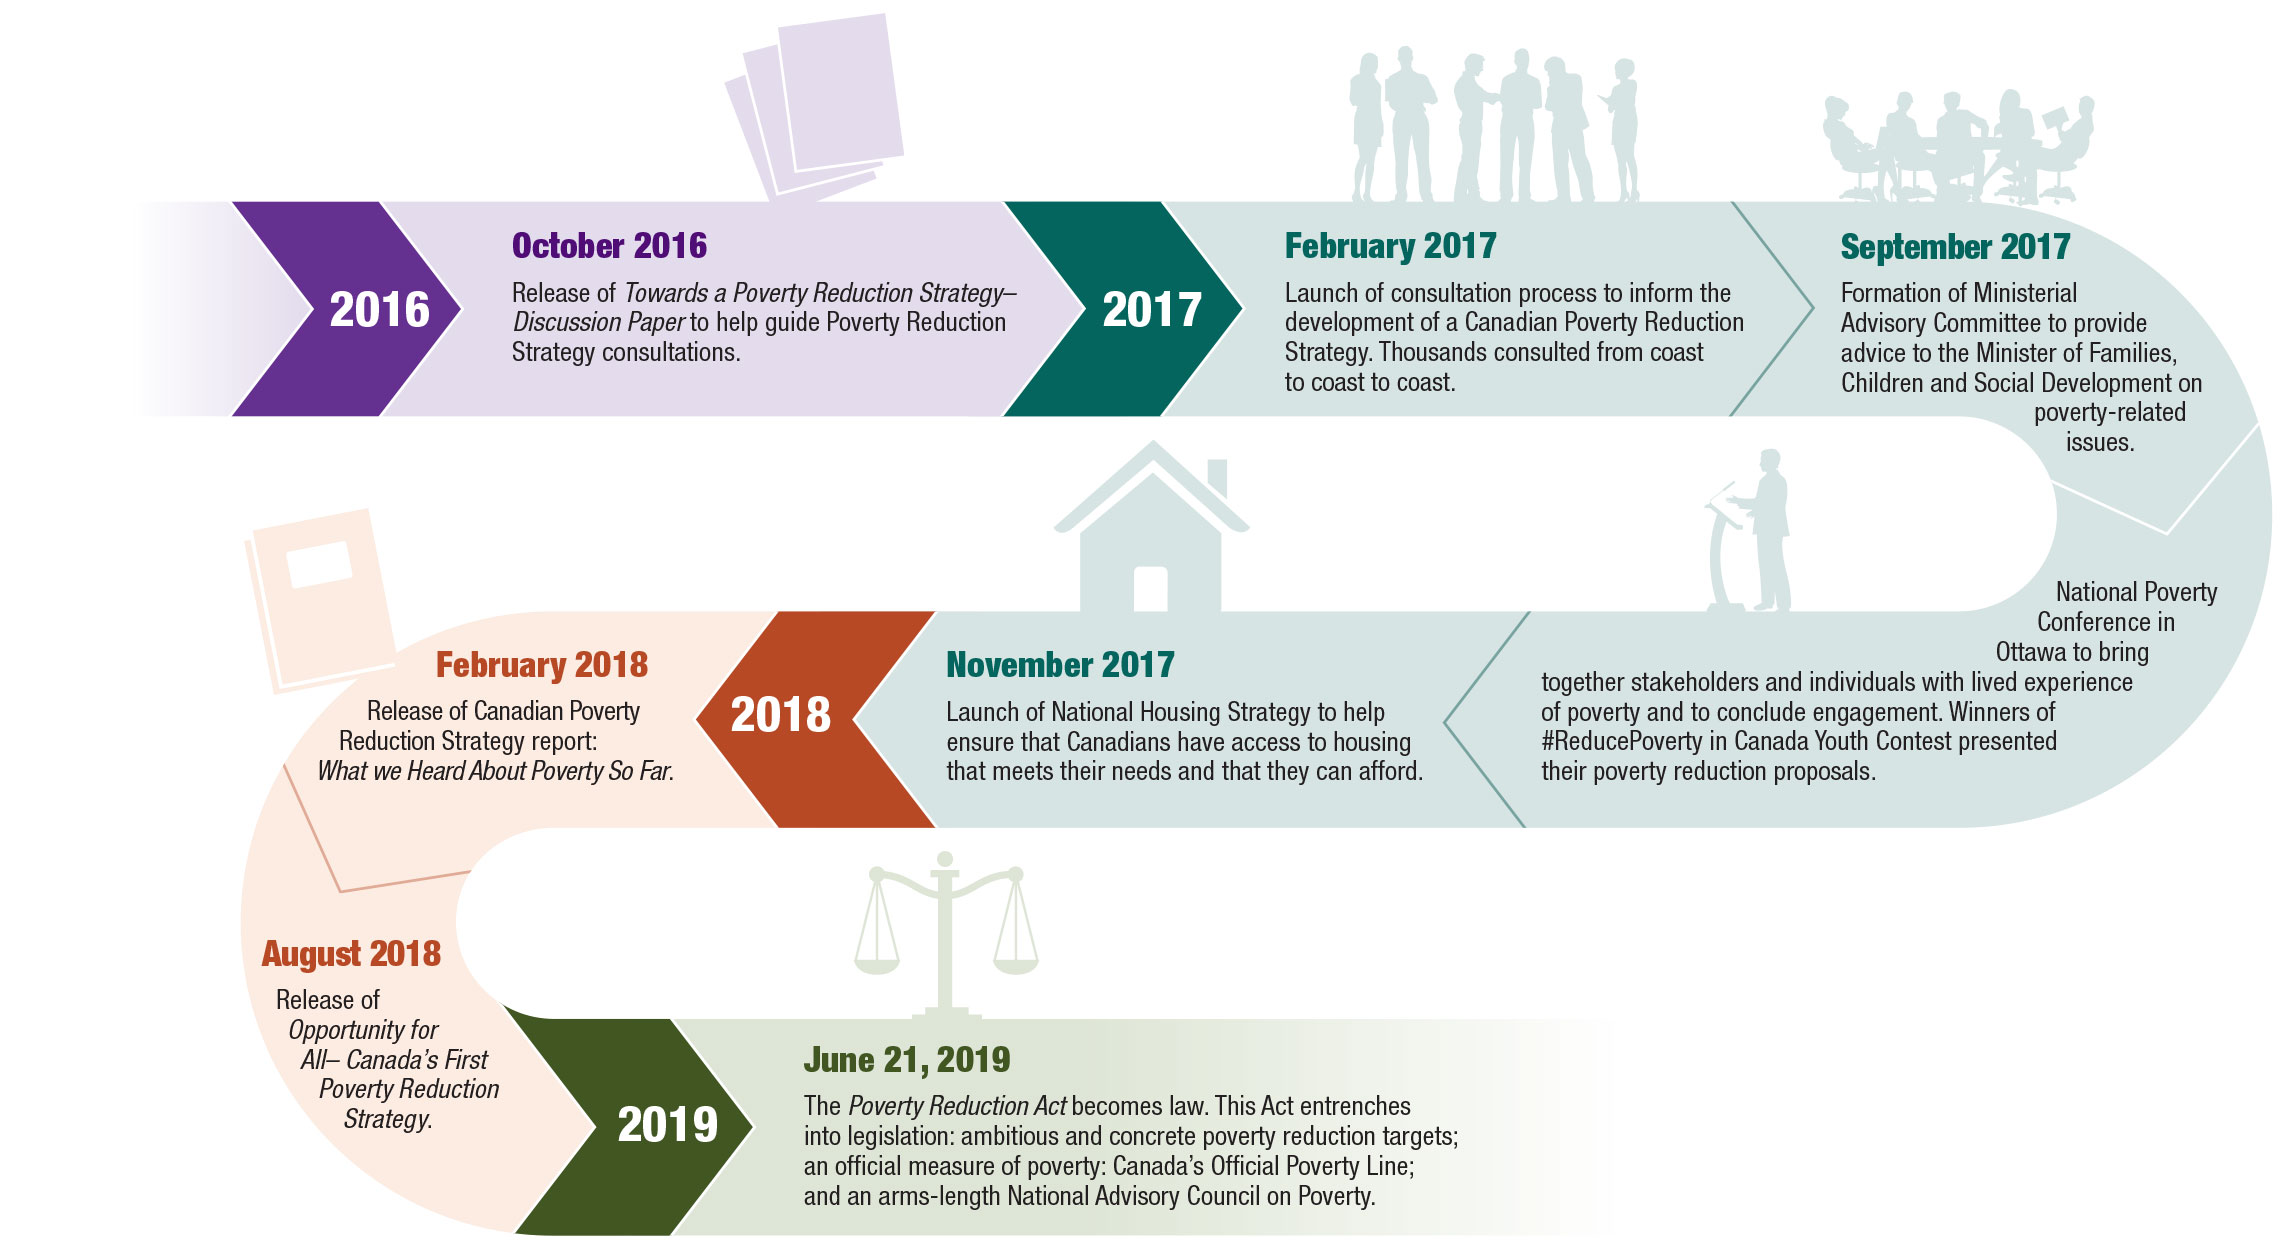
Implementation of the Poverty Reduction Strategy – Timeline - Text description
- October 2016: Release of Towards a Poverty Reduction Strategy – Discussion Paper to help guide Poverty Reduction Strategy consultations.
- February 2017: Launch of consultation process to inform the development of a Canadian Poverty Reduction Strategy. Thousands consulted from coast to coast to coast.
- September 2017: Formation of Ministerial Advisory Committee to provide advice to the Minister of Families, Children and Social Development on poverty-related issues.
- September 2017: National Poverty Conference in Ottawa to bring together stakeholders and individuals with lived experience of poverty and to conclude engagement. Winners of #ReducePoverty in Canada Youth Contest presented their poverty reduction proposals.
- November 2017: Launch of National Housing Strategy to help ensure that Canadians have access to housing that meets their needs and that they can afford.
- February 2018: Release of Canadian Poverty Reduction Strategy report: What We Heard About Poverty So Far
- August 2018: Release of Opportunity for All – Canada’s First Poverty Reduction Strategy
- June 21, 2019: The Poverty Reduction Act becomes law. This Act entrenches into legislation: ambitious and concrete poverty reduction targets; an official measure of poverty: Canada’s Official Poverty Line; and an arm’s length National Advisory Council on Poverty.
Opportunity for All – Canada’s First Poverty Reduction Strategy
On August 21, 2018, the Government of Canada released Opportunity for All – Canada’s First Poverty Reduction Strategy
Opportunity for All brings together investments of $22 billion that the Government has made since 2015 to support the social and economic well-being of all Canadians. Beyond children and seniors, investments cover areas such as housing, clean water, health, transportation, early learning and child care, and skills and employment, which will help address multiple dimensions of poverty.
Opportunity for All is based on three pillars to focus government actions to reduce poverty:
- Dignity: Lifting Canadians out of poverty by ensuring basic needs—such as safe and affordable housing, healthy food and health care are met
- Opportunity and Inclusion: Helping Canadians join the middle class by promoting full participation in society and equality of opportunity
- Resilience and Security: Supporting the middle class by protecting Canadians from falling into poverty and by supporting income security and resilience
Opportunity for All includes long-term commitments to guide the Government of Canada’s actions and investments including: establishing Canada’s first-ever Official Poverty Line; concrete poverty reduction targets; a data and measurement plan to address data gaps and track progress on poverty; the establishment of the National Advisory Council on Poverty; and poverty reduction legislation.
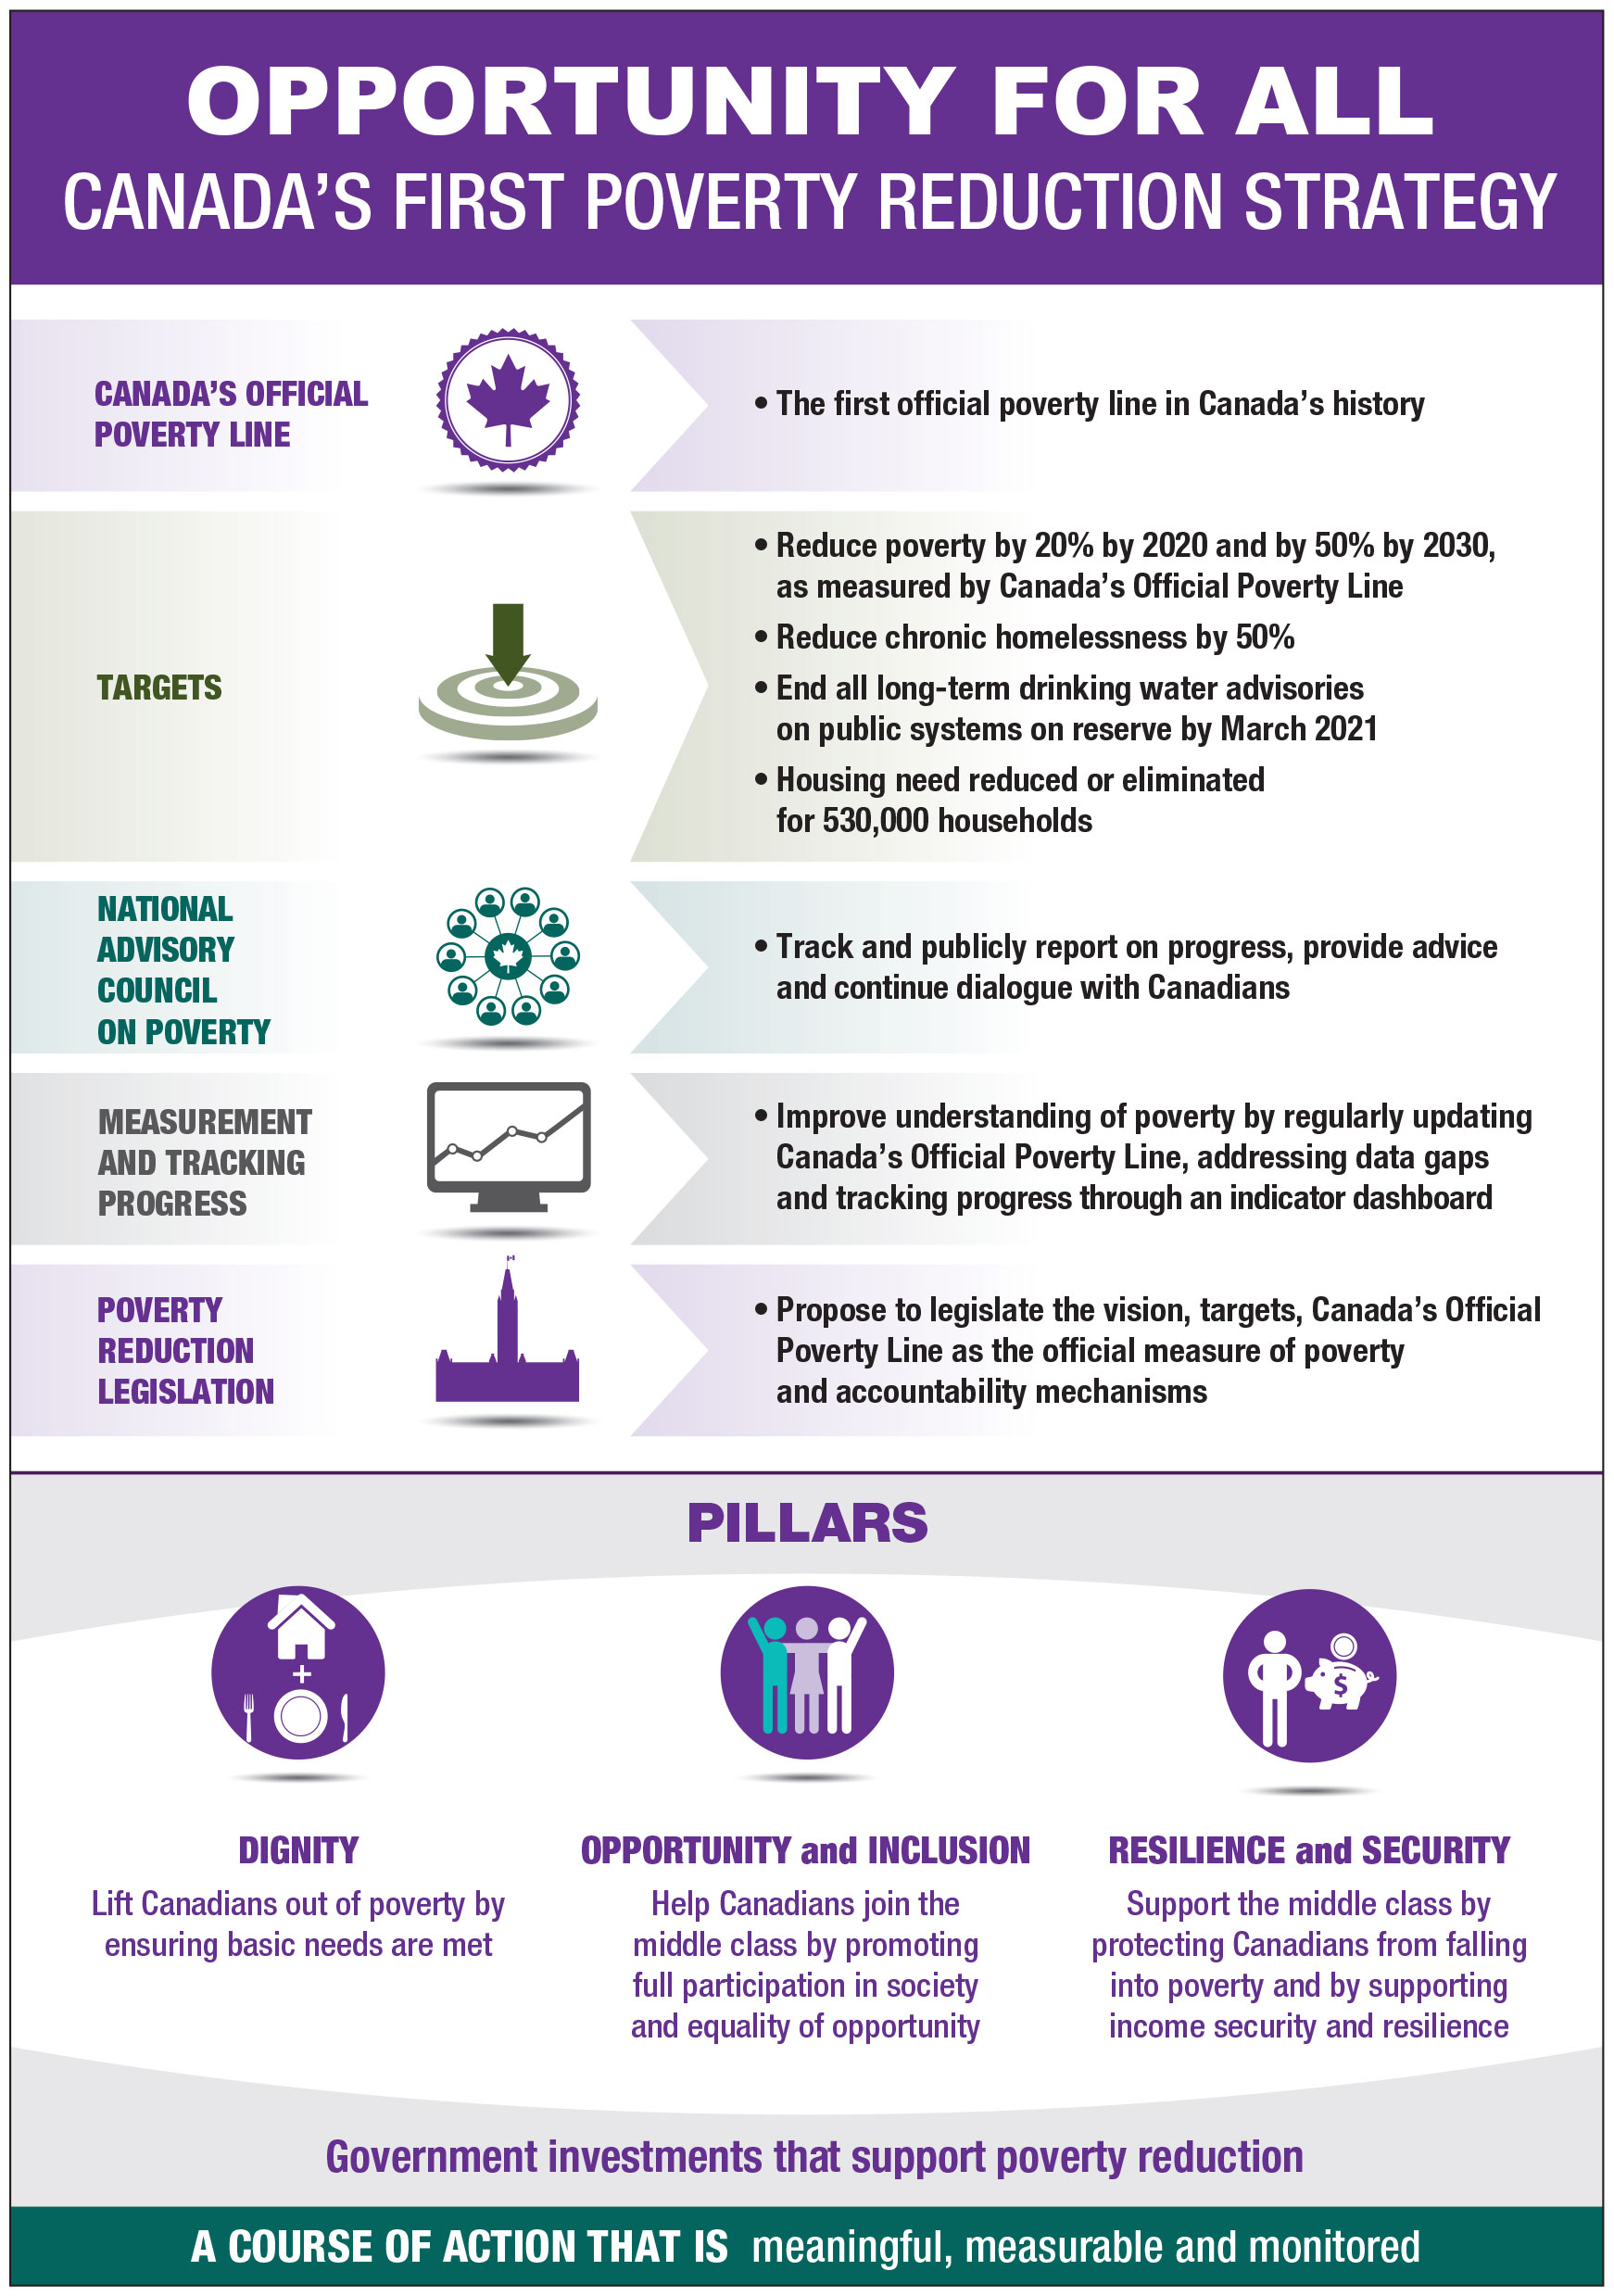
Opportunity for All – Canada’s First Poverty Reduction Strategy - Text description
Canada’s Official Poverty Line:
- Is the first official poverty line in Canada’s history
Targets:
- Reduce poverty by 20% by 2020 and by 50% by 2030, as measured by Canada’s Official Poverty Line
- Reduce chronic homelessness by 50%
- End all long-term drinking water advisories on public systems on reserve by March 2021
- Housing need reduced or eliminated for 530,000 households
A National Advisory Council on Poverty:
- Track and publicly report on progress, provide advice and continue dialogue with Canadians
Measurement and tracking progress:
- Improve understanding of poverty by regularly updating Canada’s Official Poverty Line, addressing data gaps and tracking progress through an indicator dashboard Poverty reduction legislation:
- Propose to legislate the vision, targets, Canada’s Official Poverty Line as the official measure of poverty and accountability mechanisms
Pillars:
- Dignity: Lift Canadians out of poverty by ensuring basic needs are met
- Opportunity and Inclusion: Help Canadians join the middle class by promoting full participation in society and equality of opportunity
- Resilience and Security: Support the middle class by protecting Canadians from falling into poverty and by supporting income security and resilience Government investments that support poverty reduction
A course of action that is meaningful, measurable and monitored
“The first poverty reduction strategy is an important new starting point in the battle against poverty in Canada.” (Anita Khanna, (former) National Coordinator, Campaign 2000)
From February to September 2017, the Government of Canada held a nationwide consultation process to engage Canadians on key issues related to poverty. During these consultations, Canadians shared first-hand accounts of living in poverty, how government measures have been helpful in reducing poverty and where further work could be done to provide further support.
Canadians called for a bold vision
Opportunity for All offers a vision for Canada as a world leader in the eradication of poverty, with progress validated in terms of its alignment with the United Nations (UN) Sustainable Development Goal of ending poverty. Canada’s commitment to poverty reduction also contributes to meeting Canada’s international human rights obligations, including under the International Covenant on Economic, Social and Cultural Rights, the Convention on the Rights of the Child, the Convention on the Rights of Persons with Disabilities and the Convention on the Elimination of All Forms of Discrimination Against Women.
“We are certainly excited that the vision of this strategy includes working towards a ‘Canada without poverty’ and recognizes the role that systemic discrimination plays as a barrier to people living in poverty.” (Leilani Farha, Executive Director, Canada Without Poverty, August 21, 2018)
In September 2015, Canada was one of 150 countries to adopt a set of 17 Sustainable Development Goals to end poverty, protect the planet and ensure prosperity for all as part of a new sustainable development agenda. Each goal has specific targets to be achieved by 2030. The long term target of Opportunity for All to reduce poverty by 50% by 2030 is aligned with the first Sustainable Development Goal: “By 2030, reduce at least by half the proportion of men, women and children of all ages living in poverty in all its dimensions according to national definitions.”
On June 28, 2019, the Government of Canada released Towards Canada’s 2030 Agenda National Strategy, which establishes the foundation for developing a Canadian Indicator Framework adapted to Canadian reality to accurately report on progress made with the Sustainable Development Goals.
Canadians called for concrete and meaningful targets
Opportunity for All sets concrete poverty reduction targets: a 20% reduction in poverty by 2020 and a 50% reduction in poverty by 2030 based on Canada’s Official Poverty Line, which, relative to 2015 levels, would lead to the lowest poverty rate in Canada’s history.
These targets also align with target 1.2 of the UN’s Sustainable Development Goal 1: “By 2030, reduce at least by half the proportion of men, women and children of all ages living in poverty in all its dimensions according to national definitions.”
Canadians called for common understanding and measurement of poverty
The Poverty Reduction Strategy sets an official measure of poverty: the Market Basket Measure as Canada’s Official Poverty Line, based on the cost of a basket of goods and services that individuals and families require to meet their basic needs and achieve a modest standard of living in communities across the country.
While Canada’s Official Poverty Line sets a baseline, the Poverty Reduction Strategy underscores the importance of all Canadians being fully included and having access to equal opportunity. That is why the Poverty Reduction Strategy recognizes that poverty is a continuum, which is reflected in its three pillars: Dignity, Opportunity and Inclusion, Resilience and Security.
“Canada finally has an official poverty line. That’s a big deal.” (Jennifer Robson, Associate Professor, School of Public Policy and Administration, Carleton University, Twitter, August 21)
The Poverty Reduction Strategy’s commitments around data include comprehensive reviews of the Market Basket Measure on a regular basis as determined by Statistics Canada as well as annual updates; improvements to the Canadian Income Survey including the collection of food security and unmet health care needs data; development of the Market Basket Measure for the North; provisional income estimates; and research related to the enhancements of income concepts such as rent geared to income.
The Poverty Reduction Strategy also introduced a dashboard of indicators to reflect these multiple dimensions of poverty. This dashboard allows Canadians to track progress on the many aspects of poverty, from different measures of low income, to Canadians in housing need, to the differences in earnings and life outcomes between low-income Canadians and those in the middle class.
In addition to the introduction of the dashboard, the Government of Canada is also working with National Indigenous Organizations and others to co-develop indicators of poverty and well-being from First Nations, Inuit and Métis perspectives. These indicators will help to better measure poverty among Indigenous populations in Canada and in a way that is culturally appropriate.
“The use of the Market Basket Measure as Canada’s Official Poverty Line is a welcome change—it’s an easily understood measure that is sensitive to different costs of living across Canada—and identification of additional measures can help to capture the different dimensions of poverty, including those experienced by First Nations, Inuit and Métis.” (Katherine Scott of the Canadian Centre for Policy Alternatives)
Dashboard of Indicators
Statistics Canada has recently released an online dashboard of indicators to track progress on many dimensions of poverty. The dashboard tracks, for example, the reduction in food insecurity levels, the attainment of skills required to get good jobs and the number of Canadians with enough savings to handle setbacks in their lives. These measures of poverty will help to monitor progress on the Poverty Reduction Strategy: living with dignity, having access to opportunity and remaining resilient in the face of adversity. The dashboard is available here.
An Update on Market Basket Measure Consultation
The Market Basket Measure refers to the measure of low income based on the cost of a specific basket of goods and services representing a modest, basic standard of living. As part of the review of the Market Basket Measure, which the Government of Canada committed to as part of the Poverty Reduction Strategy, from September 2018 to April 2019, Statistics Canada undertook public consultations with Canadians—experts, academics, provinces and territories, stakeholders and persons with lived experience of poverty. These consultations included:
- an online survey with Canadians regarding the existing Market Basket Measure thresholds
- a series of face-to-face and focus group sessions with Canadians with lived experiences of poverty
- an online “Chat with an Expert” question and answer session whereby Canadians could pose questions to Statistics Canada on the topic of measuring poverty via the Market Basket Measure
- a two-day meeting with provinces and territories
- a two-day meeting with academics and non-governmental organizations interested in poverty
Following these consultations, Statistics Canada released An update on the Market Basket Measure comprehensive review about the Market Basket Measure and its review.
Canadians called for accountability
Through Opportunity for All, the Government of Canada committed to establishing a National Advisory Council on Poverty to advise the Minister of Families, Children and Social Development on poverty reduction and to publicly report, in each year, on the progress that has been made toward poverty reduction.
National Advisory Council on Poverty
To ensure continued accountability to Canadians on poverty reduction, the Government of Canada will create a National Advisory Council on Poverty.
A public call for applications was held from December 18, 2018, to January 29, 2019. Chosen from over 800 applications from across Canada, the Advisory Council brings together a committed and diverse group of 10 members, including leaders, experts, academics and practitioners that work in the field of poverty reduction and members with lived experience of poverty.
The Advisory Council will advise the Government of Canada on poverty reduction and report on progress every year. For more information about the National Advisory Council on Poverty, its role and members, please consult: the National Advisory Council on Poverty website.
Canadians called for a long-term commitment to poverty reduction
The Government of Canada has also introduced the Poverty Reduction Act. This Act, which became law on June 21, 2019, entrenches the targets, Canada’s Official Poverty Line and the Advisory Council into law.
In addition to key elements of the Poverty Reduction Strategy, the Canada Child Benefit, the Canada Workers Benefit, the Guaranteed Income Supplement and the National Housing Strategy continue to assist low- to middle-income Canadians and contribute to poverty reduction efforts.
Canada Child Benefit
The Canada Child Benefit (CCB) is a tax free benefit that provides support to low- to middle-income families to help with the cost of raising children.
To date, the CCB has helped almost 300,000 children to exit poverty between 2015 and 2017. It replaced three different benefits—the Canada Child Tax Benefit, the National Child Benefit Supplement, and the Universal Child Care Benefit.
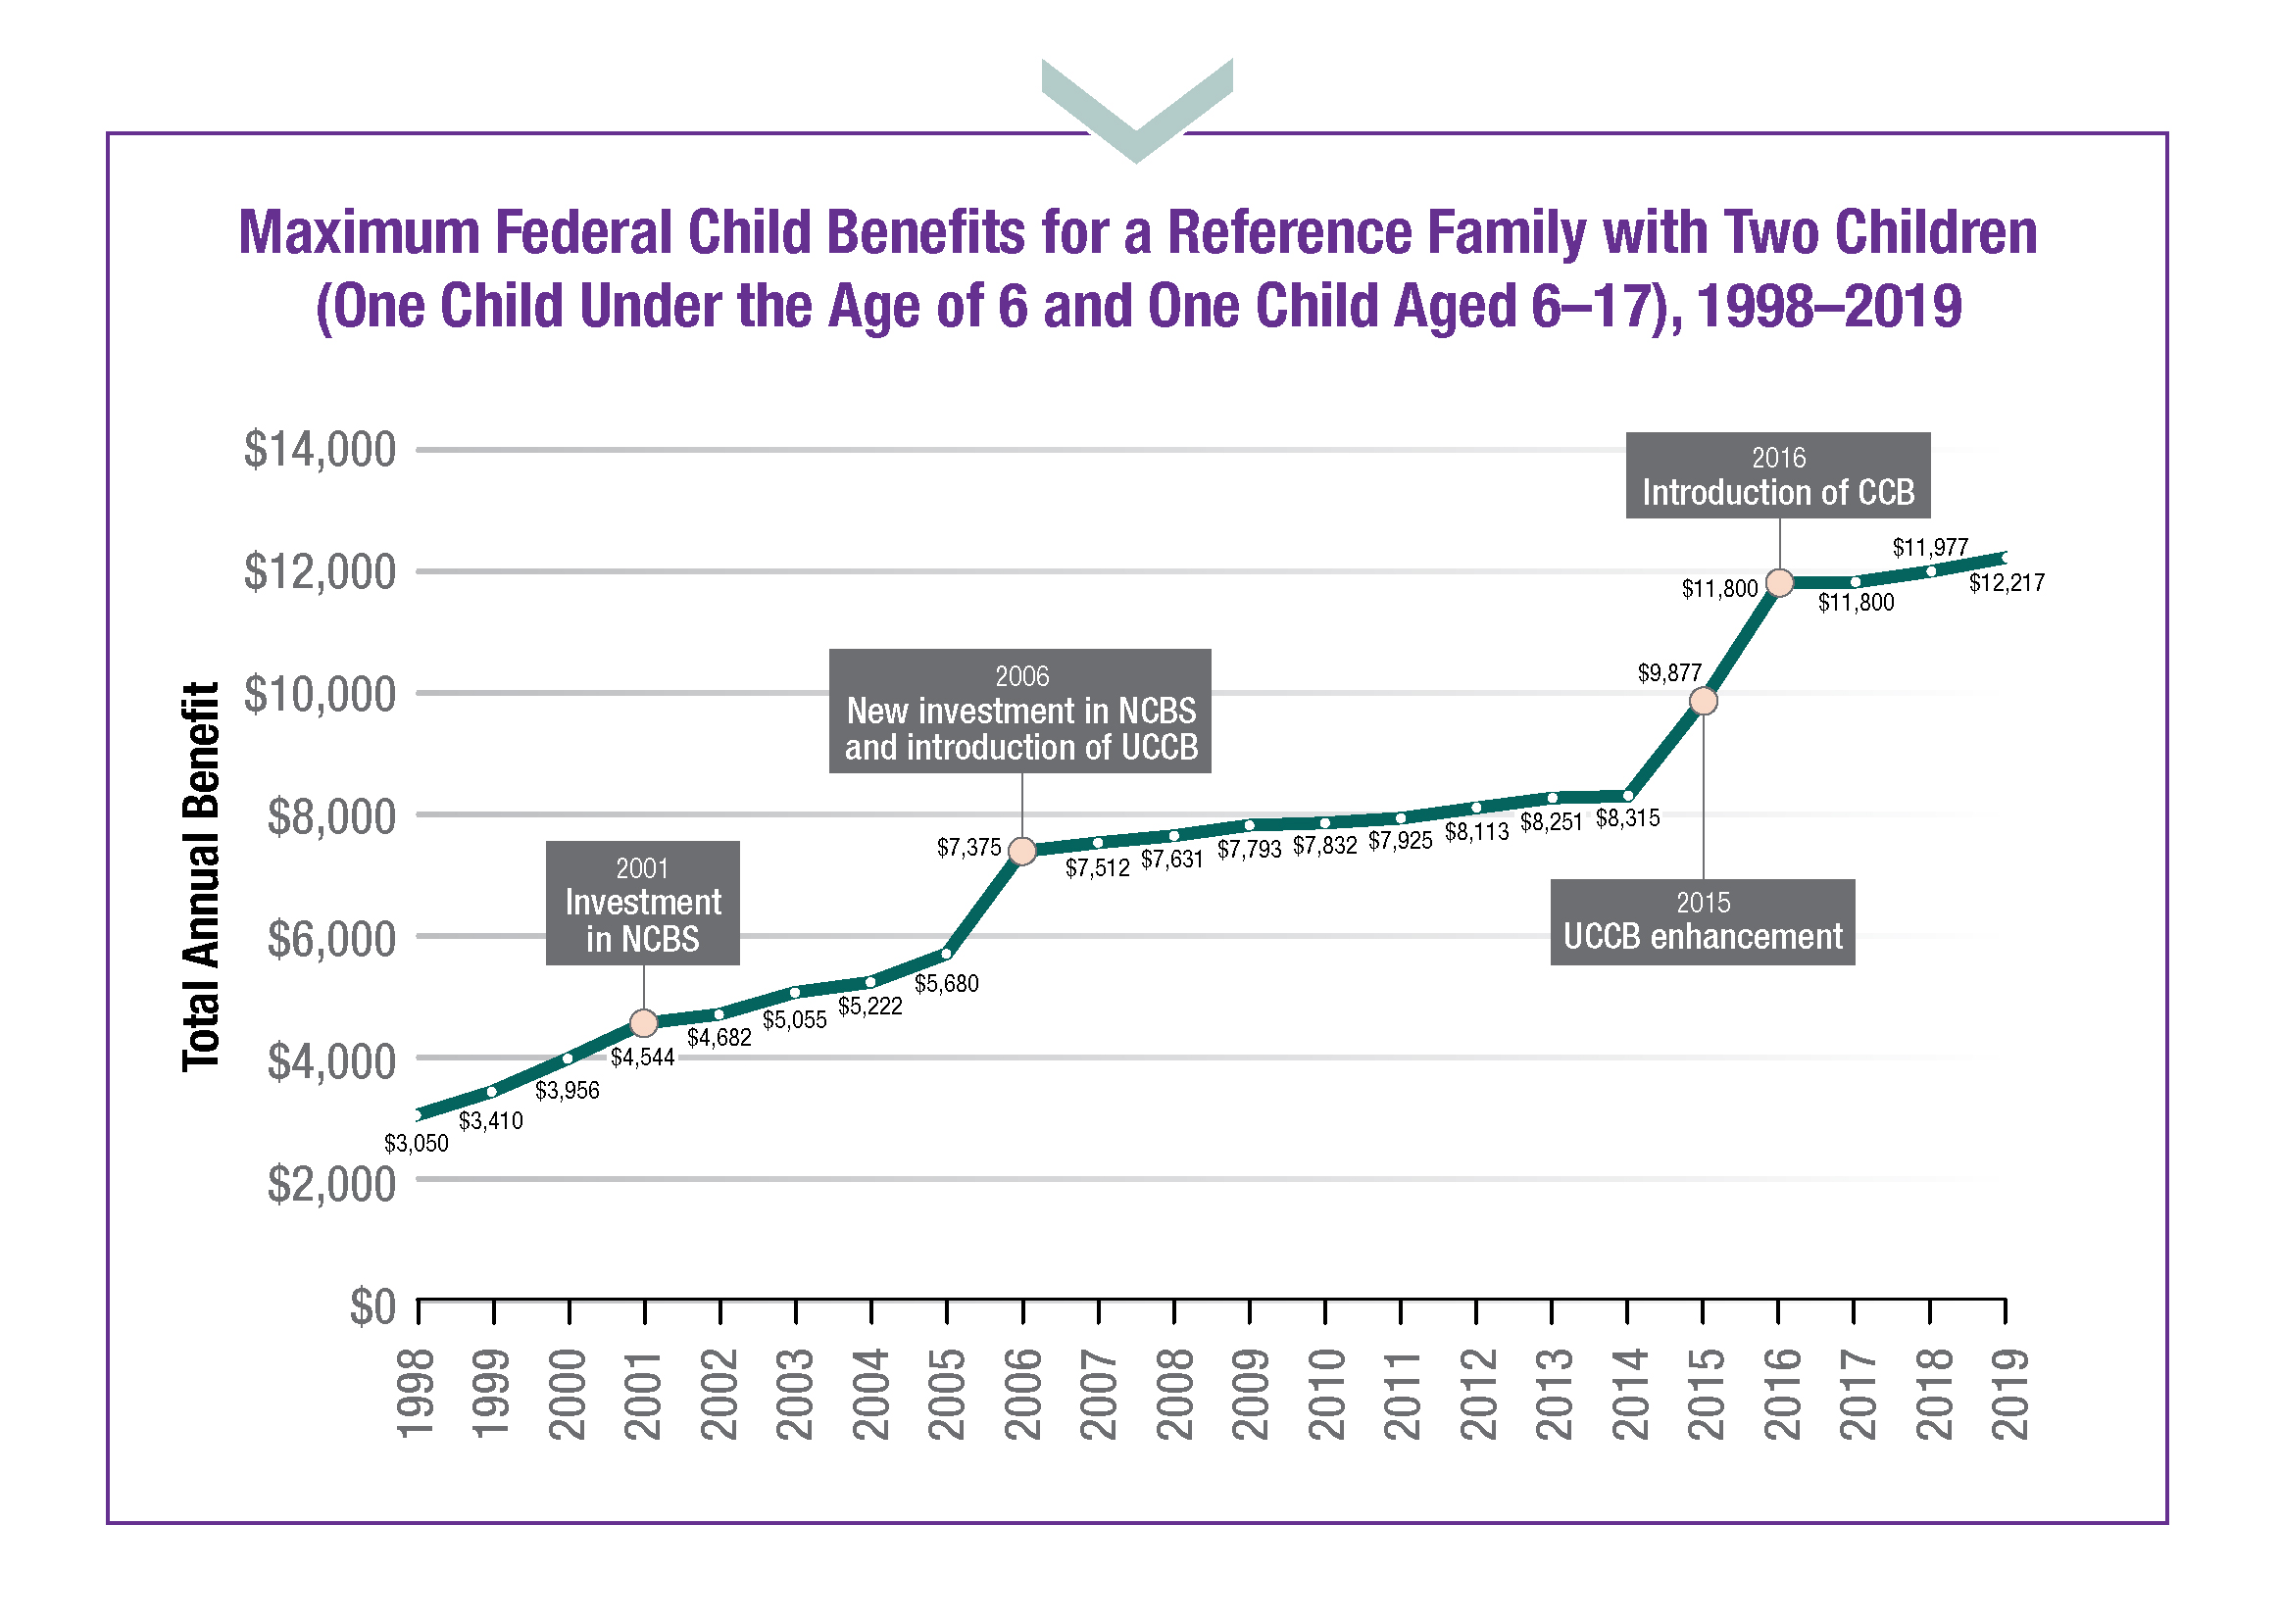
Maximum Federal Child Benefits for a Reference Family with Two Children - Text description
| Benefit Year | 1998 | 1999 | 2000 | 2001 | 2002 | 2003 | 2004 | 2005 | 2006 | 2007 | 2008 | 2009 | 2010 | 2011 | 2012 | 2013 | 2014 | 2015 | 2016 | 2017 | 2018 | 2019 |
|---|---|---|---|---|---|---|---|---|---|---|---|---|---|---|---|---|---|---|---|---|---|---|
| Total Maximum Benefit | $ 3 050 | $ 3 410 | $ 3 956 | $ 4 544 | $ 4 682 | $ 5 055 | $ 5 222 | $ 5 680 | $ 7 375 | $ 7 512 | $ 7 631 | $ 7 793 | $ 7 832 | $ 7 925 | $ 8 113 | $ 8 251 | $ 8 315 | $ 9 877 | $ 11 800 | $ 11 800 | $ 11 977 | $ 12 217 |
Accumulated CCB over 18 years
Under the CCB, 9 out of 10 families with children are better off than they were under the previous child benefits in place prior to the CCB. Over the course of childhood (0 to age 18), the increased benefits families receive from the CCB can also be considerable.
Vignette: Additional benefits from birth to when a child turns 18
A family with one child and an income of $50,000, when the child is born, will receive approximately $97,023 from the CCB, which is $49,157 more than they would have received under the previous system.
Efforts have been underway to increase CCB uptake
The CCB uptake rate has been high at over 95% since its introduction. This means that a small percentage of eligible Canadians are currently not accessing benefits. To help ensure that vulnerable Canadians can access the assistance they need and make a meaningful impact in their lives, Service Canada and the Canada Revenue Agency have been working to raise awareness of the CCB and its benefits to families and working to assist families to access these benefits.
Early Learning and Child Care
The Government of Canada has made investments of $7.5 billion over 11 years to create more high quality, affordable child care across the country. By March 2020, investments could support up to 40,000 more affordable child care spaces.
Available data from longitudinal studies, which have followed participants from early childhood to adulthood, show that high-quality early learning and child care programs can have enduring, positive effects on a range of socio economic and health outcomes, including physical health, social and emotional skills, and educational achievement and earnings. These benefits have consistently been shown to be greatest for children from lower socio-economic backgrounds. Studies also show that access to affordable high-quality early learning and child care provides parents, particularly women—who often bear the primary responsibility for the care of young children—with increased opportunity to participate in education and training, to join the labour force in greater numbers, and to earn higher incomes.
For more information on the important work underway with the Government of Canada and provinces and territories, please visit the Early Learning and Child Care website to read the 2017–18 National Progress Report on Early Learning and Child Care.
Canada Workers Benefit
In 2018, the Government of Canada introduced the new Canada Workers Benefit (CWB) to strengthen and replace the previous Working Income Tax Benefit (WITB).
The CWB, which came into effect for the 2019 tax year, is a refundable tax credit that helps supplement the earnings of low-income workers by letting them take home more money while they work. Relative to the WITB, the CWB increases the maximum benefit level by up to $170 for 2019 compared to 2018 and increases the income level at which the benefit is phased out completely. The maximum amount for the CWB disability supplement also increased for 2019, as well as the phased out income level.
Improving Access to the Canada Workers Benefit
To improve access to the CWB, the Canada Revenue Agency will automatically determine whether taxfilers are eligible for the benefit, meaning that all eligible workers will automatically receive the CWB when they file taxes. A take-up rate of 100% of taxfilers is therefore expected (up from 86% in 2015). An estimated 300,000 additional low-income workers will receive the CWB for the 2019 tax year as a result of these changes, meaning that, in total, over 2 million Canadians will benefit from the strengthened and enhanced CWB.
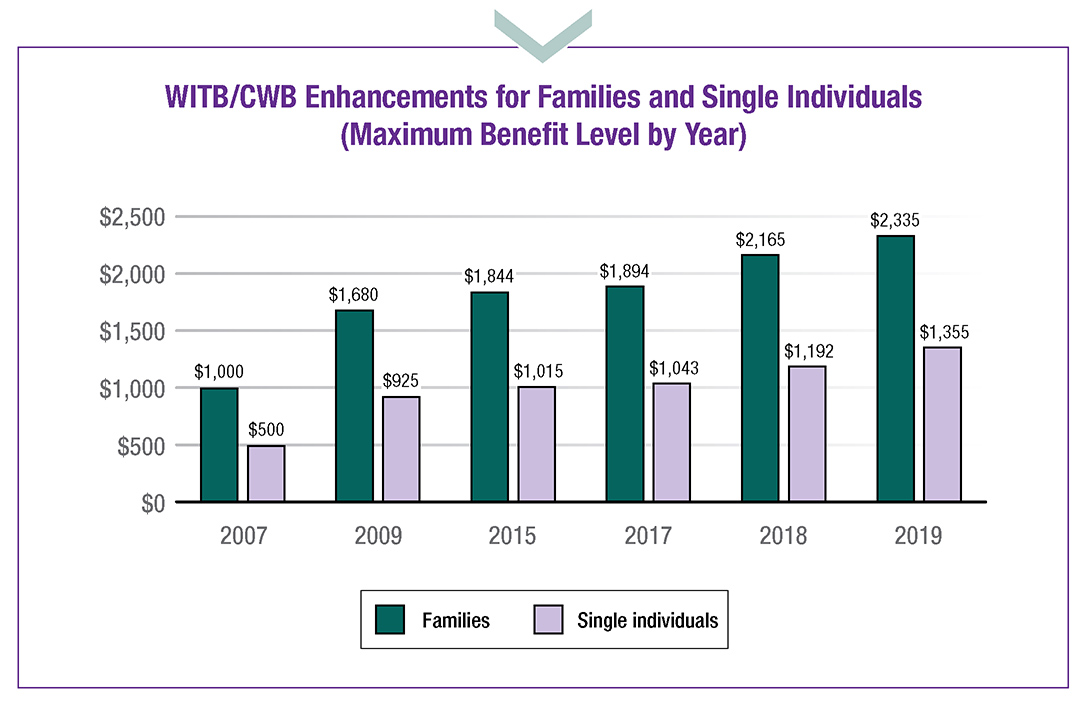
WITB/CWB Enhancements for Families and Single Individuals - Text description
| Year | Families | Single Individuals |
|---|---|---|
| 2007 | $1 000 | $500 |
| 2009 | $1 680 | $925 |
| 2015 | $1 844 | $1 015 |
| 2017 | $1 894 | $1 043 |
| 2018 | $2 165 | $1 192 |
| 2019 | $2 335 | $1 355 |
Increase to the Guaranteed Income Supplement top-up benefit
The Guaranteed Income Supplement (GIS) provides a monthly non-taxable benefit to Old Age Security (OAS) pension recipients who have a low income and are living in Canada. The GIS is income-tested on the applicant’s annual income or, in the case of a couple, their combined income.
In 2016, to help seniors who are living in poverty or who are most at risk of living in poverty, the majority of whom are women, the Government of Canada increased the GIS for the lowest-income single seniors.
This increase of up to $947 annually is helping to improve the financial security of close to 900,000 vulnerable seniors, and has helped to reduce the number of single seniors living in poverty by 52,000 between 2015 and 2017.
While the GIS take-up rate is high (91.2% in 2016), the Government of Canada has been working to increase GIS take-up even further.
This work includes the implementation of GIS Automatic Enrolment in 2017 and the introduction of the OAS and GIS combined application form in 2018. This ensures that all new pensioners who file a tax return are assessed for the GIS year after year without having to apply.
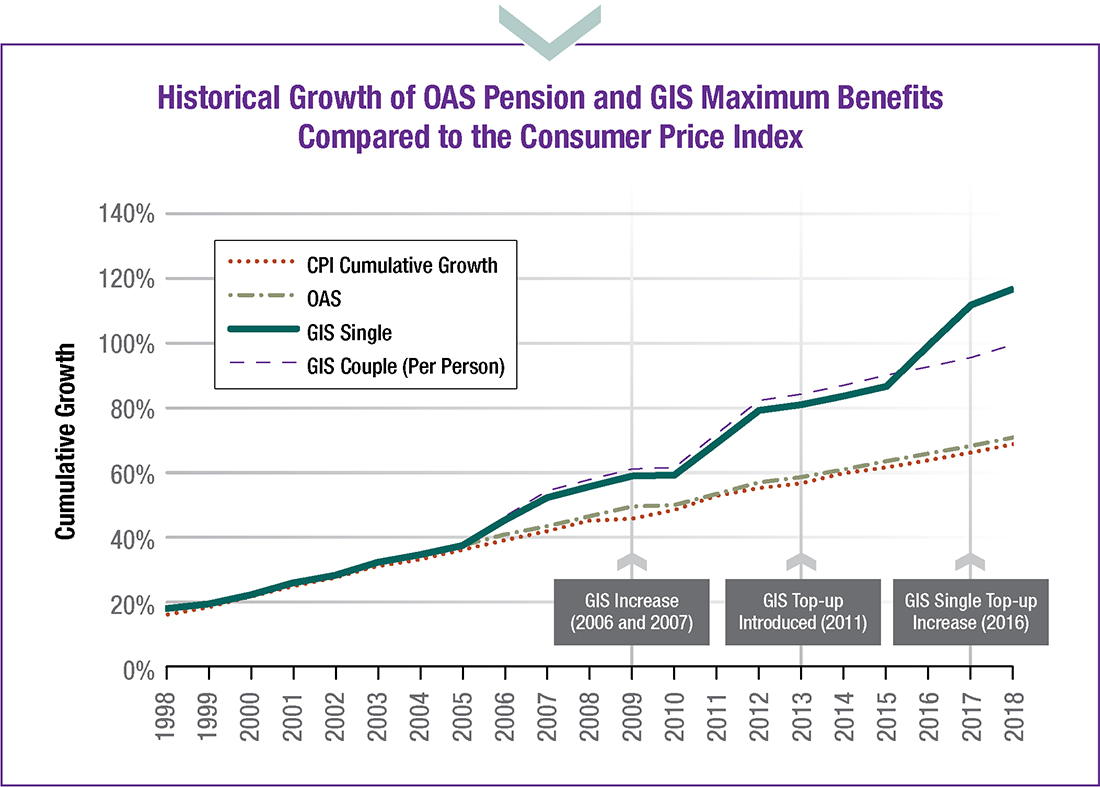
Historical Growth of OAS Pension and GIS Maximum Benefits Compared to the Consumer Price Index - Text description
| Year | GIS Single | OAS | CPI Cumulative Growth | GIS Couple |
|---|---|---|---|---|
| 1998 | 18% | 18% | 16% | 18% |
| 1999 | 20% | 20% | 18% | 20% |
| 2000 | 22% | 22% | 22% | 22% |
| 2001 | 26% | 26% | 25% | 26% |
| 2002 | 29% | 29% | 28% | 29% |
| 2003 | 33% | 33% | 31% | 33% |
| 2004 | 35% | 35% | 34% | 35% |
| 2005 | 38% | 38% | 36% | 38% |
| 2006 | 45% | 41% | 39% | 46% |
| 2007 | 52% | 44% | 42% | 55% |
| 2008 | 56% | 47% | 46% | 58% |
| 2009 | 59% | 50% | 46% | 61% |
| 2010 | 59% | 50% | 49% | 62% |
| 2011 | 69% | 54% | 53% | 72% |
| 2012 | 79% | 57% | 55% | 82% |
| 2013 | 81% | 59% | 57% | 84% |
| 2014 | 84% | 61% | 60% | 87% |
| 2015 | 87% | 64% | 61% | 90% |
| 2016 | 99% | 66% | 64% | 93% |
| 2017 | 111% | 68% | 66% | 95% |
| 2018 | 116% | 72% | 70% | 99% |
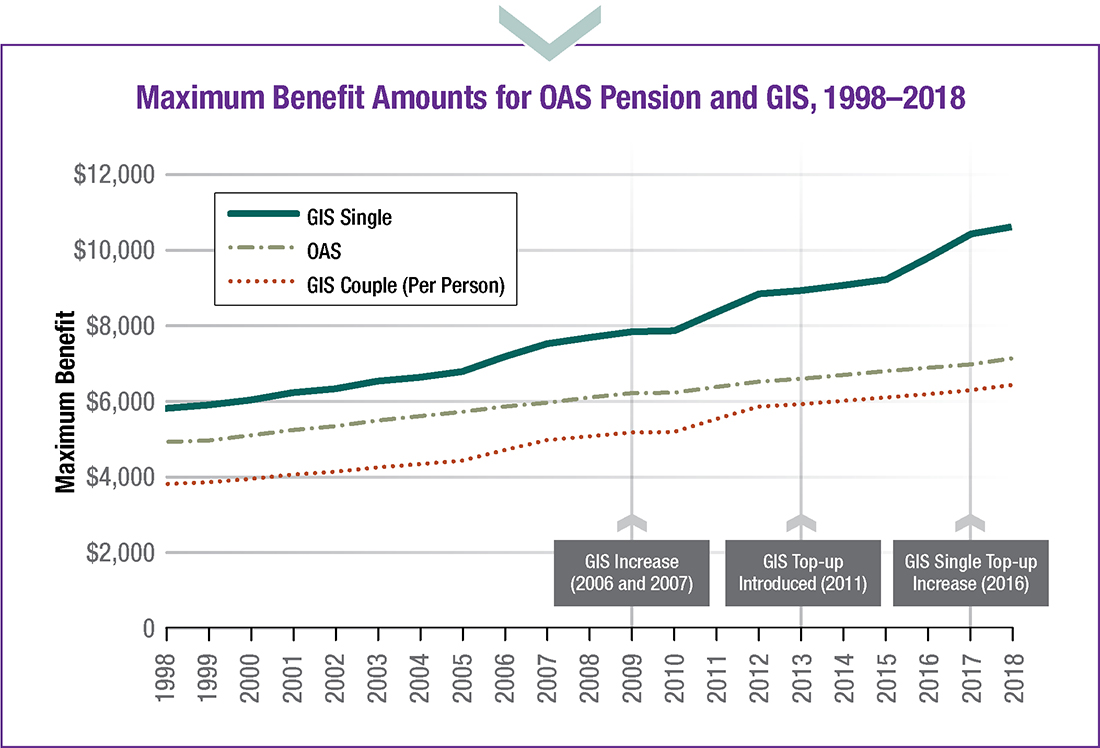
Maximum Benefit Amounts for OAS Pension and GIS, 1998-2918 - Text description
| Year | GIS Single | OAS | GIS Couple (per person) |
|---|---|---|---|
| 1998 | 5 825,25 | 4 901,70 | 3 794,34 |
| 1999 | 5 894,01 | 4 959,51 | 3 839,10 |
| 2000 | 6 036,72 | 5 079,51 | 3 932,10 |
| 2001 | 6 218,28 | 5 232,27 | 4 050,36 |
| 2002 | 6 341,43 | 5 335,89 | 4 130,58 |
| 2003 | 6 533,67 | 5 497,62 | 4 255,83 |
| 2004 | 6 646,92 | 5 592,75 | 4 329,57 |
| 2005 | 6 782,28 | 5 706,63 | 4 417,74 |
| 2006 | 7 165,14 | 5 846,19 | 4 700,67 |
| 2007 | 7 512,60 | 5 952,00 | 4 961,19 |
| 2008 | 7 677,03 | 6 082,23 | 5 069,70 |
| 2009 | 7 830,12 | 6 203,52 | 5 170,80 |
| 2010 | 7 853,67 | 6 222,15 | 5 186,31 |
| 2011 | 8 339,34 | 6 368,25 | 5 518,80 |
| 2012 | 8 827,92 | 6 510,60 | 5 853,54 |
| 2013 | 8 920,83 | 6 579,06 | 5 915,13 |
| 2014 | 9 053,10 | 6 676,59 | 6 002,94 |
| 2015 | 9 202,68 | 6 786,90 | 6 102,09 |
| 2016 | 9 803,04 | 6 878,82 | 6 184,86 |
| 2017 | 10 423,56 | 6 978,87 | 6 274,83 |
| 2018 | 10 636,32 | 7 121,31 | 6 402,93 |
“The budget [2016] makes targeted investments in single seniors most at risk of poverty by increasing the Guaranteed Income Supplement by 10%, and returning eligibility for the Old Age Security benefit to 65 for all Canadians.”
As shown in the Historical growth of OAS pension and GIS maximum benefits compared to Consumer Price Index table, lump-sum increases to the GIS over the years have resulted in benefits increasing above the estimated increase to the cost of living. In addition, annual indexation of OAS and GIS program benefits ensures that benefit amounts keep pace with the cost of living.
National Housing Strategy
On November 22, 2017, the Government of Canada announced Canada’s first ever National Housing Strategy (NHS), a 10-year, $55+ billion plan to help reduce homelessness and improve the availability and quality of housing for Canadians in need.
To help more Canadians access housing that meets their needs and they can afford, the NHS sets out to achieve measurable outcomes and ambitious targets to reduce homelessness and improve access to adequate and affordable housing. The Government of Canada is investing in new initiatives that will create over 125,000 new housing units, repair and renew another 300,000 units and will help remove or reduce housing need for as many as 530,000 households and reduce chronic homelessness by 50%. In addition to its targets under the NHS, 33% of investments would support projects that specifically target the unique needs of women and girls.
NHS initiatives positively impact low-income households by reducing the severity of housing need through the preservation of affordability. By implementing a human rights-based approach, the NHS facilitates housing for populations experiencing systemic barriers and discrimination.
New federal legislation recognizes the importance of housing to the dignity and well-being of people in Canada, and furthers the progressive realization of the right to adequate housing. The National Housing Strategy Act, which became law on June 21, 2019, requires the federal government to maintain an NHS that prioritizes the housing needs of the most vulnerable and creates new participatory and accountability mechanisms in the form of a Federal Housing Advocate and National Housing Council. A progress report on federal housing investments will be posted shortly. For more information, go to the National Housing Strategy website to download a copy of the report when it becomes available and to learn more about the NHS.
Benefits Working Together Vignette 1:
Melanie has a net family income of $25,000 and one child under 6. In 2019, Melanie will receive $6,639 through the Canada Child Benefit, an increase of $143 from the previous year due to indexation, which she uses to cover her child care expenses.
Through the Canada Workers Benefit, Melanie will receive almost $1,378 in 2019, $717 more than she would have received from the Working Income Tax Benefit in 2018.
A National Housing Co-Investment Fund project under the National Housing Strategy that is currently under construction in her neighborhood in Halifax is giving her hope, as she will be one of the first residents to move in. Her rent will drop to 80% of the median market rent, which represents savings of $261/month.
This is in addition to the $8,017 she will receive through the Canada Child Benefit and Canada Workers Benefit.
Benefits Working Together Vignette 2:
Luc and Samuel live in Ottawa and have a net family income of $55,000 with one child under 6 and one child over 6. They receive $8,663 in the 2018–19 benefit year through the Canada Child Benefit and will receive an additional $354 due to indexation of the benefit in 2019–20.
Luc and Samuel are looking for an apartment they can afford for their family. With low vacancy rates in Ottawa, Luc and Samuel are doing their best to make it work in their current one bedroom rental. All this will change when a new development through the National Housing Strategy’s Federal Lands Initiative creates affordable rental housing on nearby surplus federal property. Luc and Samuel, and their two kids, will soon be able to move into a new three bedroom apartment that meets their needs and that they can afford.
Benefits Working Together Vignette 3:
Lynn is a 74-year-old resident of Calgary, Alberta, with mobility challenges and no income apart from Old Age Security and Guaranteed Income Supplement benefits. The increase in the Guaranteed Income Supplement top-up benefit provided Lynn with almost $1,000 more in 2019.
Recently, the community housing group where she lives received partial funding from the National Housing Co-Investment Fund, a National Housing Strategy initiative, for much-needed repairs—including improved accessibility. The re-design of the unit for accessibility enables Lynn to function safely in her unit.
Poverty Indicators
According to Statistics Canada’s Canadian Income Survey, 3.4 million people, or 9.5% of Canadians, were living in poverty in 2017, a decrease of more than 20% from 2015 levels. This means that approximately 825,000 fewer Canadians were living in poverty in 2017 compared to 2015.
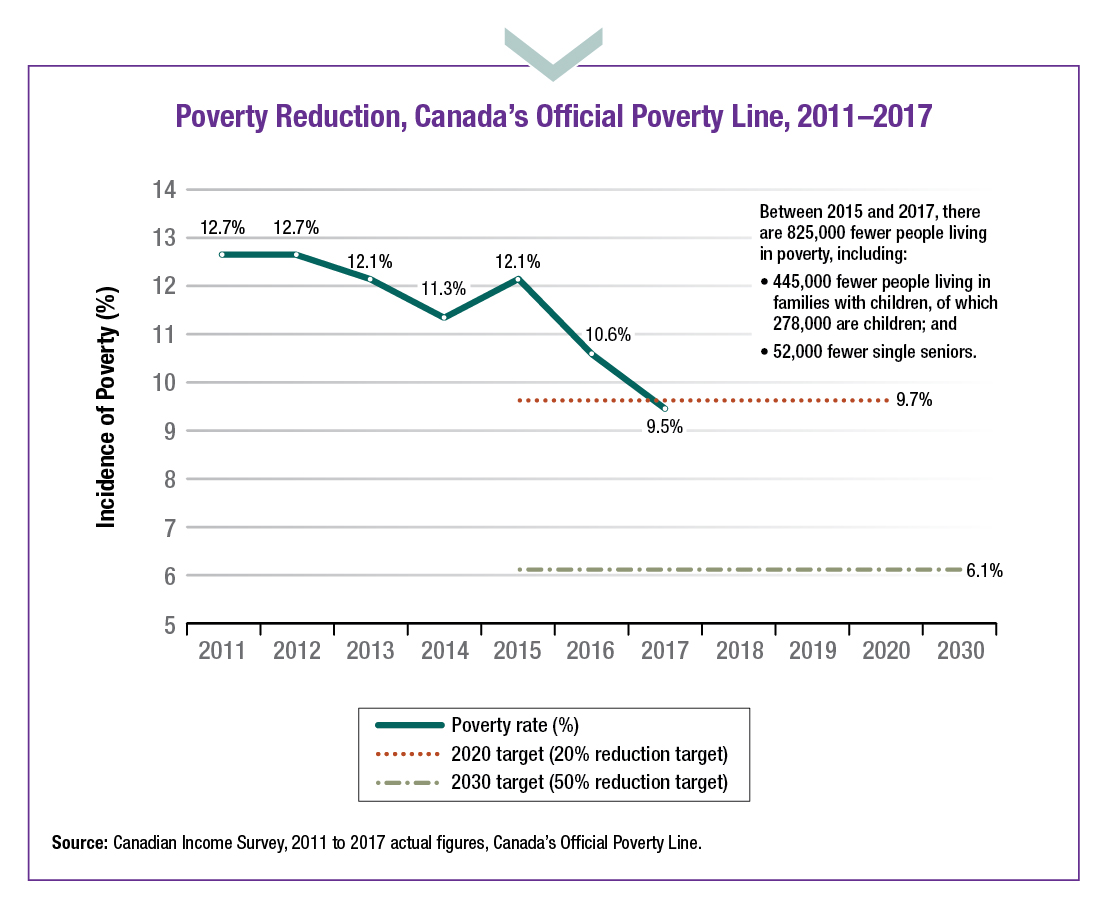
Poverty Reduction, Canada’s Official Poverty Line, 2011–2017 - Text description
| Year | Number of Persons in Low Income | Poverty Rate | 2020 Target | 2030 Target | Year-over-year change (#) |
|---|---|---|---|---|---|
| 2011 | 4 262 000 | 12.7% | N/A | N/A | 177 000 |
| 2012 | 4 300 000 | 12.7% | N/A | N/A | 38 000 |
| 2013 | 4 167 000 | 12.1% | N/A | N/A | - 133 000 |
| 2014 | 3 911 000 | 11.3% | N/A | N/A | - 256 000 |
| 2015 | 4 238 000 | 12.1% | 9.7% | 6.1% | 327 000 |
| 2016 | 3 739 000 | 10.6% | 9.7% | 6.1% | - 499 000 |
| 2017 | 3 412 000 | 9.5% | 9.7% | 6.1% | - 327 000 |
| 2018 | N/A | N/A | 9.7% | 6.1% | N/A |
| 2019 | N/A | N/A | 9.7% | 6.1% | N/A |
| 2020 | N/A | N/A | 9.7% | 6.1% | N/A |
| 2030 | N/A | N/A | 9.7% | 6.1% | N/A |
Indicator Snapshot
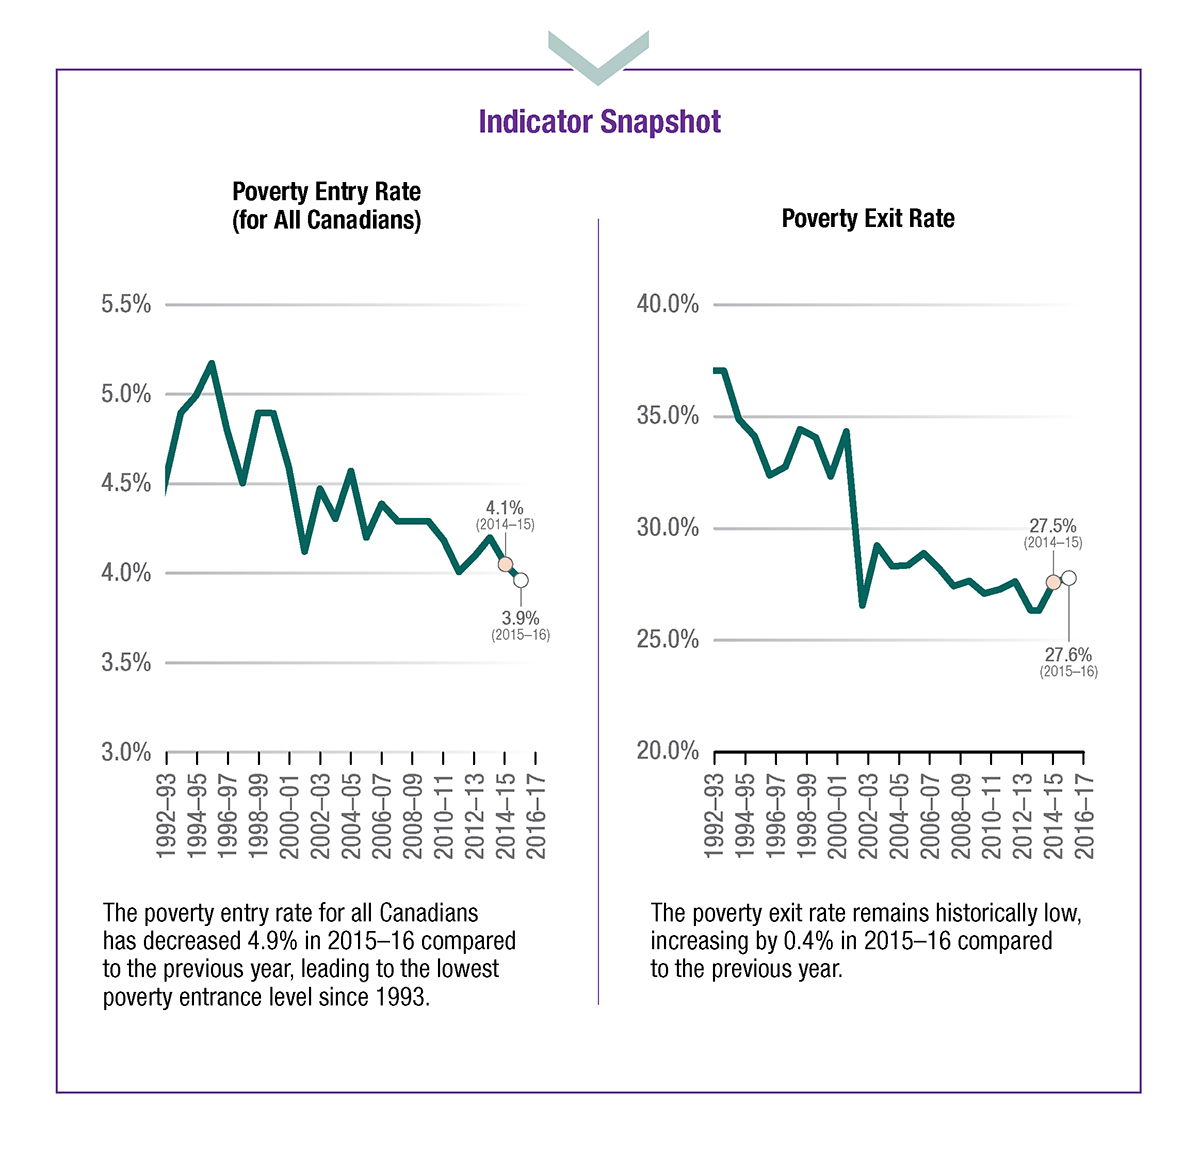
Indicator Snapshot Poverty Entry and Exit Rate - Text description
| Year | 1992/1993 | 1993/1994 | 1994/1995 | 1995/1996 | 1996/1997 | 1997/1998 | 1998/1999 | 1999/2000 | 2000/2001 | 2001/2002 | 2002/2003 | 2003/2004 | 2004/2005 | 2005/2006 | 2006/2007 | 2007/2008 | 2008/2009 | 2009/2010 | 2010/2011 | 2011/2012 | 2012/2013 | 2013/2014 | 2014/2015 | 2015/2016 | 2016/2017 |
|---|---|---|---|---|---|---|---|---|---|---|---|---|---|---|---|---|---|---|---|---|---|---|---|---|---|
| Entry | 4.5% | 4.9% | 5.0% | 5.2% | 4.8% | 4.5% | 4.9% | 4.9% | 4.6% | 4.1% | 4.5% | 4.3% | 4.6% | 4.2% | 4.4% | 4.3% | 4.3% | 4.3% | 4.2% | 4.0% | 4.1% | 4.2% | 4.1% | 3.9% | N/A |
| Exit | 37,1% | 34,9% | 34,2% | 32,5% | 32,7% | 34,5% | 34,0% | 32,2% | 34,6% | 26,2% | 29,3% | 28,3% | 28,4% | 28,9% | 28,3% | 27,4% | 27,6% | 27,1% | 27,2% | 27,6% | 26,3% | 26,2% | 27,5% | 27,6% | N/A |
Poverty Entry Rate (for all Canadians)
The poverty entry rate for all Canadians has decreased 4.9% in 2015-16 compared to the previous year, leading to the lowest poverty entrance level since 1993.
Poverty Exit Rate
The poverty exit rate remains historically low, increasing by 0.4% in 2015-16 compared to the previous year.
Complete dashboard available here.
Children
The number of children living in poverty has also decreased. In 2017, 622,000 children under 18 were living in poverty (9%), a decrease of more than 30% from 2015, meaning that 278,000 fewer children were living in families in poverty in 2017.
People in lone-parent families recorded among the largest decreases in poverty in 2017—the proportion of people in these families living below Canada’s Official Poverty Line fell from 29.8% in 2015 to 22.7% in 2017.
Indicator Snapshot
Deep Income Poverty (Persons below 75% of Poverty Line)
Deep income poverty has decreased 22.7% since 2015, leading to the lowest rate since 2012.
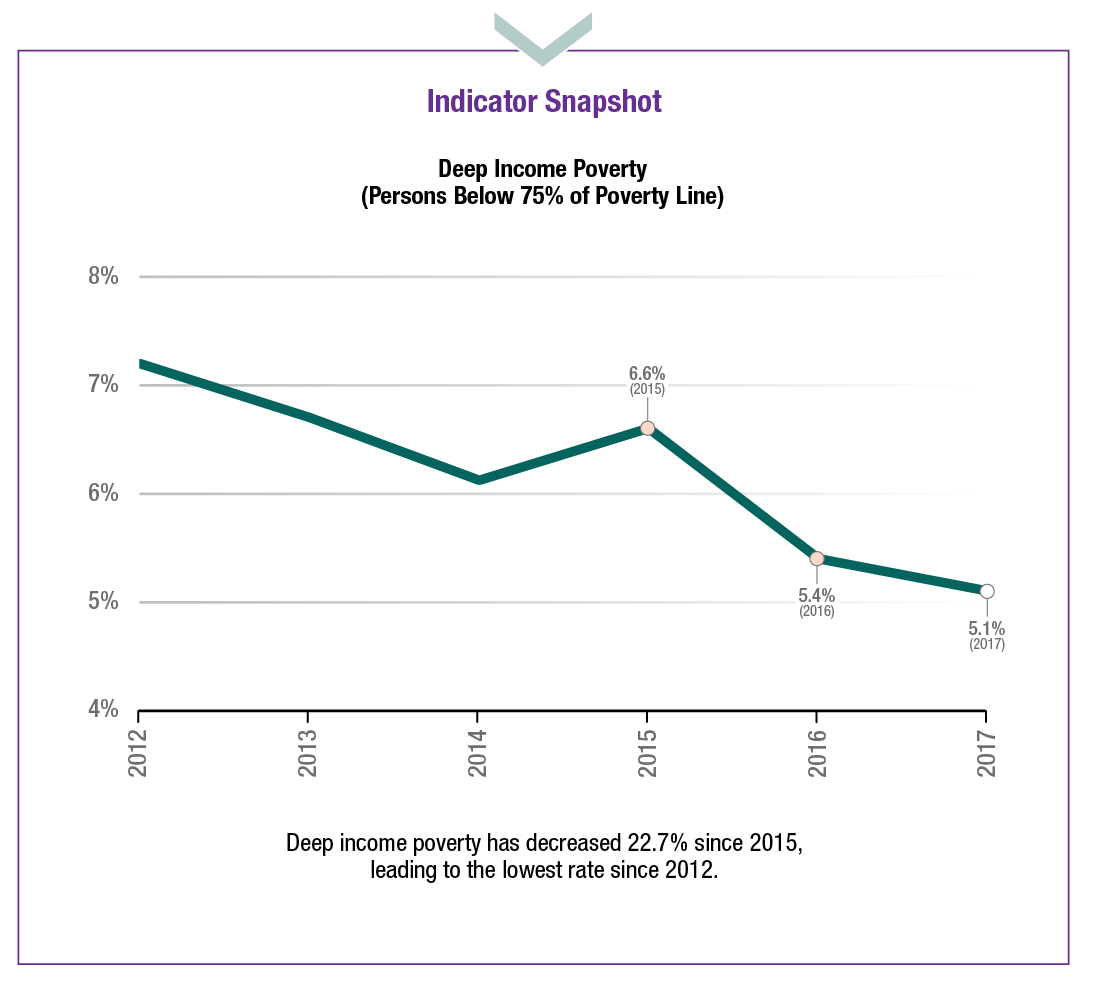
Indicator Snapshot Deep Income Poverty - Text description
| Year | 2012 | 2013 | 2014 | 2015 | 2016 | 2017 | 2018 |
|---|---|---|---|---|---|---|---|
| Number of persons | 2 441 131 | 2 294 069 | 2 113 146 | 2 312 194 | 1 919 918 | 1 838 815 | N/A |
| Incidence | 7.2% | 6.7% | 6.1% | 6.6% | 5.4% | 5.1% | N/A |
Complete dashboard available here.
Increases in child benefits provided more income for families with children. The median child benefit increased from $3,400 in 2015 to $5,200 in 2017 for two-parent families. For lone-parent families, it increased from $5,900 in 2015 to $7,800 in 2017.
Indicator Snapshot
Relative Low Income (Canadians who had less than half as much income as the median after-tax income)
- Decreased by 10.6% since 2015 and 2.3% since release of Opportunity for All
- 3rd lowest since 1997
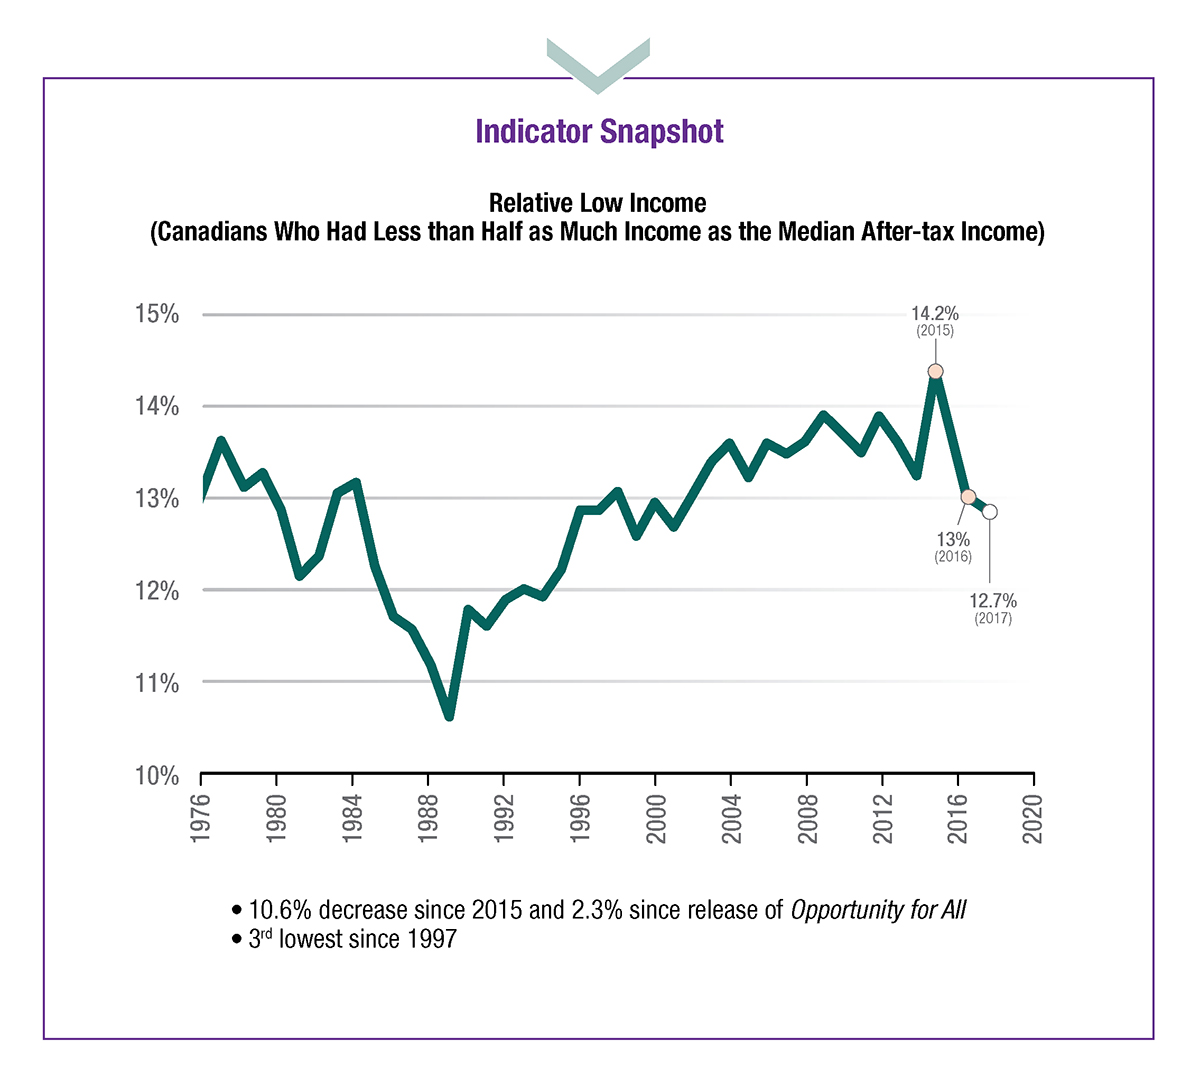
Indicator Snapshot Relative Low Income - Text description
| Year | 1976 | 1977 | 1978 | 1979 | 1980 | 1981 | 1982 | 1983 | 1984 | 1985 | 1986 | 1987 | 1988 | 1989 | 1990 | 1991 | 1992 | 1993 | 1994 | 1995 | 1996 | 1997 | 1998 | 1999 | 2000 | 2001 | 2002 | 2003 | 2004 | 2005 | 2006 | 2007 | 2008 | 2009 | 2010 | 2011 | 2012 | 2013 | 2014 | 2015 | 2016 | 2017 | 2018 |
|---|---|---|---|---|---|---|---|---|---|---|---|---|---|---|---|---|---|---|---|---|---|---|---|---|---|---|---|---|---|---|---|---|---|---|---|---|---|---|---|---|---|---|---|
| Percent | 13.0% | 13.6% | 12.9% | 13.1% | 12.7% | 12.0% | 12.2% | 12.9% | 13.0% | 12.1% | 11.6% | 11.5% | 11.1% | 10.5% | 11.7% | 11.5% | 11.8% | 11.9% | 11.8% | 12.1% | 12.7% | 12.7% | 12.9% | 12.4% | 12.8% | 12.5% | 12.9% | 13.2% | 13.4% | 13.0% | 13.4% | 13.3% | 13.4% | 13.7% | 13.5% | 13.3% | 13.7% | 13.4% | 13.0% | 14.2% | 13.0% | 12.7% | N/A |
Complete dashboard available here.
Seniors
A large numbers of seniors have also been lifted out of poverty. In 2017, 238,000 seniors were living in poverty (3.9%), a decrease of more than 20% from 2015.
The increase to the Guaranteed Income Supplement top-up was targeted to single seniors. Between 2015 and 2017, there was a decrease of 52,000 single seniors living below Canada’s Official Poverty Line. The median after-tax income of senior families (where the highest income earner was 65 years of age and older) totalled $61,200 in 2017, up $2,000 from 2015.
Provincial trends
There have been reductions in poverty in every province between 2015 and 2017.
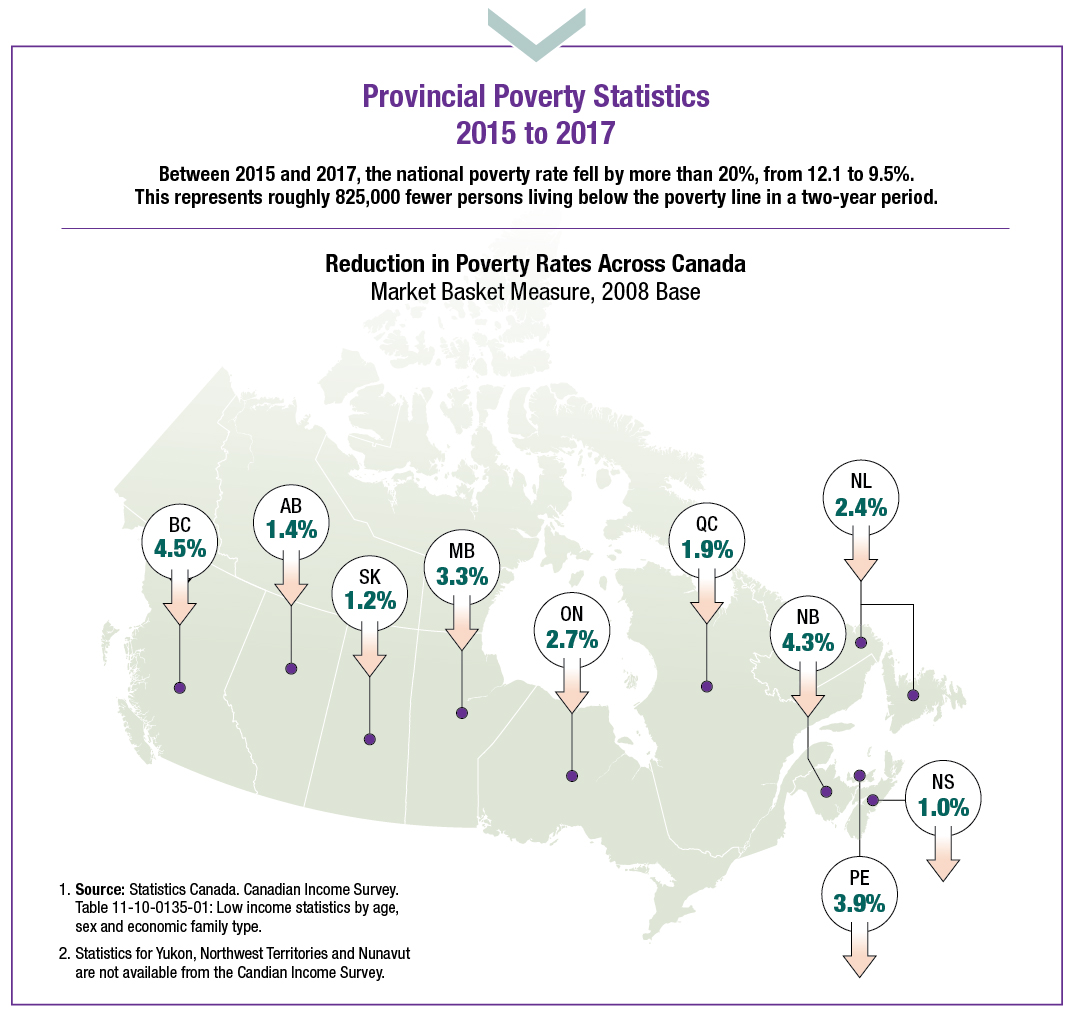
Provincial Poverty Statistics - Text description
Between 2015 and 2017, the national poverty rate fell by more than 20%, from 12.1% to 9.5%. This represents roughly 825,000 fewer persons living below the poverty line in a two-year period. British Columbia and New Brunswick had the largest reductions in poverty (4.5% and 4.3% respectively) from over 14% in 2015 to 10% in 2017.Poverty rates across vulnerable groups
Poverty rates among Canadians most at risk of living in poverty have declined since 2015, but poverty among these groups remains disproportionately high.
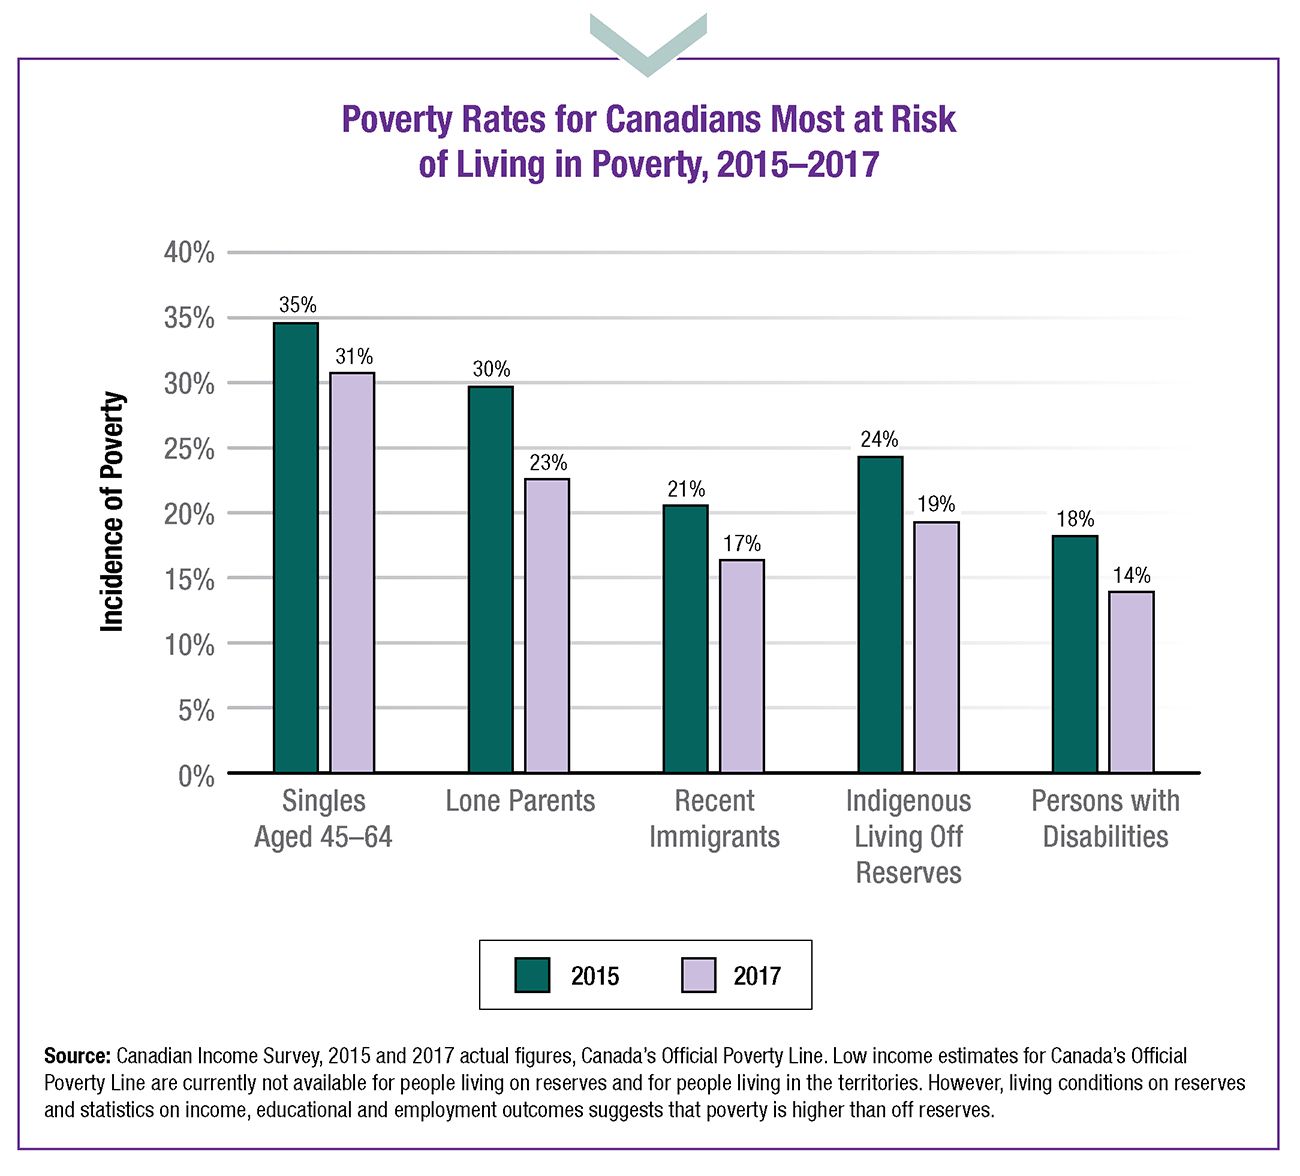
Poverty Rates for Canadians Most at Risk of Living in Poverty, 2015-2017 - Text description
| Singles aged 45-64 | Lone Parents | Recent Immigrants | Indigenous off reserve | Persons with Disabilities | |
|---|---|---|---|---|---|
| 2015 | 35% | 30% | 21% | 24% | 18% |
| 2017 | 31% | 23% | 17% | 19% | 14% |
The most recent data shows that nearly a third of singles aged 45 to 64 and nearly a quarter of lone parents (the vast majority of whom are women) were living in poverty in 2017.
Indigenous people in Canada also continue to face substantial challenges and significantly lower socio-economic outcomes than other Canadians. Because the Canadian Income Survey is not conducted on-reserve, however, poverty rates are currently not available for on-reserve communities.