
Archived: Fleet average NOx emission performance of 2011 model vehicles
Fleet average nitrogen oxides (NOx) emission performance of 2011 model year light-duty vehicles, light-duty trucks and medium-duty passenger vehicles
in relation to the On-Road Vehicle and Engine Emission Regulations under the
Canadian Environmental Protection Act, 1999
Transportation Division
March 2014
Disclaimer
This document provides a summary of data collected pursuant to the On-Road Vehicle and Engine Emission Regulations. It does not in any way supersede or modify the requirements of the Canadian Environmental Protection Act, 1999 or the Regulations made under that Act. In the event of an inconsistency between this document and the Act and/or the Regulations, the Act and the Regulations prevail.
Cat. No.: En81-10/2011E-PDF
ISSN: 1927-2456
Unless otherwise specified, you may not reproduce materials in this publication, in whole or in part, for the purposes of commercial redistribution without prior written permission from Environment Canada's copyright administrator. To obtain permission to reproduce Government of Canada materials for commercial purposes, apply for Crown Copyright Clearance by contacting:
Environment Canada
Inquiry Centre
10 Wellington Street, 23rd Floor
Gatineau QC K1A 0H3
Telephone: 819-997-2800
Toll Free: 1-800-668-6767 (in Canada only)
Fax: 819-994-1412
TTY: 819-994-0736
Email: enviroinfo@ec.gc.ca
© Her Majesty the Queen in Right of Canada, represented by the Minister of the Environment, 2014
Aussi disponible en français : Rendement des émissions moyennes de NOx du parc de véhicules légers, de camionnettes et de véhicules moyens à passagers pour l’année de modèle 2011.
Table of contents
List of tables
- Table 1: Light-duty vehicles (LDV), light light-duty trucks (LLDT),heavy light-duty trucks (HLDT) and medium-duty passenger vehicles (MDPV) full useful life exhaust emission standards
- Table 2: Fleet average NOx standards
- Table 3: Scope of company reports
- Table 4: Summary of company average NOx values for the combined fleet of LDV, LLDT, HLDT and MDPV
- Table 5: NOx emission credits/deficits for the 2011 model year and end of model year balance
- Table 6: Distribution of vehicles by the NOx standard of each bin
List of figures
1. Executive summary
Under the On-Road Vehicle and Engine Emission Regulations (hereafter referred to as the “Regulations”), each new light-duty vehicle, light-duty truck and medium-duty passenger vehicle is required to be certified by its manufacturer to one of the bins corresponding to those of the United States Environmental Protection Agency for which there are specific emission standards for oxides of nitrogen (NOx) and other pollutants. In addition, manufacturers and importers of these vehicles are required to report on their fleet average NOx emission performance for each model year.
This report is the eighth annual performance report, and it summarizes the fleet average NOx emission performance of the Canadian 2011 model-year fleet of vehicles. A total of 23 companies submitted end-of-model-year reports comprising a total of 1 450 947 vehicles manufactured in Canada or imported into Canada for the purpose of first retail sale. The report includes the fleet average NOx value for each company as well as their emission credits/deficits. It also provides a comparison of the distribution of vehicles certified to the various emissions bins and the overall NOx performance with that of previous model years (i.e., 2004 to 2010 model years).
The average NOx value for the Canadian 2011 model year combined fleet of light-duty vehicles, light light-duty trucks, heavy light-duty trucks and medium-duty passenger vehicles is 0.06454148 grams/mile compared to the standard of 0.07 grams/mile. Each individual company had a fleet average NOx value that was at or below the standard, and all companies complied with the fleet averaging provisions of the Regulations based on their reports.
The average NOx value continued to decrease for the 2011 model year. This result is consistent with the environmental performance objectives of the Regulations.
2. Purpose
The purpose of this report is to summarize the fleet average NOx emission performance of individual companies and the overall Canadian fleet for the 2011 model year (MY) based on data submitted by companies in their end-of-model-year reports; furthermore, it is also to report on the effectiveness of the Canadian fleet average NOx emission program in achieving the environmental performance objectives.
3. Introduction
On January 1, 2004, the On-Road Vehicle and Engine Emission Regulations came into effect under the Canadian Environmental Protection Act, 1999 (CEPA 1999). These Regulations introduced more stringent national emission standards for on-road vehicles and engines. The Regulations align Canada’s emission standards for light-duty vehicles, light-duty trucks, medium-duty passenger vehicles, heavy-duty vehicles, heavy-duty engines and on-road motorcycles with those of the U.S. Environmental Protection Agency (U.S. EPA) through incorporation by reference to the U.S. Code of Federal Regulations (CFR).
The Regulations also establish fleet average NOx standards for light-duty vehiclesFootnote 1 (LDV), light light-duty trucksFootnote 2 (LLDT), heavy light-duty trucksFootnote 3 (HLDT) and medium-duty passenger vehiclesFootnote 4 (MDPV). Each new LDV, LLDT, HLDT and MDPV is required to be certified to one of the bins presented in Table 1, for which there are specific emission standards for NOx and other pollutants. A company’s choice of bin to which individual vehicle models are certified in a given model year is limited by the obligation to comply with the fleet average NOx standards associated with that model year. Table 2 presents the applicable fleet average NOx standards for a company’s fleet of LDV, LLDT, HLDT and MDPV.
| Bin Number |
NOx | NMOG | CO | Formaldehyde | PM |
|---|---|---|---|---|---|
| 11* | 0.9 | 0.28 | 7.3 | 0.032 | 0.12 |
| 10* | 0.6 | 0.156/0.230 | 4.2/6.4 | 0.018/0.027 | 0.08 |
| 9* | 0.3 | 0.090/0.180 | 4.2 | 0.018 | 0.06 |
| 8 | 0.20 | 0.125/0.156 | 4.2 | 0.018 | 0.02 |
| 7 | 0.15 | 0.09 | 4.2 | 0.018 | 0.02 |
| 6 | 0.10 | 0.09 | 4.2 | 0.018 | 0.01 |
| 5 | 0.07 | 0.09 | 4.2 | 0.018 | 0.01 |
| 4 | 0.04 | 0.07 | 2.1 | 0.011 | 0.01 |
| 3 | 0.03 | 0.055 | 2.1 | 0.011 | 0.01 |
| 2 | 0.02 | 0.01 | 2.1 | 0.004 | 0.01 |
| 1 | 0.00 | 0.00 | 0.0 | 0.000 | 0.00 |
* These bins are no longer available.
| Model Year | LDV/LLDT | HLDT/MDPV |
|---|---|---|
| 2004 | 0.25 | 0.53 |
| 2005 | 0.19 | 0.43 |
| 2006 | 0.13 | 0.33 |
| 2007 | 0.07 | 0.20 |
| 2008 | 0.07 | 0.14 |
| 2009 and subsequent model years | 0.07 | 0.07 |
A company’s fleet average NOx value is the weighted average based on the number of vehicles certified to each bin. The emission bins, fleet average NOx standards, and methods of calculating fleet average NOx values are aligned with those of the United States Environmental Protection Agency (U.S. EPA). However, there are differences in the structure of the NOx averaging program in Canada, which is designed to recognize vehicles that are sold concurrently in Canada and the U.S. The regulatory requirements are structured to deliver fleet average emissions comparable to those of the U.S. while minimizing the regulatory burden on companies and enabling the marketing of vehicles in Canada independently from the U.S.
The Regulations require that all companies submit a report to the Minister of the Environment no later than May 1 after the end of each model year. The end-of-model-year report must contain detailed information concerning the company’s fleet(s) and/or groups of vehicles, including information related to the following:
statements of allowable elections made by the company in complying with the fleet average NOx requirements of the Regulations, if any;
the applicable fleet average NOx standard;
the fleet average NOx value achieved by the company;
the values used in calculating the company fleet average NOx value;
calculation of NOx emission credits and/or deficits, if any;
balance of credits or deficits;
credit transfers to or from the company, if any.
For more information regarding the calculation of fleet average NOx values and NOx emission credits or deficits, please refer to the Regulations, which can be found on the Environment Canada CEPA Registry. Reports for the 2004 to 2010 model years can also be found on the CEPA Registry.
4. Company fleet average NOx emission performance for the 2011 model year
4.1 Scope of company reports
Table 3 presents a list of the companies that submitted an end-of-model-year report for the 2011 model year in accordance with the requirements of the Regulations, including the vehicle makes as well as the number of test groups covered by their reports.
| Company | Makes | Number of test groups |
|---|---|---|
| Aston Martin Lagonda Limited | Aston Martin | 2 |
| BMW Group Canada | BMW, Mini, Rolls-Royce | 20 |
| Chrysler Canada Inc. | Chrysler, Dodge, Jeep | 20 |
| Ferrari North America, Inc. | Ferrari | 2 |
| Ford Motor Company of Canada, Limited | Ford, Lincoln | 32 |
| General Motors of Canada Limited | Buick, Cadillac, Chevrolet, GMC | 28 |
| Honda Canada Inc. | Acura, Honda | 17 |
| Hyundai Auto Canada Corp. | Hyundai | 16 |
| Jaguar (Jaguar Land Rover Canada ULC) | Jaguar | 1 |
| Kia Canada Inc. | Kia | 17 |
| Land Rover (Jaguar Land Rover Canada ULC) | Land Rover | 2 |
| Lotus Cars Limited | Lotus | 2 |
| Maserati North America, Inc. | Maserati | 1 |
| Mazda Canada Inc. | Mazda | 14 |
| Mercedes-Benz Canada Inc. | Maybach, Mercedes, Smart | 18 |
| Mitsubishi Motor Sales of Canada, Inc. | Mitsubishi | 9 |
| Nissan Canada Inc. | Infiniti, Nissan | 25 |
| Porsche Cars Canada, Ltd. | Porsche | 13 |
| Subaru Canada, Inc. | Subaru | 4 |
| Suzuki Canada Inc. | Suzuki | 4 |
| Toyota Canada Inc. | Lexus, Scion, Toyota | 35 |
| Volkswagen Group | Audi, Bentley, Lamborghini, Volkswagen | 19 |
| Volvo Cars of Canada Corp. | Volvo | 4 |
A total of 23 companies submitted a report for the 2011 model year covering a total of 305 distinct test groups. It should be noted that certain test groups were common between companies that shared vehicle platforms or powertrains.
4.2 Company fleet average NOx values
Table 4 summarizes the total number of vehicles and average NOx values for each company’s combined fleet of LDV, LLDT, HLDT and MDPV.
| Company | Total number of vehicles | Average NOx value (grams/mile) |
|---|---|---|
| Aston Martin Lagonda Limited | 83 | 0.070 |
| BMW Group Canada | 44 661 | 0.070000 |
| Chrysler Canada Inc. | 171 440 | 0.0539073 |
| Ferrari North America, Inc. | 164 | 0.0700 |
| Ford Motor Company of Canada, Limited | 246 820 | 0.0581502 |
| General Motors of Canada Limited | 248 938 | 0.0622566 |
| Honda Canada Inc. | 97 573 | 0.069479 |
| Hyundai Auto Canada Corp. | 100 516 | 0.0695722 |
| Jaguar (Jaguar Land Rover Canada ULC) | 1 022 | 0.07000 |
| Kia Canada Inc. | 65 034 | 0.069697 |
| Land Rover (Jaguar Land Rover Canada ULC) | 3 342 | 0.07000 |
| Lotus Cars Limited | 55 | 0.070 |
| Maserati North America, Inc. | 133 | 0.0700 |
| Mazda Canada Inc. | 66 565 | 0.069165 |
| Mercedes-Benz Canada Inc. | 31 619 | 0.068793 |
| Mitsubishi Motor Sales of Canada, Inc. | 21 882 | 0.070000 |
| Nissan Canada Inc. | 75 713 | 0.069870 |
| Porsche Cars Canada, Ltd. | 2 334 | 0.07000 |
| Subaru Canada, Inc. | 22 529 | 0.068035 |
| Suzuki Canada Inc. | 7 601 | 0.06895 |
| Toyota Canada Inc. | 170 470 | 0.0686468 |
| Volkswagen Group | 66 209 | 0.070000 |
| Volvo Cars of Canada Corp. | 6 244 | 0.07000 |
The company average NOx values ranged from 0.0581502 grams/mile to 0.0700000 grams/mile for the fleet of LDV, LLDT, HLDT and MDPV, and no companies reported a fleet average NOx value that was above the standard of 0.07 grams/mile. Eleven out of 23 companies reported a fleet average NOx value that was equal to the fleet average NOx standard.
4.3 NOx Emission credits/deficits for the 2011 model year and end of model year balance
Table 5 summarizes the NOx emission credits/deficits obtained by each company for the 2011 model year. It also lists the balance of credits for each company. Companies were assigned “0” for the “Total 2011 MY Credits” if they did not report credits, had a fleet average NOx value that was equal to the standard, or elected to exclude their group of vehicles from compliance with the fleet average NOx standard.
| Company | Initial balancea | Total 2011 MY creditsa | New balancea |
|---|---|---|---|
| Aston Martin Lagonda Limited | 0 | 0b | 0 |
| BMW Group Canada | 913 | 0c | 913 |
| Chrysler Canada Inc. | 44 997 | 2 759 | 47 756 |
| Ferrari North America, Inc. | 0 | 0d | 0 |
| Ford Motor Company of Canada, Limited | 41 823 | 2 925 | 44 748 |
| General Motors of Canada Limited | 78 401 | 1 928 | 80 329 |
| Honda Canada Inc. | 20 129 | 51 | 20 180 |
| Hyundai Auto Canada Corp. | 3 163 | 43 | 3 206 |
| Jaguar (Jaguar Land Rover Canada ULC) | 126 | 0c | 126 |
| Kia Canada Inc. | 4 721 | 20 | 4 741 |
| Land Rover (Jaguar Land Rover Canada ULC) | 953 | 0c | 953 |
| Lotus Cars Limited | 0 | 0d | 0 |
| Maserati North America, Inc. | 0 | 0d | 0 |
| Mazda Canada Inc. | 15 034 | 56 | 15 090 |
| Mercedes-Benz Canada Inc. | 40 | 38 | 78 |
| Mitsubishi Motor Sales of Canada, Inc. | 76 | 0e | 76 |
| Nissan Canada Inc. | 18 854 | 10e | 18 864 |
| Porsche Cars Canada, Ltd. | 456 | 0c | 456 |
| Subaru Canada, Inc. | 2 665 | 44 | 2 709 |
| Suzuki Canada Inc. | 1 273 | 8 | 1 281 |
| Toyota Canada Inc. | 26 785 | 231 | 27 016 |
| Volkswagen Group | 0 | 0c | 0 |
| Volvo Cars of Canada Corp. | 3 538 | 0c | 3 538 |
| Total | 263 947 | 8 113 | 272 060 |
a NOx emission credits/deficits are rounded to the nearest whole number.
b The company elected not to calculate an average NOx value pursuant to subsection 25(1) of the Regulations, as every vehicle conforms to a NOx standard equal to or less than the applicable fleet average NOx standard for that model year.
c The company reported a fleet average NOx value that is equal to the fleet average NOx standard.
d The company elected to exclude its entire fleet, which is sold concurrently in Canada and the U.S., from compliance with the fleet average NOx standard pursuant to subsection 31(1) of the Regulations.
e The company elected to exclude only parts of its fleet that satisfied the election from compliance with the fleet average NOx standard pursuant to subsection 31(1) of the Regulations. However, the average NOx value for the group of vehicles not subject to the election was equal to the fleet average NOx standard. Therefore, the company did not incur a deficit.
A total of 8113 credits were generated by companies for the 2011 model year. No company incurred a deficit with respect to its 2011 model year fleet, and no company reported a negative balance of credits at the end of the 2011 model year. In addition, there were no transfers of credits to or from companies for the 2011 model year.
4.4 Distribution of bins and total Canada NOx fleet average value
Table 6 summarizes the distribution of vehicles by the NOx standard of each bin. It also provides the calculated fleet average NOx value of the entire Canadian fleet for the 2011 model year.
| Bin number | NOx standard (grams/mile) | Total number of vehicles in "bin" | Percentage of vehicles in "bin" |
|---|---|---|---|
| 8 | 0.20 | 21 819 | 1.50 |
| 7 | 0.15 | 0 | 0.00 |
| 6 | 0.10 | 0 | 0.00 |
| 5 | 0.07 | 1 074 703 | 74.07 |
| 4 | 0.04 | 344 878 | 23.77 |
| 3 | 0.03 | 7 091 | 0.49 |
| 2 | 0.02 | 2 270 | 0.16 |
| 1 | 0.00 | 186 | 0.01 |
For the 2011 model year, almost all vehicles (98.5% of the fleet) were certified to a bin at or below the fleet average NOx standard of 0.07 grams/mile. The average NOx value for the Canadian fleet was 0.06454148 grams/mile, which is 7.8 % below the standard. For the first time, the Canadian fleet contains vehicles that were certified to Bin 1 (0.01% of the fleet).
Figure 1 depicts the changing distribution of the combined Canadian fleet by the NOx standard of each bin across the 2004 to 2011 model years. In addition, Figure 2 presents this information on a percentage basis to facilitate year-to-year comparison.
Figure 1: Distribution of the Canadian fleet by number of vehicles in each bin
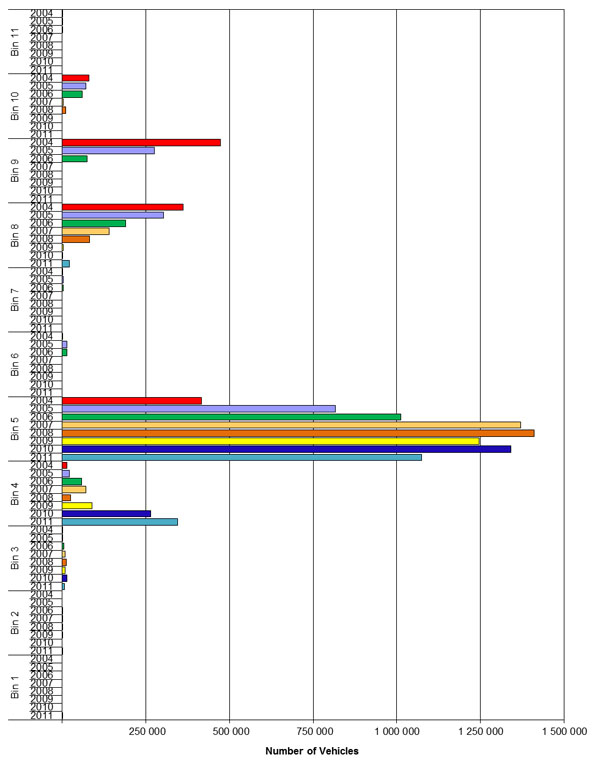
Description of figure 1
Figure 1 is a bar graph depicting the changing distribution of the Canadian fleet in absolute numbers of vehicles in each bin across the 2004 to 2011 model years.
Figure 2: Distribution of the Canadian fleet by the percentage of vehicles relative to the fleet in each bin
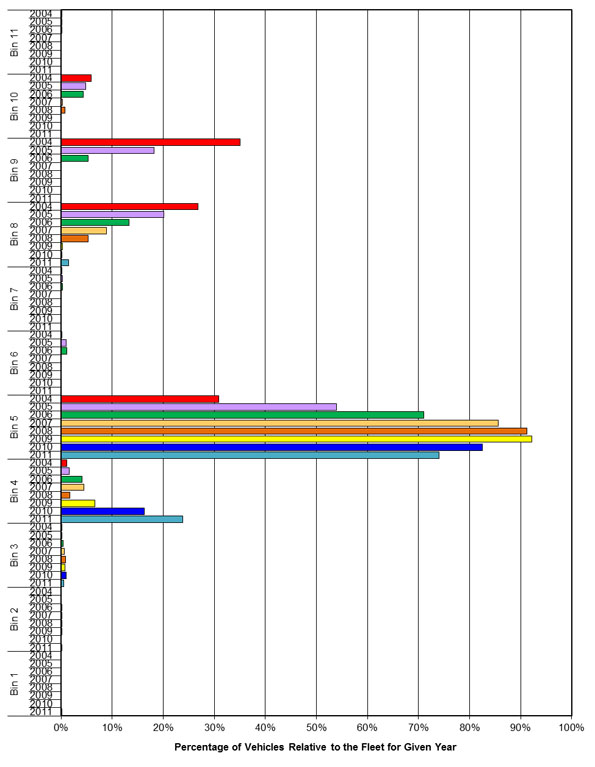
Description of figure 2
Figure 2 is a bar graph depicting the changing distribution of the Canadian fleet on a percentage basis in each bin across the 2004 to 2011 model years.
4.5 Fleet average NOx values trend
Figure 3 presents the average NOx values trend relative to the applicable standards since 2004 for both the LDV/LLDT and HLDT/MDPV fleets. The fleet of LDV, LLDT, HLDT and MDPV is now subject to a single combined fleet average standard of 0.07 grams/mile instead of two different standards. As a result, the fleet average NOx values for the 2009 to 2011 model years are shown as single points.
Figure 3: Fleet average NOx values and standards

Description of figure 3
Figure 3 is a graph presenting the average NOx values trend relative to the standard since 2004 for both the light-duty vehicle/light light-duty truck and heavy light-duty truck/medium-duty passenger vehicle fleets. Overall, the fleet average NOx value for the combined fleet of light-duty vehicles, light light-duty trucks, heavy light-duty trucks and medium-duty passenger vehicles decreased from 2004 to 2011. More specifically, the fleet average NOx value for the 2011 model year is 7.8% below the standard of 0.07 grams/mile.
Overall, the fleet average NOx value for the combined fleet of LDV, LLDT, HLDT and MDPV decreased from 2004 to 2011. More specifically, the fleet average NOx value for the 2011 model year continues to decrease and is 7.8% below the standard of 0.07 grams/mile.
5. Conclusions
This is the eighth year that companies were subject to the fleet average NOx requirements under the Regulations. A total of 23 companies submitted reports for a total of 305 distinct test groups comprising 1 450 947 vehicles that were either manufactured in Canada or imported into Canada for the purpose of first retail sale.
The average NOx value for the Canadian 2011 model year combined fleet of LDV, LLDT, HLDT and MDPV is 0.06454148 grams/mile compared with the standard of 0.07 grams/mile. Each individual company had a fleet average NOx value that was at or below the standard, and all companies complied with the fleet averaging provisions of the Regulations based on their reports.
The average NOx value continued to decrease for the 2011 model year. This result is consistent with the environmental performance objectives of the Regulations.