
Archived: Fleet average NOx emission performance of 2012 model vehicles
Fleet average NOx emission performance of 2012 model year light-duty vehicles, light-duty trucks and medium-duty passenger vehicles
In relation to the On-Road Vehicle and Engine Emission Regulations under the Canadian Environmental Protection Act, 1999
Transportation Division
Environment and Climate Change Canada
May 2016
Disclaimer
This document provides a summary of data collected pursuant to the On-Road Vehicle and Engine Emission Regulations. It does not in any way supersede or modify the requirements of the Canadian Environmental Protection Act, 1999 or the Regulations made under that Act. In the event of an inconsistency between this document and the Act and/or the Regulations, the Act and the Regulations prevail.
Unless otherwise specified, you may not reproduce materials in this publication, in whole or in part, for the purposes of commercial redistribution without prior written permission from Environment and Climate Change Canada's copyright administrator. To obtain permission to reproduce Government of Canada materials for commercial purposes, apply for Crown Copyright Clearance by contacting:
Environment and Climate Change Canada
Public Inquiries Centre
7th Floor, Fontaine Building
200 Sacré-Cœur Boulevard
Gatineau QC K1A 0H3
Telephone: 1-800-668-6767 (in Canada only) or 819-997-2800
Email: ec.enviroinfo.ec@canada.ca
Catalogue Number: En81-10E-PDF
ISSN: 1927-2456
© Her Majesty the Queen in Right of Canada, represented by the Minister of the Environment and Climate Chagne, 2016
Table of contents
List of tables
List of figures
1. Executive summary
Under the On-Road Vehicle and Engine Emission Regulations (hereafter referred to as the “Regulations”), each new light-duty vehicle, light-duty truck and medium-duty passenger vehicle is required to be certified by its manufacturer to one of the bins corresponding to those of the United States Environmental Protection Agency for which there are specific emission standards for oxides of nitrogen (NOx) and other pollutants. Manufacturers and importers of these vehicles are required to report on their fleet average NOxemission performance for each model year.
This ninth annual performance report summarizes the fleet average NOx emission performance of the Canadian 2012 model year fleet of vehicles. A total of 22 companies submitted end of model year reports comprising a total of 1 522 441 vehicles manufactured in Canada or imported into Canada for the purpose of first retail sale. This report includes the fleet average NOx value for each company as well as their number of emission credits or deficits. It also provides a comparison of the distribution of vehicles certified to the various emissions bins and compares the overall NOx performance with that of previous model years.
The average NOx value for the Canadian 2012 model year combined fleet of light-duty vehicles, light light-duty trucks, heavy light-duty trucks and medium-duty passenger vehicles is 0.06215957 grams/mile compared to the standard of 0.07 grams/mile. Of those companies that submitted, each had a fleet average NOx value that was at or below the standard and based on their reports, all complied with the fleet averaging provisions of the Regulations.
The average NOx value continued to decrease for the 2012 model year. This result is consistent with the environmental performance objectives of the Regulations.
2. Purpose
The purpose of this report is to summarize the fleet average NOx emission performance of individual companies and the overall Canadian fleet for the 2012 model year (MY) and is based on data submitted by companies in their end of model year reports and any subsequent revisions; it is also to report on the effectiveness of the Canadian fleet average NOx emission program in achieving the environmental performance objectives.
3. Introduction
On January 1, 2004, the On-Road Vehicle and Engine Emission Regulations came into effect under the Canadian Environmental Protection Act, 1999 (CEPA 1999). These Regulations introduced more stringent national emission standards for on-road vehicles and engines. The Regulations align Canada’s emission standards for light-duty vehiclesFootnote1 (LDVs), light light-duty trucksFootnote2 (LLDTs), heavy light-duty trucksFootnote3 (HLDTs), medium-duty passenger vehiclesFootnote4 (MDPVs), heavy-duty vehicles, heavy-duty engines and on-road motorcycles with those of the U.S. Environmental Protection Agency (EPA) through incorporation by reference to the U.S. Code of Federal Regulations (CFR).
Each new LDV, LLDT, HLDT and MDPV is required to be certified to a bin for which there are specific emission standards for NOx and other pollutants. A company’s choice of bin to which individual vehicle models are certified in a given model year is limited by the obligation to comply with the fleet average NOx standards associated with that model year. The current NOx standard is 0.07 grams/mile, which was introduced in the 2009 model year.
A company’s fleet average NOx value is the weighted average based on the number of vehicles certified to each bin. Though the emission bins, fleet average NOx standards, and methods of calculating fleet average NOx values are aligned with those of the U.S. EPA, there are differences in the structure of the NOx averaging program in Canada, which is designed to recognize vehicles that are sold concurrently in Canada and the U.S. The regulatory requirements are structured to deliver fleet average emissions comparable to those of the U.S. while minimizing the regulatory burden on companies and enabling the marketing of vehicles in Canada independently from the U.S.
The Regulations require that all companies submit a report to the Minister of the Environment no later than May 1 after the end of each model year. The end of model year report must contain detailed information concerning the company’s fleet(s) and/or groups of vehicles.
For more information regarding the calculation of fleet average NOx values and NOx emission credits or deficits, please refer to the Regulations, which can be found on the Environment and Climate Change Canada CEPA Environmental Registry. Reports for the 2004 to the 2011 model years can also be found on the CEPA Environmental Registry.
4. Company fleet average NOx emission performance for the 2012 model year
4.1 Scope of company reports
Table 1 presents a list of the companies that submitted an end of model year report for the 2012 model year in accordance with the requirements of the Regulations, including the vehicle makes and a summary of the data received.
| Company | Makes | Number of test groupsa | Total number of vehicles | Average NOx value (grams/mile)b | Initial credit balancec | 2012 Balance |
|---|---|---|---|---|---|---|
| Aston Martin Lagonda Limited | Aston Martin | 2
|
110
|
0.0700
|
0
|
0
|
| BMW Group Canada | BMW, Mini, Rolls-Royce | 21
|
32 059
|
0.070000
|
913
|
913
|
| Chrysler Canada Inc. | Chrysler, Dodge, Jeep | 22
|
230 683
|
0.0561753
|
47 756
|
50 945
|
| Ford Motor Company of Canada, Limited | Ford, Lincoln | 33
|
205 987
|
0.0531194
|
44 748
|
48 225
|
| General Motors of Canada Limited | Buick, Cadillac, Chevrolet, GMC | 27
|
201 349
|
0.0490740
|
82 007
|
86 220
|
| Honda Canada Inc. | Acura, Honda | 17
|
171 975
|
0.0698509
|
20 180
|
20 206
|
| Hyundai Auto Canada Corp. | Hyundai | 17
|
116 849
|
0.0694792
|
3 206
|
3 267
|
| Jaguar (Jaguar Land Rover Canada ULC) | Jaguar | 1
|
716
|
0.0700
|
126
|
126
|
| Kia Canada Inc. | Kia | 16
|
64 991
|
0.068686
|
4 741
|
4 826
|
| Land Rover (Jaguar Land Rover Canada ULC) | Land Rover | 3
|
3 904
|
0.07000
|
953
|
953
|
| Lotus Cars Limited | Lotus | 1
|
19
|
0.070
|
0
|
0
|
| Maserati North America, Inc. | Maserati | 1
|
152
|
0.0700
|
0
|
0
|
| Mazda Canada Inc. | Mazda | 12
|
67 967
|
0.070000
|
15 090
|
15 090
|
| Mercedes-Benz Canada Inc. | Maybach, Mercedes, Smart | 18
|
30 671
|
0.069996
|
78
|
78
|
| Mitsubishi Motor Sales of Canada, Inc. | Mitsubishi | 8
|
18 024
|
0.068524
|
76
|
103
|
| Nissan Canada Inc. | Infiniti, Nissan | 25
|
94 649
|
0.069605
|
18 864
|
18 901
|
| Porsche Cars Canada, Ltd. | Porsche | 13
|
2 344
|
See noted | See noted | See noted |
| Subaru Canada, Inc. | Subaru | 4
|
20 364
|
0.067967
|
2 709
|
2 750
|
| Suzuki Canada Inc. | Suzuki | 4
|
4 155
|
0.07000
|
1 281
|
1 281
|
| Toyota Canada Inc. | Lexus, Scion, Toyota | 40
|
169 934
|
0.0655033
|
27 016
|
27 780
|
| Volkswagen Group | Audi, Bentley, Lamborghini, Volkswagen | 24
|
78 049
|
See noted | See noted | See noted |
| Volvo Cars of Canada Corp. | Volvo | 3
|
7 490
|
0.07000
|
3 538
|
3 538
|
a A test group is the basic classification unit that comprises LDV, LLDT, HLDT or MDPV having similar exhaust emission performances and that share all of the features described in section 1827, subchapter C, part 86 of the CFR.
b Fleet average NOx values are rounded to the same number of significant figures that are contained in the total number of vehicles in a company’s fleet.
c NOx emission credits/deficits are rounded to the nearest whole number. A negative sign (-) indicates a deficit.
d The average NOx value and credit balance for Porsche Cars Canada, Ltd. and Volkswagen Group are not included in this table due to an ongoing investigation regarding certain of their diesel vehicles. However, no adjustments were made to the total number of vehicles, the number of test groups, the distribution of vehicles by the NOx standard of each bin and the average NOx value for the Canadian fleet (Table 2).
A total of 22 companies submitted a report for the 2012 model year covering a total of 312 distinct test groups. It should be noted that certain test groups were common between companies that shared vehicle platforms or powertrains.
The company average NOx values ranged from 0.0490740 grams/mile to 0.0700000 grams/mile for the fleet of LDVs, LLDTs, HLDTs, and MDPVs, and no companies reported a fleet average NOx value that was above the standard of 0.07 grams/mile.
A total of 11 920 credits were generated by companies for the 2012 model year. No company incurred a deficit with respect to their fleet, and no company reported a deficit at the end of this model year. In addition, there were no credit transfers to or from companies for the 2012 model year.
4.2 Distribution of bins and total Canada NOx fleet average value
Table 2 summarizes the distribution of vehicles by the NOx standard of each bin. It also provides the calculated fleet average NOx value of the entire Canadian fleet for the 2012 model year.
| Bin number | NOx standard (grams/mile) | Total number of vehicles in "bin" | Percentage of vehicles in "bin" |
|---|---|---|---|
8
|
0.20
|
33 476
|
2.20
|
7
|
0.15
|
0
|
0.00
|
6
|
0.10
|
0
|
0.00
|
5
|
0.07
|
1 012 327
|
66.49
|
4
|
0.04
|
452 426
|
29.72
|
3
|
0.03
|
20 178
|
1.32
|
2
|
0.02
|
3 018
|
0.20
|
1
|
0.00
|
1 016
|
0.07
|
Note: Beginning in the 2009 model year, applicable standards are limited to bins 1 to 8 for all categories.
For the 2012 model year, almost all vehicles (97.8 % of the fleet) were certified to a bin at or below the fleet average NOx standard of 0.07 grams/mile. The average NOx value for the Canadian fleet was 0.06215957 grams/mile.
4.3 Fleet average NOx values trend
Figure 1 presents the average NOx values trend relative to the applicable standards since 2004 for both the LDV/LLDT and HLDT/MDPV fleets. Beginning in 2009, LDVs, LLDTs, HLDTs, and MDPVs all conform to one NOx fleet average standard.
Figure 1: Fleet average NOx values and standards
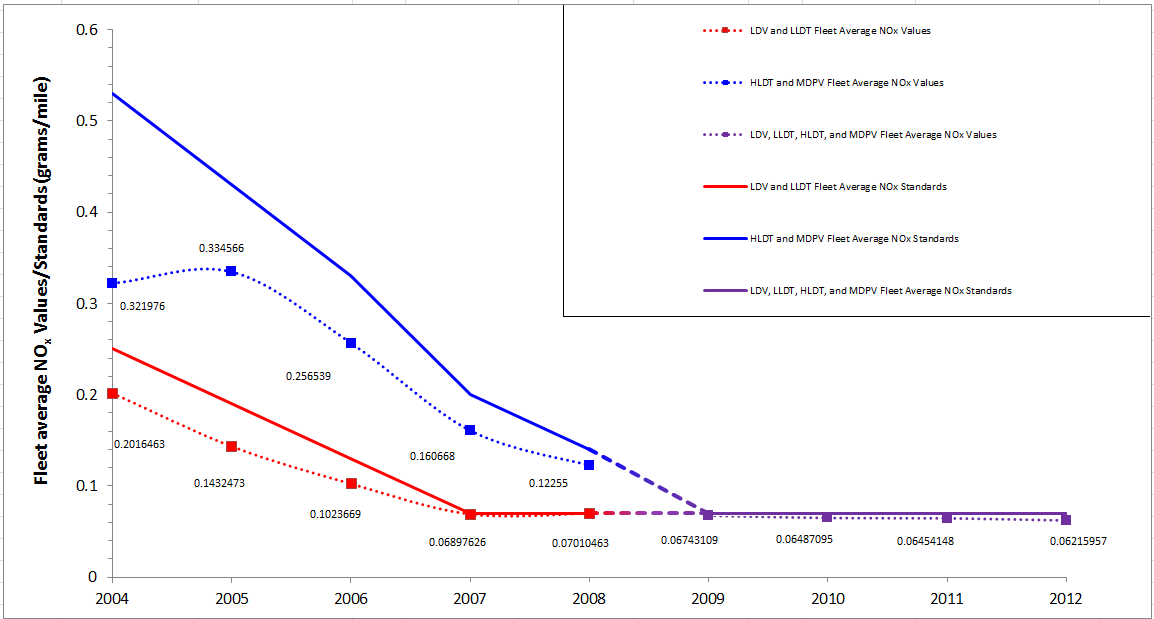
Description of figure 1
| Year | LDV and LLDT Fleet Average NOx Standards |
LDV and LLDT Fleet Average NOx Values |
HLDT and MDPV Fleet Average NOx Standards |
HLDT and MDPV Fleet Average NOx Values |
LDV, LLDT, HLDT, and MDPV Fleet Average NOx Standards |
LDV, LLDT, HLDT, and MDPV Fleet Average NOx Values |
|---|---|---|---|---|---|---|
| 2004 |
0.25
|
0.2016463
|
0.53
|
0.321976
|
||
| 2005 |
0.19
|
0.1432473
|
0.43
|
0.334566
|
||
| 2006 |
0.13
|
0.1023669
|
0.33
|
0.256539
|
||
| 2007 |
0.07
|
0.06897626
|
0.2
|
0.160668
|
||
| 2008 |
0.07
|
0.07010463
|
0.14
|
0.12255
|
||
| 2009 |
0.07
|
0.06743109
|
||||
| 2010 |
0.07
|
0.06487095
|
||||
| 2011 |
0.07
|
0.06454148
|
||||
| 2012 |
0.07
|
0.07
|
0.06215957
|
Overall, the fleet average NOx value for the combined fleet of LDVs, LLDTs, HLDTs, and MDPVs decreased from 2004 to 2012. More specifically, the fleet average NOx value for the 2012 model year continues to decrease and is 11.2% below the standard of 0.07 grams/mile.
5. Conclusions
This is the ninth year that companies were subject to the fleet average NOx requirements under the Regulations. A total of 22 companies submitted reports for a total of 312 distinct test groups comprising 1 522 441 vehicles that were either manufactured in Canada or imported into Canada for the purpose of first retail sale.
The average NOx value for the Canadian 2012 model year combined fleet of LDVs, LLDTs, HLDTs and MDPVs is 0.06215957 grams/mile compared to the standard of 0.07 grams/mile. Each individual company had a fleet average NOx value that was at or below the standard, and all companies complied with the fleet averaging provisions of the Regulations based on their reports.
The average NOx value continued to decrease for the 2012 model year. This result is consistent with the environmental performance objectives of the Regulations.