
Archived: Air Pollutant Emission Inventory report: chapter 2.12
2.12 Hexachlorobenzene (HCB)
In 2016, approximately 8.5 kg of hexachlorobenzene (HCB) were emitted in Canada (Table 2–14). Incineration and waste sources were the largest contributor in 2016 with 63% (5.3 kg) of total emissions, due almost entirely to emissions from waste incineration with 58% (4.9 kg) of HCB emissions. The ore and mineral industries were the second-largest contributor, with 27% (2.31 kg) of total emissions, largely due to iron and steel industries, which represented 12% (1.0 kg) of the national total.
Overall, a 63% (53 kg) decrease in HCB emissions occurred between 1990 and 2016 (Figure 2–12). Most of this decrease is due to a drop in emissions from waste incineration since 1997. This important reduction in emissions is a result of a steady decline in the use of conical burners for municipal waste incineration in Newfoundland and Labrador. Emission reductions were also seen in coal-fired electric power generation from 2000 to 2012 as a result of the phasing out of coal electricity generation in Ontario. HCB emissions from waste incineration decreased from 1990 to 2002 and since 2002 have remained relatively constant.
The most significant changes in HCB emissions from 1990 to 2016 include:
- incineration and waste emissions: decrease of over 93% (67 kg)
- waste incineration: decrease of over 93% (68 kg)
- electric power generation (utilities) source emissions: decrease of 96% (10 kg)
- coal (electricity power generation): decrease of 96% (9.9 kg)
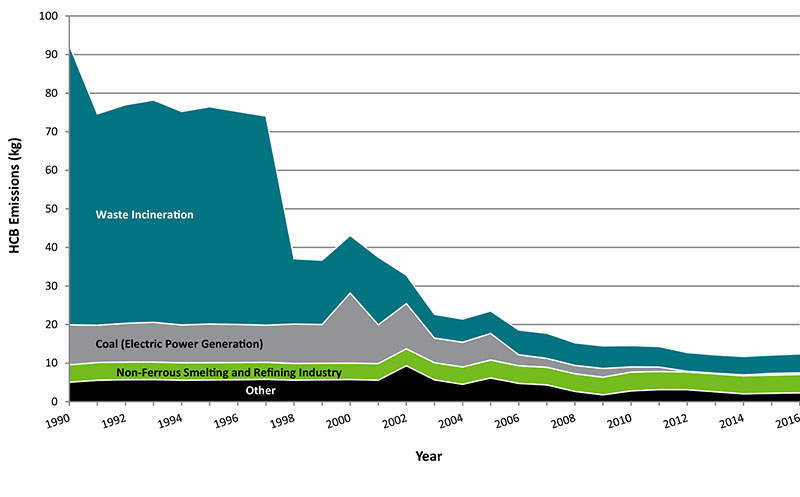
Long description for figure 2-12
Figure 2-12 displays the four major sections that contribute to national hexachlorobenzene trends. The following table displays the contributions (kg) for the years 1990 to 2016.
| Sector | 1990 | 1991 | 1992 | 1993 | 1994 | 1995 | 1996 | 1997 | 1998 | 1999 | 2000 | 2001 | 2002 | 2003 | 2004 | 2005 | 2006 | 2007 | 2008 | 2009 | 2010 | 2011 | 2012 | 2013 | 2014 | 2015 | 2016 |
|---|---|---|---|---|---|---|---|---|---|---|---|---|---|---|---|---|---|---|---|---|---|---|---|---|---|---|---|
| Sector 1 - Waste Incineration | 72.52689 | 54.77695 | 56.65038 | 57.61447 | 55.34363 | 56.32811 | 55.20577 | 54.21451 | 16.92175 | 16.68419 | 14.93206 | 17.53145 | 7.3694 | 6.16068 | 5.99809 | 5.83112 | 6.436466 | 6.515861 | 5.856131 | 5.861436 | 5.522105 | 5.33034 | 4.842536 | 4.752349 | 4.771747 | 4.771478 | 4.899889 |
| Sector 2 - Coal (Electric Power Generation) | 10.36317 | 9.678511 | 10.06025 | 10.30123 | 9.813409 | 10.02049 | 9.868982 | 9.637175 | 10.20689252 | 10.04736 | 18.18230108 | 10.05429 | 11.72082 | 6.386372 | 6.417871 | 6.879098 | 2.839748 | 2.304211 | 2.168578 | 2.258658 | 1.344802 | 1.138583 | 0.196249 | 0.186056 | 0.236094 | 0.431717 | 0.429661 |
| Sector 3 - Non-Ferrous Smelting and Refining Industry | 4.50919 | 4.60675 | 4.56079 | 4.54566 | 4.52041 | 4.48499 | 4.459404 | 4.42091 | 4.33933 | 4.28661 | 4.24146 | 4.31047 | 4.37946 | 4.44846 | 4.4912 | 4.64712 | 4.571537 | 4.571537 | 4.571537 | 4.571537 | 4.875133 | 4.70718 | 4.587213 | 4.629502 | 4.675224 | 4.708847 | 4.764678 |
| Sector 4 - Other | 5.059386 | 5.554392 | 5.710039 | 5.736716 | 5.568754 | 5.64026 | 5.700898 | 5.788823 | 5.587752229 | 5.674559 | 5.754084396 | 5.579495 | 9.338179 | 5.66805 | 4.51672 | 6.159791 | 4.752658 | 4.360458 | 2.672556 | 1.786935 | 2.804923 | 3.128831 | 3.110814 | 2.580904 | 2.044609 | 2.18939 | 2.308296 |
| Source | Sector | 1990 | 2000 | 2005 | 2011 | 2012 | 2013 | 2014 | 2015 | 2016 |
|---|---|---|---|---|---|---|---|---|---|---|
| Ore and Mineral Industries | nil | 5 500 | 5 700 | 8 100 | 3 000 | 2 500 | 2 300 | 1 900 | 2 100 | 2 300 |
| Ore and Mineral Industries | Aluminium Industry | no emissions (-) | - | - | 48 | - | - | - | - | - |
| Ore and Mineral Industries | Asphalt Paving Industry | - | - | - | - | - | - | - | - | - |
| Ore and Mineral Industries | Cement and Concrete Industry | 1 600 | 2 100 | 880 | 560 | 420 | 420 | 280 | 290 | 410 |
| Ore and Mineral Industries | Foundries | - | - | - | 0.010 | 0.010 | - | 29 | 23 | 24 |
| Ore and Mineral Industries | Iron and Steel Industries | 1 100 | 920 | 1 500 | 1 500 | 1 400 | 1 100 | 1 100 | 1 100 | 1 000 |
| Ore and Mineral Industries | Iron Ore Industry | - | - | - | - | - | - | - | - | - |
| Ore and Mineral Industries | Mineral Products Industry | - | - | - | - | - | - | - | - | - |
| Ore and Mineral Industries | Mining and Rock Quarrying | 13 | 13 | 32 | 14 | 18 | 13 | 12 | 17 | 12 |
| Ore and Mineral Industries | Non-Ferrous Mining and Smelting Industry | 2 700 | 2 600 | 5 600 | 940 | 660 | 730 | 530 | 700 | 830 |
| Oil and Gas Industry | nil | 1.3 | 1.6 | - | - | - | - | - | - | - |
| Oil and Gas Industry | Downstream Oil and Gas Industry | - | - | - | - | - | - | - | - | - |
| Oil and Gas Industry | Upstream Oil and Gas Industry | 1.3 | 1.6 | - | - | - | - | - | - | - |
| Electric Power Generation (Utilities) | nil | 11 000 | 19 000 | 7 000 | 1 300 | 370 | 390 | 430 | 600 | 570 |
| Electric Power Generation (Utilities) | Coal | 10 000 | 18 000 | 6 900 | 1 100 | 200 | 190 | 240 | 430 | 430 |
| Electric Power Generation (Utilities) | Diesel | - | - | - | - | - | - | - | - | - |
| Electric Power Generation (Utilities) | Natural Gas | 640 | 1 100 | 170 | 140 | 140 | 140 | 140 | 150 | 120 |
| Electric Power Generation (Utilities) | Waste Materials | 4.8 | 1.3 | - | 50 | 40 | 40 | 30 | 4.9 | 2.3 |
| Electric Power Generation (Utilities) | Other Electric Power Generation | - | - | - | - | - | 25 | 23 | 16 | 17 |
| Manufacturing | nil | 1 600 | 1 500 | 1 500 | 240 | 460 | 330 | 360 | 350 | 280 |
| Manufacturing | Abrasives Manufacture | - | - | - | - | - | - | - | - | - |
| Manufacturing | Bakeries | - | - | - | - | - | - | - | - | - |
| Manufacturing | Biofuel Production | - | - | - | - | - | - | - | - | - |
| Manufacturing | Chemicals Industry | 680 | 330 | 480 | - | - | - | - | - | - |
| Manufacturing | Electronics | - | - | - | - | - | - | - | - | - |
| Manufacturing | Food Preparation | - | - | 3.0 | - | - | - | - | - | - |
| Manufacturing | Glass Manufacture | - | - | - | - | - | - | - | - | - |
| Manufacturing | Grain Industries | - | - | - | - | - | - | - | - | - |
| Manufacturing | Metal Fabrication | 460 | 480 | 52 | 110 | 350 | 230 | 290 | 210 | 190 |
| Manufacturing | Plastics Manufacture | - | - | - | - | - | - | - | - | - |
| Manufacturing | Pulp and Paper Industry | 140 | 180 | 310 | 120 | 120 | 94 | 73 | 140 | 88 |
| Manufacturing | Textiles | - | - | - | - | - | - | - | - | - |
| Manufacturing | Vehicle Manufacture (Engines, Parts, Assembly, Painting) | 9.5 | 110 | - | - | - | - | - | - | - |
| Manufacturing | Wood Products | 340 | 390 | 620 | 3.4 | 0.091 | 1.9 | 0.26 | 0.11 | 0.11 |
| Manufacturing | Other Manufacturing Industries | - | - | - | - | - | - | - | - | - |
| Transportation and Mobile Equipment | nil | - | - | - | - | - | - | - | - | - |
| Transportation and Mobile Equipment | Air Transportation | - | - | - | - | - | - | - | - | - |
| Transportation and Mobile Equipment | Heavy-duty Diesel Vehicles | - | - | - | - | - | - | - | - | - |
| Transportation and Mobile Equipment | Heavy-duty Gasoline Vehicles | - | - | - | - | - | - | - | - | - |
| Transportation and Mobile Equipment | Heavy-duty LPG/NG Vehicles | - | - | - | - | - | - | - | - | - |
| Transportation and Mobile Equipment | Light-duty Diesel Trucks | - | - | - | - | - | - | - | - | - |
| Transportation and Mobile Equipment | Light-duty Diesel Vehicles | - | - | - | - | - | - | - | - | - |
| Transportation and Mobile Equipment | Light-duty Gasoline Trucks | - | - | - | - | - | - | - | - | - |
| Transportation and Mobile Equipment | Light-duty Gasoline Vehicles | - | - | - | - | - | - | - | - | - |
| Transportation and Mobile Equipment | Light-duty LPG/NG Trucks | - | - | - | - | - | - | - | - | - |
| Transportation and Mobile Equipment | Light-duty LPG/NG Vehicles | - | - | - | - | - | - | - | - | - |
| Transportation and Mobile Equipment | Marine Transportation | - | - | - | - | - | - | - | - | - |
| Transportation and Mobile Equipment | Motorcycles | - | - | - | - | - | - | - | - | - |
| Transportation and Mobile Equipment | Off-road Diesel Vehicles and Equipment | - | - | - | - | - | - | - | - | - |
| Transportation and Mobile Equipment | Off-road Gasoline/LPG/CNG Vehicles and Equipment | - | - | - | - | - | - | - | - | - |
| Transportation and Mobile Equipment | Rail Transportation | - | - | - | - | - | - | - | - | - |
| Transportation and Mobile Equipment | Tire Wear and Brake Lining | - | - | - | - | - | - | - | - | - |
| Agriculture | nil | - | - | - | - | - | - | - | - | - |
| Agriculture | Animal Production | - | - | - | - | - | - | - | - | - |
| Agriculture | Crop Production | - | - | - | - | - | - | - | - | - |
| Agriculture | Fuel Use | - | - | - | - | - | - | - | - | - |
| Commercial / Residential / Institutional | nil | 1.6 | 1.4 | 1.3 | 0.89 | 1.9 | 1.8 | 1.8 | 0.83 | 0.72 |
| Commercial / Residential / Institutional | Cigarette Smoking | - | - | - | - | - | - | - | - | - |
| Commercial / Residential / Institutional | Commercial and Institutional Fuel Combustion | 0.11 | 0.038 | - | 0.0096 | 1.2 | 1.2 | 1.2 | 0.52 | 0.51 |
| Commercial / Residential / Institutional | Commercial Cooking | - | - | - | - | - | - | - | - | - |
| Commercial / Residential / Institutional | Construction Fuel Combustion | - | - | - | - | - | - | - | - | - |
| Commercial / Residential / Institutional | Home Firewood Burning | - | - | - | - | - | - | - | - | - |
| Commercial / Residential / Institutional | Human | - | - | - | - | - | - | - | - | - |
| Commercial / Residential / Institutional | Marine Cargo Handling | - | - | - | - | - | - | - | - | - |
| Commercial / Residential / Institutional | Residential Fuel Combustion | 1.5 | 1.4 | 1.3 | 0.88 | 0.73 | 0.68 | 0.58 | 0.31 | 0.20 |
| Commercial / Residential / Institutional | Service Stations | - | - | - | - | - | - | - | - | - |
| Commercial / Residential / Institutional | Other Miscellaneous Sources | - | - | - | - | - | - | - | - | - |
| Incineration and Waste | nil | 73 000 | 15 000 | 7 900 | 5 900 | 5 500 | 5 200 | 4 900 | 5 000 | 5 300 |
| Incineration and Waste | Crematoriums | 10 | 14 | 18 | 23 | 24 | 25 | 26 | 28 | 27 |
| Incineration and Waste | Waste Incineration | 73 000 | 15 000 | 5 800 | 5 300 | 4 800 | 4 800 | 4 800 | 4 800 | 4 900 |
| Incineration and Waste | Waste Treatment and Disposal | 0.49 | 0.051 | 2 100 | 560 | 590 | 460 | 61 | 210 | 390 |
| Paints and Solvents | nil | - | - | - | - | - | - | - | - | - |
| Paints and Solvents | Dry Cleaning | - | - | - | - | - | - | - | - | - |
| Paints and Solvents | General Solvent Use | - | - | - | - | - | - | - | - | - |
| Paints and Solvents | Printing | - | - | - | - | - | - | - | - | - |
| Paints and Solvents | Surface Coatings | - | - | - | - | - | - | - | - | - |
| Dust | nil | - | - | - | - | - | - | - | - | - |
| Dust | Coal Transportation | - | - | - | - | - | - | - | - | - |
| Dust | Construction Operations | - | - | - | - | - | - | - | - | - |
| Dust | Mine Tailings | - | - | - | - | - | - | - | - | - |
| Dust | Paved Roads | - | - | - | - | - | - | - | - | - |
| Dust | Unpaved Roads | - | - | - | - | - | - | - | - | - |
| Fires | nil | - | - | - | - | - | - | - | - | - |
| Fires | Prescribed Forest Burning | - | - | - | - | - | - | - | - | - |
| Fires | Structural Fires | - | - | - | - | - | - | - | - | - |
| Grand Total | nil | 91 000 | 41 000 | 25 000 | 10 000 | 8 800 | 8 300 | 7 600 | 8 100 | 8 500 |
Notes:
totals may not add up due to rounding
- denotes no emissions