
Archived: Air Pollutant Emission Inventory report: chapter 2.3
2.3 Nitrogen Oxides (NOx)
Approximately 1.8 Mt of NOx were released in Canada in 2016 (Table 2–5). Transportation and mobile equipment was the largest contributor, accounting for 52% (0.9 Mt) of total NOx emissions. Within this source category, heavy-duty diesel vehicles, marine transportation, and off-road diesel vehicles and equipment were the largest emitters, collectively contributing 31% (570 kt) of total NOx emissions. The oil and gas industry accounted for 26% (480 kt) of NOx emissions in 2016, including the upstream oil and gas industry, which accounted for 26% (463 kt) of the national total. Electric power generation (utilities) contributed 8% (152 kt) of NOx emissions, including coal-fired generation, which contributed 6% (117 kt) of national emissions. The remaining 14% of NOx emissions were distributed across multiple sources.
From 1990 to 2016, national NOx emissions decreased by 25% (593 kt) (Figure 2–3). A significant driver of this trend was the consistent reduction in emissions from light-duty gasoline trucks and vehicles across the entire time series, as a result of increasingly stringent vehicle regulations. Emissions from off-road diesel vehicles & equipment and heavy-duty diesel vehicles increased at the beginning of the time series and decreased after 2000 and 2005, respectively. Within electric power generation (utilities), the coal sector contributed to the decreasing trend across the time series, with a gradual decrease in emissions from 1998 to 2016. Finally, the upstream oil and gas industry and marine transportation are the only major contributors to NOx emissions that experienced an increase in emissions across the time series. This increase is attributed to expansion and growth in the oil and gas industry and in marine transportation, respectively.
The most significant changes in NOx emissions from 1990 to 2016 include:
- transportation and mobile equipment emissions: decrease of 33% (462 kt)
- off-road diesel vehicles and equipment: decrease of 62% (208 kt)
- light-duty gasoline trucks and vehicles: decrease of 59% (167 kt)
- marine transportation: increase of 49% (68 kt)
- heavy-duty diesel vehicles: decrease of 19% (56 kt)
- electric power generation (utilities) emissions: decrease of 41% (105 kt)
- coal: decrease of 43% (89 kt)
- oil and gas industry emissions: increase of 39% (134 kt)
- upstream oil and gas industry: increase of 49% (152 kt)
- downstream oil and gas industry: decrease of 49% (17 kt)
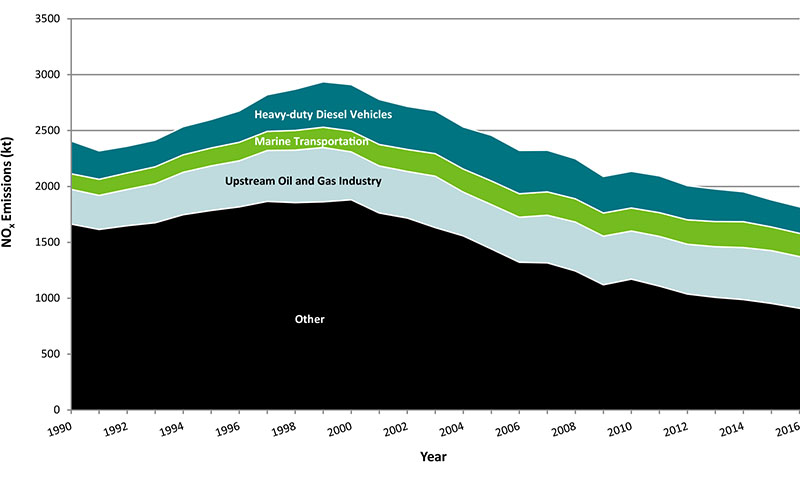
Long description for figure 2-3
Figure 2-3 displays the four major sections that contribute to national NOx trends. The following table displays the contributions (kt) for the years 1990 to 2016.
| Sector | 1990 | 1991 | 1992 | 1993 | 1994 | 1995 | 1996 | 1997 | 1998 | 1999 | 2000 | 2001 | 2002 | 2003 | 2004 | 2005 | 2006 | 2007 | 2008 | 2009 | 2010 | 2011 | 2012 | 2013 | 2014 | 2015 | 2016 |
|---|---|---|---|---|---|---|---|---|---|---|---|---|---|---|---|---|---|---|---|---|---|---|---|---|---|---|---|
| Sector 1 - Heavy-duty Diesel Vehicles | 292.6766 | 253.8839 | 238.6777 | 238.1399 | 251.4539 | 254.1887 | 280.2711 | 327.0515 | 368.5407 | 405.98 | 414.444 | 402.7386 | 384.9985 | 383.009 | 376.1603 | 408.0014 | 387.1986 | 371.8889 | 358.1238 | 326.3842 | 327.8319 | 328.6325 | 305.4038 | 290.6676 | 267.4054 | 242.1712 | 236.3672 |
| Sector 2 - Marine Transportation | 139.7383 | 143.8244 | 147.9104 | 151.9964 | 156.0825 | 160.1685 | 165.4755 | 170.7825 | 176.0895 | 181.3965 | 186.7035 | 191.6478 | 196.5922 | 201.5365 | 206.4809 | 211.4252 | 210.0706 | 208.9959 | 207.9212 | 206.8464 | 205.9305 | 212.2399 | 218.5494 | 224.8589 | 231.1684 | 211.5238 | 207.5453 |
| Sector 3 - Upstream Oil and Gas Industry | 310.9402 | 305.6792 | 324.897 | 349.157 | 380.196 | 399.4699 | 413.0436 | 456.3162 | 470.3303 | 486.5809 | 429.275 | 421.8241 | 417.3838 | 460.5713 | 392.019 | 397.5822 | 403.3432 | 426.6168 | 438.0675 | 435.5202 | 431.1402 | 445.6254 | 445.9528 | 453.657 | 466.0422 | 473.1981 | 462.617 |
| Sector 4 - Other | 1663.172 | 1614.786 | 1648.57 | 1674.799 | 1746.796 | 1784.832 | 1816.61 | 1865.729 | 1854.735 | 1862.017 | 1880.273 | 1761.936 | 1717.008 | 1631.626 | 1557.405 | 1440.713 | 1321.569 | 1316.12 | 1243.747 | 1120.221 | 1170.464 | 1108.088 | 1037.302 | 1007.65 | 987.644 | 953.1624 | 907.1948 |
| Source | Sector | 1990 | 2000 | 2005 | 2011 | 2012 | 2013 | 2014 | 2015 | 2016 |
|---|---|---|---|---|---|---|---|---|---|---|
| Ore and Mineral Industries | nil | 110 000 | 99 000 | 110 000 | 86 000 | 89 000 | 83 000 | 82 000 | 82 000 | 78 000 |
| Ore and Mineral Industries | Aluminium Industry | 1 600 | 1 400 | 2 000 | 1 100 | 1 400 | 1 300 | 1 200 | 1 100 | 1 200 |
| Ore and Mineral Industries | Asphalt Paving Industry | 1 200 | 1 100 | 1 200 | 1 300 | 1 100 | 1 000 | 1 200 | 1 200 | 1 200 |
| Ore and Mineral Industries | Cement and Concrete Industry | 43 000 | 45 000 | 55 000 | 32 000 | 36 000 | 32 000 | 31 000 | 35 000 | 32 000 |
| Ore and Mineral Industries | Foundries | 490 | 640 | 530 | 140 | 140 | 140 | 140 | 140 | 140 |
| Ore and Mineral Industries | Iron and Steel Industries | 19 000 | 16 000 | 13 000 | 11 000 | 12 000 | 11 000 | 12 000 | 11 000 | 11 000 |
| Ore and Mineral Industries | Iron Ore Industry | 10 000 | 10 000 | 9 800 | 13 000 | 13 000 | 13 000 | 12 000 | 12 000 | 11 000 |
| Ore and Mineral Industries | Mineral Products Industry | 1 300 | 560 | 770 | 130 | 190 | 250 | 270 | 240 | 240 |
| Ore and Mineral Industries | Mining and Rock Quarrying | 25 000 | 21 000 | 23 000 | 25 000 | 24 000 | 22 000 | 23 000 | 20 000 | 19 000 |
| Ore and Mineral Industries | Non-Ferrous Mining and Smelting Industry | 4 300 | 3 800 | 2 000 | 1 600 | 1 500 | 1 600 | 1 600 | 1 600 | 2 000 |
| Oil and Gas Industry | nil | 350 000 | 460 000 | 430 000 | 460 000 | 470 000 | 470 000 | 480 000 | 490 000 | 480 000 |
| Oil and Gas Industry | Downstream Oil and Gas Industry | 35 000 | 30 000 | 31 000 | 19 000 | 19 000 | 18 000 | 18 000 | 18 000 | 18 000 |
| Oil and Gas Industry | Upstream Oil and Gas Industry | 310 000 | 430 000 | 400 000 | 450 000 | 450 000 | 450 000 | 470 000 | 470 000 | 460 000 |
| Electric Power Generation (Utilities) | nil | 260 000 | 330 000 | 250 000 | 200 000 | 170 000 | 160 000 | 170 000 | 150 000 | 150 000 |
| Electric Power Generation (Utilities) | Coal | 210 000 | 230 000 | 190 000 | 130 000 | 130 000 | 120 000 | 130 000 | 110 000 | 120 000 |
| Electric Power Generation (Utilities) | Diesel | 3 000 | 8 200 | 7 600 | 8 000 | 7 800 | 8 000 | 8 600 | 9 100 | 8 400 |
| Electric Power Generation (Utilities) | Natural Gas | 20 000 | 65 000 | 36 000 | 49 000 | 22 000 | 21 000 | 18 000 | 16 000 | 16 000 |
| Electric Power Generation (Utilities) | Waste Materials | 45 | 520 | 220 | 320 | 300 | 190 | 170 | 210 | 360 |
| Electric Power Generation (Utilities) | Other Electric Power Generation | 28 000 | 28 000 | 21 000 | 11 000 | 11 000 | 8 600 | 11 000 | 11 000 | 11 000 |
| Manufacturing | nil | 190 000 | 180 000 | 130 000 | 70 000 | 68 000 | 69 000 | 68 000 | 69 000 | 71 000 |
| Manufacturing | Abrasives Manufacture | 240 | 90 | 74 | no emissions (-) | - | - | - | - | - |
| Manufacturing | Bakeries | 4.1 | 4.0 | - | 1.0 | 0.86 | 1.1 | 1.0 | 0.89 | 0.89 |
| Manufacturing | Biofuel Production | - | - | - | 19 | 18 | 18 | 17 | 18 | 16 |
| Manufacturing | Chemicals Industry | 41 000 | 47 000 | 36 000 | 23 000 | 24 000 | 22 000 | 21 000 | 23 000 | 22 000 |
| Manufacturing | Electronics | 150 | 160 | 71 | - | - | - | - | - | - |
| Manufacturing | Food Preparation | 2 400 | 2 900 | 3 100 | 2 000 | 1 600 | 1 700 | 1 700 | 1 600 | 1 600 |
| Manufacturing | Glass Manufacture | 7 000 | 7 400 | 6 100 | 940 | 900 | 920 | 890 | 920 | 780 |
| Manufacturing | Grain Industries | 1 400 | 1 300 | 1 600 | 850 | 1 000 | 950 | 1 000 | 780 | 760 |
| Manufacturing | Metal Fabrication | 5 900 | 9 000 | 1 400 | 340 | 310 | 240 | 260 | 340 | 390 |
| Manufacturing | Plastics Manufacture | 880 | 810 | 120 | 36 | 41 | 0.95 | 0.91 | 9.4 | 11 |
| Manufacturing | Pulp and Paper Industry | 72 000 | 49 000 | 41 000 | 31 000 | 29 000 | 31 000 | 30 000 | 30 000 | 31 000 |
| Manufacturing | Textiles | 120 | 170 | 110 | 43 | 30 | 33 | 33 | 8.2 | 0.17 |
| Manufacturing | Vehicle Manufacture (Engines, Parts, Assembly, Painting) | 2 500 | 3 500 | 1 700 | 880 | 760 | 840 | 790 | 730 | 700 |
| Manufacturing | Wood Products | 19 000 | 24 000 | 21 000 | 10 000 | 11 000 | 11 000 | 12 000 | 12 000 | 14 000 |
| Manufacturing | Other Manufacturing Industries | 33 000 | 30 000 | 21 000 | 190 | 170 | 140 | 140 | 160 | 160 |
| Transportation and Mobile Equipment | nil | 1 400 000 | 1 700 000 | 1 400 000 | 1 200 000 | 1 100 000 | 1 100 000 | 1 100 000 | 1 000 000 | 940 000 |
| Transportation and Mobile Equipment | Air Transportation | 52 000 | 64 000 | 68 000 | 61 000 | 69 000 | 73 000 | 72 000 | 75 000 | 78 000 |
| Transportation and Mobile Equipment | Heavy-duty Diesel Vehicles | 290 000 | 410 000 | 410 000 | 330 000 | 310 000 | 290 000 | 270 000 | 240 000 | 240 000 |
| Transportation and Mobile Equipment | Heavy-duty Gasoline Vehicles | 58 000 | 81 000 | 60 000 | 44 000 | 44 000 | 43 000 | 36 000 | 34 000 | 36 000 |
| Transportation and Mobile Equipment | Heavy-duty LPG/NG Vehicles | 15 000 | 34 000 | 4 500 | 370 | 220 | 110 | 59 | 61 | 80 |
| Transportation and Mobile Equipment | Light-duty Diesel Trucks | 790 | 1 400 | 1 900 | 1 300 | 1 200 | 1 200 | 1 300 | 1 400 | 1 500 |
| Transportation and Mobile Equipment | Light-duty Diesel Vehicles | 2 200 | 2 300 | 1 200 | 1 100 | 990 | 990 | 950 | 930 | 870 |
| Transportation and Mobile Equipment | Light-duty Gasoline Trucks | 94 000 | 190 000 | 130 000 | 88 000 | 81 000 | 76 000 | 70 000 | 67 000 | 71 000 |
| Transportation and Mobile Equipment | Light-duty Gasoline Vehicles | 190 000 | 220 000 | 120 000 | 67 000 | 60 000 | 56 000 | 49 000 | 45 000 | 46 000 |
| Transportation and Mobile Equipment | Light-duty LPG/NG Trucks | 820 | 740 | 280 | 5.6 | 2.6 | 1.1 | 0.82 | 0.74 | 0.92 |
| Transportation and Mobile Equipment | Light-duty LPG/NG Vehicles | 7 500 | 5 900 | 2 900 | 140 | 84 | 43 | 31 | 27 | 29 |
| Transportation and Mobile Equipment | Marine Transportation | 140 000 | 190 000 | 210 000 | 210 000 | 220 000 | 220 000 | 230 000 | 210 000 | 210 000 |
| Transportation and Mobile Equipment | Motorcycles | 310 | 440 | 520 | 620 | 630 | 620 | 610 | 630 | 670 |
| Transportation and Mobile Equipment | Off-road Diesel Vehicles and Equipment | 330 000 | 360 000 | 280 000 | 220 000 | 190 000 | 180 000 | 170 000 | 170 000 | 130 000 |
| Transportation and Mobile Equipment | Off-road Gasoline/LPG/CNG Vehicles and Equipment | 54 000 | 38 000 | 28 000 | 31 000 | 31 000 | 30 000 | 32 000 | 33 000 | 32 000 |
| Transportation and Mobile Equipment | Rail Transportation | 160 000 | 150 000 | 130 000 | 120 000 | 120 000 | 120 000 | 120 000 | 120 000 | 110 000 |
| Transportation and Mobile Equipment | Tire Wear and Brake Lining | - | - | - | - | - | - | - | - | - |
| Agriculture | nil | 2 100 | 2 200 | 2 100 | 4 000 | 4 000 | 4 100 | 4 300 | 3 800 | 3 800 |
| Agriculture | Animal Production | - | - | - | - | - | - | - | - | - |
| Agriculture | Crop Production | - | - | - | - | - | - | - | - | - |
| Agriculture | Fuel Use | 2 100 | 2 200 | 2 100 | 4 000 | 4 000 | 4 100 | 4 300 | 3 800 | 3 800 |
| Commercial / Residential / Institutional | nil | 87 000 | 90 000 | 86 000 | 85 000 | 81 000 | 81 000 | 84 000 | 80 000 | 77 000 |
| Commercial / Residential / Institutional | Cigarette Smoking | - | - | - | - | - | - | - | - | - |
| Commercial / Residential / Institutional | Commercial and Institutional Fuel Combustion | 23 000 | 30 000 | 30 000 | 27 000 | 26 000 | 26 000 | 27 000 | 26 000 | 26 000 |
| Commercial / Residential / Institutional | Commercial Cooking | - | - | - | - | - | - | - | - | - |
| Commercial / Residential / Institutional | Construction Fuel Combustion | 3 900 | 2 000 | 3 000 | 3 300 | 3 500 | 3 100 | 3 000 | 3 000 | 3 100 |
| Commercial / Residential / Institutional | Home Firewood Burning | 25 000 | 23 000 | 19 000 | 20 000 | 20 000 | 20 000 | 20 000 | 20 000 | 20 000 |
| Commercial / Residential / Institutional | Human | - | - | - | - | - | - | - | - | - |
| Commercial / Residential / Institutional | Marine Cargo Handling | 0.20 | 0.059 | - | - | - | 29 | 31 | 26 | 24 |
| Commercial / Residential / Institutional | Residential Fuel Combustion | 35 000 | 35 000 | 35 000 | 34 000 | 32 000 | 33 000 | 34 000 | 32 000 | 29 000 |
| Commercial / Residential / Institutional | Service Stations | - | - | - | - | - | - | - | - | - |
| Commercial / Residential / Institutional | Other Miscellaneous Sources | - | - | - | - | - | - | - | - | - |
| Incineration and Waste | nil | 8 400 | 8 000 | 8 600 | 4 800 | 5 000 | 5 500 | 5 200 | 5 000 | 5 100 |
| Incineration and Waste | Crematoriums | 8.2 | 12 | 15 | 18 | 19 | 20 | 21 | 22 | 22 |
| Incineration and Waste | Waste Incineration | 2 500 | 2 400 | 2 500 | 3 000 | 3 100 | 3 000 | 2 800 | 2 600 | 2 700 |
| Incineration and Waste | Waste Treatment and Disposal | 5 800 | 5 600 | 6 100 | 1 800 | 1 900 | 2 400 | 2 400 | 2 400 | 2 400 |
| Paints and Solvents | nil | 110 | 120 | 130 | 23 | 23 | 23 | 23 | 23 | 23 |
| Paints and Solvents | Dry Cleaning | 1.1 | 1.6 | - | - | - | - | - | - | - |
| Paints and Solvents | General Solvent Use | - | - | - | - | - | - | - | - | - |
| Paints and Solvents | Printing | 110 | 120 | 130 | 23 | 23 | 23 | 23 | 23 | 23 |
| Paints and Solvents | Surface Coatings | 0.12 | 0.12 | - | - | - | - | - | - | - |
| Dust | nil | - | - | - | - | - | - | - | - | - |
| Dust | Coal Transportation | - | - | - | - | - | - | - | - | - |
| Dust | Construction Operations | - | - | - | - | - | - | - | - | - |
| Dust | Mine Tailings | - | - | - | - | - | - | - | - | - |
| Dust | Paved Roads | - | - | - | - | - | - | - | - | - |
| Dust | Unpaved Roads | - | - | - | - | - | - | - | - | - |
| Fires | nil | 7 500 | 1 400 | 890 | 1 300 | 1 500 | 650 | 2 600 | 2 000 | 1 700 |
| Fires | Prescribed Forest Burning | 7 400 | 1 400 | 850 | 1 300 | 1 500 | 610 | 2 600 | 2 000 | 1 600 |
| Fires | Structural Fires | 49 | 39 | 35 | 39 | 39 | 39 | 28 | 27 | 26 |
| Grand Total | nil | 2 400 000 | 2 900 000 | 2 500 000 | 2 100 000 | 2 000 000 | 2 000 000 | 2 000 000 | 1 900 000 | 1 800 000 |
Notes:
totals may not add up due to rounding
- denotes no emissions