
Protecting birds at sea
- Threats and risk factors for seabirds
- How are seabirds protected?
- What is being done to address the risks to seabirds?
- Determining potential high-density areas for longline and gillnet vulnerable seabirds
- Available By-catch Mitigation Factsheets
- General information on Seabirds
- Information on the Status of Birds in Canada
Threats and risk factors for seabirds
Seabird populations are threatened by many factors including introduced predators on nesting colonies, contaminants, marine oil pollution and litter, climate change, tourism, disease, and aquaculture activities. Some of the characteristics and behavioral traits of seabirds make them particularly vulnerable to the effects of human activities in the marine environment. For example, many seabird species do not start breeding until they are several years old. Although most seabird species are long-lived, many produce a small number of eggs (or only a single egg) per year and do not necessarily breed every year. This means that the deaths of breeding adults can have a substantial impact on populations over time.
Some of the threats and risks that can result in mortality to seabirds and potentially affect their populations are described below.
Many seabirds congregate in marine areas of high productivity, where there is a greater abundance of food. Fisheries tend to also concentrate their activities in high-productivity areas, as target fish are often found there. Given the higher densities of seabirds and fisheries in these areas, there is an increased chance for birds to have fatal interactions with fishing gear. In addition, many seabirds are attracted to fishing vessels as potential sources of food. This combination of factors, coupled with birds’ specific foraging techniques such as diving and pursuing prey underwater, can result in injury or death to the birds.
The presence of debris in the marine environment, particularly plastics and other non-biodegradable items, can have an adverse effect on seabirds. Seabirds may become entangled in these items and can also confuse them for food. Ingesting debris can cause blockage of the intestinal tract, reduced appetite, and reduced dietary efficiency. It can also lead to the accumulation of some contaminants in the birds’ tissues.
Feathers provide seabirds with waterproofing, insulation and buoyancy, all of which are necessary for their survival. However, if a seabird comes in contact with even trace amounts of oil, the waterproofing properties of the feathers will be destroyed. This can lead to death from hypothermia or drowning. Oiled seabirds that do not die from hypothermia or drowning may die from ingesting petroleum-based oil when they clean their feathers. Birds that do survive being oiled may have reduced life expectancy and reduced breeding success. Seabirds and their populations can be affected by large single-event catastrophic oil spills, as well as by chronic oiling from small-scale discharges of oil-contaminated bilge water or from sources of unknown origin. Moreover, exposure to fish and vegetable oils can be just as deadly to seabirds as petroleum-based oils as they can also disrupt the waterproofing properties of feathers.
Seabirds are attracted to large offshore structures including drilling and production platforms. The birds are attracted by visual cues from the platforms, lighting and flares, and increased concentrations of food near the structures. Birds may be injured or killed when they collide with the platforms or fly into lights or flares. They can also be affected by the thin, barely visible sheens of oil that can form around the platforms.
How are seabirds protected?
Except for cormorants and pelicans, all regularly-occurring seabirds in Canada are protected under the Migratory Birds Convention Act, 1994 (MBCA). It is illegal to harass or kill migratory birds, or to destroy or disturb their nests or eggs. It is also illegal to deposit any substance that is harmful to migratory birds, or permit such a substance to be deposited, in waters or areas frequented by migratory birds. Some species of birds protected under the MBCA have also been listed in Schedule 1 of the Species at Risk Act (SARA). These species receive protection from both the MBCA and SARA.
What is being done to address the risks to seabirds?
Fisheries bycatch of seabirds is an issue affecting thousands of seabirds each year in Canada. Environment and Climate Change Canada is working with Fisheries and Oceans Canada to find ways to reduce the risk of seabird mortality from human activities at sea; please see the report: Canada’s Progress Report on the Implementation of Key Actions Taken Pursuant to the National Plan of Action for Reducing the Incidental Catch of Seabirds in Longline Fisheries (March 2007).
Some of the sources of chronic oil pollution can be very difficult to identify, as small-volume discharges are often unreported or unnoticed. Environment and Climate Change Canada is working closely with Transport Canada and academic partners to explore the spatial patterns of background oil pollution, and to identify the human activities that may be causing them. The study is using data collected by Transport Canada’s National Aerial Surveillance Program (NASP) and Environment and Climate Change Canada's Marine Aerial Reconnaissance Team (MART). The NASP conducts regular surveillance flights over the Pacific, Atlantic and Arctic Oceans, using state-of-the-art equipment to detect and map the presence of oily substances on the surface of the ocean.
In the cases of uncontrolled or accidental releases of hazardous substances such as oil, Environment and Climate Change Canada coordinates a response through the Environmental Emergencies Program. The program concentrates on preventing damage to wildlife and their habitat. To support the program, Environment and Climate Change Canada:
- provides data on migratory birds, species at risk, and sensitive habitats
- conducts surveys of affected or potentially affected areas and the migratory bird populations
- provides permits for the capture and treatment of affected migratory birds and species at risk
- provides guidance to other agencies on the clean-up of migratory birds and species at risk
- assesses the damage to migratory birds and species at risk (and their populations)
- provides documentation for future cost recovery from the responsible party
- studies affected populations to determine the status of recovery
Environment and Climate Change Canada conducts research and monitoring to determine the areas and time periods where seabirds congregate. This is done to raise awareness of the potential risks to seabirds from human activities, and to identify the areas and time periods when those risks may be higher. The information from this research and monitoring is also provided in order to facilitate risk management decisions by those who carry out activities in areas where seabirds are found.
The first phase of this work was a study to determine areas of increased density for species vulnerable to fisheries bycatch in Canada’s Pacific Ocean. Similar studies are being undertaken to determine bird densities for other regions such as eastern Canada, for other species, and for other sectors. Results from these studies will be posted on Environment and Climate Change Canada’s website as they become available.
Determining potential high-density areas for longline and gillnet vulnerable seabirds
Introduction
Although birds at sea may be encountered at any time of year and in almost any location, many species tend to concentrate in particular areas. The birds are at greater risk if there are interactions between seabirds and human activities in those areas.
Seabirds are vulnerable to either longline or gillnet fisheries bycatch; they may become entangled in trawl or gill nets or they may become hooked and pulled underwater when they attempt to take bait from longlines. Also, birds can collide with the cables that run between a vessel and its trawl nets, although this happens less frequently.
Methods used to identify potential high-density areas for some seabirds on Canada’s Pacific coast
Environment and Climate Change Canada has identified marine areas of high seabird density on Canada’s Pacific Coast for four groups of seabirds. These four groups were chosen because they are the seabirds most frequently taken as fisheries bycatch in Canada’s Pacific waters. Albatrosses and large gulls are most frequently caught on longline gear; murres and Rhinoceros Auklets are most frequently caught in salmon gillnets.
Areas of heightened density were identified by analyzing data on seabird observations from Environment and Climate Change Canada’s Pelagic Seabird Survey Database. Observations used in the study were collected between 1982 and 2010 within 150 km of the coast of British Columbia (B.C.), southern Alaska, and northern Washington. All the data were collected through opportunistic surveys; that is, observers went aboard ocean-going vessels as opportunities for doing so were available. Consequently, the survey effort is not evenly distributed. Once on the vessel, observers collected the data using a standardized survey protocol.
Since the areas of heightened densities were estimated based on opportunistic surveys, other areas of seabird congregation may not have been surveyed or detected. In order to account for uneven survey effort, seabird densities were estimated using total counts divided by the total number of surveys for each 250m2 survey cell. The Kernel Density Estimation (KDE) technique was used to obtain smooth estimates from the observed occurrences.
The data for each species group were analyzed according to the breeding and non-breeding seasons specific to each group as shown in Table 1, below. These dates were chosen to represent the breeding and non-breeding seasons for the purposes of data analysis only; actual breeding times may vary from year to year, and birds may sometimes nest outside these dates.
| Species group/species | Breeding Season Used for the Analysis | Non-breeding Season Used for the Analysis |
|---|---|---|
| Albatrosses | 1 Nov - 31 Jul | 1 Aug - 31 Oct |
| Large Gulls | 1 May - 15 Aug | 16 Aug - 30 Apr |
| Murres | 1 Apr - 7 Sep | 8 Sep - 31 Mar |
| Rhinoceros Auklet | 15 Apr - 15 Sep | 16 Sep - 14 Apr |
Disclaimer: The information provided here can be used to identify areas of heightened density for some seabirds where the risk of encounters is potentially higher. This can support the planning of activities in order to reduce the risk of detrimental effects. It should be noted that this information constitutes advice only. It is the responsibility of the individual or company undertaking the activities to evaluate risks and determine the measures required.
Please refer to Map 1 for the marine locations and terrestrial locations mentioned in the descriptions below.
High-density areas identified for longline vulnerable seabirds
Albatrosses
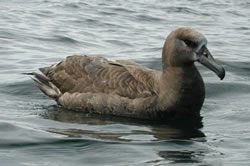
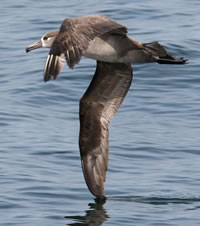
Albatrosses can be found within Canada’s Pacific Exclusive Economic Zone (EEZ) in all months of the year. They breed outside of Canada on the Hawaiian Islands and on small islands off the coasts of Japan and Mexico. Adults travel great distances to the west coast of North America when seeking food for their young. Two species of albatross have been listed under the Species at Risk Act: the Short-tailed Albatross is listed as Threatened; and the Black-footed Albatross, which is the most abundant albatross species found in Canadian waters, is listed as Special Concern. More information, including status reports and recovery strategies, can be found at the Species at Risk Public Registry.
During the breeding season for albatrosses, several high-density areas were identified along the outer continental shelf and shelfbreak/slope areas (Map 2); notably, along most of the west coast of Vancouver Island (especially west of La Perouse Bank to approximately Estevan Point). Other areas of heightened density were the shelfbreak region west of the Scott Islands, the entrance to Queen Charlotte Sound (especially southeast of Kunghit Island), and waters west of Frederick and Langara Islands, Haida Gwaii.
During the non-breeding season, albatrosses showed a similar pattern as during the breeding season with high-density areas associated with the shelf-break/slope region, notably the La Perouse Bank area, the entrance to Queen Charlotte Sound, and waters to the west of Langara Island (Map 2). Additional high-density areas were the slope region west of Nootka Sound, the edge of Cook Bank, the outer shelf and slope northwest of Anthony Island, and west of Learmonth Bank.
Overall, albatrosses are present at higher densities off Canada’s Pacific coast during the breeding season than the non-breeding season, and are strongly associated with outer shelf and continental slope waters.
Large gulls
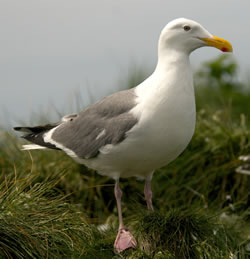
Of the five gull species included in the analysis, the only local coastal breeder in B.C.is the Glaucous-winged Gull, which is present year round on the Pacific Coast. Approximately 29,000 pairs of Glaucous-winged Gull nest in B.C.; the largest colonies are on the Chain Islets, Mandarte Island, Mitlenatch Island, and Cleland Island. The other four large gull species (Herring, Western, Glaucous and Thayer’s Gulls) breed elsewhere and are found in marine areas of British Columbia primarily during the non-breeding season. For this study, the breeding and non-breeding seasons of the Glaucous-winged Gull were used to define the breeding and non-breeding seasons for large gulls.
During the breeding season for large gulls, two main areas of high-density were identified (Map 3): a broad area west of the entrance to the Juan de Fuca Strait centred on La Perouse Bank, and an area in the southern Strait of Georgia between Victoria and Vancouver. Other areas with somewhat elevated densities included shelf waters west and north of Cleland Island, the northern end of Vancouver Island, the entrance to Queen Charlotte Strait, west of Kunghit Island, and off Forrester Island. The locations of most of these areas of heightened density closely reflect the distribution of many of the large Glaucous-winged Gull colonies. This is due the fact that many seabirds are colonial breeders, and during the breeding season high numbers of individuals may be found foraging relatively close to their nesting colonies.
During the non-breeding season many of the high-density areas were located near Glaucous-winged Gull colonies (Map 3). The average density of large gulls was much higher during the non-breeding season than during the breeding season. The birds also appear to be more widely distributed (further offshore) during the non-breeding season. This is likely related to the influx of additional Glaucous-winged Gulls and other gull species from outside of British Columbia during the non-breeding season.
High-density areas identified for gillnet vulnerable seabirds
Murres
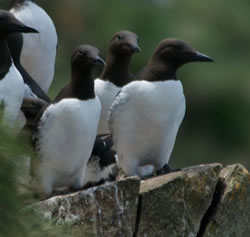
Approximately 4,300 breeding pairs of Common Murres and possibly a few Thick-billed Murres nest along the coast of British Columbia. More than 90% of the Common Murres nesting in British Columbia breed on Triangle Island. The remainder breed in Haida Gwaii or in low numbers on small islands off the west coast of Vancouver Island.
During the breeding season for murres five high-density areas were identified (Map 4); two were associated with Common Murre colonies (Triangle Island and Forrester Island). High-density areas for murres during the breeding season were situated in a triangular area bounded by the entrance to Queen Charlotte Strait, Calvert Island and Cook Bank; and with shelf waters west of Clayoquot Sound. Other high-density areas were identified at the eastern part of the Juan de Fuca Strait (south of Victoria), and areas southwest of Lucy Island and east of Forrester Island.
In the non-breeding season, murres move into more coastal waters, especially in the southern half of the province (Map 4). High-density areas have been found southwest of Estevan Point, in the La Perouse Bank area, at the eastern end of Juan de Fuca Strait, and at the northern extent of the Strait of Georgia.
Throughout the year, murres prefer inner continental shelf/coastal waters. From July through late September, hundreds of thousands of murres (primarily Common Murres) are present along the west coast of the southern half of Vancouver Island and northern Washington. The number of birds greatly exceeds the breeding population (of Common Murres) in British Columbia and Washington, and it is assumed that most of the birds are from colonies along the Oregon coast.
Rhinoceros Auklet
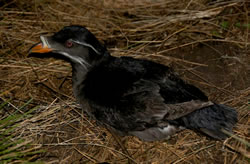
An estimated 360,000 pairs of Rhinoceros Auklets nest in British Columbia; the largest colonies are on Pine and Storm Islands, Triangle Island, and the Moore Islands.
During the breeding season for Rhinoceros Auklets, five high-density areas were identified (Map 5). Four of the high-density areas were close to breeding colonies. The most significant high-density area encompassed most of Cook Bank and the entrance to Queen Charlotte Strait, reflecting the proximity of large breeding colonies (Pine Island, the Storm Islands and Triangle Island). Other areas of heightened density were the waters off Anthony and Kunghit Islands and adjacent to Lucy Island. The high-density area in the middle of Dixon Entrance may be birds associated with either Forrester Island, where more than 50,000 pairs nest, or with Lucy Island, where more than 25,000 pairs nest.
During the non-breeding season, a similar pattern was found for Rhinoceros Auklets, although at lower densities (Map 5). Notable changes were the observed lower densities at the Cook Bank - Queen Charlotte Sound area, and the heightened densities at the shelf waters off the southwest coast of Vancouver Island. The waters west of Lucy Island remained an area of high concentration. The distribution of Rhinoceros Auklets during the non-breeding season was more restricted than during the breeding season (a similar pattern to that of murres); they occur off the B.C. coast, generally within 100 km of shore.
Overall, Rhinoceros Auklets are strongly associated with marine areas adjacent to their nesting colonies and appear to favour continental shelf waters.
For more information, please contact the Environment and Climate Change Canada Canadian Wildlife Service office in your region.
Available Bycatch Mitigation Factsheets
BirdLife International has developed a series of Seabird Bycatch Mitigation Factsheets.
General information on Seabirds
General information on seabirds can be found at: Hinterland Who's Who
Information on the Status of Birds in Canada
The Status of Birds in Canada web section contains information on the current population status and trends for almost 400 species of birds that regularly breed in Canada.
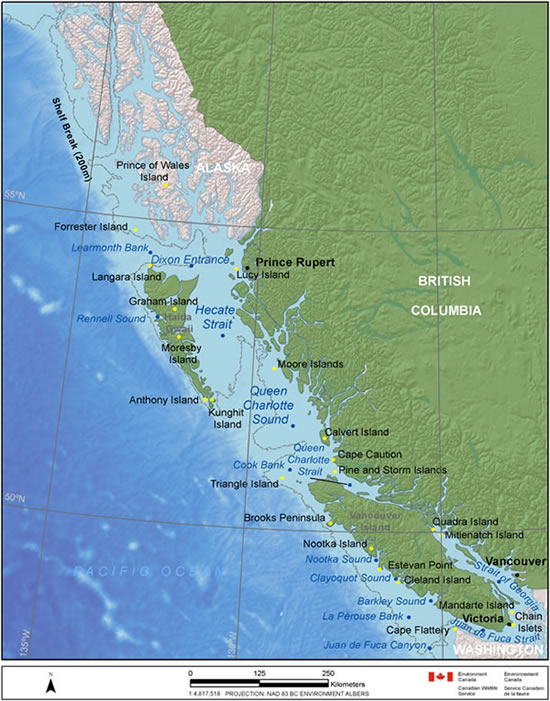
Long description for Map 1
Map showing the western half of British Columbia, the southern coast of Alaska, the very northern tip of Washington State and the Pacific Ocean; map shows the locations of terrestrial and marine features noted the in text. Marine features and their approximate locations, from north to south: Learmonth Bank and Dixon Entrance at the north end of Haida Gwaii; Rennal Sound and Hecate Strait on the west and east sides of Haida Gwaii, respectively; Queen Charlotte Sound between Vancouver Island and Haida Gwaii; Queen Charlotte Strait, east of the north end of Vancouver Island; Cook Bank off the northwest end of Vancouver Island; the following sounds on the west side of Vancouver Island (north to south): Nootka Sound, Clayoquot Sound, Barkley Sound; La Perouse Bank and Juan de Fuca Canyon off the southwest side of Vancouver Island; Juan de Fuca Strait between Vancouver Island and Washington and the Strait of Georgia between Vancouver Island and mainland BC.
Terrestrial locations: Prince of Wales Island and Forrester Island (southern Alaska); Near and around Haida Gwaii: Langara, Graham, Moresby, Anthony and Kunghit Islands; off the mainland of BC, north of Vancouver Island: Lucy, Moore and Calvert Islands, Cape Caution, Pine and Storm Islands. Along the west side of Vancouver Island: Triangle Island, Brooks Peninsula, Nootka Island, Estevan Point, Cleland Island and Mandarte Island. Off the northwest point of Washington: Cape Flattery. Along the east side of Vancouver Island: Quadra and Mitlenatch Islands. Off the south point of Vancouver Island: Chain Islets.
The 200m shelf break is marked.
There is a north arrow and scale, the map projection is NAD 83 BC Environment Albers.
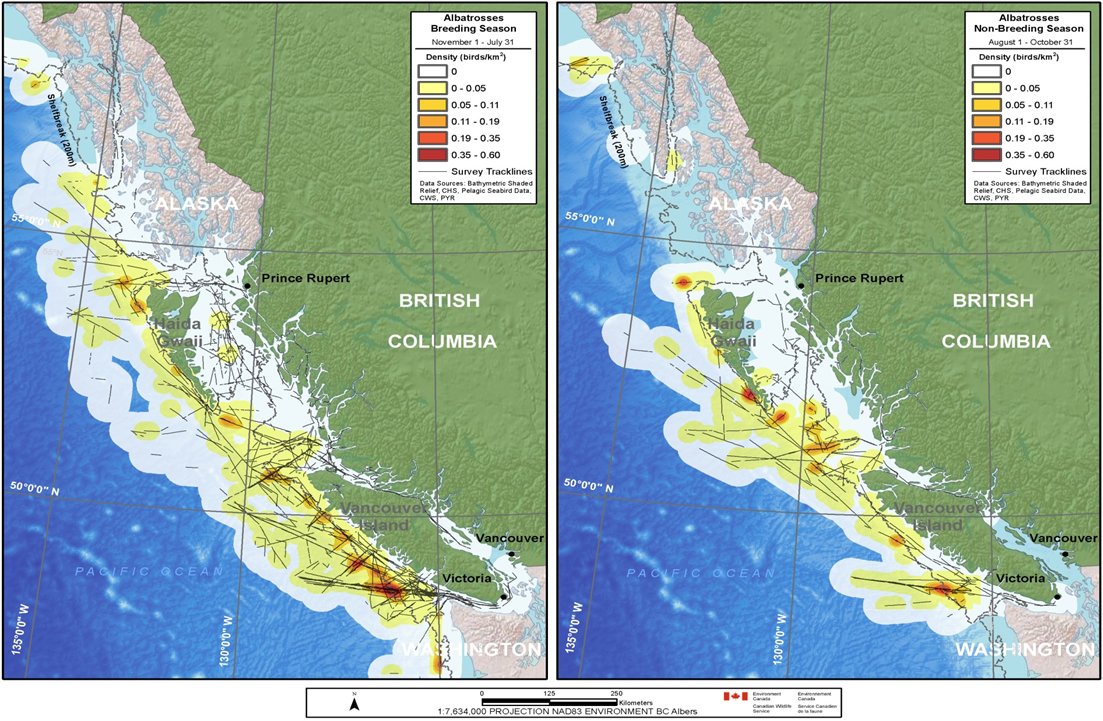
Long description for Map 2
Map showing the western half of British Columbia, the southern coast of Alaska, the very northern tip of Washington State and the Pacific Ocean. Map is divided into two panels, both showing densities of albatross, left panel show densities during the breeding season (November 1 to July 31), right panel shows densities during the non-breeding season (August 1 to October 31).
During the breeding season, two main areas of high-density were noted: a broad area west of the entrance to the Juan de Fuca Strait centred on La Perouse Bank, and an area in the southern Strait of Georgia between Victoria and Vancouver. Other areas with somewhat elevated densities included shelf waters west and north of Cleland Island, the northern end of Vancouver Island, the entrance to Queen Charlotte Strait, west of Kunghit Island, and off Forrester Island.
During the non-breeding season high-density areas were associated with the shelfbreak/slope region, notably the La Perouse Bank area, the entrance to Queen Charlotte Sound, and waters to the west of Langara Island. Additional high-density areas were the slope region west of Nootka Sound, the edge of Cook Bank, the outer shelf and slope northwest of Anthony Island, and west of Learmonth Bank. There is a legend, with categories going from white to dark red, depicting different bird densities (birds/km2), categories are: 0, 0-0.05, 0.05-0.11, 0.11-0.19, 0.19-0.35, 0.35-0.60.
The survey tracklines are shown.
Data sources: Bathymetric shaded relief: CHS, Pelagic Seabird Data, CWS, PYR.
The 200m shelf break is marked.
There is a north arrow and scale, the map projection is NAD 83 BC Environment Albers.

Long description for Map 3
Map showing the western half of British Columbia, the southern coast of Alaska, the very northern tip of Washington State and the Pacific Ocean. Map is divided into two panels, both showing densities of large gulls, left panel show densities during the breeding season (May 1 to August 15), right panel shows densities during the non-breeding season (August 16 to April 30).
High density areas identified during the breeding season: areas along most of the west coast of Vancouver Island (especially west of La Perouse Bank to approximately Estevan Point). Other areas of heightened density were the shelfbreak region west of the Scott Islands, the entrance to Queen Charlotte Sound (especially southeast of Kunghit Island), and waters west of Frederick and Langara Islands, Haida Gwaii.
There is a legend, with categories going from white to orange, depicting different bird densities (birds/km2), categories are: 0, 0-0.4, 0.4-0.96, 0.96-2.27.
High density areas identified during the non-breeding season: area off Estevan Point (west Vancouver Island), areas around Cook Bank and Queen Charlotte Stait, areas off the south-east side of Haida Gwaii, Barkley Sound, Juan de Fuca Strait and Strait of Georgia.
There is a legend, with categories going from white to orange, depicting different bird densities (birds/km2), categories are: 0, 0-0.4, 0.4-0.96, 0.96-2.27, 2.27-4.26, 4.26-6.42.
The survey tracklines are shown.
Data sources: Bathymetric shaded relief: CHS, Pelagic Seabird Data, CWS, PYR.
The 200m shelf break is marked.
There is a north arrow and scale, the map projection is NAD 83 BC Environment Albers.

Long description for Map 4
Map showing the western half of British Columbia, the southern coast of Alaska, the very northern tip of Washington State and the Pacific Ocean. Map is divided into two panels, both showing densities of murres, left panel show densities during the breeding season (April 1 to September 7), right panel shows densities during the non-breeding season (September 8 to March 31).
During the breeding season five high-density areas were identified; two were associated with Common Murre colonies (Triangle Island and Forrester Island). High-density areas for murres during the breeding season were situated in a triangular area bounded by the entrance to Queen Charlotte Strait, Calvert Island and Cook Bank; and with shelf waters west of Clayoquot Sound. Other high-density areas were identified at the eastern part of the Juan de Fuca Strait (south of Victoria), and areas southwest of Lucy Island and east of Forrester Island.
There is a legend, with categories going from white to red, depicting different bird densities (birds/km2), categories are: 0, 0-0.40, 0.40-0.85, 0.85-1.55, 1.55-2.55.
In the non-breeding season, murres were noted in coastal waters, especially in the southern half of the province. High-density areas were found southwest of Estevan Point, in the La Perouse Bank area, at the eastern end of Juan de Fuca Strait, and at the northern extent of the Strait of Georgia.
There is a legend, with categories going from white to dark red, depicting different bird densities (birds/km2), categories are: 0, 0-0.4, 0.40-0.85, 0.85-1.55, 1.55-2.55, 2.56-3.86.
The survey tracklines are shown.
Data sources: Bathymetric shaded relief: CHS, Pelagic Seabird Data, CWS, PYR.
The 200m shelf break is marked.
There is a north arrow and scale, the map projection is NAD 83 BC Environment Albers.
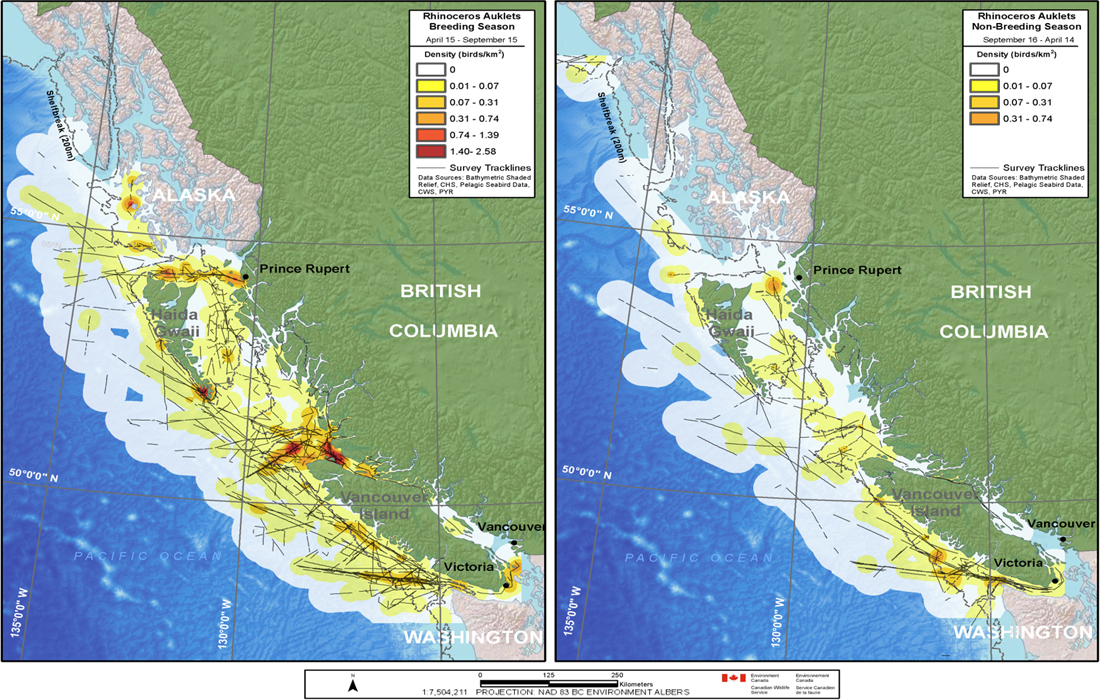
Long description for Map 5
Map showing the western half of British Columbia, the southern coast of Alaska, the very northern tip of Washington State and the Pacific Ocean. Map is divided into two panels, both showing densities of Rhinoceros Auklets, left panel show densities during the breeding season (April 15 to September 15), right panel shows densities during the non-breeding season (September 16 - April 14).
During the breeding season the most significant high-density area encompassed most of Cook Bank and the entrance to Queen Charlotte Strait, reflecting the proximity of large breeding colonies (Pine Island, the Storm Islands and Triangle Island). Other areas of heightened density were the waters off Anthony and Kunghit Islands and adjacent to Lucy Island. There is also a high-density area in the middle of Dixon Entrance.
There is a legend, with categories going from white to dark red, depicting different bird densities (birds/km2), categories are: 0, 0.01-0.07, 0.07-0.31, 0.31-0.74, 0.74-1.39, 1.40-2.58.
During the non-breeding season heightened densities were noted at the shelf waters off the southwest coast of Vancouver Island and the waters west of Lucy Island.
There is a legend, with categories going from white to orange, depicting different bird densities (birds/km2), categories are: 0, 0.01-0.07, 0.07-0.31, 0.31-0.74.
The survey tracklines are shown.
Data sources: Bathymetric shaded relief: CHS, Pelagic Seabird Data, CWS, PYR.
The 200m shelf break is marked.
There is a north arrow and scale, the map projection is NAD 83 BC Environment Albers.