Benthic macroinvertebrate metric reference guide
On this page
Richness metrics
Number of individuals
Functional measures
Biotic indicators
Richness metrics
Total richness
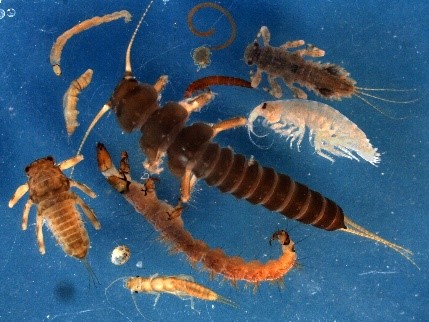
Microscopic view of a variety of taxa. Photo: ECCC CABIN
Calculation and description
Total number of unique taxa identified at the selected taxonomic level (i.e. order, family, genus, species).
Richness of a stream can decline as flow regimes are altered, habitat is lost, chemicals are introduced, energy cycles are disrupted, and alien taxa invade.
Response to disturbance
There is usually a decrease of intolerant taxa and increase of tolerant taxa.
Ephemeroptera taxa

Heptageniidae mayfly, Photo credit: Society for Freshwater Science image library leclair001 Licensed under CC BY-NC-SA 2.0
Calculation and description
Ephemeroptera is an order of insects commonly known as mayflies. Richness is calculated by counting the number of unique Ephemeroptera taxa in this order at the selected taxonomic level (family, genus or species)
Large numbers of these short-lived adult insects tend to appear in late spring/early summer, hence the common name mayflies. The aquatic stages feed on organic matter such as algae and leaf litter, and are an important food source, along with adults, for fish and other aquatic predators. Their larval stages are pollution-sensitive.
Response to disturbance
The richness of Ephemeroptera taxa is expected to decrease in response to disturbance.
Plecoptera taxa

Perlodidae, Baumanella sp.., Photo credit: Society for Freshwater Science image library buchwalter001 Licensed under CC BY-NC-SA 2.0
Calculation and description
Plecoptera is an order of insects commonly known as Stoneflies. The richness of Plecoptera is calculated by counting the number of unique taxa in this order at the selected taxonomic level (family, genus or species).
The nymphs, which are found in cooler, unpolluted streams and rivers, both prey on other aquatic invertebrates and consume plant matter.
Response to disturbance
The richness of Plecoptera taxa is expected to decrease in response to disturbance.
Trichoptera taxa
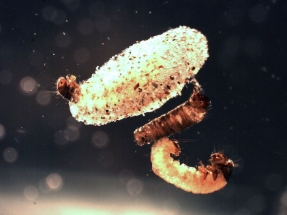
Diptera, Tipula abdominalis, Photo credit: Andrew Hoffman licensed under CC BY-NC-ND 2.0.
Calculation and description
Trichoptera is an order of insects commonly known as caddisflies. The richness of Trichoptera is calculated by counting the number of unique taxa in this Order at the selected taxonomic level (family, genus or species).
The pollution-sensitive aquatic larvae use silk to make protective cases reinforced with items such as sand, gravel, and plant material. Feeding strategies vary between species.
Response to disturbance
The richness of Trichoptera taxa is expected to decrease in response to disturbance.
Diptera taxa
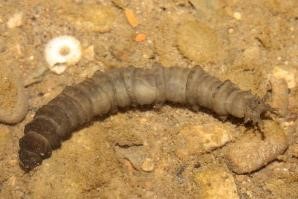
Diptera, Tipula abdominalis, Photo credit: Andrew Hoffman licensed under CC BY-NC-ND 2.0.
Calculation and description
Diptera is an order of insects commonly known as flies. The richness of Diptera is calculated by counting the number of unique taxa in this order at the selected taxonomic level (family, genus or species).
Flies are a large and diverse group of insects and tend to be more pollution tolerant; high Diptera richness may indicate a water quality issue.
Response to disturbance
The richness of Diptera taxa is expected to increase with disturbance.
Odonata taxa
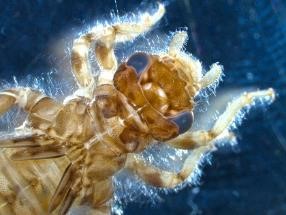
Odonata, Ophiogomphus sp., Photo by ECCC CABIN
Calculation and description
Odonata is an order of insects comprised of damselflies and dragonflies. The richness of Odonata is calculated by counting the number of unique taxa in this order at the selected taxonomic level (family, genus or species).
Odonata are commonly found in standing waters or slow-moving streams. They are predators and may range in pollution sensitivity depending on the families present.
Response to disturbance
The richness of Odonata taxa is expected to generally decrease in response to disturbance.
Coleoptera taxa
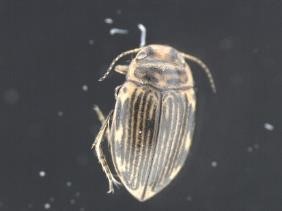
Coleoptera, Oreodytes scitulus adult, Photo by ECCC CABIN
Calculation and description
Coleoptera are an order of insects commonly known as beetles, many of which are aquatic or semi-aquatic. The richness of Coleoptera is calculated by counting the number of unique taxa in this order at the selected taxonomic level (family, genus or species).
Beetles are highly mobile and common in all freshwater environments. They are generally considered pollution sensitive.
Response to disturbance
The richness of Coleoptera taxa is expected to decrease with disturbance.
Chironomidae taxa (genus level only)
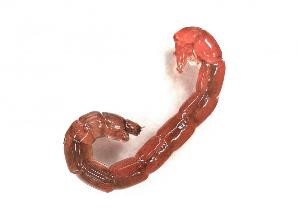
Chironomus sp. (Chironomidae), Photo Credit: B. Schoenmakers at waarneming.nl, a source of nature observations in the Netherlands. licensed under CC BY 3.0
Calculation and description
Chironomidae is a family within the Diptera order commonly known as midges. The richness of Chironomidae is calculated by counting the number of unique taxa in this family at the genus level only.
Chironomidae are often the most abundant family in any freshwater environment. They are generally pollution tolerant, although some species are more or less sensitive.
Response to disturbance
The richness of Chironomidae taxa may increase or decrease in response to disturbance.
Evenness
Calculation and description
Evenness is an index of the relative abundance of various taxa.
Simpson’s Evenness
using
Where Pi=xi / sum (xi) and xi = abundance of species.
Pielou’s Evenness
Where: S=the total number of species, and LnS=natural logarithm of total taxa richness.
Response to disturbance
Even communities are an indicator of good water quality. Evenness is expected to decrease in response to disturbance.
Diversity
Calculation and description
Shannon-Weiner Diversity
Where: S = the total number of species, and Pi = the proportion of S made up of the ith species (i.e., ni/N).
Shannon-Weiner Diversity is an index that represents the proportion of different species in a population. Higher values indicate that individuals are occurring in similar numbers between species, while lower values indicate a less even distribution of individuals between species.
Simpson’s Diversity
Where: S = the total number of taxa in the sample; ni=count of the ith taxa; N = count of all taxa.
Simpson’s Diversity is an index used to measure the number of taxa present as well as the relative abundance of individuals in each taxa. As taxa richness and diversity increases, so does Simpson’s Diversity.
Response to disturbance
Diverse communities are an indicator of good water quality. Diversity indices are expected to decrease in response to disturbance.
Number of individuals
Total abundance
Calculation and description
Sum of all organisms present at the selected taxonomic level.
Total abundance is estimated based on the extrapolated subsample count from a 3-minute kick net sample. It is standardized by sampling effort, not by area.
Response to disturbance
Abundance may increase or decrease in response to disturbance.
% EPT
Calculation and description
These three orders have a low tolerance to water pollution; high numbers of EPT taxa generally indicate good water quality. The absence of any one of the three EPT groups at a site is significant, as they are typically the most sensitive to habitat disturbance.
Response to disturbance
The % EPT individuals is expected to decrease in response to disturbance.
% Ephemeroptera
Calculation and description
Ephemeroptera are an order of insects commonly known as mayflies, due to the large numbers of short-lived adults which appear in late spring/early summer.
Nymphs feed on organic matter such as algae and are an important food source, along with adults, for fish and other aquatic predators. Their larval stages are pollution-sensitive.
Response to disturbance
% Ephemeroptera is expected to decrease in response to disturbance.
% Plecoptera
Calculation and description
Plecoptera are an order of insects commonly called stoneflies. The nymphs, which are found in cooler, unpolluted streams and rivers, prey on other aquatic invertebrates and consume plant matter.
Response to disturbance
% Plecoptera is expected to decrease in response to disturbance.
% Trichoptera
Calculation and description
Trichoptera are an order of insects commonly known as caddisflies. The pollution-sensitive aquatic larvae use silk to make protective cases reinforced with items such as sand, gravel, and plant material. Feeding strategies vary between species.
Response to disturbance
% Trichoptera is expected to decrease in response to disturbance.
No. EPT individuals/Chironomids+EPT Individuals
Calculation and description
The ratio of the abundance of the sensitive EPT orders to the generally tolerant Chironomidae family is a measure of pollution tolerance. A low number close to 0 indicates poor water quality.
Response to disturbance
The ratio of EPT to Chironomidae taxa count is expected to decrease as disturbance increases.
% Trichoptera that are Hydropsychidae
Calculation and description
Hydropsychidae are a family in the order Trichoptera that tend to be more tolerant than other families in the order. A high proportion of Hydropsychidae taxa may indicate poor water quality.
Response to disturbance
% Trichoptera that are Hydropsychidae is expected to increase in response to disturbance.
% Ephemeroptera that are Baetidae
Calculation and description
Baetidae are a family in the order Ephemeroptera that tend to be more tolerant than other families in the order. A high proportion of Baetidae may indicate poor water quality.
Response to disturbance
% Ephemeroptera that are Baetidae is expected to increase in response to disturbance.
% Chironomidae
Calculation and description
Chironomidae are often the most abundant family in any freshwater environment. Pollution tolerance varies widely between species, though they are generally pollution tolerant.
Response to disturbance
% Chironomidae may increase or decrease in response to disturbance.
% Coleoptera
Calculation and description
Coleoptera are an order of insects commonly known as beetles, many of which are aquatic or semi-aquatic. Coleoptera are generally considered pollution sensitive.
Response to disturbance
% Coleoptera is expected to decrease with disturbance.
% Odonata
Calculation and description
Odonata are an order of insects comprised of damselflies and dragonflies. Nymphs live underwater and prey on other aquatic insects.
Response to disturbance
% Coleoptera is expected to decrease with disturbance.
% Tribe Tanytarsini
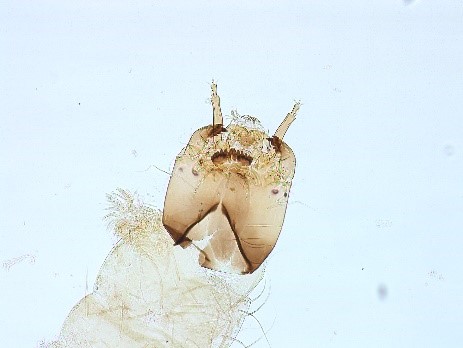
Tanytarsini, Tanytarsus sp. Photo by ECCC CABIN
Calculation and description
Tanytarsini are a tribe of midge larvae found in streams and rivers and are a well-represented group in freshwaters. High numbers of these short-lived taxa indicate intermittent flow pattern and/or sedimentation.
Response to disturbance
% Tanytarsini is expected to increase in response to disturbance.
% Diptera + Non-insects
Calculation and description
Dipterans and non-insect taxa represent many of the pollution tolerant taxa found in benthic communities. The metric is any individual in the Diptera order, plus any organism in any order not listed below:
- Collembola
- Ephemeroptera
- Odonata
- Plecoptera
- Heteroptera
- Megaloptera
- Neuroptera
- Trichoptera
- Lepidoptera
- Coleoptera
Response to disturbance
% Diptera + Non-insect individuals are expected to increase in response to disturbance.
% of dominant taxa
(% top 2 dominant taxa
% top 5 dominant taxa)
Calculation and description
Dominant taxa are those which have the largest number of individuals in a sample. There may be a water quality issue in a site when a large proportion of a sample is composed of a few taxa. Opportunistic taxa that can tolerate a wider range of habitat types may come to dominate the community, replacing other taxa with specific habitat or feeding needs.
Response to disturbance
The % of the five-, and two-, most dominant species in the community is expected to increase in response to disturbance.
Functional measures
% Gatherers
Calculation and description
Gatherers are organisms that feed primarily on fine organic matter deposited in the water.
Response to disturbance
The proportion of gatherers is expected to increase at a site in response to disturbance.
% Predators
Calculation and description
Predators are organisms that feed primarily on other organisms found in their environment.
Response to disturbance
The proportion of predators is expected to decline at a site in response to disturbance.
% Filterers
Calculation and description
Filterers are organisms that collect fine, floating organic material from the water column.
Response to disturbance
The proportion of filterers is expected to increase at a site in response to disturbance.
% Scrapers
Calculation and description
Scrapers are grazing organisms that consume algae from material in the water.
Response to disturbance
The proportion of scrapers is expected to decrease at a site in response to disturbance.
% Shredders
Calculation and description
Shredders are organisms that feed on leaf litter and coarse particulate organic matter.
Response to disturbance
The proportion of shredders is expected to decrease at a site in response to disturbance.
Number of clingers
Calculation and description
Count of the number of unique taxa in the sample that cling to rock surfaces.
These organisms are physically adapted to hold on to substrate in running water and typically live in the gaps between rocks and cobble on streambeds. When fine sediments fill these microhabitats, expect the number of clinger species to decrease. Common clingers include Simuliidae (blackflies), Ephemerellidae (mayflies), and Perlodidae (stoneflies).
Response to disturbance
The number of clinger taxa is expected to decrease in response to disturbance.
Biotic indicators
Long-lived taxa
Calculation and description
Count of the number of unique taxa that need more than 1 year to complete their life cycle.
These taxa, which include groups such as Perlidae (stoneflies) and Megaloptera, have been exposed to conditions in the water over a longer period and are helpful for providing information on historical and current water quality conditions.
Response to disturbance
The number of long-lived taxa is expected to decrease in response to disturbance.
Intolerant taxa
Calculation and description
Count of the number of unique taxa considered to be intolerant to pollution.
These taxa are most sensitive to disturbance from organic pollution using Hilsenhoff Biotic Indices. Values are also specific to the geographic and regional area for which they are developed. Tolerance values can be determined at family or genus level.
Response to disturbance
Intolerant taxa count is expected to decrease as disturbance increases.
% Tolerant individuals
Calculation and description
Proportion of tolerant individuals in the sample.
Tolerant taxa are better able to withstand poor water quality and disturbance from organic pollution using Hilsenhoff Biotic Indices. Values are also specific to the geographic and regional area for which they are developed. Tolerance values can be determined at family or genus level.
Response to disturbance
The % Tolerant individuals is expected to increase in response to disturbance.
Hilsenhoff Biotic Index
Calculation and description
This index uses tolerance values for each taxa, and abundance of those taxa.
Where: n=number of individuals of the ith species, t=tolerance value of ith species, and N=total number of individuals.
Tolerance values are primarily based on responses to organic pollutants. Sensitive taxa receive low scores, and tolerant species receive high scores. This index will output a value between 0 and 10, where 0 indicates excellent water quality and 10 indicates very poor water quality.
Response to disturbance
The % Tolerant individuals is expected to increase in response to disturbance.
