
Summer 2016: Climate Trends and Variations Bulletin
PDF format [356 KB]
This bulletin summarizes recent climate data and presents it in a historical context. It first examines the national average temperature for the season or year, and then highlights interesting regional temperature information. Precipitation is examined in the same manner.
National temperature
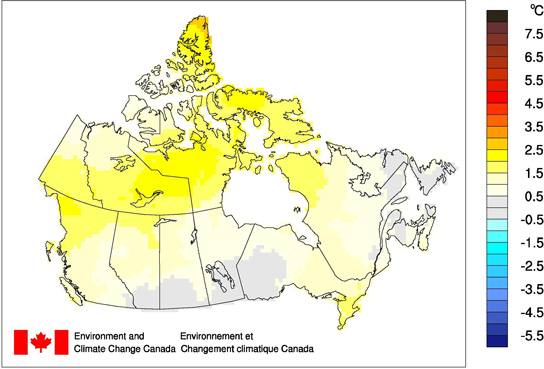
The national average temperature for the summer of 2016 was 1.2°C above the baseline average (defined as the mean over the 1961-1990 reference period) which, based on preliminary data, is the fourth warmest summer observed since nationwide recording began in 1948. The warmest summer occurred in 2012, when the national average temperature was 1.8°C above the baseline average. The coldest summer occurred in 1978, when the national average temperature was 1.0°C below the baseline average. The temperature departures map for summer 2016 (below) shows that most of the Yukon, Northwest Territories and Nunavut experienced temperatures more than 1.5°C above the baseline average. Summer temperatures were near the baseline average in the remainder of the country.
Long description
The temperature departures map for summer 2016 shows that most of the Yukon, Northwest Territories and Nunavut experienced temperatures more than 1.5°C above the baseline average. Summer temperatures were near the baseline average in the remainder of the country.
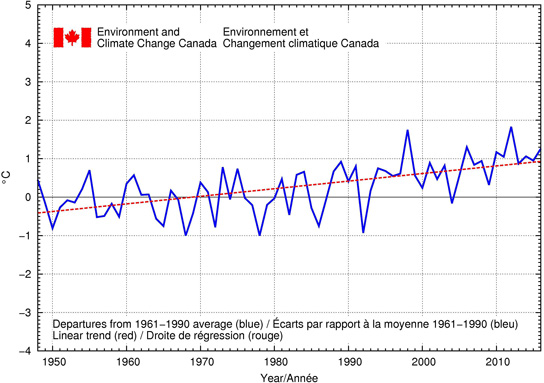
The time series graph (below) shows that, when averaged across the country, summer temperatures have fluctuated from year to year over the period 1948-2016. The linear trend indicates that summer temperatures averaged across the nation have warmed by 1.5°C over the past 69 years.
Long description
The time series graph shows that, when averaged across the country, summer temperatures have fluctuated from year to year over the period 1948-2016. The linear trend indicates that summer temperatures averaged across the nation have warmed by 1.5°C over the past 69 years.
Regional temperature
When examined on a regional basis, average summer temperatures for 2016 were among the 10 warmest on record since 1948 for seven of the eleven climate regions: the Pacific Coast (4th warmest at 1.3°C above average), the Mackenzie District (5th warmest at 1.8°C above average), the Yukon/North B.C. Mountains (5th warmest at 1.7°C above average), the Arctic Mountains and Fiords (7th warmest at 2.0°C above average), the Arctic Tundra (7th warmest at 1.7°C above average), the Great Lakes/St. Lawrence (8th warmest at 1.3°C above average), and the Northwestern Forest (10th warmest at 1.1°C above average). None of the eleven climate regions experienced an average summer temperature for 2016 that ranked among the 10 coldest since 1948. All eleven climate regions exhibit positive trends in summer temperatures over the 69 years of record. The strongest trend is observed in the Mackenzie District region (1.9°C) while the weakest trend (0.9°C) is found in the Prairies region. A table listing the regional and national temperature departures and rankings from 1948 to 2016 and a table that summarizes regional and national trends and extremes are available on request to ec.btvc-ctvb.ec@canada.ca.
Long description
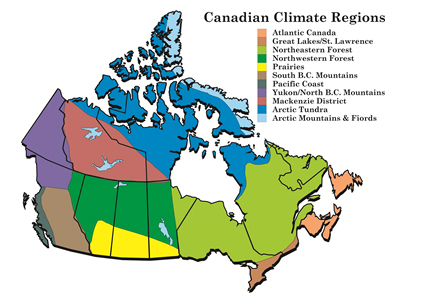
A map that shows the Canadian Climate Regions: Atlantic Canada, Great Lakes/St. Lawrence Lowlands, Northeastern Forest, Northwestern Forest, Prairies, South British Columbia Mountains, Pacific Coast, North British Columbia Mountains/Yukon, Mackenzie District, Arctic Tundra, Arctic Mountains and Fiords.
National precipitation
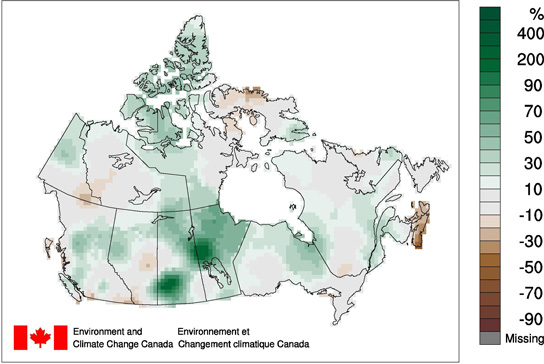
The national average precipitation for the summer of 2016 was 17.3% above the baseline average, based on preliminary data, making it the wettest summer since nationwide recording began in 1948. The driest summer was 1958 (13.9% below the baseline average). The precipitation percent departure map for the summer of 2016 (below) shows that conditions were wetter-than-average in most regions across the country, and particularly in Saskatchewan and Manitoba. A few small regions (most notably Nova Scotia) show slightly drier-than-average conditions.
Long description
The precipitation percent departure map for the summer of 2016 shows that conditions were wetter-than-average in most regions across the country, and particularly in Saskatchewan and Manitoba. A few small regions (most notably Nova Scotia) show slightly drier-than-average conditions.
It should be noted that "average" precipitation in northern Canada is generally much less than it is in southern Canada, and hence a percent departure in the north represents much less precipitation than the same percentage in the south. The national precipitations rankings are therefore often skewed by the northern departures and do not necessarily represent rankings for the volume of water falling on the country.
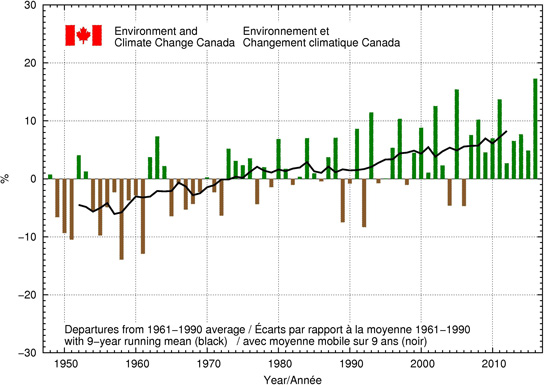
The precipitation percent departures graph (below) shows that, when averaged across the nation, summer precipitation amounts have tended to be wetter than the 1961-1990 average since the early 1970s.
Long description
The precipitation percent departures graph shows that, when averaged across the nation, summer precipitation amounts have tended to be wetter than the 1961-1990 average since the early 1970s.
Summer precipitation for 2016 was among the 10 wettest recorded since 1948 in four of the eleven climate regions: Northwestern Forest (wettest at 36.1% above average); Northeastern Forest (second wettest at 16.6 above average); the Arctic Tundra (fifth-wettest at 17.5% above average); and the Prairies (nine wettest at 25.9% above average). The summer of 2016 did not rank among the ten driest summers recorded since 1948 in any of the regions. A table listing the regional and national precipitation departures and rankings from 1948 to 2016 and a table that summarizes regional and national extremes are available on request to ec.btvc-ctvb.ec@canada.ca.