
Draft Screening Assessment Phthalate Substance Grouping: Appendices
Environment and Climate Change Canada
Health Canada
October 2017
Back to Draft Screening Assessment Phthalate Substance Grouping: Sections 1-8
Back to Draft Screening Assessment Phthalate Substance Grouping: Sections 9-10 and References
Table of contents
- Appendices
- Appendix A. Substance identity and key physico-chemical properties
- Appendix B. Cumulative risk based on narcosis
- Appendix C. Derivation of daily intakes for BBP, DBP and DEHP based on biomonitoring
- Appendix D. Intakes of BBP, DBP, DEHP, DnHP and DIOP from environmental media and food for the general population
- Appendix E. Derivation of dietary intakes
- Appendix F. Cumulative risk assessment total hazard index calculation
Appendix A. Substance identity and key physico-chemical properties
| Substance (CAS RN) |
Representative structure | Molecular weight (g/mol) |
Water solubility (mg/L) |
Octanol-water partition coefficient log Kow |
|---|---|---|---|---|
| DMP (131-11-3) |
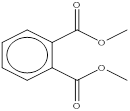 |
194.2 | 4000 (exp)a | 1.61 (exp)h |
| DEP (84-66-2) |
 |
222 | 930 (Exp)a | 2.47 (Exp)b |
| DPrP (131-16-8) |
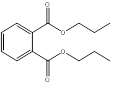 |
250 | 108 (exp)c | 3.27 (exp)c |
| DIBP (84-69-5) |
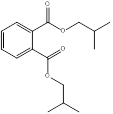 |
278.3 | 20.3 (exp)d | 2.91 (EpiSuite 2010; MCI estimate) 3.07 (EpiSuite 2010; log Kow estimate) |
| DBP (84-74-2) |
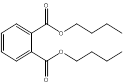 |
278.3 | 11.4 (exp)a | 4.46 (exp)a |
| CHIBP (5334-09-8) |
 |
304.4 | 6.6 (EpiSuite 2010; WATERNT) 0.323 (EpiSuite 2010; WSKOW) 6.66 (ACD Percepta 2012) 3.04 (VCCLab 2005) |
5.33 (EpiSuite 2010) 4.92 (ACD Percepta 2012) 4.28 (VCCLab 2005) |
| BCHP (84-64-0) |
 |
304.4 | 3.94 (EpiSuite 2010; WATERNT) 1.073 (EpiSuite 2010; WSKOW) 4.4 (ACD Percepta 2012) 3.4 (VCCLab 2005) |
5.41 (EpiSuite 2010) 5.02 (ACD Percepta 2012) 4.56 (VCCLab 2005) |
| BBP (85-68-7) |
 |
312.3 | 2.69 (Exp)a | 4.91 (Exp)a |
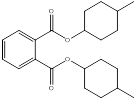
| DCHP (84-61-7) |
 |
330.4 | 1.01 (Exp)a | 4.82 (Exp)a |
| DnHP (84-75-3) |
 |
334 | 3.0 x 10⁻²(Exp)b | 6.82 (Exp)b |
| DBzP (523-31-9) |
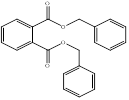 |
346.4 | 0.18 (EpiSuite 2010; WATERNT) 0.30 (EpiSuite 2010; WSKOW) 2.82 (ACD Percepta 2012) 0.72 (VCCLab 2005) |
5.08 (EpiSuite 2010) 5.09 (ACD Percepta 2012) 4.63 (VCCLab 2005) |
| B79P (68515-40-2) |
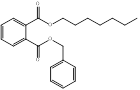  n-heptyl ester group and n-nonyl ester group (98%) 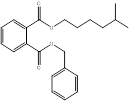 methyl hexyl ester group (2%) |
354 - 382 | 0.3 (Exp)a | 5.5 (Exp)a |
| DMCHP (27987-25-3) |
 |
358.5 | 0.24 (EpiSuite 2010; WATERNT) 5.38 × 10⁻³ (EpiSuite 2010; WSKOW) 0.46 (ACD Percepta 2012) 0.31 (VCCLab 2005) |
7.04 (EpiSuite 2010) 6.46 (ACD Percepta 2012) 5.47 (VCCLab 2005) |
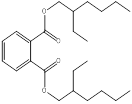
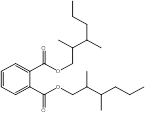
| DIHepP (71888-89-6) |
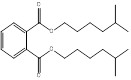 methyl hexyl ester groups (mixed isomers) (80%) 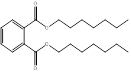 n-heptyl ester groups (20%) |
362.5 | 0.017 (exp)e | 80%: 7.41 (EpiSuite 2010) 6.42 (ACD Percepta 2012) 6.15 (VCCLab 2005) 20%: 7.56 (EpiSuite 2010) 7.92 (ACD Percepta 2012) 7.26 (VCCLab 2005) |
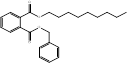
| 79P (111381-89-6) |
methyl hexyl ester group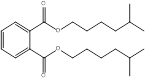 n-heptyl ester group 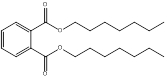 n-nonyl ester group 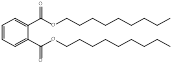 |
362 - 418 | 1.7 x 10⁻⁵ - 2.5 x 10⁻³ (EpiSuite 2010); 0.02 - 0.40 (ACD/Percepta 2012); 2.8 x 10⁻² - 3.3 x 10⁻¹ (VCCLab 2005) |
7.41 - 9.52 (EpiSuite 2010) 6.41 - 10.23 (ACD/Percepta 2012) 6.15 - 8.46 (VCCLab 2005) |
| BIOP (27215-22-1) |
dimethyl hexyl ester groups (95%)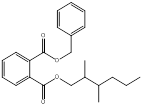 methyl heptyl ester groups (5%) 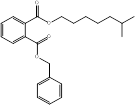 |
368.5 | 9.8 x 10⁻³ (EpiSuite 2010; WSKOW) 0.0254 (EpiSuite 2010; WATERNT) 0.423 (VCCLab 2005) 1.50 (ACD Percepta 2012) |
6.66 (KOWWIN) 5.87 (VCCLab 2005) 5.81 (ACD Percpeta 2012) |
| DIOP (27554-26-3) |
|
391 | 9.0 x 10⁻²(Exp)b | 75%: 8.24 (EpiSuite 2010) 7.52 (ACD Percepta 2012) 6.62 (VCCLab 2005) 25%: 8.39 (EpiSuite 2010) 7.96 (ACD Percepta 2012) 7.02 (VCCLab 2005) |
| DEHP (117-81-7) |
 |
390.6 | 3.0 x 10⁻³(Exp)a | 7.14 (Exp)a |
| DINP (68515-48-0/28553-12-0) |
methylethyl hexyl ester groups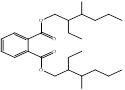 dimethyl heptyl ester groups 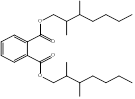 methyl octyl ester groups 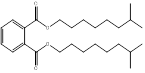 isodecyl ester groups 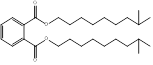 n-nonyl ester groups 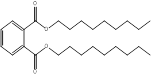 |
419 - 447 | 6.0 x 10⁻⁴(Exp)a | 8.8 - 9.7 (Exp)a |
| B84P (16883-83-3) |
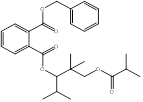 |
454.6 | 0.81 (Exp)g | 7 (Exp)a 7.00 (EpiSuite 2010) 6.52 (ACD Percepta 2012) 5.61 (VCCLab 2005) |
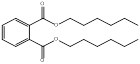
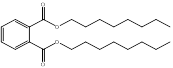
| 610P (68648-93-1) |
n-hexyl ester groups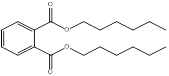 n-octyl ester groups 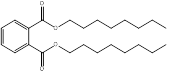 n-decyl ester groups 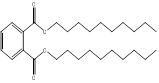 |
334 - 446 | 3.0 x 10⁻²(Exp)f | 8.17 (Exp)f |
| DnOP (117-84-0) |
 |
391 | 2.2 x 10⁻²(Exp)a | 8.10 (Exp)a |
| D911P (68515-43-5) |
n-nonyl ester groups n-decyl ester groups  n-undecyl ester groups  |
418- 475 | 1.6 x 10⁻⁷ - 1.7 x 10⁻⁵ (EpiSuite 2010) 1.9 x 10⁻³ - 2.3 x 10⁻² (ACD/Percepta 2012) 1.7 x 10⁻² - 2.8 x 10⁻² (VCCLab 2005) |
8.3 (Exp)a |
| D911P-2 (111381-91-0) |
n-nonyl ester groups n-decyl ester groups 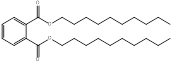 n-undecyl ester groups 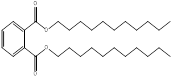 |
418 - 475 | 1.6 x 10⁻⁷- 1.7 x 10⁻⁵ (WSKOWWIN) 1.9 x 10⁻³ - 2.3 x 10⁻² (ACD/Percepta 2012) 1.7 x 10⁻² - 2.8 x 10⁻² (VCCLab 2005) |
8.3 (Exp)a |
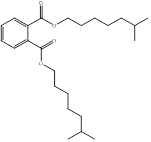
| DIDP (26761-40-0/68515-49-1) |
trimethyl heptyl ester groups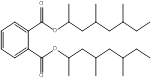 dimethyl octyl ester groups 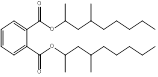 methyl nonyl ester groups 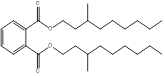 |
446 | 1.7 x 10⁻⁴(Exp)e | 10.06 - 10.36 (KOWWIN 2010) 8.31 - 8.62 (WSKOWWIN) 9.72 - 9.84 (ACD/Percepta 2012) |
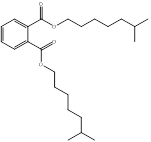
| DIUP (85507-79-5) |
dimethyl octyl ester groups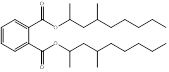 dimethyl nonyl ester groups 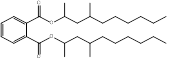 dimethyl decyl ester groups 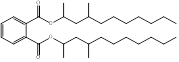 |
446 - 502 | 2.8 x 10⁻⁸ - 2.9 x 10⁻⁷ (EpiSuite 2010) 8.9 x 10⁻⁴ - 2.9 x 10⁻³ (ACD/Percepta 2012) 9.9 x 10⁻³ - 1.2 x 10⁻² (VCCLab 2005) |
11.29 - 12.17 (EpiSuite 2010) 10.48 - 11.66 (ACD/Percepta 2012) 8.89 - 9.36 (VCCLab 2005) |
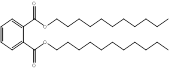
| DTDP (68515-47-9) |
dimethyl nonyl ester groups
|
474 - 502 | 2.5 x 10⁻¹⁰ - 2.9 x 10⁻⁷ (WSKOWWIN 2010) 9.9 x 10⁻⁵ - 2.9 x 10⁻³ (ACD/Percepta 2012) 9.9 x 10⁻³ - 1.2 x 10⁻² (VCCLab 2005) |
11.19 - 14.14 (KOWWIN 2010) 10.48 - 14.3 (ACD/Percepta 2012) 8.89 - 10.17 (VCCLab 2005) |
| DUP (3648-20-2) |
 |
475 | 1.6 x 10⁻⁷ (EpiSuite 2010) 1.9 x 10⁻³ (ACD Percepta 2012) 1.7 x 10⁻² (VCCLab 2005) |
8.7 (Exp)a |

Abbreviations: (Exp), Experimental values
Experimental data obtained from:
a. ECHA c2007-2015b;
b. HSDB 1983- ;
c. PhysProp 2006;
d. Haynes and Lide 2010;
e. Letinski et al. 2002;
f. ACC 2006;
g. European Commission 2000;
h. Renberg et al. 1985
Appendix B. Cumulative risk based on narcosis
| Substance (CAS RN) |
PECa (µg/L) |
BAF | Tissue residueb (mmol/kg BW) |
Toxic unitc |
|---|---|---|---|---|
| DMP (131-11-3) |
0.20 | 66 | 6.63 x 10⁻⁵ | 0.002 |
| DEP (84-66-2) |
1.98 | 14 | 1.25 x 10⁻⁴ | 0.003 |
| DPrP (131-16-8) |
0.03 | 17 | 2.33 x 10⁻⁶ | 0.00006 |
| DIBP (84-69-5) |
0.13 | 78 | 3.61 x 10⁻⁵ | 0.0009 |
| DBP (84-74-2) |
0.65 | 60 | 1.40 x 10⁻⁴ | 0.004 |
| CHIBP (5334-09-8) |
NC | 103 | 0 | 0.000 |
| BCHP (84-64-0) |
0.03 | 117 | 1.01 x 10⁻⁵ | 0.0003 |
| BBP (85-68-7) |
1.95 | 631 | 3.95 x 10⁻³ | 0.099 |
| DCHP (84-61-7) |
2.0 | 92 | 5.58 x 10⁻⁴ | 0.014 |
| DnHP (84-75-3) |
0.007 | 262 | 5.58 x 10⁻⁶ | 0.0001 |
| DBzP (523-31-9) |
0.01 | 17 | 5.56 x 10⁻⁷ | 0.00001 |
| B79P (68515-40-2) |
3.61 | 31 | 3.04 x 10⁻⁴ | 0.008 |
| DMCHP (27987-25-3) |
0.01 | 2070 | 6.03 x 10⁻⁵ | 0.002 |
| DIHepP (71888-89-6) |
0.33 | 115 | 1.05 x 10⁻⁴ | 0.003 |
| 79P (111381-89-6) |
0.003 | 381 | 2.83 x 10⁻⁶ | 0.00007 |
| BIOP (27215-22-1) |
0.008 | 47 | 9.85 x 10⁻⁷ | 0.00002 |
| DIOP (27554-26-3) |
0.34 | 293 | 2.58 x 10⁻⁴ | 0.006 |
| DEHP (117-81-7) |
1.41 | 41 | 1.47 x 10⁻⁴ | 0.004 |
| DINP (68515-48-0/28553-12-0) |
3.43 | 28 | 2.29 x 10⁻⁴ | 0.006 |
| B84P (16883-83-3) |
0.07 | 7 | 1.10 x 10⁻⁶ | 0.00003 |
| 610P (68648-93-1) |
0.006 | 372 | 5.47 x 10⁻⁶ | 0.0001 |
| DnOP (117-84-0) |
0.33 | 32 | 2.68 x 10⁻⁵ | 0.0007 |
| D911P (68515-43-5) |
0.62 | 415 | 5.78 x 10⁻⁴ | 0.014 |
| D911P-2 (111381-91-0) |
0.002 | 263 | 1.12 x 10⁻⁶ | 0.00003 |
| DIDP (26761-40-0/68515-49-1) |
1.23 | 11 | 3.03 x 10⁻⁵ | 0.0008 |
| DIUP (85507-79-5) |
0.044 | 10 | 9.18 x 10⁻⁷ | 0.00002 |
| DTDP (68515-47-9) |
0.004 | 1 | 8.20 x 10⁻⁹ | 0.0000 |
| DUP (3648-20-2) |
0.051 | 16 | 1.72 x 10⁻⁶ | 0.00004 |
| Sum of Internal Toxic Units | − | − | − | 0.2 |
Abbreviations: PEC, predicted environmental concentration; BAF, bioaccumulation factor; ITUs, internal toxic units; ITUmix, sum of internal toxic units for a mixture of substances; AF, assessment factor; NC, not calculated; −, not applicable.
a. This PEC was calculated using a dilution factor based on 50th percentile flow, with no limit.
b. The tissue residue is calculated by multiplying the PEC and BAF, and dividing by the molecular weight of the substance.
c. Toxic units for each substance are calculated by dividing the tissue residue by a critical body residue of 0.2 mmol/kgBW and an assessment factor of 5.
Appendix B2. Analysis of cumulative risk based on narcosis
Figure B-1: Phthalate contributions to total toxic units based on narcosis
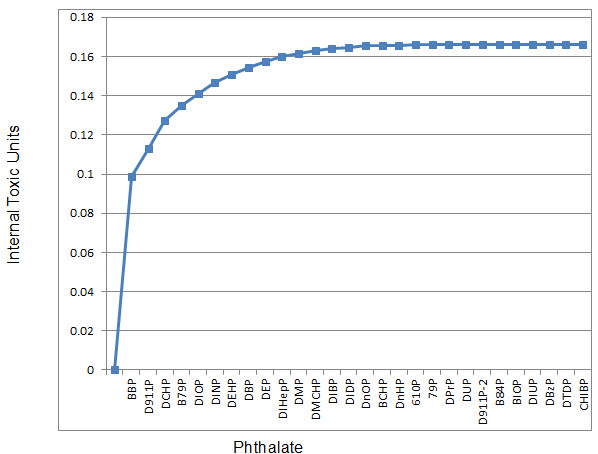
Long description for figure B-1
Phthalate contributions to total toxic units based on narcosis
Ten phthalates account for approximately 95% of cumulative risk based on narcosis. Total Internal Toxic Units were calculated as 0.2.
Appendix C. Derivation of daily intakes for BBP, DBP and DEHP based on biomonitoring
MIREC, P4 and MIREC-CD Plus:
Estimating daily intake concentration using 1 metabolite concentration (BBP)
Equation 1:
BBP daily intake (μg/kg bw. day) = Csum(moles/g Cr) × CER × MW of BBP / FUESum× BW
Where, CSum (moles/g Cr) = Sum of molar concentrations of metabolites, CER: 24 hour creatinine excretion rate (estimated using the Mage Equation), FUESum: Sum of fractional urinary excretion values of the metabolites = 0.73, = 312
Step 1: Conversion of concentrations
Cmetabolite (moles/g Cr) = Cmetabolite(μg/g Cr) / MWmetabolite
CMBzP (moles/g Cr) = Cmetabolite(μg/g Cr) /256g/mol
Step 2: Identify relevant FUE
FUE for MBzP is 0.73
Step 3: Compute DI for BBP using Equation 1.
Estimating daily intake concentration using multiple metabolite concentrations (DBP and DEHP).
Equation 1:
Phthalate daily intake(μg/kg bw. day) = Csum (moles/g Cr) × CER × MW of phthalate / FUESum × BW
Where CSum (moles/g Cr) = Sum of molar concentrations of metabolites, CER: 24 hour creatinine excretion rate (estimated using the Mage Equation), FUESum: Sum of FUE of the metabolites = 0.91 (DBP), 0.71 (DEHP), = 278 (DBP), 391 (DEHP)
Step 1: Converting the urinary metabolite concentration from µg/g Cr to moles/g Cr
Cmetabolite (moles/g Cr) = Cmetabolite Cr(μg/g Cr) / MWmetabolite
I. For DBP metabolites: MnBP and MHBPFootnote 15
CMnBP (moles/g Cr) = UCMnBP Cr(μg/g Cr) / 222 g/mol
CMHBP (moles/g Cr) = UCMHBP Cr(μg/g Cr) / 238 g/mol
Step 2: Sum the metabolite concentration (moles/g Cr) from Step 1Footnote 16
II. For DEHP metabolites: MEHP, MEOHP, MEHHP, MCMHP, MECPP
CMEHP (moles/g Cr) = UCMEHP Cr (μg/g Cr) / 278 g/mol
CMEOHP (moles/g Cr) = UCMEOHP Cr (μg/g Cr) / 292 g/mol
CMEHHP (moles/g Cr) = UCMEHHP Cr (μg/g Cr) / 294 g/mol
CMCMHP (moles/g Cr) = UCMCMHP Cr (μg/g Cr) / 308 g/mol
CMECPP (moles/g Cr) = UCMECPP Cr (μg/g Cr) / 308 g/mol
Step 2: Sum the metabolite concentration (moles/g Cr) from Step 1
I. For DBP metabolites in step 1
CSum (moles/g Cr) = ∑ CMnBP + CMHBP
II. For DEHP metabolites in step 1
CSum (moles/g Cr) = ∑ CMEHP + CMEOHP + CMEHHP + CMCMHP + CMECPP
Step 3: Calculate the sum of FUEs.
- DBP: FUEs for MnBP and MHBP are 0.84 and 0.069, respectively. Therefore, the sum would be 0.91 (P4 and MIREC-CD Plus) and the FUE for only MnBP is 0.84 (MIREC).
- DEHP: FUEs are MEHP (0.073), MEOHP (0.15), MEHHP (294), MCMHP (0.038) and MECPP (0.21). Therefore, the sum of all 5 metabolites would be 0.71 (P4 and MIREC-CD Plus) and the sum of the first 3 would be 0.46 (MIREC).
Step 4: Compute the daily intake using Equation 1.
CHMS
Statistical analysis: The data were analyzed with SAS 9.2 (SAS Institute Inc., USA) and SUDAAN 10.0.1 software (RTI International, USA). Variance estimates were produced using bootstrap weights, taking into account the 11 degrees of freedom for cycle 1 and 13 degrees of freedom for cycle 2 as suggested in CHMS data user guide. All analyses were weighted using the CHMS cycle 1 survey weights (phthalates sub-sample) and CHMS cycle 2 survey weights (environmental urine subsample) in order to be representative of the Canadian population. Phthalate concentrations that were below LOD were assigned a value of LOD/2.
Estimation of creatinine excretion rate (CER): For each study, participant creatinine excretion rate was calculated using the Mage equations (from (15)). The adiposity adjustment (discussed in the supplemental information (15)) was applied for all participants, and the body surface area adjustment was applied for children under the age of 18. Median BMIs by age for the adiposity adjustment were computed using the entire CHMS sample. The CHMS phthalate subsample dataset had 174 children who exceeded the height limits in the Mage equations (186 cm for males and 172 cm for females). The Mage equations were applied directly to the observed heights in order to extrapolate creatinine excretion rates for these participants. The predicted excretion rates for these individuals appeared to be reasonable despite the extrapolation.
Estimation of urinary excretion rate: For each selected phthalate, the urinary excretion rate was calculated using CER as follows
Equation 1
UER (μg/kg BW/day) = UCCr (μg / g Cr) × CER (g/day) / BW (kg)
UER is the body-weight adjusted urinary excretion rate. The UCCr is the creatinine-adjusted urinary phthalate concentration, and BW refers to the body-weight. The UER for individual participants were computed and used in the regression model (see below) to derive least square geometric mean (LSGM) estimates of UER for the Canadian population.
Daily intake estimation: The daily intake of each phthalate was estimated for each participant using the following equations (David et al. 2000; Koch et al. 2007):
Equation 2
Daily intake (μg/kg BW/day) = UER (μg/day × kg BW / FUE × MWD/MWM
The fractional urinary excretion (FUE) is defined as the fraction of the diester exposure dose excreted as monoesters in urine, calculated on mole-basis. For the daily intake estimations, previous works used FUE values of 0.73, 0.44, and 0.69 for BBP, DEHP, and DBP respectively (19, 21, 25; Koch et al. 2012). MWD and MWM are the molecular weights of the diester (312.36, 390.56, and 278.34 g/mole for BBP, DEHP, and DBP respectively) and the monoester (256.22, 865.02, and 222.24 g/mole for BBP, MEHP+MEHHP+MEOHP, and MBP) respectively.
For each selected phthalate diester, the daily intake for each study participants was computed using equation 2. Arithmetic and geometric means and selected percentiles along with their 95% confidence intervals of daily intake were produced for the Canadian population by age groups, sex and fasting status. Descriptive statistics were computed using SUDAAN proc DESCRIPT and SAS proc SURVEYREG.
Appendix D. Intakes of BBP, DBP, DEHP, DnHP and DIOP from environmental media and food for the general population
| Route of exposure | 0-0.5 yeara Breast-fedb |
0-0.5 yeara Formula-fedc |
0-0.5 yeara Not formula-fed |
0.5-4 yearsd | 5-11 yearse | 12-19 yearsf | 20-59 yearsg | 60+ yearsh |
|---|---|---|---|---|---|---|---|---|
| Ambient airi | less than 0.001 | less than 0.001 | less than 0.001 | less than 0.001 | less than 0.001 | less than 0.001 | less than 0.001 | less than 0.001 |
| Indoor airj | less than 0.001 (0.006) |
less than 0.001 (0.006) |
less than 0.001 (0.006) |
0.001 (0.013) |
0.001 (0.0101) |
less than 0.001 (0.005) |
less than 0.001 (0.004) |
less than 0.001 (0.004) |
| Drinking waterk | N/A | 0.0045 | 0.0017 | 0.0019 | 0.0015 | less than 0.001 | less than 0.001 | less than 0.001 |
| Food and beveragesl | less than 0.001 (0.016) |
less than 0.001 | NA | 0.43 (1.16) |
0.25 (0.61) |
0.15 (0.45) |
0.069 (0.22) |
0.049 (0.17) |
| Soilm | less than 0.001 | less than 0.001 | less than 0.001 | less than 0.001 | less than 0.001 | less than 0.001 | less than 0.001 | less than 0.001 |
| Dustn | 0.21 (2.59) |
0.21 (2.59) |
0.21 (2.59) |
0.15 (1.82) |
0.071 (0.86) |
0.0026 (0.031) |
0.0025 (0.029) |
0.0024 (0.028) |
| Total oral intake | 0.21 (2.61) |
0.21 (2.60) |
0.21 (2.60) |
0.58 (2.99) |
0.33 (1.48) |
0.15 (0.49) |
0.072 (0.25) |
0.051 (0.20) |
Abbreviations: [NA, Not Available; N/A, Not Applicable]
a. Assumed to weigh 7.5 kg, to breathe 2.1 m3 of air per day, to drink 0.2 L/day (not formula-fed) and to ingest 30 mg of soil per day. Consumption of food groups reported in Health Canada (1998). Median and 95th percentile dietary intake estimates (food) for the less than 6 months age group, as presented in Table D-1b, were used to represent dietary intake for this age group (applicable to formula- and non-formula-fed group).
b. Infants 0-6 months assumed to ingest 0.742 litre breast milk/day (USEPA 2011). MBzP the monoester metabolite of BBP was measured in breast milk in Canada as part of the Plastics and Personal Care Product Use in Pregnancy survey (P4, n = 31 women, 56 breast milk samples; personal communication from Environmental Health Science and Radiation Directorate [EHSRD] to ESRAB, October 2013; unreferenced). It was detected in 34% of samples, with half the limit of detection (LOD) (LOD=0.018 μg/L) and maximum (0.16 μg/L) used for exposure characterization.
c. Probabilistic intakes (median and 90th) were incorporated into the dietary intake table. Formula concentrations obtained from P4 study - BBP was not detected in any infant formula samples: one half the limit of detection (LOD=0.018 μg/L) was used for exposure characterization.
d. Assumed to weigh 15.5 kg, to breathe 9.3 m3 of air per day, to drink 0.7 L of water per day and to ingest 100 mg of soil per day. Consumption of food groups reported in Health Canada (1998). Median and 95th percentile dietary intake estimates (food) for the 1-3-year age group, as presented in Table D-1b, were used to represent dietary intake for this age group.
e. Assumed to weigh 31.0 kg, to breathe 14.5 m3 of air per day, to drink 1.1 L of water per day and to ingest 65 mg of soil per day. Consumption of food groups reported in Health Canada (1998). Median and 95th percentile dietary intake estimates (food) for the 4-8-year age group, as presented in Table D-1b, were used to represent dietary intake for this age group.
f. Assumed to weigh 59.4 kg, to breathe 15.8 m3 of air per day, to drink 1.2 L of water per day and to ingest 30 mg of soil per day. Consumption of food groups reported in Health Canada (1998). Highest median and 95th percentile dietary intake estimates (food) for the 9-13-year age group, as presented in Table D-1b, were used to represent dietary intake for this age group.
g. Assumed to weigh 70.9 kg, to breathe 16.2 m3 of air per day, to drink 1.5 L of water per day and to ingest 30 mg of soil per day. Consumption of food groups reported in Health Canada (1998). Highest median and 95th percentile dietary intake estimates (food) for the 19-30-year age group, as presented in Table D-1b, were used to represent dietary intake for this age group.
h. Assumed to weigh 72.0 kg, to breathe 14.3 m3 of air per day, to drink 1.6 L of water per day and to ingest 30 mg of soil per day. Consumption of food groups reported in Health Canada (1998). Highest median and 95th percentile dietary intake estimates (food) for the 71-year-old and over age group, as presented in Table D-1b, were used to represent dietary intake for this age group.
i. No Canadian data measuring BBP in ambient air were identified. Rudel et al. 2010 measured BBP in outdoor samples (40 homes) in N. California. Concentrations used in exposure characterization -half the method reporting limit (MRL=0.006 μg/m3), maximum: 0.0085 μg/m3.
j. No Canadian data measuring BBP in indoor air were identified. Tran and Kannan 2015 measured BBP in (20 homes) in Albany, NY, USA. Median (0.00299 μg/m3) and maximum (0.0247 μg/m3) concentrations were used in exposure characterization.
k. No data were identified regarding BBP concentrations in drinking water. BBP was not detected in any samples in a Canadian bottled water survey (Cao 2008). Half the method detection limit (MDL=0.085 μg/L) was used for semi-quantitative exposure characterization.
l. Probabilistic intakes (median and 95th) were incorporated into the dietary intake table. Intakes and methodology are outlined in Appendix E (see Table D-1b). Note gender and age groups do not fully match; therefore, the highest intake from within an age group was input into the table: e.g., male intakes (51-70 years) were input into the 60+ (unisex) column because this age group had the highest intake of all the groups in the 51-71-year range. NA, notates significant variation; therefore, estimates not presented.
m. The reported concentration of BBP in control agricultural soils (0.13 ng/g; Khosravi and Price 2015) was used to estimate potential exposures to BBP via soil.
n. The ingestion of indoor dust is considered a significant source of indoor exposure to phthalates, including BBP, and the amount of indoor dust ingested each day is based on Wilson et al. (2013). The median (42.3 μg/g) and 95th percentile (512 μg/g) of BBP in indoor dust, was used for exposure characterization (Kubwabo et al. 2013).
| DRI group | Median | 95th percentile |
|---|---|---|
| less than 6 months | NA | NA |
| 0.5-1 year | NA | 1.27 |
| 1-3 years | 0.43 | 1.16 |
| 4-8 years | 0.25 | 0.61 |
| M: 9-13 years | 0.15 | 0.45 |
| F: 9-13 years | 0.12 | 0.35 |
| M: 14-18 years | 0.11 | 0.32 |
| F: 14-18 years | 0.0798 | 0.27 |
| M: 19-30 years | 0.0692 | 0.22 |
| F: 19-30 years | 0.0646 | 0.22 |
| M: 31-50 years | 0.0509 | 0.17 |
| F: 31-50 years | 0.052 | 0.18 |
| M: 51-70 years | 0.0452 | 0.15 |
| F: 51-70 years | 0.0448 | 0.15 |
| M: greater than 71 years | 0.047 | NA |
| F: greater than 71 years | 0.049 | 0.17 |
NA; not available because of high cumulative variation.
| Route of exposure | 0-0.5 yeara Breast-fedb |
0-0.5 yeara Formula-fedc |
0-0.5 yeara Not formula-fed |
0.5-4 yearsd | 5-11 yearse | 12-19 yearsf | 20-59 yearsg | 60+ yearsh |
|---|---|---|---|---|---|---|---|---|
| Ambient airi | less than 0.001 (0.0012) |
less than 0.001 (0.0012) |
less than 0.001 (0.0012) |
less than 0.001 (0.0024) |
less than 0.001 (0.0019) |
less than 0.001 (0.0011) |
less than 0.001 | less than 0.001 |
| Indoor airj | 0.049 (0.27) |
0.049 (0.27) |
0.049 (0.27) |
0.11 (0.58) |
0.082 (0.45) |
0.046 (0.26) |
0.040 (0.22) |
0.035 (0.19) |
| Drinking waterk | N/A | 0.038 (0.18) |
0.014 (0.069) |
0.016 (0.078) |
0.013 (0.061) |
0.0072 (0.035) |
0.0075 (0.036) |
0.0079 (0.038) |
| Food and beveragesl | 0.065 (0.51) |
NA | NA | 0.69 (1.96) |
0.47 (1.16) |
0.30 (0.93) |
0.14 (0.44) |
0.12 (0.38) |
| Soilm | less than 0.001 | less than 0.001 | less than 0.001 | less than 0.001 | less than 0.001 | less than 0.001 | less than 0.001 | less than 0.001 |
| Dustn | 0.085 (0.48) |
0.085 (0.48) |
0.085 (0.48) |
0.060 (0.34) |
0.028 (0.16) |
0.001 (0.006) |
less than 0.001 (0.005) |
less than 0.001 (0.005) |
| Total oral intake | 0.199 (1.53) |
0.18 (0.95) |
0.15 (0.82) |
0.88 (2.96) |
0.59 (1.83) |
0.35 (1.23) |
0.19 (0.70) |
0.16 (0.61) |
Abbreviations: [NA, Not Available; N/A, Not Applicable].
a. Assumed to weigh 7.5 kg, to breathe 2.1 m3 of air per day, to drink 0.2 L/day (not formula-fed) and to ingest 30 mg of soil per day. Consumption of food groups reported in Health Canada (1998). Median and 95th percentile dietary intake estimates (food) for the less than 6 months age group, as presented in Table D-2b, were used to represent dietary intake for this age group (applicable to formula- and non-formula-fed group).
b. Infants 0-6 months assumed to ingest 0.742 litre breast milk/day (USEPA 2011). MBzP the monoester metabolite of DBP was measured in breast milk in Canada as part of the Plastics and Personal Care Product Use in Pregnancy survey (P4, n = 31 women, 56 breast milk samples; personal communication from Environmental Health Science and Radiation Directorate [EHSRD] to ESRAB, October 2013). It was detected in 100% of breast milk samples, with median (0.656 μg/L) and maximum (5.18 μg/L) values used for exposure characterization.
c. Probabilistic intakes (median and 90th) were incorporated into the dietary intake table. Intakes and methodology are outlined in Appendix E (see Table D-2b). NA, notates significant variation; therefore, estimates not presented.
d. Assumed to weigh 15.5 kg, to breathe 9.3 m3 of air per day, to drink 0.7 L of water per day and to ingest 100 mg of soil per day. Consumption of food groups reported in Health Canada (1998). Median and 95th percentile dietary intake estimates (food) for the 1-3-year age group, as presented in Table D-2b, were used to represent dietary intake for this age group.
e. Assumed to weigh 31.0 kg, to breathe 14.5 m3 of air per day, to drink 1.1 L of water per day and to ingest 65 mg of soil per day. Consumption of food groups reported in Health Canada (1998). Median and 95th percentile dietary intake estimates (food) for the 4-8-year age group, as presented in Table D-2b, were used to represent dietary intake for this age group.
f. Assumed to weigh 59.4 kg, to breathe 15.8 m3 of air per day, to drink 1.2 L of water per day and to ingest 30 mg of soil per day. Consumption of food groups reported in Health Canada (1998). Highest median and 90th percentile dietary intake estimates (food) for the 9-13-year age group, as presented in Table D-2b, were used to represent dietary intake for this age group.
g. Assumed to weigh 70.9 kg, to breathe 16.2 m3 of air per day, to drink 1.5 L of water per day and to ingest 30 mg of soil per day. Consumption of food groups reported in Health Canada (1998). Highest median and 95th percentile dietary intake estimates (food) for the 19-30-year age group, as presented in Table D-2b, were used to represent dietary intake for this age group.
h. Assumed to weigh 72.0 kg, to breathe 14.3 m3 of air per day, to drink 1.6 L of water per day and to ingest 30 mg of soil per day. Consumption of food groups reported in Health Canada (1998). Highest median and 95th percentile dietary intake estimates (food) for the 71-year-old and over age group, as presented in Table D-2b, were used to represent dietary intake for this age group.
i. No Canadian data measuring DBP in ambient air were identified. Rudel et al. 2010 measured DBP in outdoor samples (40 homes) in N. California. Concentrations used in exposure characterization -half the method reporting limit (MRL=0.007 μg/m3), maximum: 0.032 μg/m3.
j. Zhu et al. 2007 measured DBP in indoor air from samples collected in homes in Canada. Median (0.2 μg/m3) and maximum (1.1 μg/m3) concentrations were used in exposure characterization (Zhu et al. 2007).
k. No data were identified regarding DBP concentrations in drinking water. In the absence of data on levels of DBP in tap water, mean (0.357 μg/L) and maximum (1.72 μg/L) concentrations of DBP in bottled non-carbonated water were used for semi-quantitative exposure characterization (Cao et al. 2008).
l. Probabilistic intakes (median and 95th) were incorporated into the dietary intake table. Intakes and methodology are outlined in Appendix E (see Table D-2b). Note gender and age groups do not fully match; therefore, the highest intake from within an age group was input into the table: e.g., male intakes (51-70 years) were input into the 60+ (unisex) column because this age group had the highest intake of all the groups in the 51-71-year range. NA, notates significant variation; therefore, estimates not presented.
m. The reported concentration of DBP in control agricultural soils (0.14 ng/g; Khosravi and Price 2015) was used to estimate potential exposures to DBP via soil.
n. The ingestion of indoor dust is considered a significant source of indoor exposure to phthalates, including DBP, and the amount of indoor dust ingested each day is based on Wilson et al. (2013). The median (16.8 μg/g) and 95th percentile (95.4 μg/g) of DBP in indoor dust, was used for exposure characterization (Kubwabo et al. 2013).
| DRI group | Median | 95th percentile |
|---|---|---|
| less than 6 months | NA | NA |
| 0.5-1 year | NA | NA |
| 1-3 years | 0.69 | 1.96 |
| 4-8 years | 0.47 | 1.16 |
| M: 9-13 years | 0.30 | 0.93 |
| F: 9-13 years | 0.26 | 0.71 |
| M: 14-18 years | 0.21 | 0.65 |
| F: 14-18 years | 0.18 | 0.53 |
| M: 19-30 years | 0.14 | 0.44 |
| F: 19-30 years | 0.14 | 0.42 |
| M: 31-50 years | 0.13 | 0.37 |
| F: 31-50 years | 0.13 | 0.39 |
| M: 51-70 years | 0.12 | 0.35 |
| F: 51-70 years | 0.12 | 0.36 |
| M: greater than 71 years | 0.12 | 0.36 |
| F: greater than 71 years | 0.12 | 0.38 |
NA; not available because of high cumulative variation.
| Route of exposure | 0-0.5 yeara Breast-fedb |
0-0.5 yeara Formula-fedc |
0-0.5 yeara Not formula-fed |
0.5-4 yearsd | 5-11 yearse | 12-19 yearsf | 20-59 yearsg | 60+ yearsh |
|---|---|---|---|---|---|---|---|---|
| Ambient airi | less than 0.001 | less than 0.001 | less than 0.001 | 0.0015 (0.0017) |
0.0012 (0.0013) |
less than 0.001 | less than 0.001 | less than 0.001 |
| Indoor airj | 0.022 (0.52) |
0.022 (0.52) |
0.022 (0.52) |
0.046 (1.10) |
0.036 (0.86) |
0.021 (0.49) |
0.018 (0.42) |
0.015 (0.37) |
| Drinking waterk | N/A | 0.011 (0.036) |
0.0041 (0.014) |
0.0046 (0.015) |
0.0036 (0.012) |
0.0021 (0.0068) |
0.0022 (0.0072) |
0.0023 (0.0075) |
| Food and beveragesl | 0.13 (1.69) |
NA | 5.59 (17.24) |
8.76 (19.78) |
5.55 (13.58) |
3.45 (9.49) |
2.19 (6.14) |
2.19 (6.14) |
| Soilm | less than 0.001 | less than 0.001 | less than 0.001 | less than 0.001 | less than 0.001 | less than 0.001 | less than 0.001 | less than 0.001 |
| Dustn | 2.34 (9.53) |
2.34 (9.53) |
2.34 (9.53) |
1.64 (6.67) |
0.77 (3.15) |
0.028 (0.11) |
0.027 (0.11) |
0.026 (0.10) |
| Total oral intake | 2.49 (11.74) |
2.39 (10.31) |
7.96 (27.30) |
10.45 (27.57) |
6.36 (17.60) |
3.5 (10.10) |
2.24 (6.68) |
2.23 6.62) |
Abbreviations: [NA, Not Available; N/A, Not Applicable]
a. Assumed to weigh 7.5 kg, to breathe 2.1 m3 of air per day, to drink 0.2 L/day (not formula-fed) and to ingest 30 mg of soil per day. Consumption of food groups reported in Health Canada (1998). Median and 95th percentile dietary intake estimates (food) for the 0.5-1-year age group, as presented in Table D-3b, were used to represent dietary intake for this age group (applicable to formula- and non-formula-fed group).
b. Infants 0-6 months assumed to ingest 0.742 litre breast milk/day (USEPA 2011). MEHP the monoester metabolite of DEHP was measured in breast milk in Canada as part of the Plastics and Personal Care Product Use in Pregnancy survey (P4, n = 31 women, 56 breast milk samples; personal communication from Environmental Health Science and Radiation Directorate [EHSRD] to ESRAB, October 2013). It was detected in 100% of samples, with median (1.26 μg/L) and maximum (17.05 μg/L) used for exposure characterization.
c. Probabilistic intakes (median and 90th) were incorporated into the dietary intake table. Intakes and methodology are outlined in Appendix E (see Table D-3b). NA, notates significant variation; therefore, estimates not presented.
d. Assumed to weigh 15.5 kg, to breathe 9.3 m3 of air per day, to drink 0.7 L of water per day and to ingest 100 mg of soil per day. Consumption of food groups reported in Health Canada (1998). Median and 95th percentile dietary intake estimates (food) for the 1-3-year age group, as presented in Table D-3b, were used to represent dietary intake for this age group.
e. Assumed to weigh 31.0 kg, to breathe 14.5 m3 of air per day, to drink 1.1 L of water per day and to ingest 65 mg of soil per day. Consumption of food groups reported in Health Canada (1998). Median and 95th percentile dietary intake estimates (food) for the 4-8-year age group, as presented in Table D-3b, were used to represent dietary intake for this age group.
f. Assumed to weigh 59.4 kg, to breathe 15.8 m3 of air per day, to drink 1.2 L of water per day and to ingest 30 mg of soil per day. Consumption of food groups reported in Health Canada (1998). Highest median and 95th percentile dietary intake estimates (food) for the 9-13-year age group, as presented in Table D-3b, were used to represent dietary intake for this age group.
g. Assumed to weigh 70.9 kg, to breathe 16.2 m3 of air per day, to drink 1.5 L of water per day and to ingest 30 mg of soil per day. Consumption of food groups reported in Health Canada (1998). Highest median and 95th percentile dietary intake estimates (food) for the 51-70-year age group, as presented in Table D-3b, were used to represent dietary intake for this age group.
h. Assumed to weigh 72.0 kg, to breathe 14.3 m3 of air per day, to drink 1.6 L of water per day and to ingest 30 mg of soil per day. Consumption of food groups reported in Health Canada (1998). Highest median and 95th percentile dietary intake estimates (food) for the 51-70-year age group, as presented in Table D-3b, were used to represent dietary intake for this age group.
i. No Canadian data measuring DEHP in ambient air were identified. Rudel et al. 2010 measured DEHP in outdoor samples (40 homes) in N. California. Concentrations used in exposure characterization -half the method reporting limit (MRL=0.040 μg/m3), maximum: 0.023 μg/m3.
j. Zhu et al. 2007 measured DEHP in indoor air from samples collected in homes in Canada. Median (0.088 μg/m3) and maximum (2.1 μg/m3) concentrations were used in exposure characterization (Zhu et al. 2007).
k. No data were identified regarding DEHP concentrations in drinking water. In the absence of data on levels of DEHP in tap water, mean (0.102 μg/L) and maximum (0.338 μg/L) concentrations of DEHP in bottled non-carbonated water were were used for semi-quantitative exposure characterization (Cao et al. 2008).
l. Probabilistic intakes (median and 95th) were incorporated into the dietary intake table. Intakes and methodology are outlined in Appendix E (see Table D-3b). Note gender and age groups do not fully match; therefore, the highest intake from within an age group was input into the table: e.g., male intakes (51-70 years) were input into the 60+ (unisex) column because this age group had the highest intake of all the groups in the 51-71-year range. NA, notates significant variation; therefore, estimates not presented.
m. The reported concentration of DEHP in control agricultural soils (0.06 ng/g; Khosravi and Price 2015) was used to estimate potential exposures to DEHP via soil.
n. The ingestion of indoor dust is considered a significant source of indoor exposure to phthalates, including DEHP, and the amount of indoor dust ingested each day is based on Wilson et al. (2013). The median (462 μg/g) and 95th percentile (1880 μg/g) of DEHP in indoor dust, was used for exposure characterization (Kubwabo et al. 2013).
| DRI group | Median | 95th percentile |
|---|---|---|
| less than 6 months | NA | NA |
| 0.5-1 year | 5.59 | 17.24 |
| 1-3 years | 8.76 | 19.78 |
| 4-8 years | 5.55 | 13.58 |
| M: 9-13 years | 3.45 | 9.49 |
| F: 9-13 years | 3.23 | 9.19 |
| M: 14-18 years | 2.30 | 6.54 |
| F: 14-18 years | 2.12 | 6.20 |
| M: 19-30 years | 1.88 | 5.97 |
| F: 19-30 years | 2.12 | 6.06 |
| M: 31-50 years | 1.96 | 5.64 |
| F: 31-50 years | 2.18 | 6.03 |
| M: 51-70 years | 2.04 | 5.48 |
| F: 51-70 years | 2.19 | 6.14 |
| M: greater than 71 years | 2.02 | 5.30 |
| F: greater than 71 years | 2.17 | 5.05 |
NA; not available because of high cumulative variation.
| Route of exposure | 0-0.5 yeara Breastfedb |
0-0.5 yeara Formula-fedc |
0-0.5 yeara Not formula-fed |
0.5-4 yearsd | 5-11 yearse | 12-19 yearsf | 20-59 yearsg | 60+ yearsh |
|---|---|---|---|---|---|---|---|---|
| Food and beveragesi | NA | NA | NA | 0.0015 (0.037) |
0.0016 (0.036) |
0.001 (0.027) |
less than 0.001 (0.015) |
less than 0.001 (0.012) |
| Dustj | 0.019 (0.31) |
0.019 (0.31) |
0.019 (0.31) |
0.013 (0.22) |
0.0064 (0.10) |
less than 0.001 (0.0038) |
less than 0.001 (0.0036) |
less than 0.001 (0.0034) |
| Total oral intake | 0.019 (0.31) |
0.019 (0.31) |
0.019 (0.31) |
0.015 (0.26) |
0.008 (0.136) |
0.001 (0.031) |
less than 0.001 (0.019) |
less than 0.001 (0.015) |
a. Assumed to weigh 7.5 kg, to breathe 2.1 m3 of air per day, to drink 0.2 L/day (not formula-fed) and to ingest 30 mg of soil per day. Consumption of food groups reported in Health Canada (1998). Median and 90th percentile dietary intake estimates (food) for the less than 6 months age group, as presented in Table D-4b, were used to represent dietary intake for this age group (applicable to formula- and non-formula-fed group).
b. No data on the levels of DnHP in breast milk were identified in Canada or elsewhere.
c. No data on the levels of DnHP in infant formula were identified in Canada or elsewhere. Probabilistic intakes (median and 90th) were incorporated into the dietary intake table. However, the daily intakes for the less than 1 year age groups were unreliable and were not reported.
d. Assumed to weigh 15.5 kg, to breathe 9.3 m3 of air per day, to drink 0.7 L of water per day and to ingest 100 mg of soil per day. Consumption of food groups reported in Health Canada (1998). Median and 90th percentile dietary intake estimates (food) for the 1-3-year age group, as presented in Table D-4b, were used to represent dietary intake for this age group.
e. Assumed to weigh 31.0 kg, to breathe 14.5 m3 of air per day, to drink 1.1 L of water per day and to ingest 65 mg of soil per day. Consumption of food groups reported in Health Canada (1998). Median and 90th percentile dietary intake estimates (food) for the 4-8-year age group, as presented in Table D-4b, were used to represent dietary intake for this age group.
f. Assumed to weigh 59.4 kg, to breathe 15.8 m3 of air per day, to drink 1.2 L of water per day and to ingest 30 mg of soil per day. Consumption of food groups reported in Health Canada (1998). Highest median and 90th percentile dietary intake estimates (food) for the 9-13-year age group, as presented in Table D-4b, were used to represent dietary intake for this age group.
g. Assumed to weigh 70.9 kg, to breathe 16.2 m3 of air per day, to drink 1.5 L of water per day and to ingest 30 mg of soil per day. Consumption of food groups reported in Health Canada (1998). Highest median and 90th percentile dietary intake estimates (food) for the 19-30-year age group, as presented in Table D-4b, were used to represent dietary intake for this age group.
h. Assumed to weigh 72.0 kg, to breathe 14.3 m3 of air per day, to drink 1.6 L of water per day and to ingest 30 mg of soil per day. Consumption of food groups reported in Health Canada (1998). Highest median and 90th percentile dietary intake estimates (food) for the 51-70-year age group, as presented in Table D-4b, were used to represent dietary intake for this age group.
i. Probabilistic intakes (median and 90th) were incorporated into the dietary intake table. Intakes and methodology are outlined in Appendix E (see Table D-4b). Note gender and age groups do not fully match; therefore, the highest intake from within an age group was input into the table: e.g., male intakes (51-70 years) were input into the 60+ (unisex) column because this age group had the highest intake of all the groups in the 51-71-year range. NA, notates significant variation; therefore, estimates not presented.
j. The ingestion of indoor dust is considered a significant source of indoor exposure to phthalates, including DnHP, and the amount of indoor dust ingested each day is based on Wilson et al. (2013). The median (3.8 μg/g) and 95th percentile (62 μg/g) of DnHP in indoor dust, was used for exposure characterization (Kubwabo et al. 2013).
| DRI group | Median | 90th percentile |
|---|---|---|
| less than 6 months | NA | NA |
| 0.5-1 year | NA | NA |
| 1-3 years | 0.0015 | 0.037 |
| 4-8 years | 0.0016 | 0.036 |
| M: 9-13 years | 0.001 | 0.027 |
| F: 9-13 years | 0.0009 | 0.023 |
| M: 14-18 years | 0.0008 | 0.020 |
| F: 14-18 years | 0.0005 | 0.013 |
| M: 19-30 years | 0.0007 | 0.015 |
| F: 19-30 years | 0.0004 | 0.010 |
| M: 31-50 years | 0.0006 | 0.012 |
| F: 31-50 years | 0.0004 | 0.0095 |
| M: 51-70 years | 0.0005 | 0.012 |
| F: 51-70 years | 0.0004 | 0.009 |
| M: greater than 71 years | 0.0005 | 0.011 |
| F: greater than 71 years | 0.0005 | 0.009 |
NA; not available because of high cumulative variation.
| Route of exposure | 0-0.5 yeara | 0.5-4 yearsb | 5-11 yearsc | 12-19 yearsd | 20-59 yearse | 60+ yearsf |
|---|---|---|---|---|---|---|
| Dustg | 0.033 (0.14) |
0.023 (0.099) |
0.011 (0.047) |
less than 0.001 (0.0017) |
less than 0.001 (0.0016) |
less than 0.001 (0.0015) |
a. Assumed to weigh 7.5 kg, to breathe 2.1 m3 of air per day, to drink 0.2 L/day (not formula-fed) and to ingest 30 mg of soil per day.
b. Assumed to weigh 15.5 kg, to breathe 9.3 m3 of air per day, to drink 0.7 L of water per day and to ingest 100 mg of soil per day.
c. Assumed to weigh 31.0 kg, to breathe 14.5 m3 of air per day, to drink 1.1 L of water per day and to ingest 65 mg of soil per day.
d. Assumed to weigh 59.4 kg, to breathe 15.8 m3 of air per day, to drink 1.2 L of water per day and to ingest 30 mg of soil per day.
e. Assumed to weigh 70.9 kg, to breathe 16.2 m3 of air per day, to drink 1.5 L of water per day and to ingest 30 mg of soil per day.
f. Assumed to weigh 72.0 kg, to breathe 14.3 m3 of air per day, to drink 1.6 L of water per day and to ingest 30 mg of soil per day.
g. The ingestion of indoor dust is considered a significant source of indoor exposure to phthalates, including DIOP, and the amount of indoor dust ingested each day is based on Wilson et al. (2013). The median (6.6 μg/g) and 95th percentile (28.6 μg/g) of DIOP in indoor dust, was used for exposure characterization (personal communication from EHSRD, Health Canada, to ESRAB, Health Canada, August 2014).
Appendix E. Derivation of dietary intakes
Occurrence data - DINP, DIDP, DMP, DIBP, DCHP, BBP, DBP, DEHP and DnHP
Phthalate occurrence data from the 2013 Canadian Total Diet Study (TDS) were prioritized for estimating dietary exposures. This dataset was determined to be the most comprehensive Canadian survey on the occurrence of phthalates in foods, and results were available for DiBP, BBP, DBP, and DEHP. For other phthalates, occurrence data in food were first taken from the 2013-2014 and 2014-2015 Food Safety Action Plan (FSAP) surveys conducted by the Canadian Food Inspection Agency (CFIA) and/or from a Total Diet Study conducted in the United States (US; Schecter et al. 2013), considering the similarity between samples analyzed in these studies and products available on the Canadian market. Occurrence data in foods that were not covered by the CFIA or the U.S. TDS datasets were supplemented by data from a British Total Diet Study (Bradley et al. 2013b). Note that these data were only used to fill data gaps and that duplicate occurrence data from the British TDS for a given food or phthalate were not included if such data were already available from the CFIA or the U.S. TDS datasets.
Results for phthalates in food that were reported as less than the analytical limit of detection (LOD) were assigned values of ½LOD. However, a value of 0 (zero) was assigned to all samples within a broad food category when no phthalates were detected above the LOD in any sample in that category.
The following table indicates the source(s) of occurrence data used to derive dietary exposure estimates for each phthalate.
| Phthalate | Canadian TDS (2013) |
CFIA - FSAP (2013-2015) |
Schecter et al. 2013 (U.S. TDS) |
Bradley et al. 2013b (British TDS) |
|---|---|---|---|---|
| DiNP | - | X | - | X |
| DiDP | - | X | - | X |
| DMP | - | - | X | X |
| DiBP | X | - | - | - |
| DCHP | - | - | X | X |
| BBP | X | - | - | - |
| DBP | X | - | - | - |
| DEHP | X | - | - | - |
| DnHP | - | - | X | - |
X = Source of occurrence data.
= No data.
Note: DINP and DIDP intakes were unchanged from those presented in the SOS report. DIBP was monitored in Health Canada's 2013 TDS (Cao et al. 2015) however, intakes using this new data showed no signicant changes. For DCHP and DMP, the 2013 TDS data showed low detection frequencies; therefore, previous intake estimates are still presented in this draft screening assessment.
Food consumption data and matching to occurrence data
The phthalate concentrations in individual foods were matched to consumption figures for these foods from the 2004 Canadian Community Health Survey (CCHS) on nutrition (Statistics Canada 2004) to generate distributions of phthalate exposure for various age-sex groups. The CCHS included 24-hour dietary recall information for over 35,000 respondents of all ages across Canada.
Body weight information
For the purpose of determining per kilogram body weight exposure estimates, infant (0 to 1 year old) body weights were set to the mean body weights as derived from the body weight data from the United States Department of Agriculture Continuing Survey of Food Intakes by Individuals (1994-96 and 1998). For all other age groups, body weights reported in the CCHS, whether measured or self-reported, were used and where missing were imputed using the median for the corresponding age-sex group and quintile of energy intake.
Probabilistic exposure assessment
For each food consumed by a respondent in the CCHS, phthalate concentrations were randomly selected from the matching list of assayed values. For each individual respondent, exposure estimates from each food were summed, generating a distribution of exposure for all respondents. This was repeated 500 times (500 iterations) to model the variability of the distribution of exposures because of the variability of the phthalates levels. For each age-sex group, the median and 90th percentile exposures were derived from the empirical distribution generated by the 500 iterations.
Appendix F. Cumulative risk assessment total hazard index calculation
| Phthalate | Age group (sex) |
Intake (upper-bound; μg/kg bw/day) |
Reference (i.e., CHMS, NHANES) |
|---|---|---|---|
| DIBP | 3-5 years (M+F) | 3.70 | CHMS Cycle 2 |
| DIBP | 6-11 years (M+F) | 5.30 | CHMS Cycle 2 |
| DIBP | 19+ years (pregnant F) | 1.20 | P4 |
| DCHP | 3-5 years (M+F) | 0 | CHMS Cycle 2 |
| DCHP | 6-11 years (M+F) | 0 | CHMS Cycle 2 |
| DCHP | 12-19 years (F) | 0 | CHMS Cycle 2 |
| DINP | 2-3 years | 5.2 | MIREC-CD Plus |
| DINP | 6-11 years (M) | 25.00 | NHANEs (09-10) |
| DINP | 12-19 years (F) | 27.00 | NHANEs (09-10) |
| Phthalate | Age group (sex) |
Intake (upper-bound; μg/kg bw/day) |
Reference (i.e., CHMS, NHANES) |
|---|---|---|---|
| BBP | 3-5 years (M+F) | 4.50 | CHMS Cycle 2 |
| BBP | 6-11 years (M) | 3.4 | CHMS Cycle 2 |
| BBP | 19+ years (pregnant F) | 3.01 | P4 |
| DBP | 3-5 years (M+F) | 5.3 | CHMS Cycle 2 |
| DBP | 6-11 years (F) | 5.3 | CHMS Cycle 2 |
| DBP | 19+ years (pregnant F) | 4.11 | P4 |
| DEHP | 3-5 years (M+F) | 12.00 | CHMS Cycle 2 |
| DEHP | 6-11 years (M) | 12.00 | CHMS Cycle 2 |
| DEHP | 18+ years (pregnant F) | 8.42 | MIREC |
| Phthalate | Age group (sex) |
Intake (upper-bound; μg/kg bw/day) |
Type of exposure (i.e., food, dust, indoor air) |
|---|---|---|---|
| DIBP | 0-6 months (M+F) | 5.90 | Food+dust+air+drinking water |
| DIBP | 5-11 years (M+F) | 0.78 | Food+dust+air+drinking water |
| DIBP | 12-19 years (M+F) | 0.43 | Food+dust+air+drinking water |
| DCHP | 0.5-4 years (M+F) | 0.15 | Food+dust |
| DCHP | 5-11 years (M+F) | 0.12 | Food+dust |
| DCHP | 12-19 years (M+F) | 0.07 | Food+dust |
| DMCHP* | 0-0.5 years (M+F) | 0.05 | Dust |
| DMCHP* | 5-11 years (M+F) | 0.02 | Dust |
| DMCHP* | 12-19 years (M+F) | 0.00 | Dust |
| DBzP* | 0-0.5 years (M+F) | 0.097 | Dust |
| DBzP* | 5-11 years (M+F) | 0.032 | Dust |
| DBzP* | 12-19 years (M+F) | 0.001 | Dust |
| B84P | 0-6 months (M+F) | 0.05 | Dust (B79P surrogate) |
| B84P | 5-11 years (M+F) | 0.02 | Dust (B79P surrogate) |
| B84P | 12-19 years (M+F) | 0.00 | Dust (B79P surrogate) |
| B79P | 0-6 months (M+F) | 0.05 | Dust |
| B79P | 5-11 years (M+F) | 0.02 | Dust |
| B79P | 12-19 years (M+F) | 0.00 | Dust |
| DIHepP | 0-6 months (M+F) | 1.1 | Dust |
| DIHepP | 5-11 years (M+F) | 0.37 | Dust |
| DIHepP | 12-19 years (M+F) | 0.013 | Dust |
| DINP | 6 months-4 years (M+F) | 19.70 | Food+dust |
| DINP | 5-11 years (M+F) | 14.90 | Food+dust |
| DINP | 12-19 years (M+F) | 11.43 | Food+dust |
| CHIBP | NIC | NIC | NIC |
| BCHP | NIC | NIC | NIC |
| BIOP | NIC | NIC | NIC |
NIC = Not in commerce.
*NIC but detected in Canadian house dust.
| Phthalate | Age group (sex) |
Intake (upper-bound; μg/kg bw/day) |
Type of exposure (i.e., food, dust, indoor air) |
|---|---|---|---|
| BBP | 6 months-4 years (M+F) | 2.99 | Food+dust+air+drinking water+soil |
| BBP | 5-11 years (M+F) | 1.48 | Food+dust+air+drinking water+soil |
| BBP | 12-19 years (M+F) | 0.49 | Food+dust+air+drinking water+soil |
| DBP | 6 months-4 years (M+F) | 2.96 | Food+dust+air+drinking water+soil |
| DBP | 5-11 years (M+F) | 1.83 | Food+dust+air+drinking water+soil |
| DBP | 12-19 years (M+F) | 1.23 | Food+dust+air+drinking water+soil |
| DEHP | 0.5-4 years (M+F) | 27.57 | Food+dust+air+drinking water+soil |
| DEHP | 5-11 years (M+F) | 17.60 | Food+dust+air+drinking water+soil |
| DEHP | 12-19 years (M+F) | 10.10 | Food+dust+air+drinking water+soil |
| DnHP* | 0-6 months (M+F) | 0.31 | Food+dust |
| DnHP | 5-11 years (M+F) | 0.136 | Food+dust |
| DnHP | 12-19 years (M+F) | 0.031 | Food+dust |
| DIOP | 0-6 months (M+F) | 0.14 | Dust |
| DIOP | 5-11 years (M+F) | 0.05 | Dust |
| DIOP | 12-19 years (M+F) | 0.002 | Dust |
*NIC but detected in Canadian house dust.
| Phthalate | Life stage | NOAEL (mg/kg bw/day) |
Effects (duration); (reference) |
Default uncertainty factor | Calculated reference value |
|---|---|---|---|---|---|
| DIBP | In utero | 125 | Reduced AGD, NR, effects on fertility (GD12-21), ↓ testicular testosterone; (Saillenfait et al. 2008; Furr et al. 2014) | 100 | 1.25 |
| DIBP | (Pre)pubertal | 300 | Testicular pathology (PND21-28, 7 days); (Zhu et al. 2010) | 300 | 1 |
| DCHP/DMCHP | In utero | 10-20 (LOAEL) |
↓ AGD, TP, increase resorption (GD6-19); (Ahbab and Barlas 2015; Li et al. 2016; Hoshino et al. 2005) | 100 | 0.1 |
| DCHP/DMCHP | (Pre)pubertal | 18 | ↓ spermatid head counts, testicular atrophy, ↓ body weight gain, ↓ food consumption in F1 males; (Hoshino et al. 2005) | 300 | 0.06 |
| DBzP (MBzP) |
In utero | 167 | Read across from MBzP ↓ AGD (~10%) and ↑ cryptorchidism (GD15-17); (Ema et al. 2003) |
100 | 1.67 |
| DBzP (MBzP) |
(Pre)pubertal | 250 (LOEL) |
Read across from MBzP ↓ sperm count (20%) (4 weeks); (Kwack et al. 2009) | 300 | 0.833 |
| B84P (BBP) |
In utero | 50 | Read across from BBP Decreased pup body weight, decreased ↓ AGD at birth in F2 (based on two-generation studies) ↓ testicular testosterone levels (GD14-18); (Aso et al. 2005; Nagao et al. 2000; Tyl et al. 2004; Furr et al. 2014) |
100 | 0.5 |
| B84P (BBP) |
(pre)pubertal | 250-500 (LOEL) |
Read across from MBzP and BBP ↓ sperm count (20%) (4 weeks); (Kwack et al. 2009) | 300 | 0.833 |
| B79P | In utero | 50 | ↓ AGD and ↑ epispadis (GD6-PND21) (REACH dossier; (ECHA 2013b); ECHA 2013b) | 100 | 0.5 |
| B79P | (Pre)pubertal | 375 | No adverse effects at the highest dose tested; Tyl et al. 2013 | 300 | 1.25 |
| DIHepP | In utero | 64-168 | significant reduction in AGD (13%) in male F2 pups (2 gen); (McKee et al. 2006) | 100 | 0.64 |
| DIHepP | (Pre)pubertal | 227-416 | Significant reduction in AGD. Delayed PPS, ↑ nipple retention, hypospadias and cryptorchidism in F1 pups (2 gen); (McKee et al. 2006) | 300 | 0.757 |
| DINP | In utero | 10 (LOEL) |
MNGs, Leydig cell clusters/aggregation (GD12-21); (Li et al. 2015) | 100 | 0.1 |
| DINP | (Pre)pubertal | 500 (LOEL) |
Decreased absolute seminal vesicle and LABC weights (10 days), castrated animals; (Lee and Koo 2007) | 300 | 0.333 |
| Additional phthalate | Life stage | NOAEL (mg/kg bw/d) |
Effects (duration); (reference) |
Reference | Default uncertainty factor | Calculated reference value |
|---|---|---|---|---|---|---|
| BBP | In utero | 50 | ↓ AGD at birth in F2 (based on two two-generation studies); Aso et al. 2005; (Tyl et al. 2004; Nagao et al. 2000) |
Aso et al. 2005; Tyl et al. 2004; Nagao et al. 2000 |
100 | 0.5 |
| BBP | (Pre)pubertal | 500 (LOEL) |
↓ sperm count (30%), ↓ sperm motility, ↓ body weight gain, ↑ rel. liver weight (4 weeks); (Kwack et al. 2009) |
Kwack et al. 2009 | 300 | 1.667 |
| DBP | In utero | 10 | ↓ testicular testosterone (GD12-19), fertility effects (GD14-23.5), ↓ in tubular and interstitial cell populations, altered seminiferous tubule morphometry, other mild effects on spermatocyte development (GD12-21); (Lehmann et al. 2004; Ahmad et al. 2014; Boekelheide et al. 2009) |
Lehmann et al. 2004; Ahmad et al. 2014; Boekelheide et al. 2009 |
100 | 0.1 |
| DBP | (Pre)pubertal | 10-50 (LOEL) |
LOEL: delayed spermatogenesis, reduced absolute AGD (relative to BW at higher dose) in mice (PND 4-14); (Moody et al. 2013; Srivastava et al. 1990; Xioa-feng et al. 2009) |
Moody et al. 2013; Srivastava et al. 1990; Xioa-feng et al. 2009 |
300 | 0.033 |
| DEHP | In utero | 4.8 | Small and/or aplastic epididymis, testicular pathology other RPS effects in F1 and F2 (2-gen study); (Blystone et al. 2010; Wolfe and Layton 2003; Andrade et al. 2006a,b; Christiansen et al. 2010) |
Blystone et al. 2010; Wolfe and Layton 2003; Andrade et al. 2006a,b; Christiansen et al. 2010 |
100 | 0.048 |
| DEHP | (Pre)pubertal | 10 | ↓ absolute and relative testis weight (greater than 10%) (PND 6-10, 5 days exposure); (Dostal et al. 1988) |
Dostal et al. 1988 | 300 | 0.033 |
| DnHP | In utero | 5 | ↓ serum/ testicular testosterone levels, ↓ AGD, testicular pathological changes (GD12-19, GD 6-19); (Ahbab and Barlas 2015; Saillenfait et al. 2013) |
Ahbab and Barlas 2015; Saillenfait et al. 2013 |
100 | 0.05 |
| DnHP | (Pre)pubertal | 10 | Read across from DEHP ↓ absolute and relative testis weight (greater than 10%) (PND6-10, 5 days exposure); (Dostal et al. 1988) |
Dostal et al. 1988 | 300 | 0.033 |
| DIOP | In utero | 100 | testicular pathological changes, fertility effects and ↓ testis weight (GD12-19, GD12-21, GD6-19); (Saillenfait et al. 2013) |
Saillenfait et al. 2013 | 100 | 1 |
| DIOP | (Pre)pubertal | 227-416 | Read across from DIHepP Significant reduction in AGD. Delayed PPS, ↑ nipple retention, hypospadias and cryptorchidism in F1 pups (2 gen study); (McKee et al. 2006) |
McKee et al. 2006 | 300 | 0.757 |
| Phthalate | Environmental media and food; hazard quotient (% of HI) |
Biomonitoring; hazard quotient (% of HI) |
|---|---|---|
| DIBP | 0.0003 (0.1%) |
0.0010 (0.4%) |
| DCHP | 0.0007 (0.3%) |
0.0000 (0.0%) |
| DMCHP | 0.0000 (0.0%) |
N/A |
| DBzP | 0.0000 (0.0%) |
N/A |
| B84P | 0.0000 (0.0%) |
N/A |
| B79P | 0.0000 (0.0%) |
N/A |
| DIHepP | 0.0000 (0.0%) |
N/A |
| DINP | 0.0072 (3.1%) |
0.0170 (7.1%) |
| CHIBP | 0.0000 (0.0%) |
N/A |
| BCHP | 0.0000 (0.0%) |
N/A |
| BIOP | 0.0000 (0.0%) |
N/A |
| BBP | 0.0010 (0.4%) |
0.0060 (2.5%) |
| DBP | 0.0123 (5.3%) |
0.0411 (17.1%) |
| DEHP | 0.2104 (90.5%) |
0.1754 (72.9%) |
| DnHP | 0.0006 (0.3%) |
N/A |
| DIOP | 0.0000 (0.0%) |
N/A |
| HI for pregnant women | 0.23 | 0.24 |
N/A = Not applicable.
| Phthalate | Environmental media and food; hazard quotient (% of HI) |
Biomonitoring; hazard quotient (% of HI) |
|---|---|---|
| DIBP | 0.0047 (0.6%) |
0.0030 (0.8%) |
| DCHP | 0.0015 (0.2%) |
0.0000 (0.0%) |
| DMCHP | 0.0002 (0.0%) |
N/A |
| DBzP | 0.0001 (0.0%) |
N/A |
| B84P | 0.0001 (0.0%) |
N/A |
| B79P | 0.0001 (0.0%) |
N/A |
| DIHepP | 0.0017 (0.2%) |
N/A |
| DINP | 0.1970 (24.0%) |
0.0520 (14.2%) |
| CHIBP | 0.0000 (0.0%) |
N/A |
| BCHP | 0.0000 (0.0%) |
N/A |
| BIOP | 0.0000 (0.0%) |
N/A |
| BBP | 0.0060 (0.7%) |
0.0090 (2.5%) |
| DBP | 0.0296 (3.6%) |
0.0530 (14.4%) |
| DEHP | 0.5743 (70.0%) |
0.2500 (68.1%) |
| DnHP | 0.0062 (0.8%) |
N/A |
| DIOP | 0.0001 (0.0%) |
N/A |
| HI for infants | 0.82 | 0.37 |
N/A = Not applicable.
| Phthalate | Environmental media and food; hazard quotient (% of HI) |
Biomonitoring; hazard quotient (% of HI) |
|---|---|---|
| DIBP | 0.0008 (0.1%) |
0.0053 (1.0%) |
| DCHP | 0.0020 (0.3%) |
0.0000 (0.0%) |
| DMCHP | 0.0003 (0.0%) |
N/A |
| DBzP | 0.0000 (0.0%) |
N/A |
| B84P | 0.0000 (0.0%) |
N/A |
| B79P | 0.0000 (0.0%) |
N/A |
| DIHepP | 0.0015 (0.3%) |
N/A |
| DINP | 0.0089 (1.5%) |
0.0150 (2.8%) |
| CHIBP | 0.0000 (0.0%) |
N/A |
| BCHP | 0.0000 (0.0%) |
N/A |
| BIOP | 0.0000 (0.0%) |
N/A |
| BBP | 0.0009 (0.1%) |
0.0020 (0.4%) |
| DBP | 0.0555 (9.1%) |
0.1590 (29.4%) |
| DEHP | 0.5333 (87.4%) |
0.3600 (66.5%) |
| DnHP | 0.0041 (0.7%) |
N/A |
| DIOP | 0.0001 (0.0%) |
N/A |
| HI for children | 0.61 | 0.54 |
N/A = Not applicable.
Footnotes
- Footnote 1
-
The Chemical Abstracts Service Registry Number (CAS RN) is the property of the American Chemical Society and any use or redistribution, except as required in supporting regulatory requirements and/or for reports to the Government of Canada when the information and the reports are required by law or administrative policy, is not permitted without the prior, written permission of the American Chemical Society.
- Footnote 2
-
A determination of whether one or more of the criteria of section 64 of CEPA are met is based upon an assessment of potential risks to the environment and/or to human health associated with exposures in the general environment. For humans, this includes, but is not limited to, exposures from ambient and indoor air, drinking water, foodstuffs and products used by consumers. A conclusion under CEPA is not relevant to, nor does it preclude, an assessment against the hazard criteria specified in the Hazardous Products Regulations, which are part of the regulatory framework for the Workplace Hazardous Materials Information System for products intended for workplace use. Similarly, a conclusion based on the criteria contained in section 64 of CEPA does not preclude actions being undertaken under other sections of CEPA or other Acts.
- Footnote 3
-
In this assessment, the term "wastewater treatment system" refers to a system that collects domestic, commercial and/or institutional household wastewater and possibly industrial wastewater (following discharge to the sewer), typically for treatment and eventual discharge to the environment. Unless otherwise stated, the term wastewater treatment system makes no distinction of ownership or operator type (municipal, provincial, federal, indigenous, private, partnerships). Systems located at industrial operations and specifically designed to treat industrial effluents will be identified by the terms "on-site wastewater treatment systems" or "industrial wastewater treatment systems".
- Footnote 4
-
See section 8.3 Characterization of Ecological Risk.
- Footnote 5
-
10% dermal absorption factor was used for all products except diaper creams (see approach for characterizing dermal absorption for DMP in SCP SOS report (Environment Canada, Health Canada 2015a).
- Footnote 6
-
In the absence of an appropriate analytical method for measuring B84P in dust, and because similar quantities and uses were reported in Canada (Environment Canada 2014), B79P dust intakes were used as a surrogate for B84P dust exposure.
- Footnote 7
-
For the purpose of this document, a personal care product is defined as a substance or mixture of substances, in a product, that is generally recognized by the public for use in daily cleansing or grooming. Depending on how the product is represented for sale and its composition, personal care products may fall into one of three regulatory categories in Canada, cosmetics, drugs or natural health products.
- Footnote 8
-
Mono(2-ethyl hexyl)phthalate [MEHP], Mono(2-ethyl-5-oxohexyl)phthalate [MEOHP], Mono(2-ethyl-5hydroxyhexyl)phthalate [MEHHP].
- Footnote 9
-
MEHP, MEOHP, MEHHP, Mono[2-(carboxymethyl)hexyl]phthalate [MCMHP], Mono(2-ethyl-5-hydroxyhexyl)phthalate [MECPP].
- Footnote 10
-
MEHP, MEOHP, MEHHP.
- Footnote 11
-
MEHP, MEOHP, MEHHP, MCMHP, MECPP.
- Footnote 12
-
The 2014 TDS data were not available at the time that the dietary exposure estimates that are presented in this report were generated.
- Footnote 13
-
MEHP, MEHHP, MEOHP.
- Footnote 14
-
In all cases, 3- to 5-year exposure intakes (quantified by biomonitoring concentrations) were used as surrogates for infant exposure and risk as this age group showed consistently higher intakes than the infant age group. This is a conservative approach. 0.5- to 4-year exposure intakes (quantified by environmental media and food concentrations) were used to quantify exposure and risk for infants when this group showed higher intakes than for the less than 0.5-year-olds.
- Footnote 15
-
P4 and MIREC-CD plus data measured 2 metabolites of DBP (MnBP and MHBP). MIREC pregnant women measured 1 metabolite of DBP (MnBP).
- Footnote 16
-
P4 and MIREC-CD plus data measured 5 metabolites of DEHP (MEHP, MEOHP, MEHHP, MCMHP, MECPP). MIREC pregnant women measured 3 metabolites of DEHP (MEHP, MEOHP, MEHHP).