
Screening assessment certain organic flame retardants substance grouping 1,4:7,10-dimethanodibenzo[a,e]cyclooctene, 1,2,3,4,7,8,9,10,13,13,14,14-dodecachloro-1,4,4a,5,6,6a,7,10,10a,11,12,12a-dodecahydro- dechlorane plus (DP)
Official title: Screening assessment certain organic flame retardants substance grouping 1,4:7,10-Dimethanodibenzo[a,e]cyclooctene, 1,2,3,4,7,8,9,10,13,13,14,14-dodecachloro-1,4,4a,5,6,6a,7,10,10a,11,12,12a-dodecahydro- Dechlorane Plus (DP)
Chemical Abstracts Service Registry Number 13560-89-9
Environment and Climate Change Canada
Health Canada
May 2019
Cat. No.: En14-369/2019E-PDF
ISBN 978-0-660-30091-7

Synopsis
Pursuant to section 68 of the Canadian Environmental Protection Act, 1999 (CEPA), the Minister of the Environment and the Minister of Health have conducted a screening assessment of 1,4:7,10-dimethanodibenzo[a,e]cyclooctene, 1,2,3,4,7,8,9,10,13,13,14,14-dodecachloro-1,4,4a,5,6,6a,7,10,10a,11,12,12a-dodecahydro-, commonly known as Dechlorane Plus® (Dechlorane Plus or DP) (Chemical Abstracts Service Registry Number [CAS RN] 13560-89-9). DP is a substance within the Certain Organic Flame Retardants (OFR) Substance Grouping, which includes ten organic substances having a similar function: the application to materials to slow the ignition and spread of fire. DP was identified as a priority for assessment on the basis of other human health concerns.
DP does not occur naturally in the environment. Based on information gathered from the survey conducted under section 71 of CEPA, DP imports to Canada ranged from 1000 to 10 000 kg in 2011 for use as an additive flame retardant in several applications. Known international uses of DP include applications in wire and cable jacketing, electronics, appliances, automobiles, hard plastic connectors, and plastic roofing materials, and similar uses are known or expected in Canada. DP is currently marketed as an alternative/replacement for decabromodiphenyl ether (DecaBDE) in a range of flame retardant applications of electronic wiring and cables, automobiles, plastic roofing materials, and hard plastic connectors. While DP is not produced in Canada, it is a High Production Volume substance in the USA, and manufacturing in China has recently been reported. Recent estimates of DP production range from 450 000 to 4 500 000 kg import/production in the USA.
DP release to the environment is most likely to occur during the manufacturing, formulation or industrial use stages. Releases to the environment are expected to occur primarily through wastewater, with some release to water directly from industrial sites. Although DP can be found in commercial products or products available to consumers, information on releases to the environment from such products is limited, and releases are expected to be diffuse and low relative to industrial and wastewater treatment system point source releases. Generally, DP is characterized by very low water solubility, low to very low vapour pressure, and a very high organic carbon-water partition coefficient and octanol-water partition coefficient. When released to the environment, DP is expected to predominantly reside in soil and/or sediment, depending on the compartment of release, with less than 4% remaining in air or water. On the basis of some detection of DP in remote Arctic areas, and a possibly high predicted transfer efficiency (persistant organic pollutant [POP] model of the Organisation for Economic Co-operation and Development [OECD]), particle-bound transport may be important for long-range transport of this substance. DP has been measured in the Canadian environment, as well as internationally, in most media.
Experimental and modelled data indicate that aerobic and anaerobic biodegradation of DP is very limited and that DP is expected to be highly persistent in water, soil, and sediment. Modelled predictions for DP in air suggest a half-life of less than 1 day for the gas phase, but DP is most likely to be sorbed to airborne particulates, and therefore persistence in air could be longer.
Published bioaccumulation and biomagnification studies, as well as widespread measurements in biota, indicate that DP may be highly bioaccumulative and may biomagnify in organisms and food webs.
Given the limited empirical aquatic toxicity data for DP (owing to low solubility in water), the toxicity potential in fish from dietary uptake in water was investigated using a Critical Body Residue (CBR) approach. CBR results suggest DP in biota (Canadian fish tissue) does not reach tissue concentration resulting in acute or chronic lethality in aquatic organisms. Because of the lack of soil and sediment ecotoxicity data for DP, chronic toxicity data for two analogue substances, chlordane (CAS RN 57-74-9) and mirex (CAS RN 2385-85-5), were evaluated. Although these analogues are considered conservative, results suggest that DP can cause effects at low concentrations in sediment and soil organisms.
Industrial scenarios were developed to provide estimates of exposure considering available industrial site information including potential quantities used. These scenarios involved industrial release to water resulting in DP partitioning to sediment, and partitioning to wastewater biosolids followed by their application to soil. In addition, recent monitoring data from wastewater treatment systems across Canada were used to further develop the exposure analysis. Risk quotient analyses, integrating conservative estimates of exposure with toxicity information, were performed for sediment and soil organisms, and wildlife. Results of these analyses indicate that DP could represent a risk to sediment dwelling organisms. In addition, although in most soil scenarios DP posed a low risk to organisms on the basis of current levels of use and release in Canada, at least one soil exposure scenario suggests predicted environmental concentrations of DP approach a level that could result in risk to soil organisms.
DP’s high persistence suggests the potential for build-up in the environment from past and current emissions, resulting in long-term exposures in sediment and soil. DP is expected to strongly adsorb to suspended solids/particulates when released to surface water, either directly from industrial activities or indirectly via wastewater treatment systems, and eventually settle in depositional sediment areas (i.e. sinks). Several studies have reported DP sediment concentrations in the Great Lakes region that exceed the predicted environmental concentrations for sediment developed from industrial scenarios on the basis of quantities used in Canada, suggesting that DP exposure in specific areas of Canada could be underestimated and precaution is warranted. It should be noted that DP is a High Production Volume substance in the USA; past and/or present environmental transport of DP from the northern USA, in particular manufacturing near the Great Lakes, may therefore contribute to DP exposure in Canada.
Considering all available lines of evidence presented in this screening assessment, there is risk of harm to the environment from DP. It is concluded that DP meets the criteria under paragraph 64(a) of CEPA as it is entering or may enter the environment in a quantity or concentration or under conditions that have or may have an immediate or long-term harmful effect on the environment or its biological diversity. However, it is concluded that DP does not meet the criteria under paragraph 64(b) of CEPA as it is not entering the environment in a quantity or concentration or under conditions that constitute or may constitute a danger to the environment on which life depends.
No classifications of the health effects of DP by national or international regulatory agencies were identified. On the basis of the available information on genotoxicity, DP is considered unlikely to be genotoxic. In repeated-dose oral toxicity studies, no adverse effects were observed up to the highest dose level tested in animal studies.
The main sources of exposure for the general population in Canada are expected to be from environmental media (air, dust, soil, and water), and food, including breast milk.
On the basis of the estimates of intake from environmental media and food and no identified adverse health effects, risk from DP for the general population is considered to be low. Therefore, it is concluded that DP does not meet the criteria under paragraph 64(c) of CEPA, as it is not entering the environment in a quantity or concentration or under conditions that constitute or may constitute a danger in Canada to human life or health.
Overall conclusion
It is concluded that DP meets one or more of the criteria set out in section 64 of CEPA. DP has been determined to meet the persistence and bioaccumulation criteria as set out in the Persistence and Bioaccumulation Regulations of CEPA.
1. Introduction
Pursuant to sections 68 or 74 of the Canadian Environmental Protection Act, 1999 (CEPA), the Minister of the Environment and the Minister of Health conduct screening assessments of substances to determine whether these substance present or may present a risk to the environment or to human health.
The Substance Groupings Initiative is a key element of the Government of Canada’s Chemicals Management Plan. The Certain Organic Flame Retardants Substance Grouping consists of ten substances identified as priorities for assessment as they met the categorization criteria under section 73(1) of CEPA, or were considered as a priority on the basis of ecological or human health concerns (ECCC, HC [modified 2017]). All of these substances have a similar function: the application to materials to slow the ignition and spread of fire. These substances are also potential alternatives for other flame retardants which are presently subject to regulatory controls or phase-out in Canada or globally.
This screening assessment focuses on the substance 1,4:7,10-dimethanodibenzo[a,e]cyclooctene, 1,2,3,4,7,8,9,10,13,13,14,14-dodecachloro-1,4,4a,5,6,6a,7,10,10a,11,12,12a-dodecahydro-, commonly known as Dechlorane Plus® (Dechlorane Plus or DP). The Chemical Abstracts Service Registry Number (CAS RN) for DP is 13560-89-9. This substance was identified in the categorization of the Domestic Substances List (DSL) of CEPA as a priority for assessment on the basis of other human health concerns. At categorization, DP met criteria for persistence, but was uncertain with respect to meeting criteria for inherent ecotoxicity and bioaccumulation.
This screening assessment includes consideration of information on chemical properties, environmental fate, hazards, uses and exposure, including additional information submitted by stakeholders. Relevant data were identified up to February 2017 for the ecological assessment and the human health assessment. Empirical data from key studies as well as some results from models were used to reach conclusions. When available and relevant, information presented in assessments from other jurisdictions was considered.
This screening assessment was prepared by staff in the CEPA Risk Assessment Program at Health Canada and Environment and Climate Change Canada (ECCC) and incorporates input from other programs within these departments. The ecological and human health portions of this assessment have undergone external written peer review and/or consultation. Comments on the technical portions relevant to the environment were received from Jon Arnot (Arnot Research and Consulting), Li Shen (Ontario Ministry of the Environment), and Ian Doyle (UK Environment Agency). Comments on the technical portions relevant to human health in this screening assessment were received from scientific experts selected and directed by Toxicology Excellence for Risk Assessment (TERA). Comments were received from Patricia McGinnis (Independent Consultant), Pam Williams (E Risk Sciences) and Paul Rumsby (National Centre for Environmental Toxicology). Additionally, the draft of this screening assessment was subject to a 60 day public comment period. While external comments were taken into consideration, the final content and outcome of the screening assessment remain the responsibility of Health Canada and ECCC.
This screening assessment focuses on information critical to determining whether substances meet the criteria as set out in section 64 of CEPA by examining scientific information and incorporating a weight of evidence approach and precautionFootnote 1 . This screening assessment presents the critical information and considerations on which the conclusion is based.
2. Substance identity
This screening assessment focuses on 1,4:7,10-dimethanodibenzo[a,e]cyclooctene, 1,2,3,4,7,8,9,10,13,13,14,14-dodecachloro-1,4,4a,5,6,6a,7,10,10a,11,12,12a-dodecahydro- (Dechlorane Plus®, Dechlorane Plus, or DP). This substance is an organic flame retardant within the Certain Organic Flame Retardants (OFRs) Substance Grouping under the Substance Groupings Initiative of the CMP. The structural identity of this substance is presented in Table 2‑1. Other names for the substance are presented in Appendix A. For this assessment, Dechlorane Plus will be referred to as DP.
The commercial technical product DP is primarily a mixture of the syn and anti stereoisomers, typically composed of approximately 25% syn-DP and 75% anti-DP (Sverko et al. 2011). DP is a chlorinated cycloaliphatic flame retardant produced by a Diels-Alder condensation of 1,5-cyclooctadiene and hexachlorocyclopentadiene in a 2:1 molar ratio (Sverko et al. 2011).
| CAS RN | Chemical structure | Molecular mass (g/mol) | Chemical formula |
|---|---|---|---|
| 13560-89-9 |  |
653.729 | C18H12Cl12 |
2.1 Selection of analogues and use of (Q)SAR models
Guidance on the use of a read-across approach and Quantitative Structure-Activity Relationships or (Q)SAR models for filling data gaps has been prepared by various organizations such as the Organisation for Economic Co-operation and Development (OECD). These methods have been applied in various regulatory programs including the European Union’s Existing Substances Programme. In this assessment, a read-across approach using data from analogues and the results of (Q)SAR models, where appropriate, has been used to inform the ecological assessment.
Analogues were selected that were structurally similar and functionally similar to DP (e.g., on the basis of sediment and soil toxicity), and that had relevant empirical data that could be used to read-across. The applicability of (Q)SAR models was determined on a case-by-case basis. Details of the read-across data and (Q)SAR models chosen to inform the ecological and human health assessments of DP are further discussed in the relevant sections of this report.
The analogues used to inform the sediment and soil toxicity sections of this ecological assessment are presented in Table 2‑2. There are limited analogue options for DP, given that the most similar chemical analogues to DP also lack ecotoxicity data for soil and sediment. DP is a replacement for the flame retardant use of organochlorine mirex (also called Dechlorane, CAS RN 2385-85-5) (Feo et al. 2012); therefore mirex was identified as a potential analogue. Chlordane was also identified by the OECD (Q)SAR Application Toolbox as a structurally and functionally close analogue for which sediment and soil toxicity data were available. DP, chlordane, and mirex (as well as other “dechloranes”) are all similarly synthesized from hexachloro-cyclopentadiene and are expected to behave similarly in the environment (e.g., partitioning to soil and sediment, stable/persistent etc.) (Environment Canada 1977). Using chlordane and mirex as analogues for toxicity is conservative, as they are more bioavailable and therefore likely more toxic than DP (at least to aquatic organisms) because of higher water solubility than DP. As a result, these analogues were considered “worst-case” and protective in relation to ecological effects for sediment and soil organisms.
Although mirex was never registered for use as a pesticide in Canada, it has been used worldwide as an insecticide for ant and other insect pests, and as a flame retardant (Environment Canada 2014, IPCS 1984, IPCS 1988). Chlordane is an organochlorine pesticide that was used in Canada from the mid-1940s to the 1980s, but its registration and use under the Pest Control Products Act were discontinued as of 1991 (CCME 1999). Both chlordane and mirex appear on the List of Toxic Substances (Schedule 1) of CEPA.
Other “dechlorane-related” substances, such as dechlorane 602 (CAS RN 31107-44-5), dechlorane 603 (CAS RN 13560-92-4), dechlorane 604 (CAS RN 34571-16-9), and Chlordene Plus (CAS RN 13560-91-3) are known analogues of DP (Sverko et al. 2011), and are also detected in the environment and biota. Dechlorane 602, 603, and 604 are identified as flame retardants themselves, and Dechlorane 603 and Chlordene Plus are detected in organochlorine pesticides (Shen et al. 2011a). Dechlorane 602 and Dechlorane 604 are listed on Canada’s Non-Domestic Substance List (NDSL), indicating they are in use internationally; however, it is expected that any use of the four substances in Canada would be low. Furthermore, these substances have limited or no data with respect to sediment and soil toxicity, and as a result have no relevant empirical data for use in read across in the DP ecological assessment. Finally, DP-related compounds also include impurities formed through side reactions in DP synthesis (e.g., 1,4-DP, Vinalcyclohexane (VCH)-DP, 1,3- DP Monoadduct(DPMA), 1,5-DPMA) (Sverko et al. 2010). These compounds were measured in sediment core in Niagara River downstream of a USA DP industrial producer (Sverko et al. 2010). Assessment of these “dechlorane-related” substances is considered to be beyond the scope of this screening assessment.
| Substance CAS RN | Substance name | Molecular weight (g/mol) | Empirical structure/ molecular formula |
|---|---|---|---|
| 57-74-9 | Chlordane | 409.781 |  C10H6Cl8 C10H6Cl8 |
| 2385-85-5 | Mirex (Dodecachloro-pentacyclo [5.3.0.02,6.03,9.04,8] decane) | 545.546 | 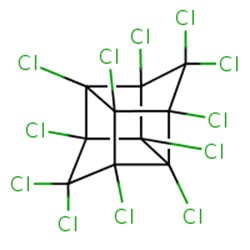 C10Cl2 C10Cl2 |
For the human health risk assessment, no appropriate analogues were identified for filling data gaps and a (Q)SAR approach was used to predict the potential for DP to be carcinogenic. Further details are provided in the Health Effects Assessment section.
3. Physical and chemical properties
Physical and chemical properties determine the overall characteristics of a substance and are used to determine the suitability of different substances for different types of applications. Such properties also play a critical role in determining the environmental fate of substances (including their potential for long-range transport), as well as their toxicity to humans and non-human organisms. A summary of experimental, modelled, and key values for the physical and chemical properties of DP that are relevant to its environmental fate and ecotoxicity can be found in Table 3‑1. A detailed table of physical and chemical properties of DP (empirical and modelled) and a summary of analogue physical and chemical properties can be found in Appendix B.
DP was considered amenable to model prediction of physical-chemical properties using (Q)SARs, as it is within the model domain of applicability (i.e., structural and/or property parameter domains are represented in the training set used for the models). Physical-chemical properties of DP were checked for internal consistency according to the Least-Squares Adjustment Procedure (LSA) (Schenker et al. 2005). Geometric mean or arithmetic mean values (for log values) of the most reliable and independent values found from empirical data and modelling were used to determine inputs to the LSA (sub-cooled values for water solubility, vapour pressure, and octanol solubility were used) (Table B-1; for all Physical-Chemical values see Table B-2). In determining internal consistency of the properties, the LSA model also produces predicted values. For the purposes of this assessment, the log Kow value 8.78, derived from the LSA method, was selected. This value is on the low end of the range of model predicted values, and is therefore conservative for estimates of bioaccumulation. To maintain internal consistency of physical chemical values, the LSA method value for water solubility and vapour pressure were also considered. The LSA water solubility value (2.85 x 10⁻⁷ mg/L) falls within the range of model predicted values (Table 3‑1), but is slightly lower than reported empirical estimates. As the original water solubility test report details and methods are not available to the Government of Canada for review, this assessment uses the LSA water solubility value for modelling purposes. Final selected values are summarized in Table 3-1 (references are provided in Appendix B).
Generally, DP is characterized by very low water solubility, low to very low vapour pressure, and a very high organic carbon-water partition coefficient and octanol-water partition coefficient.
| Property | Experimental/ Estimate | Modelled | Selected value for modelling |
|---|---|---|---|
| Melting point (ºC) | >325 – 350 | 170 – 350 | 350 |
| Boiling point (ºC) | N/A- degrade before boiling | 486.83 | N/A |
| Vapour pressure (Pa) | 0.8 (at 200ºC) | 3.57 x 10⁻¹¹ – 1.01 x10⁻⁸ | 6.57 x10⁻¹¹ (1.08 x 10⁻⁷ subcooled liquid) |
| Henry’s Law constant (Pa·m3/mol) | NA | 0.151 to 0.754 | 0.151 |
| Log Kow | NA | 8.29 –11.27 | 8.78 |
| Log Koc | 6.65 | 7.62 – 7.68 | 6.65 |
| Log Koa | NA | 12.99 – 14.79 | 12.99 |
| Water solubility (mg/L) | <1.67 x10⁻⁶ –2.49 x 10⁻⁴ | 4.42 x10⁻¹⁰ – 8.4 x10⁻⁴ | 2.85 x 10⁻⁷ (4.69 x 10⁻⁴ subcooled liquid) |
| pKa | N/A | N/A | N/A |
Abbreviations: pKa, acid dissociation constant; N/A, not applicable
a Detailed physical-chemical property values and references are provided in Appendix B.
4. Sources
There are no known natural sources of DP. Currently there are two known producers of DP in the world: one located in the U.S. and the other in China (Hoh et al. 2006; Wang et al. 2010). The worldwide annual production volume for DP has been estimated at approximately 4500 to 5000 tonnes (Wang et al. 2010, Feo et al. 2012).
On the basis of the information gathered from a survey conducted for the year 2011 under section 71 of CEPA, between 1000 to 10 000 kg of DP, including DP in some products and/or manufactured items, were imported into Canada by a few companies. No DP was identified as being manufactured in Canada for 2011 (Canada 2013). According to the result of a DSL Inventory Update conducted for the year 2008, DP was found to be imported into Canada by a number of companies in similar quantities (same order of magnitude range) as reported in 2011.
In the United States, DP is a High Production Volume chemical (US EPA 2011). According to the US EPA, DP production/import quantities in the U.S. have been constant within the same reporting range of 450 000 to 4 500 000 kg for 1986 to 2006.
A manufacturer in China has been producing DP since approximately 2003 to 2005, with annual DP production estimated to range from 300 000 to 1 000 000 kg (Wang et al. 2010).
5. Uses
Internationally, DP is used as an additive flame retardant in applications of electronic wiring and cables, automobiles, plastic roofing materials, and hard plastic connectors (Weil and Levchik 2009, Sverko et al. 2008, Sverko et al. 2010, Sverko et al. 2011, ECHA 2013), and similar uses of DP are known or expected in Canada. According to submissions under section 71 of CEPA, DP is used in Canada as a flame retardant in automobile manufacturing (ECCC 2013 to 2014).
As a flame retardant, DP is used in many polymeric systems. These systems are typically either thermoplastics or thermosets, as seen in Table 5-1 and 5-2. Thermoplastics have a reversible curing process whereas thermosets have an irreversible curing process (Modor Plastics 2013). Examples of thermoplastics that may contain DP include nylon (Weil and Levchik 2009), polyester (KEMI 2007), acrylonitrile butadiene styrene (ABS), natural rubber, polybutylene terephthalate (PBT), polypropylene, and styrene butadiene rubber (SBR) block copolymer (OxyChem 2007). DP may be used in thermosets such as epoxy and polyester resins, polyurethane foam, polyethylene, ethylene propylene diene monomer rubber, polyurethane rubber, silicon rubber, and neoprene (OxyChem 2007). The amount of DP in these materials ranges from 8% in PBT up to 40 % in silicon rubber (OxyChem 2007). According to manufacturer literature (OxyChem 2007), DP is manufactured for use solely by industrial customers. DP is an additive flame retardant in primary industrial applications.
| Product Type | DP Concentration | Reference |
|---|---|---|
| Nylon | 0 – 35% | KEMI 2007; Weil and Levchik 2009 |
| Polyester | 0 – 16% | KEMI 2007 |
| Acrylonitrile butadiene styrene | 16.9% | OxyChem 2007 |
| Natural Rubber | 18.7% | OxyChem 2007 |
| Polybutylene terephthalate (PBT) | 8 – 18% | OxyChem 2007 |
| Polypropylene | 20 – 35% | OxyChem 2007 |
| Styrene butadiene Rubber (SBR) Block Copolymer | 30% | OxyChem 2007 |
| Product Type | DP Concentration | Reference |
|---|---|---|
| Epoxy Resins | 25.5% | OxyChem 2007 |
| Unsaturated Polyester Resins | NS | OxyChem 2007 |
| Polyurethane foam | 17.5 – 35% | OxyChem 2007 |
| Cross-linked Polyethylene | 25.5% | OxyChem 2007 |
| Polyurethane Rubber | 20 – 30% | OxyChem 2007 |
| Silicon Rubber | 18.8 – 40% | OxyChem 2007 |
| Neoprene | 10% | OxyChem 2007 |
| Ethylene propylene diene monomer rubber (EPDM) | 33% | OxyChem 2007 |
Abbreviations: NS = not specified
The applications and the product types in which the above polymer materials are found are mainly related to electrical and electronic applications such as electrical wire coatings, coil bobbins, hard plastic computer and TV connectors, switches, cable straps, power tool housing, and wall plates (Weil and Levchik 2009). DP may also be used as a flame retardant in military textiles; however, this use is minor (Weil and Levchik 2009). Furthermore, ECHA (2013) lists DP as being used in leather articles.
DP may also be used in epoxy resins and phenolic laminates and resins (OxyChem 2007), although their applications in products available to consumers are not known.
DP is not listed as an approved food additive in the Lists of Permitted Food Additives, which have been incorporated by reference into their respective Marketing Authorizations issued under the Food and Drugs Act (Health Canada [modified 2017]), nor has it been identified as being used/present in formulations of food packaging materials or incidental additives (2013 email from Food Directorate, Health Canada, to Risk Management Bureau, Health Canada; unreferenced). DP is not listed in the Drug Products Database, the Therapeutic Products Directorate’s internal Non-Medicinal Ingredient Database, the Natural Health Products Ingredients Database or the Licensed Natural Health Products Database as a medicinal or non-medicinal ingredient present in final pharmaceutical products, natural health products or veterinary drugs in Canada (DPD [modified 2017], NHPID [modified 2017], LNHPD [modified 2016]; 2013 email from the Therapeutic Products Directorate, Health Canada, to Risk Management Bureau, Health Canada; unreferenced). On the basis of the notifications submitted under the Cosmetic Regulations to Health Canada, DP is not used in cosmetic products in Canada (2014 emails from the Consumer Product Safety Directorate, Health Canada, to the Existing Substances Risk Assessment Bureau, Health Canada; unreferenced).
6. Releases to the environment
Anthropogenic releases to the environment depend upon various losses occurring during the manufacture, industrial use, consumer/commercial use, service life, and disposal of a substance and products containing that substance.
Releases of DP to the Canadian environment, owing to the substance’s use as a flame retardant, are expected from point sources (e.g., from processing facilities and wastewater treatment systems). Episodic releases from industrial activities could also be expected to occur during cleaning of empty transport containers. Municipalities and industrial activities generate large volumes of wastewater regularly treated by wastewater treatment systems (WWTS) prior to discharge to the environment (Shanmuganathan et al. 2017). WWTS effluents and biosolids are considered to be pathways where organic pollutants, including flame retardants like DP, can be discharged to aquatic environments (via effluents) or to land (through the application of biosolids to agricultural and pasture lands) (Shanmuganathan et al. 2017).
Additive use of DP in products suggests diffuse emissions may occur from commercial products or products available to consumers; although there are uncertainties, the rate is assumed to be low in comparison to industrial and WWTS point sources. Overall, diffuse releases from products (e.g. to air or water) are expected to be geographically dispersed and spread out over the duration of the service life and end-of-life of these products.
Although DP has low volatility, emissions to air (e.g., from industrial manufacturing release to air, dust, or release from products) can result in atmospheric deposition to soil and water (Sverko et al. 2010). When a substance is unintentionally transferred to land, it may be washed into the sewer or surface water or transferred by wind or rain to nearby soil. However, owing to the low volatility of DP, this pathway of release is expected to be very limited. Finally, while the majority of landfills in Canada treat their leachate through WWTS, landfills that do not collect and treat their leachate may potentially release substances to ground or surface water via leachate. Furthermore, although limited, there is potential for releases of substances to the atmosphere from landfills that do not collect and destroy their landfill gas.
While DP is identified with low usage in Canada, the substance is a High Production Volume substance in the USA, and is manufactured in the Great Lakes region (Niagara Falls, New York). Within Canada, many studies have measured relatively high DP concentrations in media in the Great Lakes region, particularly in the vicinity of the Niagara River and Lake Ontario, downstream of an American DP manufacturing facility, suggesting release of DP to the environment from manufacturing activities (Hoh et al. 2006, Sverko et al. 2010).
This information is used to further develop exposure characterization scenarios to estimate resulting environmental concentrations.
7. Measured environmental concentrations
DP has been measured in the Canadian environment, as well as globally, with the highest concentrations found close to urban or industrial areas (Table 7‑1 and Table 7‑2; ECCC 2017). Within Canada, many studies have measured relatively high DP concentrations in media in the Great Lakes region, particularly in the vicinity of the Niagara River and Lake Ontario, downstream of an American DP manufacturing facility. As part of the Integrated Atmospheric Deposition Network (IADN), several studies have measured DP air concentrations in the Great Lakes region (Canada and USA) of North America (Hoh et al. 2006, Venier and Hites 2008, Salamova and Hites 2011). Between 2005 and 2014, total concentrations from two remote, one rural and two urban sites ranged from 0.17 to 2.5 pg/m3 in the vapour phase, while concentrations in the particulate phase were much greater and ranged from not detected to 340.36 pg/m3 (Salamova and Hites 2011, Hung et al. 2016, unpublished data). The anti-isomer almost always exceeded the syn-isomer in both the vapour phase and particulate phase. The highest measurements (e.g., 490 pg/m3) were observed at a sampling site located in Sturgeon Point, New York, 50 km from a DP production facility (Hoh et al. 2006). A significant decrease in DP concentrations was observed with increasing distance from the DP production facility (Sverko et al. 2011).
Recent high-volume active air sampling at a semi-urban location in Toronto, Canada, determined that DP was one of the most frequently detected OFRs (87 to 96% detection frequency), with total (gas and particulate) DP concentrations up to 2.3 pg/m3 syn-DP, and up to 5.2 anti-DP pg/m3 (Shoeib et al. 2014).
Xiao et al. (2012) detected DP in 11 out of 14 high-volume air samples taken at a remote station in Alert in Nunavut, Canada. Total DP concentrations ranged from not detected (less than 0.05 pg/m3) to 2.1 pg/m3. Average syn-DP and anti-DP concentrations were 0.18 and 0.57 pg/m3, respectively, with the dominant isomer being anti-DP.
Concentrations of DP in precipitation have been measured in the Great Lakes region (50 to 890 pg/L) (Salamova and Hites 2011). Concentrations of DP were measured in the surface waters of two remote lakes (Lake Opeongo and Lake Siskiwit) within the Canadian Shield region, as well as two of the lower Great Lakes, between 2005 and 2010 (Muir et al. 2011). The highest concentrations were measured in Lake Ontario at 6.7 pg/L, followed by Lake Opeongo and Lake Erie at 2.4 pg/L and 1.7 pg/L, respectively. Samples collected from Lake Siskiwit fell below the study’s limit of detection. Venier et al. (2014) sampled Great Lakes surface water and reported highest DP in Lake Ontario (13.9 pg/L) and the lowest in Lake Huron (1.0 pg/L). Muir et al. (2014) reported a mean DP measurement of 4.89 pg/L from the central waters of Lake Ontario.
No soil measurements for DP have been reported for Canada. However, DP soil concentrations as high as 13 400 ng/g dry weight (dw) have been reported in Hui’an, China (Wang et al. 2010).
Numerous studies have quantified DP in surficial sediments of the North American Great Lakes region. A comprehensive study by Shen et al. (2010) measured DP in the surficial sediments of Lake Ontario (sampling sites in both the USA and Canada), Lake Erie, Lake Michigan, Lake Superior, and Lake Huron, and found syn-DP and anti-DP ranging from 0.0048 to 23 µg/kg dw and 0.009 to 82 µg/kg dw, respectively (total DP ranged from 0.014 to 110 µg/kg dw). For both isomers, the average lowest concentrations of DP in surficial sediment were in Lake Superior (although the lowest single site was located in Lake Huron) and the highest concentrations were in Lake Ontario, which is located downstream from the DP manufacturing plant in Niagara Falls, New York (Sverko et al. 2011). Shen et al. (2011b) measured DP in surficial sediment Canadian tributaries to the Great Lakes, and measured the highest DP in Niagara River sediments (sampling sites in both USA and Canada): 21 to 310 µg/kg dw. Sverko et al. (2008) reported total DP concentrations ranging from 2.23 to 586 µg/kg dw for surficial sediment concentrations in Lake Ontario in samples collected in 1998. Sverko et al. (2008) also reported a range of 0.061to 8.62 µg/kg dw for Lake Erie samples from 1997 and 1998.
Sediment cores taken from the Great Lakes have been used to examine changes in DP concentrations over time. Sverko et al. (2010) report the highest observed concentration of DP as 920 µg/kg dw in a core section corresponding to Lake Ontario during 1976 to 1980, near the mouth of the Niagara River. This study reported decreases of DP after this peak, coinciding with USA federal and state laws to mitigate free release of chemicals (such as DP) to the Niagara River (including installation of a water treatment plant; Sverko et al. 2010). Sediment core studies by Qiu et al. (2007) and Shen et al. (2010, 2011a) in Lake Ontario found a consistent time period: DP concentrations in sediment peaked in the early 1980s, and depending on location within Lake Ontario, have fluctuated around two-thirds of the maximum or decreased slightly since peak concentrations. Sverko et al. (2008) collected sediment cores at different locations within Lake Erie in order to compare concentrations between 1980 and 2002. The study found concentrations to decrease spatially westward with highest average concentrations of 40 µg/kg dw and 2.5 µg/kg dw in the east and west basin respectively. Yang et al. (2011) collected 16 sediment cores in the Great Lakes and found a maximum DP concentration in Lake Ontario 183 times greater than in the other lakes. Yang et al. (2011) also determined that although fluxes of DP to Lake Ontario have declined from the peak of 14 to 20 ng/cm2 /y in the 1990s, recent fluxes to Lake Ontario are 2 to 4 ng/cm2 /y. As DP is still being produced, the decline of input to Lake Ontario may reflect the decrease in production quantity or an improvement in controlling the discharge (Yang et al. 2011). In contrast to Lake Ontario, in Lake Superior, the rate of DP input is increasing at all sites except one (Yang et al. 2011).
DP has been quantified in suspended sediments of the Niagara River through biweekly sampling studies by Shen et al. (2011a), Sverko et al (2008), Reiner et al. (2006). Concentrations ranged from 5.4 to 89 µg/kg dw between 1980 and 2002. A half-life in suspended sediment in the Niagara River was determined as 17 years (Reiner et al. 2006).
The only Canadian sediment DP samples not from the Great Lakes are from Lake Winnipeg, Manitoba, collected between 2000 and 2003. These showed mean concentrations of 0.0117 and 0.0183 µg/kg dw for syn-DP and anti-DP, respectively (Tomy et al. 2007).
Recently, DP concentrations in wastewater effluent and wastewater treatment system by-products (e.g., /biosolids) have been reported for eight Canadian WWTS encompassing lagoon, primary, secondary, and advanced liquid treatment processes (Shanmuganathan et al. 2017). Concentrations ranged from 17 to 247 ng/L, 2 to 139 ng/L, and 96 to 740 ng/g dw in influents, effluents, and biosolids, respectively (percent detection of total DP was greater than 90% in both wastewater and biosolids samples). The median removal efficiencies across all 8 WWTS were between 51 and 66% for total DP. In a study conducted by Kolic et al. (2009), both syn-DP and anti-DP were detected in biosolids collected from a Toronto area WWTS. Concentrations were approximately 100 ng/g and from 10 to 100 ng/g for syn-DP and anti-DP respectively (values read from log-scale graph).
Many studies have quantified DP in biota sampled in North America, particularly in the Great Lakes region. For example, Muir et al. (2011, 2014) measured concentrations of DP in zooplankton, mysids, forage fish, and lake trout samples collected from Lake Erie, Lake Ontario, and Lake Opeongo between 2005 and 2010. Concentrations ranged from below detection to 0.070 ng/g ww, with highest concentrations in sculpin from Lake Ontario. DP temporal trends have been studied in the Great Lakes via analysis of tissue samples of lake trout, a top predator. Samples were collected every four to six years in Lake Ontario from 1979 to 2004, and reported DP tissue concentrations ranged from 0.31 to 0.85 ng/g ww (2.3 to 7.2 ng/g lw) (Ismail et al. 2009), with a half-life of 16 years. Shen et al. (2010) reported 0.020 to 0.440 ng/g lw for syn-DP and 0.033 to 0.330 ng/g lw for anti-DP for lake trout samples from 1998 and 2002 from Lake Superior, Lake Huron and Lake Ontario. Guo et al. (2017) reported geometric mean concentration of DP in lake trout samples (from 2010) of 0.150 ng/g lw (Lake Superior and Lake Michigan), 0.640 ng/g lw in Lake Ontario, and 1.030 ng/g lw for Lake Huron; as well as geomean walleye samples from Lake Erie of 0.450 ng/g lw. DP has been measured in several other fish species in Canada, as well (Hoh et al. 2006; Tomy et al. 2007; Houde et al. 2014, etc.)
DP was recently measured in blubber samples (collected 2013) from belugas (Delphinapterus leucas) in the Canadian Arctic (mean =1.28 ± 0.15 ng/g lw), as well as belugas (mean= 0.44 ± 0.12 ng/g lw) and minke whales (Balænoptera acutorostrata) (0.31 ± 0.06 ng/g lw) in the Canadian Saint Lawrence Estuary (Simond et al. 2017).
DP has been measured in birds in Canada, including Peregrine Falcon eggs and Herring Gull eggs (1.5 to 4.5 ng/g ww), collected from the Great Lakes, with the highest concentrations identified in the Niagara River colony or nests on Lake Ontario, closest to the DP manufacturing plant (Gauthier et al. 2007, Guerra et al 2011). Su et al. (2015) reported that DP concentrations in herring gull eggs from the Great Lakes areas of concern sampled 2012 to 2013 were significantly higher (~220% higher) than in eggs from the same colonies sampled in 2006 to 7. The maximum DP measured in herring gull eggs was 54.6 ng/g ww (for Five–mile Island site). Venier et al. (2010) quantified DP in the plasma of bald eagles in Canada (mean DP=0.19 ng/g ww).
Limited Canadian terrestrial data are available; however, Muir et al. (2014) report Arctic DP data for wolf tissue.
For further details on other Canadian biota studies, see supporting documentation (ECCC 2017).
| Media | Location(s) | Years (not continuous) | Concentration range |
|---|---|---|---|
| Air (pg/m3) | Ontario, Nunavut | 2004-2010 | <0.05 – 340.36 |
| Water (pg/L) | Lake Erie, Lake Ontario, Lake Opeongo, Lake Siskiwit | 2005-2010 | <DL – 950 ±190 (precipitation) <DL – 13.9 (lake water) |
| Sediment (µg/kg dw) | Lake Superior, Lake Huron, St. Clair river, Lake Erie, Niagara River, Lake Ontario, Lake Winnipeg | ~1975-2007 | <DL – 310 (2003) 2.23 – 586 (1998) 920 (max. value, 1976 – 1980) |
| Biosolids (ng/g dw) | Eight locations across Canada | 2013 - 2015 | 96 – 740 |
| Wastewater (ng/L) influent effluent | Eight locations across Canada | 2013 - 2015 | 17 – 247 2 – 139 |
| Biota – aquatic (ng/g lw) | Lake Erie, Lake Ontario, Lake Opeongo, Lake Winnipeg, Lake Superior, Lake Huron, Lake Erie, Niagara River | 1979-2010 | <DL – 7.2 |
| Biota – terrestrial and avian (ng/g lw) | Northwest Territories, Niagara Falls, Canadian Great Lake Basin, Whistler, BC | 2000-2010 | <DL – 230 |
Abbreviation: DL, detection limit
a See supporting documentation (ECCC 2017) for references and study details.
b Although wastewater system effluent and biosolids are not “environment,” they are included in this table since they are the pathway via which DP from industrial inputs are expected to be released to the environment.
| Media | Location(s) | Years (not continuous) | Concentration range |
|---|---|---|---|
| Air (pg/m3) | Canada, U.S.A., Denmark, Norway, Sweden, Spain, China, North Sea, South Korea, Mongolia, Pacific Ocean, Indian Ocean, Southern Ocean, Arctic-Antarctica | 2004-2011 | <DL – 26 734 |
| Water (pg/L) | Canada, U.S.A., North Sea, China, Japan, Arctic-Antarctica | 1974-2010 | <DL – 1 740 |
| Sediment (ng/g dw) | Canada, U.S.A., Great Lakes, Denmark, Faroe Islands, Finland, Norway, Sweden, Spain, China | ~1975-2011 | Syn-DP: <DL – 720 Anti-DP: <DL – 2640 |
| Soil (ng/g dw) | China | 2006-2010 | <DL – 13 400 |
| Biosolids(ng/g dw) | U.S.A., Denmark, Faroe Islands, Finland, Iceland, Norway, Sweden, Spain | 2002-2010 | 0.31 – <200 |
| Wastewater, effluent, storm water (ng/L) | Sweden | 2009-2010 | <DL – 1.2 |
| Biota – aquatic (ng/g lw) | Canada, Hendrickson Island, Germany, Faroe Islands, Spain, Iceland, Norway, China, South Korea, Japan, Brazil, | 1979-2011 | <DL – 1971 |
| Biota – terrestrial and avian (ng/g lw) | Canada, U.S.A., Chafarinas Islands, Spain, Finland, Sweden, Norway, Czech Republic, Iceland, Germany, Italy, China, Indonesia, South Korea, Tasmania, South Africa | 2000-2010 | <DL – 3820 |
Abbreviation: DL, detection limit
a See supporting documentation (ECCC 2017) for references and study details.
b Although wastewater system effluent and biosolids are not “environment,” they represent a direct source to the environment and are included in this table.
8. Environmental fate and behaviour
8.1 Environmental distribution
DP is expected to be released primarily from industrial sources to wastewater (a pathway to surface water and the soil environment) and may undergo some migration from commercial products or products available to consumers to the atmosphere as a non-reactive flame retardant with potential for some release from polymers (CECBP 2008). DP is likely highly removed by adsorption to biosolids in WWTS and can be applied to agricultural soils during biosolids amendment. Level III fugacity modelling (Table 8‑1) using the updated EQC model (v1.0, 2012), was applied to describe the fate for these expected modes of entry into the environment. Generally, the results of Level III fugacity modelling show that DP is expected to predominantly reside in soil and/or sediment, depending on the compartment of release.
| Substance released to: | Air (%) | Water (%) | Soil (%) | Sediment (%) |
|---|---|---|---|---|
| Air (100%) | 0.5 | 0.5 | 84.1 | 14.9 |
| Water (100%) | negligible | 3.5 | negligible | 96.5 |
| Soil (100%) | negligible | negligible | 99.9 | 0.1 |
Very low water solubility (2.85 x 10⁻⁷ mg/L), low vapour pressure (6.57 x 10⁻¹¹ Pa at 25°C) and very high partition coefficients (log Kow of 8.78, estimated log Koc of 6.65) suggest that DP released into the environment will be less likely to partition into and/or remain in air and water, moving instead to the sediments and soil. If released to air, a small fraction (less than 1%) of DP is expected to remain in air (in gas phase), with most of the substance depositing to soil and water with further partitioning to sediment. However, considering predicted patterns of transport (see description below), the small mass of DP that remains in air has the potential for dispersion.
The high partition coefficients indicate that DP released into surface water from wastewater is expected to adsorb to the organic fraction of suspended solids and sediments, with less than 4% remaining in water. However, as in the case with air, the small fraction remaining is likely to remain in water and has the potential for some transport (e.g., particle transport). On the basis of its high log Koc, once in the sediment, DP is not expected to be mobile and may remain in this compartment with little degradation.
When DP is released to soil (i.e., through biosolids application to agricultural lands), the majority of the mass fraction is expected to become adsorbed to soil (99.9%) on the basis of its high estimated log Koc and hydrophobic nature. On the basis of its low vapour pressure, DP is not expected to evaporate (volatilize) from dry soil surfaces, and is therefore likely to remain in soil. In addition, low degradation is expected in soil; therefore, DP is likely to remain in this compartment, with loss processes driven by soil burial or surface runoff. The results of Level III fugacity modelling (Table 8-1) support the expectation that DP predominantly resides in soil or sediment, depending on the compartment of release (New EQC 2011).
8.1.1 Long-range transport potential
Predicted log Koa (12.99) and log Kaw (-4.22 to -3.52) values for DP suggest low potential to reach the Arctic (Wania 2006, Brown and Wania 2008). The substance is identified as highly sorptive, sorbing to particles in atmospheric and aqueous media, and therefore, particle settling is predicted to limit long-range transport (Brown and Wania 2008). However, if particle-bound transport is more efficient than expected, it is possible that DP could be transported to remote regions, such as the Arctic.
Xiao et al. (2012) detected DP in 11 out of 14 high-volume air samples taken at a remote station in Alert in Nunavut, Canada (less than 0.05 pg/m3 to 2.1 pg/m3), and DP detection was primarily associated with particles. DP was detected in all air samples in Canada’s western sub-Arctic (Little Fox Lake, Yukon Territory) between August 2011 to December 2014 (total DP from 0.1 to 1.8 pg/m3), under the Canadian Northern Contaminants Program (Yu et al. 2015). DP has been detected in wolves from remote Canadian Arctic locations (Muir et al. 2014), as well as Arctic beluga whales (Simond et al. 2017).
Xiao et al. (2012) also took monthly integrated samples at a remote station close to Nam Co Lake on the Tibetan Plateau, from 2006 to 2008. No DP was detected at this remote location. When compared to levels reported for low altitude sites, these results suggest orographic precipitation (relief rainfall) may limit the transport of DP to higher elevations. Although DP production is limited to China and North America, many studies have measured DP elsewhere. European studies report air concentrations ranging from 0.58 pg/m3 in Rao Sweden to 9.4 pg/m3 in Lille Valby, Denmark (TemaNord 2011). DP was detected in all particle phase atmospheric samples collected from Svalbard in the European Arctic in 2012 through 2013, ranging from 0.05 to 5 pg/m3 (Salmova et al. 2014). A study performed by Möller et al. (2010) detected DP in air and seawater from remote locations from the Arctic East Greenland Sea to Antarctica. For example, the study measured concentrations of 0.05 to 4.2 pg/m3 in 2 to 6 day samples of marine boundary layer air over the Atlantic Ocean. Furthermore, samples collected by the Global Atmospheric Passive Sampler (GAPS) have also reported relatively high levels in remote locations (Sverko et al. 2011). This latter study extends across all seven continents and has reported air concentrations ranging from below detection limits up to greater than 75 pg/m3 in Cape Grim, Tasmania (Moller et al. 2012, Sverko et al. 2011, Xian et al. 2011). Recent studies in remote Norwegian high Arctic locations have measured DP in air, seawater, fjord sediment, soil, moss, dung (reindeer and bird), eggs, as well as bird, seal, and polar bear tissue (Ma et al. 2015, Na et al. 2015, Vorkamp et al. 2015). DP was measured in Antarctic marine biota (up to 6.81 ng/g lw) (Na et al. 2017). These empirical studies suggest DP is available for long-range transport.
The OECD POPs Screening Model can be used to help identify chemicals with high persistence and long-range transport potential (OECD 2006). The Characteristic Travel Distance (CTD) calculated for DP using the OECD model is 2508 km, indicating that DP has potential for transport in air; however, this is below the boundary (5097 km ,CTD of PCB-28) suggested for global pollutants by Klasmeier et al. (2006). The model also calculates an overall persistence (Pov) of 260 days, as well as the transfer efficiency (TE), which is the percentage of emission flux to air that is deposited to the surface (water and soil) in a remote region. The TE for DP was calculated to be 9.7%, which is above the boundary of 2.248% (PCB-28) established on the basis of the model’s reference substances empirically known to be deposited from air to soil or water. The high TE means that DP could be deposited to some degree to Earth’s surface in remote regions.
In general, while DP (on the basis of physical and chemical properties and some models) would not be expected to be a high concern for long-range transport in the gas phase, on the basis of a high predicted transfer efficiency and detection of DP in remote areas, the role of particle-bound transport requires further consideration.
8.2 Environmental persistence
On the basis of likely releases and predicted partitioning characteristics of DP, and considering the measured environmental concentrations, environmental persistence will be considered in all media compartments. In order to evaluate the weight of evidence for persistence of DP, empirical and modelled data are considered. Relevant transformation processes for DP include photodegradation, and biodegradation. Empirical data from industry degradation studies described in this assessment are taken from public industry submissions to other government agencies (e.g., IUCLID, US EPA), as the original industry studies were not available to the Government of Canada. Therefore, empirical data from industry studies could not be directly reviewed for validity.
Generally, model predictions support experimental findings that aerobic and anaerobic biodegradation of DP is very limited and that DP is expected to be persistent in water, soil, and sediment. Modelled predictions for DP persistence in air are not consistent, and suggest a half-life of less than 0.5 day for photolysis and a half-life of 160 days for ozone reaction. However DP sorption to airborne particles is expected, which would lower the photolysis rate and result in a longer half-life in air. An overall persistence (Pov) of 260 days is predicted by the OECD POPs tool.
8.2.1 Abiotic degradation
No empirical degradation data were found for DP in air. The predicted half-life for atmospheric degradation of DP because of its reaction with the hydroxyl radical is 0.468 days (12-hr day, AOPWIN 2010). The results of AEROWIN (2010) predict a high fraction of DP sorption to airborne particles (Phi = 0.9 to 0.96), and therefore, that the rate of DP photodegradation is likely lower than predicted (i.e., half-life longer than predicted 0.468 days). Sverko et al. (2011) suggest that air modelling of DP (based on gas phase) underestimates the half-life value of DP because of its association with particles which would slow the reaction rates. An overall persistence (Pov) of 213 days is predicted by the OECD POPs tool for DP emission to air, with the model estimating 98.82% of substance in air being partitioned to aerosols. An overall persistence (Pov) for all compartments (air, water, soil) is predicted at 260 days.
The most recent IUCLID data set for DP (US EPA 2009) summarizes a 1979 study reporting limited photodegradation (less than 10%) of DP in water (eutrophic lake water and distilled water) irradiated under a mercury borosilicate lamp for 168 hours (photolysis half-life was estimated at greater than 24 years). The light source did not replicate natural sunlight but provided several lines of high photon fluxes in the solar spectral region (greater than 290 nm) which were reported to increase the rate of phototransformation over that expected from natural sunlight.
Sverko et al. (2008) initiated a simple photodegradation study which irradiated a 100 ng/mL isooctane solution of each DP isomer to UV light (λ ~ 365 nm) for a 30-day period. A decrease in parent DP concentration of 10% at 168 hour (h) and a further loss of 40% at 264 h and 65% at 504 h were observed. Anti-DP appeared to degrade more readily than the syn-DP stereoisomer. Similarly, Wang et al. (2011) conducted three photolytic experiments and found dechlorination (DP [-Cl+H] and [-2Cl+2H] degradation products), but also other unidentified DP-degradation products.
DP does not contain functional groups expected to undergo hydrolysis.
| Medium | Fate process | Degradation value | Degradation endpoint / units | Methods | Reference |
|---|---|---|---|---|---|
| Air | Atmospheric oxidation | 0.468 daysb | half-life/days | Model | AOPWIN 2010a |
| Air | Ozone reaction | 160.12 days | half-life/days | Model | AOPWIN 2010a |
| Water | Hydrolysis | n/ac | n/ac | Model | HYDROWIN 2010a |
| Water | Photolysis | >24 years (<10%, 168 hours) | half-life (%degradation/hour) | Mercury lamp with borosilicate immersion well (solubilizer used) | Chou et al. 1979 |
| Isooctane (Solvent) | Photolysis | 10% at 168 h 40% at 264 h 65% 504 h | % degradation/ hour | UV light (λ > 365 nm) | Sverko et al. 2008 |
a EPIsuite (2010-2012).
b AEROWIN (2010) predicts high fraction of DP absorption to airborne particles (Phi =0.9 to 0.96); therefore the rate of DP photolysis is likely lower than predicted (i.e., half-life longer than predicted).
c Model does not provide an estimate for this type of structure.
8.2.2 Biodegradation
Laboratory tests have shown DP is not likely to biodegrade under aerobic conditions. An activated sludge biodegradation test (modified MITI OECD 301C) reported 0.6% biodegradation in 2 weeks (US EPA 2011), and a 21-day test using wastewater biosolids found 0% biodegradation (US EPA 2009).
The four ultimate biodegradation BIOWIN (2010) submodels, as well as Catalogic (2012) and TOPKAT (2004), show that biodegradation is very slow or recalcitrant and that the half-life in water would be on the order of several months. In addition, a primary biodegradation model, BIOWIN Sub-model 4 (primary survey model), predicts the substance is recalcitrant. This is comparable to the overall persistence (Pov) of 260 days that is predicted by the OECD POPs tool.
DP appears to be well covered by the number of fragments and molecular size on the basis of the domain of applicability for BIOWIN submodels 5 and 6 (aerobic biodegradation, MITI). The molecular weight falls within the range covered by BIOWIN Submodels 3 and 4 (aerobic biodegradation, Expert Survey), however the domain includes substances with fewer aliphatic chloride fragments and fewer fragments containing carbon with four single bonds and no hydrogens. Although this introduces further uncertainty regarding the modelled results from submodels 3 and 4, the degradation predictions are in agreement with other modeled data as well as results from the empirical studies. They are also consistent with DP’s complex structure that is not amenable to microorganism attack.
Biodegradation modelling by both TOPKAT and Catalogic (2012) suggests that DP biodegrades slowly. TOPKAT suggests that probability of aerobic biodegradability for DP is nil (within the domain of the training sets). Catalogic (2012) identifies three low probability products (probability to obtain is 1 to 2 %, representing 7% quantity each, relative to parent DP) (C18H13Cl11O1, C18H12Cl10O1 , C18H12Cl10O2) that differ from dechlorination products identified in photodegradation studies described above.
The existing data for anaerobic degradation of DP suggests that if the substance degrades, it does very slowly. Data from a 1979 industry study indicated 0% anaerobic biodegradation over 2 to 6 weeks by wastewater biosolids microorganisms and no metabolites were identified (European Commission 2008, US EPA 2011).
These aerobic and anaerobic biodegradation tests, as well as modelling results, indicate that the half-life in water is likely to be longer than several months and that the substance is therefore likely to persist in water (Table 8‑3). Using an extrapolation ratio of 1:1:4 for a water: soil: sediment biodegradation half-life (Boethling et al. 1995), the half-life in soil is also longer than several months and the half-life in sediments is greater than a year, indicating that DP is expected to be persistent in soil and sediment.
| Medium | Fate process | Degradation value | Degradation endpoint / units | Methods | Reference |
|---|---|---|---|---|---|
| Activated sludge | Bio-degradation | 0.6% | 2 weeks Biodegradation BOD/% | OECD 301C (Modified MITI test) | US EPA 2011 |
| Wastewater biosolids | Aerobic Bio-degradation | 0% | 21-day Biodegradation/% | Standard methods for examination of water and wastewater (13th ed) 1971 | US EPA 2009; US EPA 2011 |
| Anaerobic wastewater biosolids | Anaerobic Biodegradation | 0% | 2 and 6 weeks biodegradation/% | Radiolabeled DP in effluent with anaerobic wastewater biosolids organisms | US EPA 2009; US EPA 2011 |
| Water | Primary Bio-degradation (aerobic) | 0.7766a “recalcitrant” | > several months | QSAR Model | BIOWIN 2010e |
| Water | Bio-degradation (aerobic) | -1.5964a “recalcitrant” | > several months | QSAR Model | BIOWIN 2010f |
| Water | Bio-degradation (aerobic) | -0.6853b “biodegrades slowly” | > several months | QSAR Model | BIOWIN 2010g |
| Water | Bio-degradation (aerobic) | 0.00b “biodegrades slowly” | > several months | QSAR Model | BIOWIN 2010h |
| Water | Bio-degradation (aerobic) | % BODc = 1(BOD = 1 in training set) “biodegrades slowly” | > several months | QSAR Model | Catalogic 2012 |
| Water | Bio-degradation (aerobic) | 0e “biodegrades slowly” | > several months | QSAR Model | TOPKAT 2004 |
a Output is a numerical score from 0 to 5
b Output is a probability score
c BOD – Biological Oxygen Demand
e Sub-model 4: Expert Survey (qualitative results)
f Sub-model 3: Expert Survey (qualitative results)
g Sub-model 5: MITI linear probability
h Sub-model 6: MITI non-linear probability
8.3 Potential for bioaccumulation
The evaluation of DP bioaccumulation potential examines several parameters, including physical chemical properties, bioconcentration factor (BCF), biomagnification factor (BMF), trophic magnification factor (TMF), and bioaccumulation factor (BAF). The role of metabolic biotransformation in determining bioaccumulation potential is also discussed. Empirical and some modelled data were considered. Most original (unpublished) industry experimental bioaccumulation/bioconcentration studies are not available to the Government of Canada, and data are only available from secondary sources (i.e., IUCLID format), therefore limiting the evaluation of study reliability and details. Bioacccumulation potential related data are considered using a weight of evidence approach.
On the basis of its physical and chemical properties (e.g., moderately large maximum diameter, very low water solubility, high log Kow, and low experimental BCF), DP is expected to have a low bioconcentration potential. However, monitoring studies from many parts of the world have reported measurable DP in aquatic and terrestrial organisms. Data for field-based BMF, BAF, and BSAF support that DP bioaccumulation and biomagnification occur. Studies of metabolism in wildlife (fish and birds) show no evidence of metabolic transformation products, suggesting little to no metabolism of DP. The log Kow for DP (8.78) is considered outside of the model domain (8.2) for the mass-balance three trophic level BCFBAF model (Arnot and Gobas 2003) and the (Q)SAR-based model (Dimitrov et al. 2005). Although modelling BCF and BAF for DP is undertaken, it is recognized that the predictions are extrapolated beyond empirical data within the model, and are thus less certain and considered a supporting line of evidence and included with supporting documentation (ECCC 2017).
8.3.1 Bioconcentration factor (BCF)
Experimental BCF data for DP exist from a few older studies (e.g., Boudreau 1973, Gara and Rauisina 1975, Chou et al. 1979, Zitko 1980, CHIRP c2008); see ECCC (2017). However, none are considered reliable because of various limitations (e.g., reported exposure concentrations greatly exceeding water solubility, short exposure times, and use of dispersants). The CHRIP study (c2008) exposed Japanese carp to DP for 8 weeks (0.0027 mg/L and 0.000027 mg/L, i.e., 2 to 4 orders of magnitude greater than water solubility), resulting in a BCF ranging from 14 to 121. Zitko (1980) found no DP uptake from water to fish tissue during 96 hours, but DP accumulation from food to tissue was observed (see next section). These studies do, however, indicate that uptake of DP in fish occurs, with DP concentrations reaching up to 8.8 mg/kg ww after 30 days in one study (Boudreau 1973). Furthermore, given the very low solubility of DP, it is expected that steady state (and therefore maximum DP tissue concentrations) would not be reached for a very long time (BCF could therefore be underestimated). For example, if assuming exceeding water solubility is the only limitation of the BCF studies, then recalculation of the BCF with a correction to reported water concentrations as described in Arnot and Gobas (2006), could result in much larger BCF values.
Owing to the limitations in the availability of DP bioconcentration studies, kinetic mass-balance modelling was conducted (ECCC 2017). However, the log Kow for DP (8.78) is considered outside of the model domain (approximately 8.2) for the mass-balance three trophic level BCFBAF model (Arnot and Gobas 2003) and the (Q)SAR-based model (Dimitrov et al. 2005). Although modelling BCF for DP is undertaken, it is recognized that the predictions are extrapolated beyond empirical data within the model, and are thus less certain. Despite this limitation, results are generally consistent with observed empirical data, suggesting that bioconcentration is insignificant.
Recent investigations relating fish BCF data and molecular size parameters (Dimitrov et al. 2005, Sakuratani et al. 2008) suggest that the probability of a molecule crossing cell membranes as a result of passive diffusion declines significantly with increasing maximum diameter (Dmax). Using the BCFmax Model with Mitigating Factors (Dimitrov et al. 2005), the maximum diameter of DP ranges from 1.35 to 1.48 nm. This suggests that the uptake rate of DP could be restricted to some degree by from steric effects at the gill surface.
At a log Kow of 8.78, the predicted bioavailable fraction of DP in the water column (excluding loss from volatilization) according to mass-balance fish models is 0.005%, which suggests that uptake from water via the gills is not a dominant exposure pathway for DP. It also suggests that the dietary uptake of DP contributes a significant proportion to the overall uptake of this chemical when both water and dietary considerations are considered (i.e., bioaccumulation).
8.3.2 Bioaccumulation factor (BAF)
BAF studies for DP are limited. A recent study in the North American Great Lakes reported DP in water (geomean DP for all lakes = 1.7 pg/L) and fish tissue, lake trout (Salvelinus namaycush) (geomean DP for all lakes = 0.37 ng/g lw, max DP = 1.05 ng/g lw in Lake Huron) (Guo et al. 2017). Fish logBAFs reportedon the basis of geomean DP (lipid weight) for syn and anti-DP were greater than 5 (i.e. BAF ~100 000, read from graph) (Guo et al. 2017). Using total-DP geomeans for fish and water above, the logBAF would be ~5.32 (i.e. BAF 210 230 on the basis of lipid weight) (assuming 5% lipid, BAF = ~10 510 ww).
Although few BAF values have been presented for Canadian aquatic systems, a preliminary examination of reported DP water concentrations (1.7 to 13.9 pg/L) and DP in fish tissue (70 to 1600 pg/g ww) from Lake Ontario collected within the last number of years suggests that high bioaccumulation in fish could be occurring (see data from Reiner et al. 2006; Tomy et al. 2007; Muir et al. 2011; Ismail et al. 2009; Shen et al. 2010; Shen et al. 2011a; Venier et al. 2014). Muir et al. (2014) reported a DP log BAF for Lake Ontario zooplankton of 9.1 (BAF=1.26 x 10⁹), and for mysids of 8.6 (BAF=3.98 x 10⁸)(BAFs calculated with DP invertebrate concentrations lipid weight), which suggest very high bioaccumulation.
A study conducted in a natural reservoir in South China near e-waste recycling plants compared DP in water and biota, and reported syn-DP and anti-DP were both significantly biomagnified in freshwater organisms (Wu et al. 2010). Data from DP in water (dissolved) and tissue (wet weight for 2 invertebrates, 4 fish, and 1 reptile) collected in 2006 are used for calculating BAF values. DP BAF values ranged from 135 to 25 118, with 4 of 6 test species showing significant/high bioaccumulation (authors identify this as log BAF of greater than 3.7). There were some uncertainties associated with this study including limited details on the analytical methodology, small sample sizes, and no information about water/biota collection times to support assumptions of “steady state.” Nevertheless, DP was detected in all aquatic species with concentrations from 19.1 to 9630 ng/g lw.
Zitko (1980) observed DP accumulation from food to tissue over a 42-day feeding period: a corrected accumulation factor of 0.024 was reported for the concentration at 28 days. However, there are several limitations with the methods used in this study for a hydrophobic substance like DP (e.g., Sverko et al. 2011). While the results are not reliable, the study does demonstrate uptake of DP in fish (maximum reported tissue concentration = 176 µg/kg ww after 15 days).
Owing to the lack of empirically derived BAF data available in the literature, metabolism corrected kinetic mass-balance modelling was conducted to help fill this data gap (ECCC 2017). However, at a log Kow of 8.78, the model is predicting bioaccumulation for a higher Kow than the substances with measured BAFs (e.g., PCBs) contained in the model’s dataset, and therefore results are less certain. Despite this limitation, results are generally consistent with observed empirical BAF data (Wu et al. 2010) suggesting bioaccumulation potential is high.
Studies reporting Biota-Sediment Accumulation Factors (BSAF) of greater than 1 are indicative of bioaccumulation in biota from sediment. Studies were identified with reported BSAF values ranging from 0.0003 to 11, with the majority reported as less than 1 (Table 8‑4). However, fish (rather than a sediment dwelling organisms) were often used in the reported BSAF studies, and as sediment is not the only (or primary) route of DP exposure to these organisms this may influence BSAFs to be less than 1,
BAF data show potential for high DP bioaccumulation. In general, these studies support the BMF and TMF studies presented in section 8.3.3 to suggest bioaccumulation of DP does occur.
| Method | Test organism | Duration | BAF or BSAF (L/kg, ww unless otherwise stated) | Reference |
|---|---|---|---|---|
| BAF-field samples | Great Lakes, North America | NA field samples | 210 227 Lake trout/ Walleye (lw) | Guo et al. 2017 |
| BAF-field samples | Lake Ontario, Canada | NA field samples | 3.98 x 10⁸ (Mysids lw) | Muir et al. 2014 |
| BAF-field samples | Lake Ontario, Canada | NA field samples | 1.26 x 10⁹ (Zooplankton lw) | Muir et al. 2014 |
| BAF-field samples | South China reservoir food web | NA field samples | 135 (Chinese Mysterysnail) | Wu et al. 2010 |
| BAF-field samples | South China reservoir food web | NA field samples | <5000 (Northern Snakehead) | Wu et al. 2010 |
| BAF-field samples | South China reservoir food web | NA field samples | >5000 (Prawn) | Wu et al. 2010 |
| BAF-field samples | South China reservoir food web | NA field samples | >5000 (Crucian carp) | Wu et al. 2010 |
| BAF-field samples | South China reservoir food web | NA field samples | >5000 (Mud carp) | Wu et al. 2010 |
| BAF-field samples | South China reservoir food web | NA field samples | 25 118 (Water Snake) | Wu et al. 2010 |
| BSAF-field samples | Freshwater foodweb, China | NA field samples | Total-DP:up to 9 (Crucian carp) | Wang et al. 2015 |
| BSAF-field samples | German Bight | NA field samples | Syn-DP: 0.2 (Dabs) | Sühring et al. 2016 |
| BSAF-field samples | NA | NA field samples | Syn-DP: 0.88 (0.33-2.8), Anti-DP: 0.33 (0.086-1.0) |
Wang et al. 2012 |
| BSAF-field samples | Crucian Carp (Carassius auratus) | NA | Total-DP: 0.004 Syn-DP: 0.007 Anti-DP: 0.003 |
Zhang et al. 2011b |
| BSAF-field samples | Mud Carp (Cirrhinus molitorella) | field samples | Total-DP: 0.025 Syn-DP: 0.01 Anti-DP:0.025 |
Zhang et al. 2011b |
| BSAF-field samples | Northern Snakehead (Ophicephalus argus) | NA field samples |
Total-DP: 0.003 Syn-DP: 0.06 Anti-DP: 0.001 |
Zhang et al. 2011b |
| BSAF -field samples | Lake Trout | NA field samples |
Syn-DP: 0.0008 Anti-DP: 0.0003 |
Shen et al. 2014 |
Abbreviation: NA, not available
8.3.3 Biomagnification factor (BMF)
A BMF exceeding 1 indicates that biomagnification is potentially occurring, and may be considered an indicator of the potential for uptake and accumulation in biota. Table 8‑5 presents empirical BMF data for DP.
Yu et al. (2013) examined biomagnification of DP within terrestrial avian food chains in Beijing, China. BMF values (lipid-normalized) were determined for predator owls (Bubo bubo and Athene noctuaa) and prey (Norway Rat, Rattus norvegicus), as well as for common kestrel (Falco tinnunculus) and its prey, the Eurasian tree sparrow (Passer montanus). BMF values were greater than 1 for the owl-rat food chain, but less than 1 for the sparrow-kestral foodchain. No stereoselective bioaccumulation was found for DP isomers in the investigated species.
A field study in South China (She et al. 2013) examined a small herbivorous food chain (paddy soils to rice plant to apple snails) and found that lipid normalized DP BMFs for rice plant (Oryza sativa) to apple snail (Pomacea canaliculata) ranged from 0.59 to 7.9, with mean values of syn-DP: 3.1, and anti-DP: 2.3 (Table 8‑5). These BMFs were comparable to those determined for the polybrominated diphenyl ethers (PBDEs) in the same samples.
Although BMFs of 5.2 for syn-DP and 1.9 for anti-DP were reported in a laboratory study on juvenile rainbow trout exposed to DP via dietary uptake (Tomy et al. 2008), a recent evaluation of the study (Arnot and Quinn 2015) suggests a ~100 fold error in the calculation, and estimates that lipid normalized BMFs are actually ~ 0.089 (syn-DP) and 0.046 (anti-DP). In the original study, sixty fish were exposed for 49 days, followed by a depuration phase of 112 days. The Tomy et al. (2008) study suggests syn-DP as more bioavailable (or more slowly transformed) than anti-DP (Table 8-5). The authors speculate that structural conformation differences of the pendant chlorocyclopentene moieties of the anti-isomer make it more susceptible to biological attack. Screening of fish liver suggests that, if DP metabolites are detected in aquatic food webs, it is likely not because of in vivo biotransformation of the parent compound. Despite the purposely high DP dose, no dechlorinated, hydroxylated, methoxylated, or methyl sulfone DP degrades were detected in liver extracts.
The extent of bioaccumulation of the syn- and anti-isomers of DP was assessed in archived food web samples from Lake Winnipeg and Lake Ontario (Tomy et al. 2007). Biomagnification was assessed using both calculated trophic level adjusted biomagnification factors (BMFTL) for the predator-prey relationships, as well as by trophic magnification factors (TMFs) (see section 8.3.4). For Lake Winnipeg, biomagnification was only found for the walleye-whitefish feeding relationship for the anti-DP isomer (BMFTL of greater than 11). The authors suggest that this indicated a stereoselective elimination of the syn-isomer in preference to the anti-isomer by walleye or that walleye can metabolize the syn-isomer more readily. In Lake Ontario, the trout-smelt feeding relationship showed BMFTL values of greater than 1 (anti-DP:11, syn-DP:12), and trout-alewife BMF was equal or just below 1. The authors suggest that lake trout, unlike walleye, are not stereoselectively accumulating or metabolizing the isomers, supporting their hypothesis of interspecies differences in bioaccumulation and biotransformation.
| Test organism | BMF (/kg) | Dietary Assimilation Efficiency (α; %)a | Reference |
|---|---|---|---|
| kestrel/sparrow | (BMF < 1) anti-DP: 0.35 syn-DP: 0.31 Total TP: 0.32 |
NR | Yu et al. 2013 |
| owl/rat | (BMF > 1) anti-DP: 1.9 syn-DP: 2.4 Total TP: 2.0 |
NR | Yu et al. 2013 |
| apple snails/rice plant | (BMF>1) syn-DP: 3.1 (0.63 to 7.9) anti-DP: 2.3 (0.59 to 4.7) |
NR | She et al. 2013 |
| Rainbow Trout (Oncorhyncus mykiss) | (BMF<1) ~0.046 (anti-DP) to (syn-DP) ~0.089 |
3.9 (anti-DP) to 6.0 (syn-DP) | Arnot and Quinn (unpublished manuscript); Tomy et al. 2008 |
| walleye/ whitefish (Lake Winnipeg) | anti-DP: 11 syn-DP: 0.3 |
NR | Tomy et al. 2007 |
| walleye/ whitesucker (Lake Winnipeg) | syn-DP: 0.6 | NR | Tomy et al. 2007 |
| walleye/goldeye (Lake Winnipeg) | anti-DP: 0.8 syn-DP: 0.4 |
NR | Tomy et al. 2007 |
| goldeye/ zooplankton (Lake Winnipeg) | syn-DP: <0.1 | NR | Tomy et al. 2007 |
| Lake trout/alewife (Lake Ontario) | anti-DP: 0.9 syn-DP: 1.0 |
NR | Tomy et al. 2007 |
| Lake trout/smelt (Lake Ontario) | anti-DP: 11 syn-DP: 12 |
NR | Tomy et al. 2007 |
| Lake trout/sculpin (Lake Ontario) | anti-DP: 0.1 syn-DP: 0.1 |
NR | Tomy et al. 2007 |
| sculpin/diporeia (Lake Ontario) | anti-DP: 0.2 syn-DP: 0.3 |
NR | Tomy et al. 2007 |
Abbreviation: NR, Not reported
a This is also called the absorption efficiency (ED or α) and is a measure of the transfer of a chemical from the gastrointestinal tract (GIT) into the organism relative to the total amount of chemical the organism is exposed to from the diet.
Although there are some uncertainties in the available biomagnification data, it is reasonable to consider that DP would biomagnify in food chains given its physical and chemical properties (high log Kow of 8.78 and log Koa of 12.99). DP may have the potential to biomagnify in terrestrial food webs as suggested by Gobas et al. (2003) and Kelly et al. (2007). However, these partition coefficients do not account for physiological parameters such as metabolism, and the available empirical data on bioaccumulation. The available biomagnification data suggest that BMFs for DP can exceed 1 in some feeding relationships, which suggests that dietary exposures may significantly contribute to trophic transfer and food web accumulation in the environment
In a study of dietary efficiency of chemicals by fish, Xiao et al. (2013) examined 15 chemicals, including DP, for gross absorption efficiency (Ed) using a benchmarking method (single exposure). Study fish were fed a single meal of contaminated feed, and then analyzed for chemical distribution after 5 days. DP apparent and “benchmarked” absorption efficiency (Ed) were estimated at 0.37 and 0.28, respectively.
8.3.4 Trophic magnification factor (TMF)
The TMF is a measure of the average biomagnification potential of a substance within a studied food web under field conditions, and is estimated by correlating the normalized substance concentrations in biota against different trophic levels.
Recently, total DP, (as well as individual isomers) was determined to biomagnify within an Antarctic food web covering nine aquatic species in the Fildes Peninsula (TMF of greater than 3 (referred to in study as foodweb biomagnification factor or FWMF)(Na et al. 2017). The biomagnification of anti-DP (TMF =3.34) was slightly higher than that of syn-DP (2.87).
Syn-DP and anti-DP were both significantly biomagnified in a food web of a reservoir nearby electronic waste recycling workshops in South China (Wu et al. 2010; see BAF section for study details). The study, conducted in 2006, determined TMFs of 11.3 (syn-DP) and 6.6 (anti-DP), indicating that both isomers of DP were significantly biomagnified throughout the food web. The TMF of syn-DP was almost two times greater than that of anti-DP, suggesting greater syn-DP biomagnification potential than that of anti-DP in the present food web. The depletion of anti-DP isomers in organisms compared to abiotic samples and a decrease in presence up the trophic levels also suggests possible stereospecific metabolism of the anti-DP and selective uptake of syn-DP.
Anti-DP and total DP were significantly biomagnified in an aquatic foodweb (two invertebrate and five fish species) from the Beijing-Hangzhou canal, located near the DP manufacturing facility in the Jiansu province of China (Wang et al. 2015). TMF values (lipid normalized) of 3.1 (syn-DP), 1.9 (anti-DP), and 2.2 (total DP) were reported, however the TMF vaue for syn-DP was not significant.
Similar findings were reported in a study of five fish species from 22 rivers across South Korea in 2008 (Kang et al. 2010). The proportion of anti-DP found in samples from urban-industrial sites was significantly lower than the technical DP standard, demonstrating that DP isomers exhibit varying bioaccumulation behaviours, with syn-DP bioaccumulating in biota more than anti-DP.
The lipid normalized TMFs for DP were determined on the basis of archived food web samples from Lake Winnipeg and Lake Ontario (Tomy et al. 2007). While there were differences in the TMFs of the isomers in the Lake Winnipeg food web, no statistically significant TMFs for either isomer were found for the Lake Ontario food web. A TMF of 2.5 for anti-DP and a TMF of less than1 for syn-DP were found in Lake Winnipeg.
8.3.5 Other bioaccumulation-related studies
A recent study of DP used liver microsomes of Montreal-breeding ring billed gulls (Larus delawarensis) to examine in vitro metabolism of DP (Chabot-Giguere et al. 2013). No degradation of either isomer occurred over the 90 minute assay.
In a study of European Starling (Sturnus vulgaris) eggs, DP was one of the most prevalent flame retardants detected in sampling sites across Canada (along with certain PBDEs). DP (both isomers) was detected in 41% of the examined egg pool homogenates with concentrations up to 24 ng/g ww (Chen et al. 2013), indicating maternal transfer.
A study of DP tissue distribution in two bottom fish species (northern snakehead and mud carp) in South China determined preferential distribution to liver relative to muscle for syn-DP, and a high persistent retention in the brain compared to liver for anti-DP, suggesting the latter isomer can cross the blood-brain barrier in fish (Zhang et al. 2011b). Median DP levels ranged from 0.18 to 39.1 and 0.22 to 52.9 ng/g ww for syn and anti-DP, respectively.
These wildlife studies provide variable evidence suggesting bioavailability and metabolism of DP, possibly suggesting that bioavailability and metabolic potential for DP may be species-specific and may vary between aquatic and terrestrial organisms.
8.4 Summary of environmental fate
DP is expected to be released to the environment through wastewater. There may be a potential for migration of DP from plastics to the atmosphere given that the substance is added to the polymer matrix and thus could leach to some extent, but there is currently no monitoring evidence to confirm its significance. A strong tendency to sorb to the solid phase in various media (including suspended air particles) indicates that DP will reside in biosolids, sediments, suspended air particles, and will be transferred to soil from dry deposition and application of biosolids to agricultural lands. Exposure to organisms in water is expected to be low. DP’s high intrinsic persistence suggests that long-term exposures can be expected in sediment and soil with a potential for significant build-up in near-field environments from continuous emissions. The removal process from the environment would include sediment and soil burial. DP might be expected to undergo long-range transport in air and deposition to remote environments because of the fine particle transport as has been evidenced with other hydrophobic flame retardants with high air particle sorption. Given this substance’s bioavailability, long-term exposure may result in elevated tissue levels in biota, food web transfer, and biomagnification.
9. Potential to cause ecological harm
9.1 Ecological effects assessment
Empirical data for DP, as well as relevant comparative data for the structural analogues, chlordane and mirex, were considered in the weight-of-evidence for assessing the ecological effects of DP. In addition to in vivo studies, recent DP in vitro studies have examined effects on cells in order to understand the mechanism of their effects on the endocrine system.
DP (Q)SAR toxicity modelling generally indicated no effects at saturation. The log Kow for DP also exceeded model cut-offs, and the substance was poorly covered by the domains of the toxicity models. Therefore, modelled predictions are considered uncertain.
For DP, results from most available empirical aquatic toxicity studies have high uncertainty and questionable applicability, mainly because treatment concentrations exceeded the DP water solubility limit by orders of magnitude. Furthermore, given that DP preferentially partitions to soil or sediment compartments, dissolved phase aquatic toxicity is not the most environmentally relevant form of testing for the effects of this substance. For this reason, potential aquatic effects are evaluated considering dietary exposure and the critical body residue (CBR) approach; less weight is given to water-phase exposure in the evaluation of ecological effects of DP.
DP is classified as a base surface narcotic/neutral organic and/or vinyl/allyl halide for aquatic toxicity by ECOSAR. Within the OECD QSAR Toolbox (2012) profile, DP is profiled as Class 4 (acting with a specific mode of action) according to the Verhaar toxicity classification. Using the the Cramner rules for toxicity classification, DP was classified as high (Class III). Within the OECD toolbox (OASIS v. 1.3), protein binding and DNA binding alerts are triggered because of the presence of the vinyl halide group. While DP’s mode of action may not be completely understood for aquatic organisms (e.g., sediment organisms), its analogues, the cyclodiene insecticides (e.g., chlordane), are generally considered neurotoxicants for terrestrial organisms (EC 1999).
Overall, the available studies show that chronic exposure to DP impacts a range of biomarkers relating to oxidative stress, genotoxicity, thryroid and sex hormones. Further elucidation is required to clarify, in terms of the pathway of these adverse outcomes, what molecular initiation could trigger subsequent key events and ultimately cause organ, or organism-level, changes.
On the basis of the results obtained from chronic toxicity testing of DP and the analogues chlordane and mirex, DP has the potential to cause effects at low concentrations to soil organisms such as earthworms and insects. DP’s analogue, chlordane, also has the potential to cause effects at low concentrations to sediment organisms. However, DP does not show potential for effects on wildlife on the basis of current rodent and avian studies.
9.1.1 Water
The aquatic toxicity potential from dietary uptake was evaluated considering the predicted behaviour of DP, i.e., a high degree of partitioning to particulates with a high degree of environmental stability and bioaccumulation potential via the diet.
Two recent studies have examined DP toxicity on aquatic organisms. Kang et al. (2016) investigated oxidative stress and endocrine disruption in zebrafish (Danio rerio) following gavage feeding of DP in corn oil. DP was delivered to fish on day 0 and day 2 (0.3 to 3 µg/g dose), resulting in fish tissue DP of up to 420 ng/g ww at day 6. Thyroid and sex hormone biomarker effects, as well as oxidative damage effects were measured at various doses. The authors suggest DP may alter regulatory pathways in the brain. However waterborne exposure of DP (up to DP 267 µg/L) in the same study to fish embryos and larvae did not affect development.
Baron et al. (2016) introduced DP to filter feeding mussels (Mytilus galloprovinciallus) via diet for 6 days, and reported DNA damage at the lowest concentration (algae diet dosed at 5.6 µg/L DP, corresponding to 4700 ng DP/mussel (4.7 µg/mussel)), suggesting genotoxic potential of DP. Micronuclei formation was also induced by DP at the highest diet concentration (algae dosed at 100 µg/L, corresponding to 21000 ng DP/mussel (21 µg /mussel)). Physiological responses to DP dose were not observed.
Gagne et al. (2017) examined 29 day exposure of blue mussels (Mytilus edulis) to DP in water and reported dose dependant DP accumulation. In addition, increased biomarkers of oxidative stress in gills (lipid peroxidation) were measured for DP tissue concentrations equal and greater than 0.98 ng/g ww (171.9 ng/g lw), which corresponded to a DP water exposure treatment of 0.01 µg/L. Genotoxic effects were not detected at the DP concentrations tested in this study.
The critical body residues (CBR) concept was applied to investigate the potential for adverse effects in a 5% lipid fish from the dietary uptake of DP. This concept considers whether the uptake of a chemical from the environment can accumulate to critical body burden levels associated with effects like mortality as a result of baseline narcosis. McCarty and Mackay (1993) and McCarty et al. (2013) have shown that internal concentrations of neutral narcotic chemicals in fish causing death are fairly constant at about 2 to 8 mmol/kg for acute exposures and 0.2 to 0.8 mmol/kg for chronic exposures. McCarty and Mackay 1993 provide the mathematical formula to estimate critical body residue in fish as follows:
CBR = BAF (5% lipid) x water concentration of chemical / MW
where:
CBR: critical body residue in fish (mmol/kg)
BAF (5% lipid): can be BAF or BCF lipid normalized to 5% (L/kg)
MW: molecular weight of the substance (g/mol) Chemical concentration in water (mmol/L)
The CBR was calculated using the modelled BAF value of 2.12 x10⁶ (ECCC 2017) The water solubility was used as the environmental concentration in surface water (i.e., if environmental concentrations in surface waters approach levels equivalent to the water solubility limit, then it can be ascertained whether there is a potential for adverse effects through the food web; e.g., fish and mammalian piscivores) (see Table 9-1).
As a second approach, the highest DP concentration reported in fish tissue from Canada (0.85 ng/g ww) was converted to CBR units and compared to the threshold. In addition, as DP exposure via diet is the most likely exposure pathway, the biota-diet fugacity was also determined (ECCC 2017).
| Approach | DP water concentration (mg/L) | BAF (L/Kg) | CBR (mmol/kg) | Meets Acute CBR effects for baseline narcosis (lethality) (2 – 8 mmol/kg) | Meets Chronic CBR effects for baseline narcosis (lethality) (0.2 – 0.8 mmol/kg) |
|---|---|---|---|---|---|
| Modelled BAF | 2.85 x 10⁻⁷a | 2.12 x 10⁶b | 9.24 x 10⁻⁴ | no | no |
| Biota sample | N/A | N/A | 1.30 x 10⁻⁶c | no | no |
Abbreviations: N/A, not applicable
a Key water solubility limit used as DP water concentration. Using ECHA (2013) DP measured water solubility limit (less than 1.67 x 10⁻⁶), CBR = 5.19 x 10⁻³ mmol/kg.
b Highest DP modelled BCFBAF (2010).
c Highest mean DP in Canadian fish tissue (Lake Trout, Lake Ontario) reported as 0.85 ng/g ww in Ismail et al. 2009).
The estimated CBRs are below thresholds for acute and chronic lethality. Using maximum Canadian fish tissue concentration compared with CBR thresholds also demonstrates that acute and chronic adverse lethality is not expected. However, the potential for sublethal effects remains.
9.1.2 Empirical studies in sediment
As no sediment toxicity data were found for DP, mirex and chlordane sediment toxicity data were reviewed for read-across to DP. For mirex, while several aquatic toxicity studies for fish and invertebrates (e.g., crustacea) have been undertaken, and have shown high toxicity (Environment Canada 1977, IPCS 1984), no sediment-based toxicity studies with usable toxicity endpoints were found.
For chlordane, Canadian interim sediment quality guidelines (ISQGs) have been established on the basis of field determined data sets and spiked toxicity testing (e.g., marine organisms) (CCME 1999). The ISQG report presents a freshwater ISQG of 4.5 µg/kg dw and a probable effect level (PEL) of 8.87 µg/kg dw, as well as a marine ISQG and PEL of 2.26 and 4.79 µg/kg dw, respectively. Field studies, where benthic invertebrate effects were associated with chlordane in sediment, include a Canadian study conducted in Toronto Harbour where decreased species richness and decreased abundance of chironomids were associated with a mean sediment chlordane level of 10.5 µg/kg dw (although other organochlorine pesticides were also present) (CCME 1999; Jaagumagi 1988; Jaagumagi et al. 1989). Another study identified a decrease in bivalve density in response to chlordane additions to New Zealand mid-tide sand flats, where near surface chlordane concentrations reached ~ 7.5 µg/kg dry fines (Pridmore et al. 1991). Toxicity studies identified in the ISQG report include a New Zealand study of the marine bivalve, Macoma Liliana, exposed to chlordane in sediment bioassays (Roper and Hickey 1994). The study showed significant sublethal avoidance movement out of chlordane dosed sediment at 20 µg/kg dw (96 h), and acute effects, LC10 and LC50, at 111 and 238 µg/kg dw. The ISQG report also discusses a study from Canada; a 96h LC50 of 120 µg/kg dw for chlordane was reported for the marine shrimp (Crangon septemspinosa) in sediment tests (McLeese and Metcalfe 1980). Another Canadian study by McLeese et al. (1982) reported a 288h LC50 of less than 5.8 mg/kg dw for the marine sandworm (Nereis virens). More recent studies of chlordane effects on sediment organisms generally examine mixtures of contaminants rather than effects directly attributable to chlordane alone.
| Test Organism | Test type | Endpoint | Sediment chlordane in (µg/kg dry weight (dw))c | Reference |
|---|---|---|---|---|
| Marine shrimp (Crangon septemspinosa) | sediment toxicity: survivala | 96h LC50 | 120 | McLeese and Metcalfe 1980 |
| Marine Sandworm (Nereis virens) | Prolonged sediment toxicity: survivala | 288h LC50 | <5.8 | McLeese et al. 1982 |
| Marine bivalve (Macomona liliana) | Prolonged sediment toxicity: survivala | 10d LC50 | 238 | Roper and Hickey 1994 |
| Marine bivalve (Macomona liliana) | Prolonged sediment toxicity: survival a | 10d LC10 | 111 | Roper and Hickey 1994 |
| Marine bivalve (Macomona liliana) | Prolonged sediment toxicity: avoidancea | 96h avoidance | 20 | Roper and Hickey 1994 |
| Freshwater sediment (benthic) organisms | field sediment and benthic invertebrate data surveyb | decrease in species richness and Chironomidae abundance | 0.0105 | CCME 1999 |
| Marine sediment (benthic) organisms | experimental field sediment and benthic invertebrate data studya | decrease in bivalve density | ~7.5 dry fines (near surface) | Pridmore et al.1991 |
| Database of freshwater sediment organisms | N/A | Freshwater ISQG | 4.5 | CCME 1999 |
| Database offreshwater sediment organisms | N/A | Freshwater PEL | 8.87 | CCME 1999 |
| Database of marine sediment organisms | N/A | Marine ISQG | 2.26 | CCME 1999 |
| Database of marine sediment organisms | N/A | Marine PEL | 4.79 | CCME 1999 |
Abreviations: LC, lethal concentration; ISQG, interim sediment quality guidelines; PEL, probable effect level
a Technical chlordane used in study.
b Sampling survey of benthic invertebrates and sediments in Lake Ontario (Toronto Harbour); therefore likely exposure to chemical mixture, not only chlordane.
c Spiked-sediment toxicity tests for chlordane report the onset of toxicity to benthic organisms at higher concentrations than those observed in field studies. This is likely a result of the shorter exposure times of these laboratory studies, as well as exposure to chlordane only as opposed to chemical mixtures containing chlordane (Environment Canada 1998).
A CTV of 0.120 mg/kg is selected for DP (based on chlordane) in sediment. This CTV is the lowest endpoint representative of a sediment organism (Crangon septemspinosa) found in Canada. An assessment factor of 10 is used, to adjust a short-term acute toxicity endpoint (96 h LC50) to a chronic no-effect level, as well as an additional uncertainty factor of 10 is used to address inter/intra species variation (only 3 species tested). The resulting CTV is 0.0012 mg/kg dw. When this value is adjusted from test organic carbon content (0.28%) to standard sediment organic carbon content (3%) (Webster et al. 2004), the PNEC for sediment organisms is determined to be 0.0129 mg/kg dw. As the test sediment contained 0.28% OC, the maximum solubility of DP (based on analogue chlordane) in sediment was ~9.45 mg/kg dw (ECCC 2017). The sediment solubility limit was therefore not exceeded under the conditions of the study.
9.1.3 Empirical studies in soil
Limited soil toxicity studies for DP exist, therefore data for the analogues chlordane and mirex were also reviewed.
Yang et al. (2016) exposed the terrestrial earthworm (Eisenia fetida) to 0.1, 0.5, 6.25, and 12.5 mg/kg DP for 28 days to examine lethality, oxidative stress, neurotoxicity, and cellulose effects. While mortality and weight were not affected by DP during the 28-days, effects on oxidative stress, enzyme activity (neurotoxicity and cellulose) and DNA damage were measured at the lowest doses (e.g. less than 0.1 to 0.5 mg/kg). The authors concluded that long-term exposure of DP causes stress on earthworms, and that oxidative stress plays a significant role in DP toxicity.
Zhang et al. (2014) exposed the terrestrial earthworm (Eisenia fetida) to 0.1, 1, 10, and 50 mg/kg DP for 14 days to examine lethality, oxidative damage, neurotoxicity, and transcriptomic profiles. Acute toxicity was low (no significant treatment effects on body weight or lethality at any treatment concentration); however, oxidative damage and effects on neuronal damage-related genes and pathways were reported.
Several soil toxicity tests for chlordane and mirex have been undertaken (Table 9‑2), although most are several decades old and report different endpoints. Earthworm (Lumbricus terrestris) 5-day post wound healing was assessed after 10 to 30 days exposure to chlordane in artificial soil (Cikutovic et al.1999). The percent of worms completely healed 5 days post-wounding ranged from 75% to 81.2%, at the lowest concentration (6.25 ug/mg dw); no LOEL was determined. Survival (20 hour LD50) of field cricket (Gryllus pennsylvanicus) was reported as 0.89 ppm soil (assume 0.89 mg/kg dw), in a soil bioassay where crickets were placed on soil one hour after soil treatment with chlordane (Harris et al. 1964).
The knockdown dosage (KD30) and lethal dosage (LD50) values of mirex were determined for the land isopod (Armadillidium vulgare) and the soil millipede (Oxidus gracilis) by feeding with a diet containing different concentrations of technical mirex powder (Kuang and de la Cruz 1977). The KD30 and LD50 values (from food) for A. vulgare at 10 days exposure were 4.1 ppm (assume equivalency to 4.1 mg/kg dw) and 35.2 ppm, respectively; and for O. gracilis, 2.7 ppm and 198.7 ppm, respectively. Rajanna and de la Cruz (1975) conducted a phytotoxicity study to examine the effects of mirex on germination, emergence, and growth of seedlings of commonly grown field and pasture crops (see ECCC (2017) for species list). Total germination, seedling emergence, and early growth were reduced in several plant species relative to the controls when exposed to concentrations at or above the lowest test concentration of 0.15 ppm soil (0.15 mg/kg dw). Significant mirex effects on seedling growth rate at 2 weeks (dry weight of I00 seedlings) were found for all 6 species; crimson clover, johnson grass, and annual rye grass showed significant reduction in growth rate at 0.15 ppm soil mirex (0.15 mg/kg); tall fescue and alfalfa at 0.30 ppm soil (0.30 mg/kg); and alsike clover at 0.70 ppm soil (0.70 mg/kg).
| Substance (DP, Mirex, Chlordane) | Test organism | Test type | Endpoint | Value (mg/kg dw, unless otherwise stated) | Reference |
|---|---|---|---|---|---|
| DP | Eisenia fetida | oxidative stress, neurotoxicity, cellulose, DNA damage | Lethality/ Body weight 28-d exposure | >12.5 | Yang et al. 2016 |
| DP | Eisenia fetida | oxidative stress, neurotoxicity, cellulose, DNA damage | Antioxidant enzyme activities/ oxidative damage/ AChE and Cellulose activity/ DNA damage 28-d exposure | 0.1– 0.5 (varies with test) | Yang et al. 2016 |
| DP | Eisenia fetida | Acute toxicity, oxidative stress, neurotoxicity | Lethality/ Body weight | >50 | Zhang et al. 2014 |
| DP | Eisenia fetida | Acute toxicity, oxidative stress, neurotoxicity | oxidative stress markers, enzyme activity | 0.1– 50 (varies with test) | Zhang et al. 2014 |
| Chlordane | Earthworms (Lumbricus terrestris) | Prolonged soil toxicity: Post-wound healing | 5d post- wound healing 10d exposure | <6.25 (81.2% worms healed) | Cikutovic et al.1999 |
| Chlordane | Earthworms (Lumbricus terrestris) | Prolonged soil toxicity: Post-wound healing | 5d post- wound healing 20d exposure | <6.25 (75.0% worms healed) | Cikutovic et al.1999 |
| Chlordane | Earthworms (Lumbricus terrestris) | Prolonged soil toxicity: Post-wound healing | 5d post- wound healing 30d exposure | <6.25 (80.9% worms healed) | Cikutovic et al.1999 |
| Chlordane | Field cricket (Gryllus pennsylvanicus) | Soil toxicity: survival | 20h LD50 | 0.89 ppm soilb | Harris et al. 1964 |
| Mirex | Isopod (Armadillidium vulgare) | Soil toxicity, dietary exposure | 10d KD30 | 4.1 ppm | Lue and de la Cruz 1977 |
| Mirex | Isopod (Armadillidium vulgare) | Soil toxicity, dietary exposure | 10d LD50 | 35.2 ppm | Lue and de la Cruz 1977 |
| Mirex | Millipede (Oxidus gracilis) | Prolonged soil toxicity: dietary exposure | 10d KD30 | 2.7 ppm | Lue and de la Cruz 1977 |
| Mirex | Millipede (Oxidus gracilis) | Prolonged soil toxicity: dietary exposure | 10d LD50 | 198.7 ppm | Lue and de la Cruz 1977 |
| Mirex | crimson clover (Trifolium incarnatum), johnson grass (Sorghum halpense, annual rye grass (Lolium multiflorum) | Prolonged soil toxicity: seedling growth rate | 2 week signicant reduction seedling growth rate | <0.15c | Rajanna and de la Cruz 1975 |
Abbreviations: LD, lethal dose; KD, knockdown dose
a Reported as broadcast dosage need to kill 50% of worms by pesticide; presented as LD50 in this assessment.
b Not clear if ppm represents mg/L solution added to soil, or mg/kg soil dw.
c Reported in study as mg/kg soil, converted for this assessment.
On the basis of available endpoints from soil toxicity studies, the concentration of less than 0.15 mg/kg dw (2-week reduced growth rate for 3 plant species) is selected as the CTV based on analogue mirex, representing the lowest, prolonged study value. Given the uncertainty related to inter-/intra-species variation (2 trophic levels covered by analogue data) for chronic endpoints, an assessment factor of 10 is applied. Furthermore, given the CTV is an unbounded value (i.e., effects at lowest concentration in test), an additional assessment factor of 10 is applied. The resulting CTV is 0.0015 mg/kg dw. When this value is adjusted from test organic carbon content (0.04%) to standard soil (2% organic carbon content; ECHA 2010), the PNEC for soil organisms is 0.075 mg/kg dw. As the test soil for this latter study contained 0.04% OC, the maximum solubility of DP (based on analogue mirex) was ~ 31.7 mg/kg dw.
9.1.4 Empirical studies in wildlife
There are limited DP studies relevant to wildlife. Standard mammalian (rodent) repeated dose toxicity studies conducted with DP have generally shown no adverse effects up to the highest dose tested: e.g., 5000 mg/kg-bw/day (90-0day rat study, Oscarson 1975; 28 day oral dose/reproductive rat study Brock et al. 2010). At the highest administered dose of 25 000 mg/kg-bw/day, DP had no effect on Sherman-Wistar rats in an acute oral study and the NOAEL after 90 days in a repeated (sub-chronic) study was 100 000 ppm (USEPA 2008, cited by Crump et al 2011). See the Human Health Effects section for detailed analysis of other rodent and other mammal toxicity studies.
Crump et al. (2011) studied concentration-dependent effects of DP using in vivo and in ovo toxicity approaches in domestic chicken (Gallus gallus domesticus) embryonic hepatocytes and chicken embryos. DP was injected to eggs prior to incubation, and monitored until pipping (or day 22). No overt toxic effects were observed up to the maximum dose of 3uM in hepatocytes, and up to the highest nominal DP dose (500 ng/g/egg) for pipping success. Furthermore, no changes to the mRNA transcript levels of the target genes were observed, despite the target genes responding to other flame retardants (e.g., HBCD) in earlier studies. The authors concluded that DP did not significantly affect cytotoxicity or embryonic viability in the chicken at concentrations 10 times greater than those detected in herring gull eggs in the Great Lakes. However, a shift in isomeric content of syn- and anti-DP was detected between stock solutions and hepatic tissue; the proportion of syn-DP increased from 0.34 to 0.65, as anti-DP decreased (0.66 to 0.35).
Li et al. (2013) studied the effect of DP on male common quails (Corturnix coturnix) continuously exposed to commercial DP by gavage for 90 days at dose concentrations ranging from 1 to 100 mg/kg bw/d. Liver enzyme activity and oxidative stress were measured. The authors reported DP effects on some measures of enzyme activity (e.g., significant decrease of PROD in all exposed groups relative to the control, significant increase in ERND and the antioxidant enzyme catalase in high exposed groups relative to control). Furthermore, the study found DP was more prone to accumulate in liver (vs. serum, muscle), and syn-DP accumulated (vs. anti-DP) in the high-exposure DP groups.
| Test organism | Test type | Endpoint | Value | Reference |
|---|---|---|---|---|
| Domestic chicken (Gallus gallus domesticus) | wildlife toxicity: pipping success | 90 d Cytotoxicty, Pipping success, mRNA expression | >500 ng/g egg (nominal dose), >3 uM for cytotoxicity | Crump et al. 2011 |
| Common quail (Corturnix coturnix) | Wildlife Sub-chronic- | 90 d enzyme activity measures | 1 mg/kg bw/d | Li et al. 2013 |
The existing mammalian and avian studies suggest that although DP may be bioavailable to wildlife, it is not overtly toxic (no effects at highest dose). However, the recent molecular level avian studies suggest DP may affect enzyme activity levels in test species, although the ecological relevance of these results is not clear.
A CTV of 5000 mg/kg bw/day (no adverse effect up to the highest dose = 5000 mg/kg bw/day) from Brock et al. (2010) was selected from a range of laboratory rodents tests, based upon a 28-day combined repeated-dose and reproductive toxicity study conducted according to OECD guidelines (see Health Assessment Section). This NOAEL was supported by an older, unpublished 90-day oral dose study (Oscarson 1975). Assuming exposure to small mammals like voles and shrew, the Wildlife Toxicity Reference Value (TRV) approach (Sample et al. 1996) was used to normalize effects in rats to a typical body weight of a shrew, which represents a surrogate wildlife species for mammals consuming soil organisms (see ECCC (2017) for input values), resulting in a TRV of 11798 mg/kg bw/day. An assessment factor of 10 was applied to account for extrapolation from laboratory to field conditions. The resulting shrew TRV was 1179.8 mg/kg bw/day.
Assuming exposure to wildlife, the same CTV of 5000 mg/kg bw/day (no adverse effect up to the highest dose = 5000 mg/kg bw/day) from Brock et al. (2010) was selected to determine the TRV for wildlife (piscivores). The Wildlife Toxicity Reference Value (TRV) approach (Sample et al. 1996) was used to normalize effects in rats to a a typical body weight of mink (Mustela vison) and river otter (Lontra canadensis) respectively, which represent surrogate wildlife species, resulting in TRV wildlife estimates of 3769 and 2288 mg/kg bw/day (see Supporting Documentation, ECCC (2017) for input values). An assessment factor of 10 was applied to account for extrapolation from laboratory to field conditions. The resulting wildlife TRV was 228.8 (otter) to 376.9 (mink) mg/kg bw/day.
9.2 Ecological exposure assessment
While measured DP concentrations in the environment have been presented, limited data concerning concentrations of DP in water in Canada have been identified. Therefore, environmental concentrations have been estimated from available Canadian information, including estimated substance quantities, estimated release rates, and characteristics of the receiving environment. Environmental concentrations have been estimated for industrial release scenarios, as described below.
9.2.1 Exposure scenarios and predicted environmental concentrations
The aquatic exposure to DP is expected if industry (e.g., manufacture, formulation) releases DP either directly or to a wastewater treatment system that discharges its effluent to water. The concentration of the substance in the receiving water near the discharge point of the wastewater system is used as the predicted environmental concentration (PEC) in evaluating the aquatic risk of the substance. It can be calculated using the equation:
PEC = [1000 x Q x L x (1 - R)] / (N x F x D)
where
PEC aquatic concentration resulting from industrial releases, mg/L
Q: total substance quantity used annually at an industrial site, kg/yr
L: loss to wastewater, fraction
R: wastewater system removal rate, fraction
N: number of annual release days, d/yr
F: wastewater system effluent flow, m3/d
D: receiving water dilution factor, dimensionless
Several conservative aquatic industrial release scenarios were developed to cover a range of known DP industrial activities that could occur in Canada. The scenarios include: manufacturing of wires and cables, automobile manufacturing, and manufacturing of hard plastic connectors. Information from the different facilities considered was collected and scenarios reflected expected practices and conditions, including type of wastewater treatment, and direct or indirect releases to the receiving environment.
As some DP is imported in bulk in part of a liquid mixture which may generate residues in transport containers, container cleaning operations may lead to environmental releases of these substances. Although environmental concentrations of DP resulting from these releases may be high, these releases would likely be episodic in nature and probably of short duration. Given these considerations and the current data gaps associated with container cleaning operations and practices, a quantitative exposure characterization was not developed.
Table 9‑5 presents the range of inputs used to estimate the resulting aquatic concentrations close to the industrial point of discharge. On the basis of these assumptions, these industrial scenarios yield predicted aquatic environmental concentrations (PECs) of 4.38 x 10⁻⁸ to 2.8 x 10⁻⁵ mg/L for total (dissolved and particle associated) DP. The aquatic PEC value represents the level of exposure in the receiving water near the point of the discharge at each site.
| Input | Value | Justification and reference |
|---|---|---|
| Quantity used per site (kg/yr) | <10 000 | Range includes site quantities identified in a section 71 survey or EC assumptions determined from sec. 71 data |
| Loss to wastewater (%) | 0.01 to 1.0 | OECD 2004, 2009 |
| Wastewater system removal efficiency (%) | 60 and 94 | Predicted for primary and secondary treatment (STP Model 2.1, highest removal rate of 4 models) |
| Number of annual release days (days) | 250 to 350 | EC standard assumption for continuous releases |
| Wastewater system effluent flow (m3/d) | 14 024 to 65 700 | Site specific wastewater treatment system data |
| Dilution factor (–) | 1 to 10 | Site specific wastewater treatment system flow rate/receiving environment flow rate. When a dilution factor was greater than 10, a maximum default value of 10 was used. |
In addition to modelled industrial releases of DP, DP effluent and biosolids monitoring data from eight Canadian WWTS (encompassing lagoon, primary, secondary, and advanced liquid treatment processes) were considered in additional scenarios in the exposure analysis (Shanmuganathan et al. 2017). Predicted aquatic environmental concentrations (PECs) derived from measured effluent DP (i.e. max dilution factor=10) ranged from 2.85 x 10⁻⁷ to 9.3 x 10⁻⁵ mg/L for total (dissolved and particle associated) DP.
An equilibrium sediment-water partitioning approach was used to estimate the concentration of DP in bottom sediment. This approach is based on a partitioning principle described by the European Chemicals Agency (ECHA 2010) and incorporates two additional calculation methods. The first method is to estimate the substance’s concentration in the aqueous phase (dissolved) of the overlying water from its total concentration, according to studies by Gobas (2007 and 2010). The second method is to estimate a substance’s concentration in bottom sediment from its concentration in the aqueous phase of the overlying water on the basis of an equilibrium partitioning assumption between bottom sediment and overlying water described by the USEPA’s National Center for Environmental Assessment (US EPA 2003). At equilibrium, the predicted environmental concentration (PEC) in bottom sediment can linearly correlate with the concentration in the aqueous phase of the overlying water. Sediment exposure scenarios were developed using aquatic PECs from the industrial aquatic release scenarios, as well as PECs from WWTS monitoring across Canada described above, to determine equilibrium sediment PECs, standardized to 3% organic carbon (a typical organic carbon content in bottom sediment for rivers and lakes) (Webster et al. 2004). The resulting PEC in bottom sediment ranged from 0.2 to 380 µg/kg dw (0.0002 to 0.38 mg/kg dw).
The sediment PEC range is similar to the range of measured sediment DP in the Great Lakes. For example, DP in tributary sediment measured for Lake Superior was 1.6 µg/kg dw, (percent organic carbon not specified; Shen et al. 2011b), and the highest DP concentrations measured in sediments from the Niagara River (flowing between Lakes Erie and Ontario) were up to 310 µg/kg dw (in a Niagara River tributary), and 586 µg/kg dw in open water sediment from Lake Ontario (percent organic carbon for the sample is not provided) (Shen et al. (2011a, b) and Sverko et al. (2008)). The Niagara River has a long history of industrial activity and related discharges, including the manufacture of DP at Niagara Falls, New York, which has influenced the relatively high chemical concentrations along the river and in Lake Ontario (Shen et al. 2011a, b). The degree to which the DP source in these areas originated in Canada is not clear.
An approach described by the ECHA (2010) was used to estimate predicted environmental concentrations in soil (soil PECs) resulting from the land application of wastewater biosolids. This approach employed the quantity of biosolids accumulated within the top 20 cm layer (ploughing depth) of soil over 10 consecutive years as the basis for soil PECs. The underlying assumption of the approach was that substances were subject to no loss because of volatilization, leaching and soil run-off upon their entry into soil via biosolids land application; however, loss owing to degradation was considered (half-life of 2 years in soil was assumed). Soil exposure scenarios were developed from the scenarios described above, using biosolids concentration and production rates on the basis of site specificWWTS. The estimated concentration in biosolids ranged from 0.012 mg/kg dw to 5.1 mg/kg dw, and the resulting soil PECs (standardized to 2% organic carbon (ECHA 2010)), ranged from 1.39 x 10⁻⁴ to 0.059 mg/kg dw.
In addition to the estimated biosolids concentrations above, measured biosolids data from WWTS monitoring at eight locations across Canada (described above) were used in the same ECHA (2010) approach to determine soil PECs. Measured DP in WWTS biosolids ranged from 0.38 mg/kg dw to 0.74 mg/kg dw, and the resulting soil PECs (standardized to 2% organic carbon (ECHA 2010)), ranged from 0.0044 to 0.0084 mg/kg dw.These latter soil PECs, on the basis ofmeasured biosolids data, fall within the range of soil PECs from modelled biosolids data from industrial scenarios.
A Wildlife Total Daily Intake (TDI) was derived for the shrew consuming soil organisms (worms) exposed to DP applied to soils as a function of biosolids application using the BASL4 model. By using the maximum predicted DP concentration in biosolids (5.1 mg/kg) and assuming application to soils once per year over 10 years (and degradation half-life of 2 years), the resulting TDI is 0.0716 mg/kg bw/day. This value is considered conservative because the BASL4 model does not consider metabolism in its estimate.
A Wildlife Total Daily Intake (TDI) for mink (Mustela vison) and river otter (Lontra canadensis) consuming fish were estimated following the approach of US EPA (1993). In calculating the TDI, a lake trout tissue concentration (Ci) of 0.00085 mg/kw (ww), was selected representing the highest published mean concentration of DP in Canadian biota (Ismail et al. 2006), resulting in a PEC of 1.10 x 10⁻⁴ (mink) to 1.16 x 10⁻⁴ (otter) mg/kg bw/day (ECCC 2017).
In addition to industrial sources of DP, commercial products or products available to consumers can represent a source of DP to the environment (e.g., via volatilization and particulates from abrasion (ECB 2004)). Although there is almost no data quantifying releases from products available in the literature, the presence of DP in dust samples (see Human Health section 10.1.1.2), and WWTS media (influent, effluent, and biosolids) (Kolic et al. 2009; Davis et al. 2012; LaGuardia et al. 2012, Shanmuganathan et al. 2017), support that the substance can be released from commercial products or products available to consumers (Davis et al. 2012). A recent Canadian study of WWTS found detection of total dechlorane plus (DP, syn and anti) greater than 90% in both wastewater and biosolids samples; the concentrations ranged from 17 to 247 ng/L, 2 to 139 ng/L, and 96 to 740 ng/g dw in influents, effluents, and biosolids, respectively. Median removal efficiencies across all eight WWTSs were between 51 and 66% for total DP (Shanmuganathan et al. 2017). For dust, recent high-volume active air sampling at a semi-urban location in Toronto, Canada, determined DP was one of the most frequently detected OFRs (Shoeib et al. 2014), suggesting non-point diffusive sources. Similarly, other studies in Canada have attributed the detection of DP in household dust to DP-containing products available to consumers, as there were no nearby DP manufacturing facilities (e.g. Zhu et al. 2007). Median dust levels of DP were the second highest relative to other non-PBDE brominated flame retardants measured in the recent Canadian Household Dust Survey of 413 homes (see Human Health section 10.1.1.2), although median DP was lower than dust concentrations of organic phosphate based flame retardants in the same study. A 95th percentile concentration of 152.1 ng/g for Canadian household dust was determined for this assessment (see Human Health Section 10.1.1.3), which suggests DP release from this route is measureable.
While service life release rates were not found for DP, a study by Kemmlein et al. (2003) determined specific emission rates (SER) of 0.3 ng/m2/h for decaBDE (from OctaBDE mixture) during a 105-day test of television set housing (23 ᵒC). OECD (2009) identifies potential volatility to atmosphere from service life for generic OFRs in plastics, estimated at 0.05% over lifetime for indoor or outdoor use; however, this generic value may be an overestimate for a very low volatility OFR like DP. Environmental release of the substance from plastic polymers via leaching is considered possible, albeit low. The potential release of OFRs from plastics during service life to water is estimated at 0.05% over lifetime if the substance is for indoor use or 0.16% over service life if use is outside (OECD 2009a). The large majority of products would be enclosed/indoor use therefore the release rate of 0.05% is more likely (OECD 2009a). A coarse scenario for the diffuse release of DP from commercial products and products available to consumers in Canada was determined, assuming the indoor release rate of 0.05% per year over service life from OECD (2009a). Using the upper range import quantity for Canada in 2011 (10 000 kg), it was assumed the entire quantity was used in commercial products and products available to consumers; resulting in a release estimated at 5 kg. This scenario includes a number of assumptions: the maximum values from range of import, complete use of DP in products, that all use in products in Canada is known and reported, low exposure to water over the service lifetime, and indoor use. This result suggests that release of DP from commercial products and products available to consumers is limited. However, the scenario result is considered to be highly uncertain.
Overall, releases from commercial products and products available to consumers are expected to be geographically dispersed and spread out over the duration of the service life and end of life stages. While the scenario presented above may provide a coarse estimate of release to the environment during the service life of commercial products and products available to consumers, there is an absence of data to quantitatively address solid waste disposal of dust and end of life releases from all manufactured items, including non-residential sources. Of the eight WWTS that were part of a Canadian effluent sampling campaign (Shanmuganathan et al. 2017), several are receiving and treating leachate from nearby landfills (personal communication from Emerging Priorities Division ECCC, Feb 1, 2018). The average per capita loading of DP for three of the WWTS that receives landfill leachate was >4 times higher than the average per capita loading of DP for the WWTS that did not receive leachate. This suggests that landfill leachate may represent a non-negligible source of DP in WWTS influent. However, because the total quantity of DP entering landfills through end-of-life products, manufactured items or other materials is not known, and because concentrations of DP in landfill leachate were not measured, it is not presently possible to confirm or quantify the contribution of landfill leachate as a source of DP to WWTS.
9.3 Characterization of ecological risk
9.3.1 Risk quotient analysis
A risk quotient analysis, integrating conservative estimates of exposure with toxicity information, was performed for the sediment and soil media, as well as for wildlife, to determine whether there is potential for ecological harm in Canada. A risk quotient analysis was not conducted for the aquatic environment because of the low likelihood of DP exposure via water and unreliable aquatic toxicity data. The aquatic CBR (discussed above) suggests low likelihood of lethality to aquatic organisms through water exposure; however, sublethal effects cannot be ruled out.
The site-specific industrial scenarios and measured WWTS data presented above (Section 9.2.1) yielded a predicted environmental concentration (PEC) of 4.38 x 10⁻⁸ to 9.3 x 10⁻⁵ mg/L for total DP. This PEC value represents the level of exposure in the receiving water near the point of the discharge. Using the aquatic PEC in water to determine equilibrium sediment PECs, standardized to 3% OC, the resulting sediment PEC is 0.0002 to 0.38 mg/kg dw. A predicted no-effect concentration (PNEC) of 0.0129 mg/kg dw (17.1 µg/kg dw) was derived from a chronic marine sediment organism toxicity study for analogue chlordane (see Ecological Effects section). The resulting risk quotient (PEC/PNEC) = 0.01 to 29.9.. Therefore, harm to sediment organisms is possible for these industrial scenarios. Furthermore, if considering upper range sediment DP concentrations measured in the southern Great Lakes region, (e.g., 2.23-586 µg/kg dw for surficial sediment concentrations in Lake Ontario in samples collected in 1998 (Sverko et al. 2008)), the risk to sediment organisms could be greater.
Using a similar risk quotient approach, predicted soil PECs resulting from biosolids applications to land (standardized to 2% OC) ranged from 1.39 x 10⁻⁴ to 0.059 mg/kg dw. The PNEC for soil organisms (based on plant toxicity values for analogue mirex) is 0.075 mg/kg dw (See Ecological Effects section). The resulting risk quotients (PEC/PNEC) are 0.002 to 0.78. This suggests harm to soil organisms is currently unlikely for these scenarios. However, it is noted that in at least one scenario, the risk quotient is close to 1, therefore a change in factors contributing to a higher soil PEC (e.g. much larger quantity used, or soil degradation half-life greater than assumed 2 years), could result in possibility of risk to soil organisms.
A Wildlife TDI was derived for the shrew consuming soil organisms (worms), using the BASL4 model, which calculates soil DP from wastewater biosolids applied to land. In calculating the TDI, the maximum predicted DP concentration in biosolids was assumed (5.1 mg/kg), over a 10-year exposure, resulting in a TDI of 0.0716 mg/kg bw/day. The derived TRV was 1179.8 mg/kg bw/day (see Ecological Effects Assessment section). The resulting risk quotient result (TDI/TRV) is 6.1 x 10⁻⁵for shrew, indicating that even with conservative assumptions, current DP concentrations in Canadian biota are unlikely to exceed minimum effects levels (Table 9‑6).
The Wildlife piscivore TDI was derived for mink (Mustela vison) and river otter (Lontra canadensis) consuming fish following the approach of US EPA (1993). A lake trout tissue concentration (Ci) of 0.00085 mg/kw (ww), was selected representing the highest published mean concentration of DP in Canadian biota (Ismail et al. 2006), resulting in a TDI of 1.10 x 10⁻⁴ (mink) to 1.16 x 10⁻⁴ (otter) mg/kg bw/day (see Supporting Documentation, ECCC (2017)) for details of TDI model inputs). The derived TRV was 376.9 (mink) and 228.8 (otter) mg/kg bw/day (see Ecological Effects Assessment section). The resulting risk quotient results (TDI/TRV) are 2.93 x 10⁻⁷ for mink and 5.08 x 10⁻⁷ for otter, indicating that even with conservative assumptions, current DP concentrations in Canadian biota are unlikely to exceed minimum effects levels (i.e., by 10 000 fold margin) (Table 9‑6).
| Media | Scenario | PNEC or TRV | PEC or TDI | RQ |
|---|---|---|---|---|
| Sediment | Industrial scenario release to water and monitored WWTS release to water | 0.0129 mg/kg dw | 0.0002 to 0.38 mg/kg dw | 0.01 to 29.9 |
| Soil | Biosolids application to soil (industrial scenario and monitored WWTS biosolids) | 0.075 mg/kg dw | 1.39 x 10⁻⁴ to 0.059 mg/kg dw | 0.002 to 0.78 |
| Wildlife (Soil organisms) | Shrew (consuming worms;10-year exposure) | 1179.8 (shrew) mg/kg bw /day | 0.0716 mg/kg bw /day | 6.1 x 10⁻⁵ |
| Wildlife (Piscivore) | Piscivore (mink and otter/fish) | 376.9 (mink) 228.8 (otter) mg/kg bw /day | 1.10 x 10⁻⁴ (mink) 1.16 x 10⁻⁴ (otter) mg/kg bw /day | 2.93 x 10⁻⁷ (mink) 5.08 x 10⁻⁷ (otter) |
9.3.2 Consideration of the lines of evidence and conclusion
DP is expected to be persistent in water, soil and sediment. DP is predicted to have moderate to high bioaccumulation potential, and the substance is found widespread in biota at high concentrations (e.g., up to greater than 100 µg/kg dw), suggesting bioaccumulation is occurring. Although there is low importation quantity of DP into Canada, effluent monitoring data from WWTSs across Canada, as well as environmental measurements from certain regions of Canada (e.g. Great Lakes region) suggest DP is entering the Canadian environment. Some of this DP environmental exposure is potentially because of proximity to DP manufacturing sources in the Great Lakes region (e.g., Niagara Falls, New York). DP is a High Production Volume substance in the USA, and therefore environmental transport of DP may occur from the northern USA to Canada, resulting in higher exposure and risk for Canadian organisms in certain regions of Canada (i.e., southern Great Lakes). However WWTS effluent monitoring data indicate that DP exposure in Canada is greater than predicted by some estimates on the basis of reported Canadian usage. This information, along with information on its uses, indicates potential for release into the Canadian environment. Once released into the environment, DP will be found mainly in sediment and soil, where it may persist for long periods of time. On the basis of the measurements obtained from remote regions and modelling results, DP, via sorption to particles, also has potential for long-range transport and deposition in remote areas.
DP ecotoxicity studies are lacking. DP ecotoxicity tests using ‘non-apical’ endpoints demonstrate DP effects (oxidative stress, genotoxicity, etc.) in soil and aquatic organisms. In addition, the DP ecotoxicity analogues used in this assessment, chlordane and mirex, demonstrate potential for toxicity to sediment and terrestrial organisms. However, as these substances are more bioavailable than DP, they are conservative and represent more toxic analogues for determining PNECs. Using these conservative PNECs, there is risk of harm to sediment organisms (and approaching risk to soil organisms at one scenario). Owing to the possibility of exposure from DP sources in the Great Lakes region, as well as the uncertainty relating to potential increases in DP usage within Canada (e.g., as an alternative flame retardant to DecaBDE in a range of flame retardant applications of electronic wiring and cables, automobiles, plastic roofing materials, and hardplastic connectors), precaution is warranted.
Additionally, although not evaluated in this assessment, considering the detection of other “declorane-related” analogues (e.g., Dec 602, Dec 603, Dec 604, CP) in the Canadian environment and in biota at concentrations in the range of DP (or in some cases higher), the potential for cumulative effects of similar “Dechlorane Plus-like” substances should be considered. DP-related compounds also include impurities formed through side reactions in DP synthesis (e.g., 1,4-DP, VCH-DP, 1,3- DPMA, 1,5-DPMA ) (Sverko et al. 2010). Information on production, applications, physical-chemical properties, and toxicity are lacking for all these substances, but initial studies indicate they may have similar P and B characteristics to DP (Sverko et al. 2011).
This information indicates that DP has the potential to cause ecological harm in Canada.
9.3.3 Uncertainties in evaluation of ecological risk
A lack of empirical data and a reliance on modelling contributes to several sources of uncertainty for the ecological assessment of DP. Estimation of physical chemical property data largely required the use of (Q)SAR models and while attempts were made to keep these properties internally consistent, owing to its very hydrophobic nature, the substance can be problematic for modelling. Consequently, there is a moderate level of confidence with properties that govern bioavailability and uptake (e.g., partition coefficients), particularly those used for further exposure and toxicity modelling (i.e., log Kow).
There is high confidence that DP is very stable in the environment with a long residence time and will bioaccumulate in organisms from exposures via the food web or direct contact with soil or sediment rather than from water.
Limited empirical BAF data lead to the use of mass-balance models for supporting information. These models are highly sensitive to log Kow error, metabolism rate error and dietary assimilation efficiency. BAF modelling is thus regarded with a low to moderate level of confidence.
Industrial scenario PEC estimates in soil and sediment are mass-balance model based. Several of the model parameters are known to be variable (emission factors, removal rates in WWTSs, biosolids adsorption, effluent release limits) and thus contribute to a range of predicted environmental concentrations. However, recent DP monitoring data (effluent and biosolids) from 8 WWTS across Canada support the range of predicted sediment and soil PECs for Canada. It is difficult to quantify the impact of the uncertainty of these parameters on soil PEC estimates, as there is as of yet no reliable Canadian monitoring data from near field emission sources for DP soil comparison purposes. Consequently, conservative estimates of the PEC are used for further exposure analysis to wildlife, but overall there is a moderate level of confidence with the emission scenarios used to generate PEC values.
Exposure scenarios for use in risk analysis were developed on the basis of the best available information, and they are considered sufficiently protective to characterize potential risks from releases from the use of DP to the Canadian environment. Even with conservative assumptions of DP quantities in use at industrial sites, risk quotients were less than one for most soil scenarios, suggesting low current risk for these organisms. However, the risk quotient approached one for one soil scenario (risk quotient = 0.78). Uncertainty in this scenario relates to factors described in soil PEC estimates above.
There is limited information characterizing potential releases from products in use and during disposal/recycling of at the end of their service life. Furthermore there is uncertainty with respect to the quantity of products in use. While a coarse exposure scenario was developed which suggested low quantities for dispersed release of DP from commercial products and products available to consumers, this area of the assessment represents an area of uncertainty of DP exposure to organisms in Canada. Furthermore recent WWTS monitoring data suggest DP from commercial products and products available to consumers may be an important source.
Additionally, DP is a High Production Volume substance in the USA; therefore, environmental transport of DP may occur from the northern USA to Canada, resulting in higher exposure for Canadian organisms than determined by some exposure estimates on the basis of current DP use in Canada. Owing to the uncertainty surrounding DP exposure levels in Canada, follow-up monitoring is recommended.
An important area of uncertainty relates to the data gaps for DP toxicity to sediment-dwelling and terrestrial organisms. There are limited analogue options for DP, given that the most similar chemical analogues to DP also lack ecotoxicity data for soil and sediment. Using chlordane and mirex as analogues is likely conservative (i.e., the analogues are likely more toxic), as they are considered more bioavailable than DP. Despite similar predicted modes of action among these substances, the analogue substances are not a 1:1 read-across for similarity with DP, therefore differences in degree of toxicity between DP and these analogues are likely. Furthermore, toxicity studies for these analogues are several decades old and details are limited, contributing uncertainty to study results. However, ‘non-apical’ DP toxicity studies suggest chronic effects in the range of concentrations identified for analogues, supporting conclusions on DP toxicity. There is moderate level confidence with the soil and sediment toxicity data in this assessment.
Limited short-term mammalian repeated oral dose toxicity data were available for DP for wildlife toxicity assessment. Therefore, there is a moderate level confidence with the mammalian toxicity data used for wildlife assessment.
Finally, while assessment of “dechlorane-related” substances (e.g., Dechlorane 602, Dechlorane 603, Dechlorane 604 etc. described in section 2.2 of Substance Identity) is beyond the scope of the current screening assessment, data for environmental media and biota concentrations, as well as data for fate and behaviour and toxicity (including the potential for cumulative exposure and effects with DP) is important to understand how similar these substances are to DP.
10. Potential to cause harm to human health
10.1 Exposure assessment
This exposure assessment is based on the total exposure to DP isomers (i.e., the combined exposures to both the anti-DP and syn-DP isomers). Therefore only the sum of DP isomers is reported and used to derive estimates of intakes of DP.
10.1.1 Environmental media and food
Based on its very low water solubility and low to very low vapour pressure, DP is expected to partition predominantly to particles, dust, soil and sediment when released in the environment. DP is identified as a highly sorptive substance, sorbing to particles in air (see section 8).
Canadians may be exposed to DP in air, dust, soil, sediment, water and food, including breast milk. Conservative estimates of daily intake of DP are presented in Appendix C. For all age groups, the main contribution to the estimated daily intake was from food, followed by the ingestion of dust and the inhalation of air particles. DP exposure via the ingestion of water and soil was found to be very low and was considered negligible. The highest estimate of daily intake was 8.3 ng/kg-bw/d for young children (0.5 to 4 years of age).
10.1.1.1 Ambient air
DP has been monitored in ambient air in Canada and elsewhere (see section 7). Hoh et al. (2006) were the first to report the occurrence of DP in the environment in 2004 at IADN sites along the Great Lakes, where DP was frequently detected (>90%) in outdoor air. DP concentrations at the Canadian site (Point Petre, a rural site) were measured up to 21 pg/m3 (n=12). However, DP concentrations were highest (max of 490 pg/m3) at the Sturgeon Point, New York (NY), site (polulation 10 000), with a median of 2.5 pg/m3. The authors noted that the elevated concentrations at Sturgeon Point, a relatively rural site, were possibly associated to emissions from the nearby DP manufacturing facility in Niagara Falls, NY (Hoh et al. 2006). Other IADN studies have been published since 2006 and have also observed higher DP levels at the Sturgeon Point site (Venier and Hites 2008; Salamova and Hites 2011; Venier et al. 2015). Salamova and Hites (2011) did not observe any significant changes in air concentrations of DP from 2005 to 2009; however, the authors observed a significant increase in DP concentration with increasing distance to the manufacturing plant in Niagara Falls, NY (Salamova and Hites 2011).
In a separate air monitoring study in the Great Lakes region, conducted by Environment and Climate Change Canada (spanning 2008-2010), the highest DP concentrations were measured up to 340 pg/m3 in samples (n=30) collected at the Burnt Island, Ontario site (Hung et al. 2016).
Two recent ambient air monitoring studies conducted in Toronto, Canada, showed that DP was frequently detected (>90%), and concentrations were measured up to 7.5 pg/m3 (n=70) for samples collected between 2010 and 2012 (Diamond et al. 2013; Shoeib et al. 2014).
In addition to Canadian monitoring in the Great Lakes region, DP has also been monitored in Alert, NU, a remote location in the Canadian High Arctic (Xiao et al. 2012). Concentrations were found up to 2.1 pg/m3 in samples (n=14) collected in 2006-07, indicating that DP may be available for long-range atmospheric transport (see section 8.1.1).
The maximum concentration of 340 pg/m3 measured in Canada in the Great Lakes area by Environment and Climate Change Canada (Hung et al. 2016) was selected for deriving daily intakes of DP from ambient air for the general population in Canada. This value is considerably higher than those at other Canadian locations (e.g., Hoh et al. 2006; Shoeib et al. 2014), and is similar to the highest concentrations measured at the IADN Sturgeon Point site (Hoh et al. 2006) near a point source. These estimates are expected to represent general population exposures, including northern populations, given the lower levels measured in the Canadian North (i.e., Xiao et al. 2012).
10.1.1.2 Indoor air
A recent study by Venier et al. (2016) measured DP in indoor air in Toronto, Ontario at levels up to 316 pg/m3, with a median of 38 pg/m3 (n=34) for total DP (i.e., both syn and anti isomers). Cequier et al. (2014) investigated the occurrence of DP and 36 other flame retardants in Norwegian households (n=48) and classrooms from two primary schools (n=6). DP isomers were detected in 4% of residential samples but were not detected in the school classrooms. Concentrations in residential living rooms ranged from not detected (mdl not specified) to 15 pg/m3 (sum of the individual isomeric maximum values). An additional study in Europe was identified that measured DP in a limited number of indoor air samples (n=3) (specific indoor environment not specified) in 2009 from Norway; however, DP was not detected (detection limit of 16 pg/m3) (TemaNord 2011). The maximum concentration of total DP (316 pg/m3) reported by Venier et al. (2016) was selected for deriving daily intakes of DP in indoor air for the general population.
10.1.1.3 Dust
DP is ubiquitous in house dust based on its high detection frequency in several Canadian and international house dust studies (Appendix D).
DP was targeted in the Canadian baseline study of halogenated flame retardants in samples of household dust collected in 2007-2010 across 13 Canadian cities within the Canadian House Dust Study (CHDS) as per the method described by Fan et al. (2016). DP was detected in 100% of samples (n=498), and concentrations ranged from 3.40 to 2508 ng/g (method detection limit [MDL] = 1.53 ng/g), with a median and 95th percentile of 14.4 ng/g and 152.1 ng/g, respectively (Kubwabo et al., manuscripts in preparation, Environmental Health Science and Research Bureau (EHSRB), Health Canada; unreferenced, dated June 5, 2017).
DP was also detected (>90%; n=20) in samples collected in 2012 across the Greater Toronto Area (GTA), ON, where concentrations ranged from not detected (detection limit = 4 ng/g) to 170 ng/g, with a mean of 34.5 ng/g (Diamond et al. 2013). DP was detected in 99% of house dust samples collected during 2007-08 from homes (n=116) in Vancouver, Canada (Shoeib et al. 2012). Samples were collected from houses of female participants in the Chemicals, Health and Pregnancy (CHiRP) study. DP concentrations in this study ranged from not detected (detection limit = 0.7 ng/g) to 354 ng/g with a median of 7.3 ng/g and a 95th percentile of 57.7 ng/g (Shoeib et al. 2012). In a separate study, DP was also detected in all dust samples collected in Canadian households in Ottawa, ON in 2002-03 (n=69) at concentrations ranging from 2.3 to 182 ng/g, with the exclusion of one sample measured at 5683 ng/g that could not be explained based on questionnaire responses (Zhu et al. 2007). The median and 95th percentile for this sample set were 14 and 121 ng/g, respectively. As there are no nearby DP manufacturing facilities in Ottawa, the authors noted that the detection of DP in household dust was likely due to DP-containing products available to consumers.
Recently published Canadian studies measured DP in dust in 35 homes and 10 offices in Toronto in 2012 (Abbasi et al. 2016) and 23 homes in Toronto in 2013 (Venier et al. 2016). Concentrations of DP in dust ranged from not detected to 732 ng/g with similar results found for homes and offices. Abbasi et al. (2016) also analyzed the association of DP in dust from the 2012 study with dust on products (n=65) in the same locations. DP was not detected in any product wipes in this study, which the authors suggest is because of the bias towards products containing bromine rather than chlorine (x-ray fluorescence-Br was used to screen products prior to sampling).
DP has also been found to be ubiquitous in US house dust, and concentrations are generally similar to those measured in Canada. DP was detected in all samples collected from living area surfaces of 16 homes in California in 2006 and 2011, with concentrations ranging from 3 to 47 ng/g (median up to 10 ng/g) (Dodson et al. 2012). DP was also detected in all dust samples (n=38) obtained in 2002-03 from homes in Boston, Massachusetts (samples from study participants’ vacuums), where DP concentrations were found up to 111.5 ng/g, with a median of 13.1 ng/g (Johnson et al. 2013).
DP has also been targeted for analysis in dust from aircraft cabins. Allen et al. (2013) sampled dust from 19 commercial aircrafts manufactured between 1986 and 2003 by Boeing, Airbus, Canadair Regional, McDonell Douglas or Embraer. Dust samples were collected from the 19 aircrafts, with one aircraft being sampled twice, for a total of 40 samples, but the specific sampling years and airport location were not specified. DP was detected in 100% of samples. For dust collected from aircraft carpeting, DP concentrations ranged from 132 to 13 700 ng/g with a median of 440 ng/g, while for dust collected from air vents DP ranged from 65 to 11 800 ng/g with a median of 460 ng/g (Allen et al. 2013).
The DP 95th percentile concentration (152.1 ng/g) from the Canadian House Dust Study (personal communication from EHSRB, Health Canada, dated June 5, 2017) was selected for deriving intake estimates of DP via dust ingestion for the general population in Canada. Although concentrations in certain environments (e.g., aircrafts) may be higher, the overall magnitude of these exposures (frequency and duration) are expected to be lower than those conservatively estimated for daily intake based on household dust for the general population of Canada.
10.1.1.4 Soil and sediment
No monitoring data on DP in soil in Canada were identified (see section 7). However, several studies have monitored DP in sediments in the Great Lakes region (Sverko et al. 2008; Sverko et al. 2010; Shen et al. 2010; Shen et al. 2011). For example, DP was detected in all surficial sediment samples collected in the Great Lakes from 2001-07, and concentrations of total DP ranged from 0.014 to 110 ng/g dw, with the highest concentrations having been measured in samples from Lake Ontario (Shen et al. 2010).
A maximum DP soil predicted environmental concentration (PEC) of 59 000 ng/g dw (0.059 mg/kg dw) was estimated for land application of biosolids on an agricultural field using conservative approaches (see section 9.2.1). As no appropriate or relevant monitoring studies on DP in soil for Canada were identified, the soil maximum PEC (59 000 ng/g dw) was selected for upper-bounding intakes from the ingestion of soil for the general population in Canada.
10.1.1.5 Drinking water
No studies were identified that reported DP in drinking water from Canada or elsewhere. However, DP has been monitored in surface water in Canada and elsewhere (see section 7). Great Lakes monitoring studies have shown that DP concentrations are highest in Lake Ontario, at 13.9 pg/L, in monitoring spanning 2005-12 (Muir et al. 2011 and 2014; Venier et al. 2014). As no drinking water data were available, drinking water exposure was characterized using surface water monitoring data. Daily intakes of DP for the general population of Canada were based on the highest DP concentration measured in the Great Lakes (mean of 13.9 pg/L reported for Lake Ontario) (Venier et al. 2014). The use of surface water is considered to be a conservative surrogate for estimating intakes from drinking water, as no removal from drinking water treatment is taken into account.
10.1.1.6 Food
No studies were identified that reported DP in marketed foods in Canada. However, DP has recently been measured in three categories of baby food (formula, cereal, and purée) bought in the U.S. and China in 2013 (Liu et al. 2014). DP concentrations in formula (n=12), cereal (n=15) and purée (n=8) from the U.S. were measured up to 83.2, 427 and 23.6 pg/g wet weight (ww), respectively. DP concentrations in formula (median of 16 pg/g fresh weight) were an order of magnitude higher than those recently reported for breast milk (median of 1.6 pg/g fresh weight) from nursing women in Canada (Zhou et al. 2014; ww concentrations obtained from personal communication with Environmental Health Science and Research Bureau (EHSRB), Health Canada, dated May 15, 2014; see section 10.1.1.7). Of note, the maximum cereal sample concentration (427 pg/g ww) collected in the U.S. was the second highest total DP level in the Liu et al. (2014) study. Similarly, in a separate market basket study conducted in Japan DP was present in four food groups (i.e., sugar and confectionary; legumes and their products; fish, shellfish and their products and; meat and eggs) at concentrations ranging from 1.5 to 3.3 pg/g ww (Kakimoto et al. 2014). The authors noted that contamination may have been from the raw materials such as wheat and sugar or by contamination through the confectionary making process (Kakimoto et al. 2014). Fish concentrations measured in the Japanese study were lower than levels reported by Ismail et al. (2009) for Lake Ontario lake trout. In an earlier study, DP was measured in halibut from Greenland (440 pg/g) marketed for Japanese consumption (Kakimoto et al. 2012). Finally, a previous study suggested that vegetables, grains, and fish from a DP polluted area of China were highly contaminated by DP, with total DP concentrations ranging from 56.8 for loach to 2700 pg/g for green onion (Hoh et al. 2006).
DP has been reported in biota in Canada, and several studies have reported on the detection of DP in fish the Great Lakes region (Hoh et al. 2006; Shen et al. 2010; Ismail et al. 2009; Muir et al. 2011; Muir et al. 2014, Guo et al. 2017). The highest concentrations were associated with archived samples of lake trout collected in Lake Ontario from 1979-2004. Mean DP concentrations peaked in 1988 at 7.2 ng/g lipid weight (lw) (0.85 ng/g ww), and decreased in subsequent years to 2.3 ng/g lw (0.31 ng/g ww) in 2004 (Ismail et al. 2009). In contrast, in a separate study, DP concentrations ranged from 0.14-0.91 ng/g lw in archived walleye fish samples collected from 1980 to 2000 from Lake Erie, USA, and did not show an increase or decrease over time (Hoh et al. 2006). Recently, Guo et al. (2017) reported geometric means of DP ranging from 0.15 ng/g lw (Lake Superior and Lake Michigan) to 1.03 ng/g lw (Lake Huron) for lake trout samples collected in 2010 from each of the Great Lakes (see Section 7). DP fish monitoring of samples collected from Lake Winnipeg between 2000 and 2003 by Tomy et al. (2007) showed mean concentrations of DP of 0.054 ng/g lw in whitefish, 0.430 ng/g lw in mussels, 0.450 ng/g lw in burbot, and 0.816 ng/g lw for goldeye (n=5 for each species). Houde et al (2014) reported that DP was not detected in whole body homogenates of yellow perch samples from the St Lawrence River, Quebec.
As for DP monitoring in northern regions, DP was not detected (detection limit not specified) in the majority of fish muscle and liver samples analyzed in Nordic countries (TemaNord 2011). DP was measured in blubber samples from belugas in the Canadian Arctic (mean = 1.28 ± 0.15 ng/g lw) (Simond et al. 2017) as mentioned in section 7. DP was measured in fish liver from Norway (Schlabach et al. 2011), blue mussel from Iceland (Schlabach et al. 2011), perch from Finland (TemaNord 2011), and halibut from Greenland (Kakimoto et al. 2012); however, concentrations were generally below the upper bound value (7.2 ng/g lw) measured in Lake Ontario lake trout (Ismail et al. 2009). DP was not detected in caribou in a food web study in the Canadian Arctic (personal communication, Aquatic Contaminants Research Division, Environment Canada October; November 2014; unreferenced).
Daily intake estimates of DP for the general population from the consumption of infant formula, cereal products, mixed dishes and soups food groups were based on the maximum concentrations of formula, cereal and mixed purée, respectively, measured in samples purchased in 2013 in U.S. stores (Liu et al. 2014). Daily intake estimates of DP from the consumption of fish were estimated based on the maximum concentration of 7.2 ng/g lw (or 0.85 ng/g ww) measured in Lake Ontario lake trout (Ismail et al. 2009). This concentration is considered appropriate for deriving upper-bounding intakes for the general population of Canada given the assumption that DP is present at this concentration in 100% of fish, shellfish, and related food items. Although certain northern populations in Canada may, seasonally, consume larger quantities of seafood or game in their diet this estimate is considered conservative enough to account for this variability.
10.1.1.7 Breast milk
DP biomonitoring in breast milk has been reported in Canada (i.e., Siddique et al. 2012; Zhou et al. 2014) and China (Ben et al. 2013; Appendix E). DP was detected in >85% of breast milk samples (n = 87) collected from two Canadian cities: Kingston, Ontario (n=39; collected in 2003–04) and Sherbrooke, Quebec (n=48; collected in 2008-09). DP concentrations in the Kingston samples ranged from not detected (detection limit = 0.05 ng/g) to 6.4 ng/g lw, and from not detected to 8.0 ng/g lw in the Sherbrooke samples. The median concentration for samples from the Kingston cohort was 0.74 ng/g lw and the 95th percentile was 3.4 ng/g lw. The median and 95th percentile concentrations for the Sherbrooke cohort were 0.58 ng/g lw and 2.1 ng/g lw, respectively (Siddique et al. 2012).
DP was detected in 55% of breast milk samples collected in 2008-09 from a separate and larger (n=105) cohort of nursing women from Sherbrooke, Quebec (Zhou et al. 2014). In this study, DP concentrations ranged from not detected (detection limit = 0.010 ng/g) to 15 ng/g lw with a median of 0.074 ng/g lw (equivalent to 1.6 pg/g ww) and 95th percentile of 3.5 ng/g lw. A limitation in this study included the unrecorded timing of sampling—sampling of each subject may have occurred from delivery to six months following delivery (Zhou et al. 2014). DP was also measured in breast milk from mothers residing both near and at a distance from heavy e-waste recycling activities in China (Ben et al. 2013). DP concentrations in mothers near e-waste areas (median of 4.46 ng/g lw; n=44) were higher than those residing away from these areas (median of 2.19 ng/g lw; n=44) (Ben et al. 2013), and concentrations in both areas were higher than reported in the Canadian studies.
Estimated daily dietary intakes were obtained for nursing infants based on the 95th percentile concentration of 0.054 ng/g ww (converted to 0.06 µg/L whole milk based on a breast milk density of 1.03 g/mL) from participants from Sherbrooke, Quebec (Zhou et al. 2014; ww concentrations obtained from personal communication with EHSRB, Health Canada, dated May 15, 2014).
10.1.2 Products available to consumers
DP is an additive flame retardant used to treat several polymers used in various applications such as electrical wire coatings, hard plastic computer and TV connectors, plastic decorations, and roofing material (Weil and Levchik 2004; Oxychem 2004; see section 5), and these uses can be reasonably expected in Canada. In Canada, confirmed uses of DP include automobile manufacturing, such as sensor assemblies (Environment and Climate Change Canada 2013-2014). DP concentrations in plastics range from 8% in polybutylene terephthalate (PBT) up to 40% in silicon rubber (OxyChem 2007).
DP has not been identified to be present in products intended for children, such as toys, that would lead to frequent exposure for children. Also, in preliminary product testing conducted by Health Canada, DP was not detected (LOQ of 0.3%) in 39 subsamples collected from 23 children’s manufactured items (e.g., foam chair, nursing pillows, toys, etc.) purchased in retail stores in Ottawa, Ontario, in January and May 2014 (Health Canada 2014). While children have been observed to opportunistically mouth a wide variety of objects not intended for mouthing, including electrical and electronic products, the frequency and duration of mouthing of these objects is not expected to be higher than those from mouthing of toys or other manufactured items intended for children (Juberg et al. 2001).
As an additive flame retardant, DP may be released from treated polymers through abrasion; however releases due to leaching or migration are expected to be limited by the physical-chemical properties of this substance. Due to DP’s low vapour pressure, inhalation exposure is expected to be low. The negligible water solubility of DP also limits the potential for water, sweat or saliva-mediated transfer or migration. Based on current information regarding DP’s use profile and physical-chemical properties, potential for exposure of the Canadian general population to DP from manufactured items, including vehicles, is low, and exposure estimates were therefore not derived. Also, exposure from manufactured items is expected to be accounted for indirectly through intake estimates of DP via indoor air and dust (see sections 10.1.1.2 and 10.1.1.3).
10.1.3 Biomonitoring
In addition to human milk (section 10.1.1.7, Appendix E), DP has been measured in several biological matrices including blood serum, placental tissue, and cord serum (Appendix F). In Canada, DP isomers were detected in the majority (87%; LOD 0.12 ng/g lw) of maternal blood serum samples (n=102) collected in 2008-09 from mothers following delivery in Sherbrooke, Quebec (Zhou et al. 2014). DP concentrations in serum ranged from not detected (detection limit = 0.08 ng/g lw) to 81 ng/g lw, with a median of 2.4 ng/g lw and a 95th percentile of 31.6 ng/g lw. The ratio of the two DP isomers found in human serum samples, calculated as anti/(anti + syn), was found to be 0.8 which is similar to the ratio reported in the DP technical mixture.
In Europe, DP was also frequently detected (94%; LOQ of 0.16 ng/g lw) in 48 banked serum samples collected in France (Brasseur et al. 2014), as well as in serum samples collected from 46 women in Norway participating in a mother-child cohort study (no samples were collected from children) (Cequier et al. 2015). Serum samples collected in France in 2003-05 were from an equal number of women and men residing within the vicinity of a municipal solid waste incinerator; DP concentrations ranged from not detected to 7.04 ng/g lw with a median concentration of 1.2 ng/g lw. In samples collected from Norwegian women, DP concentrations ranged from not detected to 31 ng/g lw with a median concentration of 1.3 ng/g lw. In a separate mother-toddler paired study in Sweden involving 24 mothers and their toddlers (11-15 months), DP was not frequently detected (method limit of quantification, mLOQ, of 140 pg/sample for the anti isomer). DP was detected in serum from one toddler (148 ng/g lw; individual isomeric values summed) and one mother (88 ng/g lw; individual isomeric values summed). These samples were not from the same household (Sahlstrom et al. 2014). No production source has been identified in Europe (Section 4).
Several studies in China have monitored DP in biological matrices to determine the extent of exposure from electronic-waste (e-waste) recycling facilities (e.g., Ren et al. 2009; Yan et al. 2012; He et al. 2013; Yang et al. 2013; Ben et al. 2014). Median concentrations of DP in serum collected from low-exposure groups, e.g., participants residing away from e-waste activity, were measured up to 13.7 ng/g lw (Ren 2009; Yang et al. 2013), and were statistically lower than their respective paired groups associated with higher e-waste exposure. The median concentrations of DP in serum were 121 and 265 ng/g lw in samples collected in 2011 from male (n=33) and female (n=37) participants, respectively, from occupationally exposed workers from e-waste recycling sites (Yan et al. 2012).
Ben et al. (2014) investigated transplacental transfer of DP from 72 residents of the e-waste recycling area of Wenling, China. Samples of maternal serum, placenta and cord serum were collected in 2010-11, and DP concentrations in all three matrices were strongly correlated. Median DP concentrations of maternal sera, placental tissue and cord blood sera for the high-exposure group (n=48; lived in Wenling for more than 20 years) were found to be 8.43, 3.21 and 2.82 ng/g lw, and were statistically higher than those for the low-exposure group (n=24; lived in Wenling for less than 3 years), at 3.55, 1.09 and 1.82 ng/g lw, respectively. The authors highlighted that the presence of DP in cord sera is indicative of potential DP translocation from maternal to fetal tissues. DP dechlorinated products, or potential metabolites, in humans have also been detected in some Chinese studies (e.g., Ren et al. 2009 and Ben et al. 2014); however, the sources of these dechlorinated products (i.e., whether produced in vivo or from the external exposure) were not determined.
DP measured in serum may provide a measure of integrated exposure from various routes (oral, dermal, and inhalation) and all sources of exposure, including environmental media, diet and products. Directly comparing human and rat serum data has been discussed as a way to evaluate internal exposures in humans (Aylward and Hays 2011) and there is a rat toxicokinetics study on DP that can be considered for use in such a comparison (described further in Section 10.2.7) (Li et al. 2013). DP human serum levels of 2.4 ng/g lw (50th percentile) (Zhou et al. 2014) were lower than levels in the rat control group (expected to be exposure via food and dust; 61 ng/g lw) and the group exposed to the highest dose of 100 mg/kg-bw/d for 90-days (690 ng/g lw) (Li et al. 2013) However, given the unusual distribution patterns observed for DP in rats in the Li et al. study, and the limited information on toxicokinetics in both rats and humans, the comparison between human and rat serum is limited.
10.2 Health effects assessment
No classifications of the health effects of DP by national or international regulatory agencies were identified. The US EPA has developed screening-level hazard characterization documents for DP (US EPA 2011, 2014).
10.2.1 Carcinogenicity
No chronic toxicity or carcinogenicity studies were identified. Several other lines of evidence were investigated to assess the carcinogenic potential of DP (more detail is available in Health Canada 2015). The OECD (Q)SAR Toolbox (OECD 2009b, 2011, 2012) and OASIS TIMES (TIMES 2012) were used to identify potential analogues. Overall, no appropriate analogue could be identified. The quantitative structural activity relationship (QSAR) approach used several statistically based (Q)SAR models to assess the carcinogenic potential of DP. The (Q)SAR models generated mixed results with low confidence in the overall prediction. The third approach was to identify any structural alerts associated with carcinogenicity using computer models. One of the structural alert screening models out of 2 sets of models triggered an alert for non-genotoxic carcinogenicity based on the presence of the polyhalogenated cycloalkane fragment. Overall, results are considered inconclusive.
10.2.2 Genotoxicity
In terms of in vitro genotoxicity, results from Ames assays conducted using Salmonella typhimurium strains (TA98, TA100, TA1535, TA 1537 and TA 1538) were negative in the presence or absence of metabolic activation (S9) (Mortelmans and Tanaka 1980). Result from an in vitro mouse lymphoma assay was also negative in the presence and absence of S9 (Jotz and Mitchel 1980).
One in vivo genotoxicity study was identified. Mice were orally administered 0, 500, 2000 or 5000 mg/kg-bw/day of DP via gavage for 10 days (Wu et al. 2012). Liver samples were collected for a comet assay and the genotoxicity result was negative.
10.2.3 Acute toxicity
Acute toxicity studies in experimental animals suggested low concern for acute toxicity via the oral, inhalation or dermal routes of exposure (Powers 1964; Moldovan 1971a, b; Kinert 1975).
10.2.4 Repeated-dose toxicity
No adverse health effects were observed in any of the identified repeated-dose oral toxicity studies, which tested dose levels up to 5000 mg/kg-bw/day.
In a recent study conducted by Wu et al. (2012), male ICR mice (6/dose) were exposed to DP in corn oil by oral gavage at 500, 2000 or 5000 mg/kg-bw per day for 10 days. Body weights and organs weights (liver, kidney, and testes) were not affected by DP treatment. The study examined hepatic oxidative stress, DNA damage and transcriptomic and metabonomic profiles at the molecular level. Some oxidative stress responses and alteration of gene expression involved in carbohydrate, lipid, nucleotide, and energy metabolism and signal transduction processes were observed. As no health effects were observed, these physiological changes were not considered adverse effect.
In a combined repeated-dose/reproductive/developmental toxicity screening test, conducted according to OECD guidelines, Crl:CD (SD) rats were exposed to DP in corn oil at 0, 750, 1500 or 5000 mg/kg-bw/day by oral gavage (Brock et al. 2010). In the repeated dose toxicity (RDT) phase, animals (10/sex/dose) were treated for 28 days. No treatment-related effects were observed on clinical signs of toxicity, body weights, food consumption, neurobehavioral, and functional observational battery evaluations. No effects were observed on haematology, urinalysis, coagulation or clinical chemistry parameters. No dose response-related changes in organ weights (heart, liver, testes, ovaries, and thyroid/parathyroid glands) were observed. Mortalities were observed across all dose groups including controls, which were linked to gavage administration errors (Table 10‑1). The authors identified a no-observable-effect level (NOEL) of 5000 mg/kg-bw/day.
| Dose (mg/kg-bw/day) | Mortality in male rats | Mortality in female rats |
|---|---|---|
| 0 | 0/10 | 2/10 |
| 750 | 1/10 | 1/10 |
| 1500 | 2/10 | 1/10 |
| 5000 | 0/10 | 1/10 |
Li et al. (2013) examined potential health effects on rats at lower dose levels. Sprague-Dawley male rats (7/dose) were administered DP via oral gavage in corn oil at 0, 1, 10 or 100 mg/kg-bw/day for 90 days. There were neither significant changes in body weight nor changes in absolute and relative liver weights. No histopathological liver damage was observed. Other organs were not examined. In terms of clinical chemistry parameters, a significant decrease in activities of alanine amino transferase (ALT), alkaline phosphatase (ALP) and total bile acids (TBA), and an increase in levels of glucose were observed at 100 mg/kg-bw/day. The authors concluded that DP did not cause adverse effects on the liver at up to the highest dose tested (i.e., 100 mg/kg-bw/day).
In another subchronic study, Charles River strain albino rats (15/sex/dose) were administered DP in their diets at 0, 10 000, 30 000 and 100 000 ppm (0, 500, 1500 and 5000 mg/kg-bw per day, respectively) for 13 weeks (Oscarson 1975). There were no statistically significant treatment-related effects on body or organ (brain, gonads, heart, kidney, and spleen) weights, urinalysis, clinical chemistry or haematology. There were no treatment-related clinical signs or gross pathological or histopathological findings. Absolute and relative (to body and brain weight) liver weights were increased in high-dose animals but the absolute liver weight was not statistically significant in males and these increases were not associated with any histopathological lesions. Therefore, no adverse effects were observed up to the highest dose tested (i.e., 5000 mg/kg-bw/day).
One repeated-dose inhalation toxicity study was identified. COBS rats (5/sex/dose) were exposed to DP at 0 (untreated control), 640 or 1524 mg/m3, 6 hours per day, 5 days per week for 28 days (Bishop 1975). Animals were exposed in exposure chamber with DP in the form of dust. There was a significant increase in absolute liver weight was observed in both sexes at 640 mg/m3 and above. Corresponding hepatocytomegaly (swelling of liver cells with signs of cytotoxicity and necrosis) of centrilobular hepatocytes was observed in males at 640 and 1524 mg/m3 and in some females at the higher concentration. Effects on lungs were also observed. All treated animals exhibited a slight increase in the number of macrophages in the alveoli. A significant increase in absolute lung weight was observed in females at 640 and 1524 mg/m3 and at 1524 mg/m3 in males. A lowest-observed-adverse-effect concentration (LOAEC) of 640 mg/m3 was identified in this study. No NOAEC was identified in this study.
One repeated-dose dermal toxicity study was identified. Male and female New Zealand White rabbits (5/sex/group) were administered DP in 3% aqueous methylcellulose at 0 (untreated control), 500 or 2000 mg/kg-bw per day, 5 days per week for 4 weeks (Trzyna 1975). The test substance was distributed over 20% of the total body surface area on shaved abraded skin. The application sites were not occluded, but animals were individually housed and fitted with Elizabethan collars throughout the study. The only treatment-related clinical sign was none to minimal erythema at the application site. Females exhibited a statistically significant, dose-related decrease in absolute and relative (to body and brain weight) gonad (combined uterus and ovaries) weights starting from 500 mg/kg-bw/day and a significant decrease in absolute and relative (to body and brain weight) liver weight at 2000 mg/kg-bw/day. As no corresponding histopathology was observed in these organs (liver and ovary), a NOAEL of 2000 mg/kg-bw/day was identified for this study, in the screening-level hazard documents by US EPA (US EPA 2011, 2014a).
10.2.5 Reproductive and developmental toxicity
Potential reproductive and developmental effects of DP were explored in a combined repeated-dose/reproductive/developmental toxicity screening test described above (Brock et al. 2010). In the developmental and reproductive toxicity (DART) phase, animals (20/sex/group) were administered 0, 750, 1500 or 5000 mg/kg-bw/day DP in corn oil via oral gavage. The male rats were treated for at least 63 days (21 days premating, 14 days of mating, 28 days after mating). The female rats were treated for up to 60 days (21 days during premating, 14 days of mating and up to 25 days after mating from gestation day (GD) 0 to lactation day (LD) 3). Mortalities were observed across all dose groups including controls, which were linked to gavage administration errors (Table 10‑2). No effects on reproductive or fertility indices were observed in either male or female parental animals. No maternal toxicity was observed, up to the highest dose level tested. No developmental effects were observed in the F1 offspring, up to the highest dose level tested. The authors identified NOELs of 5000 mg/kg-bw/day for reproductive and developmental toxicity.
| Dose (mg/kg-bw/day) | Mortality in male rats | Mortality in female rats |
|---|---|---|
| 0 | 1/20 | 0/20 |
| 750 | 1/20 | 2/20 |
| 1500 | 0/20 | 0/20 |
| 5000 | 2/20 | 1/20 |
10.2.6 Sensitization
No skin sensitization was observed in guinea pigs treated with DP in a Buehler’s test (Brett 1975).
10.2.7 Toxicokinetics
Based on two toxicokinetic studies (Chou et al. 1979; Saunders and Quistad 1983; OxyChem 2005) where rats were orally administered radiolabeled DP, it was found that DP was poorly absorbed from the gastrointestinal tract. In the Chou et al. (1979) study, at least 75% of radiolabelled DP (suspended in water containing 5% each of Tween-80 and gum arabic) was excreted in faeces 24 hours post-treatment. In the Saunder and Quistad (1983) study, at least 83% of radiolabelled DP (vehicle not specified in secondary source) was excreted in faeces 4 days following treatment (OxyChem 2005). Less than 0.1% of DP was excreted in urine in both studies. Radioactivity was detected in tissue samples with the highest levels found in liver and ovaries. Lower levels were detected in blood, kidney and lung. DP was excreted very slowly where the levels of DP in blood, kidney and liver remained unchanged between 4 and 24 hours post-treatment (Chou et al. 1979). A polar metabolite(s) was detected but was not identified in either study.
The Li et al. (2013) study also examined the accumulation pattern of the two isomers of DP (syn-DP and anti-DP) in rats. Distribution patterns showed that both isomers of DP were measured, with the highest level in liver followed by serum and then muscle. Dechlorinated DP isomers (Cl11-DP) were measured in these tissues. Since Cl11-DP was also detected in commercial DP, it was not clear if Cl11-DP was a metabolite or originated from the commercial product. The commercial DP contains the two isomers (syn-DP and anti-DP) with the ratio of 1:3. At the low dose level of 1 mg/kg-bw/day, no stereoselectivity of anti-DP or syn-DP in tissues (muscle, liver and serum) was observed based on the ratio of anti-DP concentration to total DP concentration (fanti) that was comparable to the composition of commercial DP. At higher dose levels (10 and 100 mg/kg-bw/day), the fanti was lower, suggesting higher levels of syn-DP in tissues. Two separate groups of animals were exposed to 0 or 100 mg/kg-bw/day of DP for 45 days followed by 45 days depuration to examine elimination patterns. It was found that both isomers of DP were more prone to accumulate in liver or eliminated slower in liver than in muscle. The elimination half-lives were 24 days (syn-DP) and 25 days (anti-DP) in serum, 44 days (syn-DP) and 54 days (anti-DP) in muscle, and 179 days (syn-DP) in liver. The authors did not calculate the elimination half-life for anti-DP in liver since level of the anti-DP increased non-significantly after depuration.
10.3 Characterization of risk to human health
No classifications of the health effects of DP by national or international regulatory agencies were identified. Results for the genotoxicity database were all negative, indicating that DP is not likely to be genotoxic. No chronic studies were identified. Analyses from other lines of evidence to assess the carcinogenic potential of DP were inconclusive.
There were no adverse effects observed in experimental animals orally treated with DP with dose levels up to 5000 mg/kg-bw/day in a combined 28-day repeated-dose toxicity study with a reproductive/developmental toxicity screening test (Brock et al. 2010) and in a 90-day subchronic toxicity study (Oscarson 1975), both conducted in rats. The upper-bounding estimate of exposure to DP for the Canadian general population from environmental media (air, water, dust) and food and breast milk is 8.3 ng/kg-bw/day for young children 0.5-4 years of age. This upper-bounding estimate of exposure is about eight orders of magnitude lower than the highest dose tested in studies in laboratory animals at which no adverse effects were observed. This margin is considered to be adequate to account for uncertainties in the exposure and health effect databases and risk from DP for the general population is considered to be low.
10.4 Uncertainties in evaluation of risk to human health
This screening assessment acknowledges uncertainties regarding the exposure database and health effects database.
No data in the primary literature were available for marketed foods in Canada; however, data were available for baby food products in the U.S.
No volunteer or epidemiological studies were identified. In experimental animals, no chronic studies were available as the longest tested studies were only up to 90 days and sample sizes for the repeated-dose toxicity studies were relatively small. There are uncertainties whether pregnant animals might exhibit different toxicokinetics and whether there are differences in sensitivity in chemical-induced effects in developing pups than adult animals.
However, the large magnitude of the margin of exposure is considered adequate to account for the uncertainties in the health effects and exposure databases.
While assessment of “dechlorane-related” substances (described in Section 2.2) is beyond the scope of this screening assessment, and although it is not well understood how similar these substances are to DP, there is an uncertainty with respect to the potential for co-exposure as well as a common mode of action of “dechlorane-related” substances.
11. Conclusion
Considering all available lines of evidence presented in this screening assessment, there is risk of harm to the environment from DP. It is concluded that DP meets the critiera under paragraph 64(a) of CEPA as it is entering or may enter the environment in a quantity or concentration or under conditions that have or may have an immediate or long-term harmful effect on the environment or its biological diversity. However, it is concluded that DP does not meet the criteria under paragraph 64(b) of CEPA as it is not entering the environment in a quantity or concentration or under conditions that constitute or may constitute a danger to the environment on which life depends.
Based on the available information on its potential to cause harm to human health, it is concluded that DP is not entering the environment in a quantity or concentration or under conditions that constitute or may constitute a danger in Canada to human life or health.
It is concluded that DP meets one or more of the criteria set out in section 64 of CEPA. DP has been determined to meet the persistence and bioaccumulation criteria as set out in the Persistence and Bioaccumulation Regulations of CEPA.
References
Abbasi G, Saini A, Goosey E, Diamond ML. 2016. Product screening for sources of halogenated flame retardants in Canadian house and office dust. Sci. Total Environ. 545–546:299–307.
ACD/Percepta [Prediction Module]. c1997-2012. Toronto (ON): Advanced Chemistry Development. [accessed 2014 September
[AEROWIN] AEROWIN Program for Windows [Estimation Model]. 2010. Version 1.00. Washington (DC): US Environmental Protection Agency, Office of Pollution Prevention and Toxics; Syracuse (NY): Syracuse Research Corporation. [accessed 2014 January]
Allen JG, Stapleton HM, Vallarino J, McNeely E, McClean MD, Harrad SJ, Rauert CB, Spengler JD. 2013. Exposure to flame retardant chemicals on commercial airplanes. Environ Health 12:17.
[AOPWIN] Atmospheric Oxidation Program for Windows [Estimation Model]. 2010. Version 1.92a. Washington (DC): US Environmental Protection Agency, Office of Pollution Prevention and Toxics; Syracuse (NY): Syracuse Research Corporation. [accessed 2014 January]
Arnot JA, Gobas FAPC. 2003. A generic QSAR for assessing the bioaccumulation potential of organic chemicals in aquatic food webs. QSAR Comb Sci 22(3):337-345.
Arnot JA, Gobas FAPC. 2006. A review of bioconcentration factor (BCF) and bioaccumulation factor (BAF) assessments for organic chemicals in aquatic organisms. Environ Rev 14:257-297.
Arnot JA, Quinn CL. 2015. Development and Evaluation of a Database of Dietary
Bioaccumulation Test Data for Organic Chemicals in Fish. Environ Sci Technol 49: 4783−4796.
Aylward, L. L., & Hays, S. M. (2011). Biomonitoring-based risk assessment for hexabromocyclododecane (HBCD). International journal of hygiene and environmental health. 214(3):179-187.
Baron E, Dissanayake A, Vila-Cano J, Crowther C, Readman JW, Jha AN, Eljarrat E, Barcelo D. 2016. Evaluation of the genetic and physiological effects of Decabromodiphenyl ether (BDE 209) and Dechlorane Plus (DP) Flame retardants in Marne Mussels (Mytilus galloprovincialis). Environ Sci Technol 50: 2700-2708.
[BASL4] Biosolids-Amended Soil Level 4 Model. 2011. Version 200. Peterborough (ON): Treat University, Canadian Environmental Modelling Centre.
[BBM with Mitigating Factors] Baseline Bioaccumulation Model with Mitigating Factors. 2008. Gatineau (QC): Environment and Climate Change Canada, Ecological Assessment Division. [Model developed based on Dimitrov et al. 2005]. Available upon request.
[BCFBAF] Bioaccumulation Program for Windows [Estimation Model]. 2010. Version 3.10. Washington (DC): US Environmental Protection Agency, Office of Pollution Prevention and Toxics; Syracuse (NY): Syracuse Research Corporation. [accessed 2014 January]
Ben YJ, Li XH, Yang YL, Li L, Di JP, Wang WY, Zhou RF, Xiao K, Zheng MY, Tian Y, Xu XB. 2013. Dechlorane plus and its dechlorinated analogs from an e-waste recycling center in maternal serum and breast milk of women in Wenling, China. Environmental Pollution 173:176-181.
Ben JY, Li XH, Yang LY, Li LJ, Zheng YM, Wang YW, Xu BX. 2014. Placental transfer of dechlorane plus in mother-infant pairs in an e-waste recycling area (Wenling, China). Environ Sci Technol 48(9):5187-93.
Bergman A, Rydén A, Law RJ, de Boer J, Covaci A, Alaee M,Birnbaum L, Petreas M, Rose M, Sakai S, Van den Eede N, van der Veen I. 2012. A novel abbreviation standard for organobromine, organochlorine and organophosphorus flame retardants and some characteristics of the chemicals. Environment International 49:57-82.
[BIOWIN] Biodegradation Probability Program for Windows [Estimation Model]. 2010. Version 4.10. Washington (DC): US Environmental Protection Agency, Office of Pollution Prevention and Toxics; Syracuse (NY): Syracuse Research Corporation. [accessed 2014 January]
Bishop A. 1975. 28-Day Subacute Dust Inhalation Toxicity Study with Dechlorane Plus 25 in Rats. Testing laboratory: Industrial BIO-TEST Laboratories, Inc. Report no.: IBT No. 663-06279. Owner company: Hooker Chemical Corporation. Report date: 1975-06-18. USEPA TSCAT document OTS0537030.
Boethling RS, Howard PH, Beauman JA, Larosche ME. 1995. Factors for intermedia extrapolations in biodegradability assessment. Chemosphere 30(4):741-752.
Boudreau, J. 1973. As cited in: HPV Challenge – Robust Summaries & Test Plans: Dechlorane Plus. Final revision as identified by the submitter, June 8, 2009. Thirty-Day Static Biological Magnification Studies with Dechloranes 602, 604 and Plus 515 in Bluegills. Industrial Bio-Test Laboratories, Inc. IBT Nos. 665-03736 and 631-02353.
Brasseur C, Pirard C, Scholl G, De Pauw E, Viel JF, Shen L, Reiner EJ, Focant JF. 2014. Levels of dechloranes and polybrominated diphenyl ether (PBDEs) in human serum from France. Environ Int 65C:33-40.
Brett B. 1975. Skin sensitization tests with five samples in albino guines pigs. Report no.: IBT No. 601-06278. Testing laboratory: Industrial Bio-Test Laboratories, Inc. US EPA TSCAT document OTS0205956.
Brock WJ, Schroeder RE, McKnight CA, VanSteenhouse JL, Nyberg JM. 2010. Oral Repeat Dose and Reproductive Toxicity of the Chlorinated Flame Retardant Dechlorane Plus. Int Toxicol 29(6):582-593.
Brown T, Wania F. 2008. Screening Chemicals for the Potential to be Persistent Organic Pollutants: A Case Study of Arctic Contaminants Environ Sci Technol 42:5202-5209.
Canada. 1999. Canadian Environmental Protection Act, 1999 [PDF]. S.C., 1999, c. 33. Part III. vol. 22, no. 3.
Canada. 2000. Canadian Environmental Protection Act, 1999 [PDF]Canadian Environmental Protection Act, 1999: Persistence and Bioaccumulation Regulations, P.C. 2000-348, 23 March, 2000, SOR/2000-107, Canada Gazette, Part II, vol. 134, no. 7, p. 607-612.
Canada, Dept. of the Environment. 2013. Canadian Environmental Protection Act, 1999: Notice with respect to certain organic flame retardant substances [PDF]. Canada Gazette, Part I, vol. 147, no. 13, p. 613-633.
Canada, Dept. of the Environment, Dept. of Health. 2011. Canadian Environmental Protection Act, 1999: Notice with respect to certain organic flame retardant substances [PDF]. Canada Gazette, Part I, vol. 145, no. 41, Supplement to the Canada Gazette.
Canada, Dept. of the Environment. 2009. Canadian Environmental Protection Act, 1999: Notice with respect to certain inanimate substances (chemicals) on the Domestic Substances List [PDF]. Canada Gazette. Part I, vol. 143, no. 40, p. 2945-2967.
CATALOGIC [Computer Model]. 2012. Version 5.11.6. Bourgas (BG): Bourgas Prof. Assen Zlatarov University, Laboratory of Mathematical Chemistry.
[CCME 1999] Canadian Council of Ministers of the Environment. 1999. Canadian sediment quality guidelines for the protection of aquatic life: Chlordane. In: Canadian environmental quality guidelines, 1999, Canadian Council of Ministers of the Environment, Winnipeg.
[CECBP] California Environmental Contaminant Biomonitoring Program. 2008. Brominated and chlorinated organic chemical compounds used as flame retardants. Materials for the December 4-5, 2008 Meeting of the California Environmental Contaminant Biomonitoring Program Scientific Guidance Panel (SGP). 32 pp.
Cequier E, Ionas AC, Covaci A, Marcé RM, Becher G, Thomsen C. 2014. Occurrence of a broad range of legacy and emerging flame retardants in indoor environments in Norway. Environ Sci Technol. 48: 6827-6835.
Cequier E, Marcé RM, Becher G, Thomsen C. 2015. Comparing human exposure to emerging and legacy flame retardants from the indoor environment and diet with concentrations measured in serum. Environ Int 74: 54-59.
Chabot-Giguere B, Letcher,RJ, Verreault J. 2013. In vitro biotransformation of decabromodiphenyl ether (BDE-209) and Dechlorane Plus flame retardants: A case study of ring-billed gull breeding in a pollution hotspot in the St. Lawrence River, Canada. Environ Int 55:101-108
Chen D, Wang Y, Yu L, Luo X, Mai B, Li S. 2013. Dechlorane plus flame retardant in terrestrial raptors from northern China. Environ Pollut 176:80-86.
Chou TW, Liu DHW, Mabey WR, Mitoma C., and Smith JH. 1979. As cited in: HPV Challenge- Robust Summaries & Test Plans: Dechlorane Plus. Final revision as identified by the submitter, June 8, 2009. Vapour Pressure and Water Solubility. Metabolism and Environmental Screening Studies on Dechlorane Plus. SRI International. SRI Project No. LSC-8060
[CHRIP] Chemical Risk Information Platform [database]. c2008. Tokyo (JP): National Institute of Technology and Evaluation, Chemical Managemet Centre (CMC). [accessed 2011January]
Cikutovic MA, Fitzpatrick C, Goven AJ, Venables BJ, Giggleman MA, Cooper EL. 1999. Wound Healing in Earthworms Lumbricus terrestris: A Cellular-Based Biomarker for Assessing Sublethal Chemical Toxicity. Bull Environ Contam Toxicol 62:508-514
Crump D, Chiu S, Gauthier LT, Hickey NJ, Letcher RJ, Kennedy SW. 2011. The effects of Dechlorane Plus on toxicity and mRNA expression in chicken embryos: A comparison of in vitro and in ovo approaches. Comp Biochem Physiol C 154:129-134.
Davis E, Klosterhaus S, Stapleton H. 2012. Measurement of flame retardants and triclosan in municipal sewage sludge and biosolids. Environ Int 40:1-7.
Diamond M, Goosey E, Saini A, Chaudhuri S. 2013. Assessment of the prevalence and exposure to the new flame retardants (NFRs) in Canadian indoor environments. Contract prepared for Health Canada. Diamond Environmental Research Group, University of Toronto.
Dimitrov S, Dimitrova N, Parkerton T, Comber M, Bonnell M, Mekenyan O. 2005. Base-line model for identifying the bioaccumulation potential of chemicals. SAR QSAR Environ Res 16(6):531-554.
Dodson RE, Perovich LJ, Covaci A, Van den Eede N, Ionas AC, Dirtu AC, Brody JG, Rudel RA. 2012. After the PBDE Phase-Out: A Broad Suite of Flame Retardants in Repeat House Dust Samples from California. Environ Sci Technol 46(24):13056-13066.
[DPD] Drug Product Database [database]. [modified 2017 Feb 17]. Ottawa (ON): Government of Canada. [accessed 2014 April 24].
[ECCC] Environment and Climate Change Canada. 2013-2014. Data for certain organic flame retardants substance grouping collected under the Canadian Environmental Protection Act, 1999, section 71: Notice with respect to certain organic flame retardant substances. Data prepared by: Environment and Climate Change Canada, Health Canada; Existing Substances Program.
[ECCC] Environment and Climate Change Canada. 2014. List of Toxic Substances managed under CEPA (Schedule 1).
[ECCC] Environment and Climate Change Canada. 2017. Supporting documentation: Summary tables for Dechlorane Plus. Gatineau (QC): Environment and Climate Change Canada. Information in support of the Screening Assessment for 1,4:7,10-Dimethanodibenzo[a,e]cyclooctene, 1,2,3,4,7,8,9,10,13,13,14,14-dodecachloro-1,4,4a,5,6,6a,7,10,10a,11,12,12a-dodecahydro-.. Available on request from: substances@ec.gc.ca
[ECCC, HC] Environment and Climate Change Canada, Health Canada. [modified 2017 Mar 12]. Categorization. Ottawa (ON): Government of Canada. [accessed 2013 July 31].
[ECHA] European Chemicals Agency. c2007-2013. Registered Substances [database]. Search results for CAS RN [13560-89-9]. Helsinki (FI): ECHA. [updated 2012 Nov. 27; accessed 2014 March]
[ECHA] European Chemicals Agency. 2010. Guidance on information requirements and chemical safety assessment. Chapter R.16: Environmental exposure estimation. May 2010. Guidance for the implementation of REACH. Helsinki (FI): European Chemicals Agency.
[ECHA] European Chemicals Agency, 2013a. Registered substances. Helsinki (FN): ECHA. [accessed 2013 July 26].
[ECHA] European Chemicals Agency, 2013b. Registered substances [database]. Search results for CAS RN [13560-89-984852-53-9]. 2013 Experimental water solubility report (OECD 105 Study). Helsinki (FN): ECHA. [accessed 2015 August]
[ECOSAR] Ecological Structure Activity Relationships Class Program [Estimation Model]. 2012. Version 1.11. Washington (DC): US Environmental Protection Agency, Office of Pollution Prevention and Toxics; Syracuse (NY): Syracuse Research Corporation. [accessed 2014 January]
Environment Canada. 1977. Mirex in Canada. Report of the Task Force on Mirex to the Joint Department of Environment and National Health and Welfare Committee on Environmental Contaminants. Ottawa.
Environment Canada. 1998. Canadian sediment quality guidelines for chlordane,
dieldrin, endrin, heptachlor epoxide, and lindane: Supporting document. Environmental Conservation Service, Ecosystem Science Directorate, Science Policy and Environmental Quality Branch, Guidelines and Standards Division, Ottawa. Draft.
Environment Canada. 2013. Site Specific Analysis Report: CAS RN 13560-89-9, Feb. 20, 2013. Unpublished report. Gatineau (QC): Environment and Climate Change Canada, Ecological Assessment Division.
[EPI Suite] Estimation Programs Interface Suite for Microsoft Windows [Estimation Model]. 2000-2012. Version 4.1. Washington (DC): US Environmental Protection Agency, Office of Pollution Prevention and Toxics; Syracuse (NY): Syracuse Research Corporation. [accessed 2014 January]
European Commission. 200[8]. IUCLID Dataset [Dechlorane Plus], CAS No. [13560-89-9] [Internet]. Year 2000 CD-ROM edition. Ispra (IT): European Commission, Joint Research Centre, Institute for Health and Consumer Protection, European Chemicals Bureau. [accessed January 2012].
Fan X, Kubwabo C, Rasmussen PE, Wu F. 2016. Non-PBDE halogenated flame retardants in Canadian indoor house dust: sampling, analysis, and occurrence. Environ. Sci. Pollut. Res. 23:7998–8007.Feo ML, Barón E, Eljarrat E, Barceló D. 2012. Dechlorane Plus and related compounds in aquatic and terrestrial biota: a review. Anal Bioanal Chem 404:2625-2637.
[GAC]. Global Automakers of Canada. 2013. Personal communication.
Gagne P-L, Fortier M, Fraser M, Parent L, Vaillancourt C. 2017. Dechlorane Plus induces oxidative stress and decreases cyclooxygenase activity in the blue mussel. Aquatic Toxicology 188: 26-32.
Gara, M.J. and G. Rauisina, G. 1975. As cited in: HPV Challenge- Robust Summaries & Test Plans: Dechlorane Plus. Final revision as identified by the submitter, June 8, 2009. Thirty-Day Dynamic Bioaccumulation Studies with Dechlorane Plus 515 in Bluegill Sunfish. Industrial Bio-Test Laboratories, Inc. IBT Nos.621-06768 and 631-04618.
Gauthier L, Hebert C, Weseloh DVC, and Letcher RJ. 2007. Current-Use Flame Retardants in the Eggs of Herring Gulls (Larus argentatus) from the Laurentian Great Lakes. Environ Sci Technol 41:4561-4567.
Gobas FAPC, Kelly BC, Arnot JA. 2003. Quantitative structure activity relationships for predicting the bioaccumulation of POPs in terrestrial food-webs. QSAR Comb Sci 22:329-336.
Gobas F. 2007. Development and review of a generic water–sediment modelling framework for organic chemicals. Report prepared for Environment and Climate Change Canada. Burnaby (BC): Simon Fraser University, Faculty of Environment. March 26, 2007.
Gobas F. 2010. Comments on approach to sediment exposure approach. Report prepared for Environment and Climate Change Canada. Burnaby (BC): Simon Fraser University, Faculty of Environment. March 25, 2010.
Guerra P, M Alaee, E Eljarrat and D Barcelo. 2011. Introduction to Brominated Flame Retardants:Commercially Products, Applications, andPhysicochemical Properties. In Eljarrat E, Barceló D. editors. 2011. Brominated Flame Retardants. Series: The Handbook of Environmental Chemistry. Volume 16. Heidelberg Berlin:Springer. 290 pp.
Guo J, Venier M, Salamova A, and Hites RA. 2017. Bioaccumulation of dechloranes, organophosphate esters, and other flame retardants in Great Lakes fish. Science of the Total Environment 583:1-9.
Harris CR, Mazurek JH, Svec HJ. 1964. Comparison of the toxicity to insects of certain insecticides applied by contact and in the soil.J of Econ Entom 57(5):698-702.
He S, Li M, Jin J, Wang Y, Bu Y, Xu M, Yang X, Liu A. 2013. Concentrations and trends of halogenated flame retardants in the pooled serum of residents of Laizhou Bay, China. Environ Tox Chem 32(6): 1242-1247.
Health Canada. 1998. Exposure factors for assessing total daily intake of priority substances by the general population of Canada. Unpublished report. Ottawa (ON): Health Canada, Environmental Health Directorate.
Health Canada 2014. CMP Survey 2014-2015: Determination of Flame Retardants in Consumer Products. Project No.: 2014-2048. June 19, 2014. Unpublished report.
Health Canada. 2015. Supporting documentation: Carcinogenic potential information for 1,4:7,10-Dimethanodibenzo[a,e]cyclooctene, 1,2,3,4,7,8,9,10,13,13,14,14-dodecachloro-1,4,4a,5,6,6a,7,10,10a,11,12,12a-dodecahydro- (Dechlorane Plus®) Ottawa (ON): Health Canada. Available upon request from: substances@ec.gc.ca.
Health Canada. [modified 2017 May 3]. Lists of Permitted Food Additives. Ottawa (ON): Health Canada Food Directorate. [accessed 2014 April 24].
[HENRYWIN] Henry’s Law Constant Program for Microsoft Windows [Estimation Model]. 2011. Version 3.20. Washington (DC): US Environmental Protection Agency, Office of Pollution Prevention and Toxics; Syracuse (NY): Syracuse Research Corporation. [accessed 2014 January]
Hoh E, Zhu L, Hites RA. 2006. Dechlorane Plus, a chlorinated flame retardant, in the Great Lakes. Environ Sci Technol 40:1184-1189.
Hooker Chemical. 1977/ Study Report (Anonymous) 1977. As cited by: HPV Challenge- Robust Summaries & Test Plans: Dechlorane Plus Final revision as identified by the submitter, June 8, 2009. Melting Point, Boiling Point, Density, and Vapour Pressure. Hooker Dechlorane Plus -Toxicological Review. September.
Houde M, Berryman D, de Lafontaine Y, Verrault J. 2014. Novel brominated flame retardantsd and dechloranes in three fish species from the St. Lawrence River, Canada. Sci Total Environ 479-480:48-56.
Hung H, Alexandrou N, Dryfhout-Clark H. 2016. Unpublished Chemicals Management Plan air monitoring data submitted to the Ecological Assessment Division of Environment and Climate Change Canada, Gatineau, QC.
[HYDROWIN] Hydrolysis Rates Program for Microsoft Windows [Estimation Model]. 2010. Version 2.00. Washington (DC): US Environmental Protection Agency, Office of Pollution Prevention and Toxics; Syracuse (NY): Syracuse Research Corporation. [accessed 2014 January]
[IPCS] International Programme on Chemical Safety.1984. Environmental Health Criteria 34. Chlordane Health and Safety Guide. United Nations Environment Programme. International Labour Organisation. World Health Organization, Geneva.
[IPCS] International Programme on Chemical Safety.1988. Health and Safety Guide No. 13. Chlordane health and Safety Guide. United Nations Environment Programme. International Labour Organisation. World Health Organization, Geneva.
Ismail N, Gewurtz SB, Pleskach K, Whittle DM, Helm PA, Marvin CH, Tomy GT. 2009. Brominated and Chlorinated Flame Retardants in Lake Ontario, Canada, Lake Trout (Salvelinus namaycush) between 1979 and 2004 and possible influences of food-web changes. Environ Toxicol Chem 28(5):910-920.
[IVL] (Swedish Environmental Research Institute)] Kaj L, Norström K, Egelrud L, Remberger M, Lilja K, Brorström-Lundèn E. 2010. Results from the Swedish National Screening Programme 2009. Swedish Environmental Research Institute, Stockholm.
Jaagumagi R. 1988. The in-place pollutants program. Volume V, Part B. Benthic invertebrates studies results. Ontario Ministry of the Environment, Water Resources Branch, Aquatic Biology Section, Toronto.
Jaagumagi R., Persaud D, and Lomas T. 1989. The in-place pollutants program. Volume V, Part A. A synthesis of benthic invertebrates studies. Ontario Ministry of the Environment, Water ResourcesBranch, Aquatic Biology Section, Toronto.
Johnson PI, Stapleton HM, Mukherjee B, Hauser R, Meeker JD. 2013. Associations between brominated flame retardants in house dust and hormone levels in men. Sci Total Environ 445-446:177-184.
Jotz MM and Mitchel AD. 1980. An evaluation of mutagenic potential of Hooker Research Center compound Dechlorane Plus employing the L5178Y TK+/- mouse lymphoma assay. Testing laboratory: SRI International. Report no.: SRI Project LSC-8971. [cited in OxyChem 2009].
Juberg D, Alfano K, Coughlin R, Thompson K. 2001. An observational study of object mouthing behavior by young children. Pediatrics. 107:135
Kakimoto K, Nagayoshi H, Yoshida J, Akutsu K, Konishi Y, Toriba A, Hayakawa K. 2012. Detection of dechlorane plus and brominated flame retardants in marketed fish in Japan. Chemosphere 89(4):416-419.
Kang J-H, Kim J-C, Jin G-Z, Park H, Baek S-Y, Chang Y-S. 2010. Detection of Dechlorane Plus in fish from urban-industrial rivers. Chemosphere 79(8):850-854.
Kang H, Moon H-B, Choi K. 2016. Toxicological responses following hsort-term exposure through gavage feeding or water-borne exposure to Dechlorane Plus in zebrafish (Danio rerio). Chemosphere 146: 226-232.
Kelly BC, Ikonomou MG, Blair JD, Morin AE, Gobas FAPC. 2007. Food Web–Specific Biomagnification of Persistent Organic Pollutants.Science 317:236-239.
Kemmlein S, Hahn O, Jann O. 2003. Emissions of organophosphate and brominated flame retardants from selected consumer products and building materials. Atmos Environ 37:5485-5493.
Kolic TM, Shen L, MacPhersonK, Fayez L, Gobran T, Helm PA, Marvin CH, Arsenault G, Reiner EJ, 2009. The analysis of halogenated flame retardants by GC-HRMS in environmental samples. Journal of Chromatographic Science 47: 83-91.
Klasmeier J, Matthies M, MacLeod M, Fenner K, Scheringer M, Stroebe M, Le Gall AC, McKone TE, van de Meent D, Wania F. 2006. Application of multimedia models for screening assessment of long-range transport potential and overall persistence. Environ Sci Technol 40:53-60.
[KOAWIN] Octanol Air Partition Coefficient Program for Microsoft Windows [Estimation Model]. 2010. Version 1.10. Washington (DC): US Environmental Protection Agency, Office of Pollution Prevention and Toxics; Syracuse (NY): Syracuse Research Corporation. [accessed 2014 January]
[KOCWIN] Organic Carbon Partition Coefficient Program for Windows [Estimation Model]. 2010. Version 2.00. Washington (DC): US Environmental Protection Agency, Office of Pollution Prevention and Toxics; Syracuse (NY): Syracuse Research Corporation. [accessed 2014 January]
Kolic TM, Shen L, MacPhersonK, Fayez L, Gobran T, Helm PA, Marvin CH, Arsenault G, Reiner EJ. 2009. The analysis of halogenated flame retardants by GC-HRMS in environmental samples.Journal of Chromatographic Science 47: 83-91.
[KOWWIN] Octanol-Water Partition Coefficient Program for Microsoft Windows [Estimation Model]. 2010. Version 1.68. Washington (DC): US Environmental Protection Agency, Office of Pollution Prevention and Toxics; Syracuse (NY): Syracuse Research Corporation. [accessed 2014 January]
Kakimoto K, Nagayoshi H, Yoshida J, Akutsu K, Konishi Y, Toriba A, Hayakawa K. 2012. Detection of Dechlorane Plus and brominated flame retardants in marketed fish in Japan. Chemosphere 89:416-419.
[KEMI] Swedish Chemicals Agency Commodity Guide [database]. 2007. CAS no 13560-89-9 Dechlorane Plus. [accessed 2013 June]
Kinert JC. 1975. Acute dust inhalation toxicity study in rats for Dechlorane Plus 25. OTS0537030. Testing laboratory: Industrial Bio-Test Laboratories, Inc. Report no.: IBT No. 663-06279. Owner company: Hooker Chemical Corporation. US EPA TSCAT document OTS0537030.
Klosterhaus SL, Stapleton HM, La Guardia MJ, Greig DJ. 2012. Brominated and chlorinated flame retardants in San Francisco Bay sediments and wildlife. Environ Int 47:56-65.
Li Y, Yi L, Wang J, Wu J, Mai B, Dai J. 2013. Accumulation pattern of Dechlorane Plus and associated biological effects on rats after 90d of exposure. Chemosphere 90(7):2149-2156.
Li Y, Yu LH, Zhu ZC, Dai JY, Mai BX, Wu JP, Wang JS. 2013. Accumulation and effects of 90-day oral exposure to Dechlorane Plus in Quail (Cortunix cortunix). Environ Tox and Chem 32(7):1649-1654.
Liu LY, Salamova A, Hites RA. 2014. Halogenated flame retardants in baby food from the United States and from China and the estimated dietary intakes by infants. Environ Sci Technol48(16): 9812-9818.
[LNHPD] Licensed Natural Health Products Database [database]. [modified 2016 Aug 10]. Ottawa (ON): Government of Canada. [accessed 2014 April 24].
Lue KY, de la Cruz AA. 1977. Mirex incorporation in the environment: toxicity in two soil macroarthropods and effects on soil community respiration. Water, Air, and Soil Pollution 9:177-191.
Ma YX, Xie ZY, Halsall C, Moller A, Yang HZ, Zhong GC, Cai MH, Ebinghaus R. 2015. The spatial distribution of organochlorine pesticides and halogenated flame retardants in the surface sediments of an Arctic fjord: The influence of ocean currents vs. glacial runoff. Chemosphere 119:953-960.
McCarty LS, Mackay D. 1993. Enhancing ecotoxicological modeling and assessment: critical body residues and modes of toxic action. Environ Sci Technol 27:1719-1728.
McCarty LS, Arnot JA, Mackay D. 2013. Evaluation of critical body residue for acute narcosis in aquatic organisms. Environ Sci Technol 32(10).
McLeese DW, Metcalfe CD. 1980. Toxicities of eight organochlorine compounds in sediment and seawater to Crangon septemspinosa. Bull Environ Contam Toxicol 25:921-928.
McLeese DW, Burridge LE, Van Dinter J. 1982. Toxicities of five organochlorine componds in water and sediment to Nereis virens. Bull Environ Contam Toxicol 28(22):216-221.
Modor Plastics. 2013. Thermoset vs. Thermoplastics [Internet]. [accessed 2013 June]
Moldovan M. 1971a. Dechlorane Plus tested as a 50% w/v suspension in water containing 0.5% tween 80, acute oral toxicity study. Testing laboratory: Food and Drug Research Laboratories Inc. Report no.: I. B. L No 9039. Owner company: Hooker Chemical Corporation. US EPA TSCAT document OTS0537030.
Moldovan M. 1971b. Dechlorane Plus tested as supplied. Acute dermal toxicity study. Testing laboratory: Food and Drug Research Laboratories, Inc. Report no.: I. B. L. No: 9039. Owner company: Hooker Chemical Corporation. US EPA TSCAT document OTS0537030.
Möller A, Xie Z, Caba A, Sturm R, Ebinghaus R. 2010. Large-Scale Distribution of Dechlorane Plus in Air and Seawater from the Arctic to Antarctica. Environ Sci Technol 44: 8977–8982.
Möller A, Xie Z, Cai M, Sturm R, Ebinghaus R. 2012. Brominated flame retardants and dechlorane plus in the Marine Atmosphere from Southeast Asia toward Antarctica. Environmental Sci Technol 46:3141-3148.
Mortelmans KE and Tanaka W. 1980. In vitro microbial mutagenesis assay of Dechlorane PLus. Testing laboratory: SRI International. Report no.: SRI Project LSC-8971 [cited in OxyChem 2009].
[MPBPWIN] Melting Point Boiling Point Program for Microsoft Windows [Estimation Model]. 2010. Version 1.43. Washington (DC): US Environmental Protection Agency, Office of Pollution Prevention and Toxics; Syracuse (NY): Syracuse Research Corporation. [accessed 2014 January]
Muir DCG, Teixeira CF, Epp J, Young T, Wang X, Keir M, S. Backus. 2011. Bioaccumulation of Selected Halogenated Organic Flame Retardants in Remote Lakes and in the Great Lakes. Poster presented at SETAC.
Muir DCG, Teixeira C, de Jourdan B, Morris A. Backus S, Tomy G, Marvin C, MacInnis G, Spencer C, De Silva A .2014. Using Remote Environments to detect New Persistent and Bioaccumulative chemicals in commerce. Chemicals Management Plan Environment and Climate Change Canada poster, presented September 2014.
Na G, Wei W, Zhou S, Gao H, Ma X, Qiu L, Ge L, Bao C, Yao Z. 2015. Distribution characteristics and indicator significance of dechloranes in multi-matrices at Ny-Alesund in the Arctic. Journal of Environmental Sciences 28:8-13.
Na G, Yao Y, Gao H, Li R, Ge L, Titaley IA, Santiago-Delgado L, Simonich SLM. 2017. Trophic magnification of dechlorane Plus in the marine food webs of Fildes Peninsula in Antarctica. Marine Pollution Bulletin (in press).
[New EQC] New Equilibrium Criterion Model [Estimation Model]. 2012. Version 1.0 (Beta). Peterborough (ON): Trent University, Canadian Environmental Modelling Centre. [accessed 2014 July]
[NHPID] Natural Health Products Ingredients Database [database]. [modified 2017 June 21]. Ottawa (ON): Government of Canada. [accessed 2014 April 24].
[OASIS Forecast] Optimized Approach based on Structural Indices Set [Estimation Model]. 2005. Version 1.20. Bourgas (BG): Bourgas Prof. Assen Zlatarov University, Laboratory of Mathematical Chemistry.
Occidental Chemical Company IUCLID Data Set 2004. As cited in US EPA 2009.
[OECD] Organisation for Economic Co-operation and Development. 2004. Emission scenario document on plastics additives. Paris (FR): OECD, Environment Directorate. Series on Emission Scenario Documents No. 3. Report
[OECD] Organisation for Economic Co-operation and Development. 2006. The OECD POV and LRTP Screening Tool [Internet], Version 2.2. Software and Manual, OECD, Paris . The follow-up version of the software POPorNot 1.0 distributed at the OECD/UNEP Workshop on Application of Multimedia Models for Identification of Persistent Organic Pollutants, ETH Zürich.
[OECD] Organisation for Economic Co-operation and Development. 2009a. Emission scenario document on plastics additives [PDF]. Paris (FR): OECD, Environment Directorate. (Series on Emission Scenario Documents No. 3). Report No.: ENV/JM/MONO(2004)8/REV1. JT03267870. [accessed 2014 February]
[OECD] Organisation for Economic Co-operation and Development. 2009b. Guidance Document for Using the OECD (Q)SAR Application Toolbox to Develop Chemical Categories According to the OECD Guidance on Grouping of Chemicals . Paris (FR): OECD, Environment Directorate. Series on Series on Testing and Assessment No. 102 [PDF]. Report No. ENV/JM/MONO(2009)5, JT03260091.
[OECD] Organisation for Economic Co-operation and Development. 2011. QSAR Toolbox User Manual: Strategies for grouping chemicals to fill data gaps to assess genetic toxicity and genotoxic carcinogenicity [PDF].
[OECD] Organisation for Economic Co-operation and Development, Environment Directorate. 2012. QSAR Application Toolbox. Version 2.3. Developed by: Bourgas (BG): Bourgas Prof. Assen Zlatarov University, Laboratory of Mathematical Chemistry.
Oscarson ET. 1975. 90-Day Subacute Oral Toxicity Study with Dechlorane Plus 25 in Albino Rats. Testing laboratory: Industrial BIO-TEST Laboratories, Inc. Report no.: IBT No. 622-06273. Owner company: Hooker Chemical Corporation. US EPA TSCAT document OTS0537030.
[OxyChem] Occidental Chemical Company. 2004. Transmittal letter on Dechlorane Plus submitted to the US EPA High Production Volume Program. [accessed 2014 February 27].
[OxyChem] Occidental Chemical Company. 2005. Transmittal letter on Dechlorane Plus submitted to the US EPA High Production Volume Program. [accessed 2014 February 27].
OxyChem® Dechlorane Plus® Manual [PDF]. 2007. Ver. 07-27-2007.
[OxyChem] Occidental Chemical Company. 2009. Final Revised Summaries IUCLID data set on Dechlorane Plus submitted to the US EPA High Production Volume Program. [accessed 2014 February 27].
Powers MB. 1964. Dechlorane Plus 25 toxicity data report. Acute oral dose range - rats. Testing laboratory: Hazelton Laboratories, Inc. Report no.: Lot No: D-64-438, D-64-439. Owner company: Hooker Chemical Corporation. US EPA TSCAT document OTS0537030.
Pridmore RD, Thrush SF, Wilcock RJ, Smith TJ, Hewitt JE, Cummings VJ. 1991. Effect of the organochlorine pesticide technical chlordane on the population structure of suspension and deposit feeding bivalves. Mar Ecol Prog Ser 76:261-271.
Qiu XH, Marvin CH, Hites RA. 2007. Dechlorane Plus and Other Flame Retardants in a Sediment Core from Lake Ontario. Environ Sci Technol 41:6014-6019.
Rajanna B, de la Cruz AA. 1975. Mirex Incorporation in the Environment: Phytotoxicity on Germination, Emergence, and Early Growth of Crop Seedlings. Bulletin of Environmental Contamination & Toxicology 14(1):77-82.
Reiner E, Helm P, Tomy G, Ladwig G, Ismail N, Pleskach K, Klawunn P, Sverko E, Muir D, Whittle M, et al. 2006. Dechlorane Plus® in the Niagara River and Lake Ontario: Temporal Trends in Suspended Sediments and Lake Trout. Poster presented at the 232 ACS National Meeting, San Francisco, CA, September 10-14, 2006.
Ren G, Yu Z, Ma S, Li H, Peng P, Sheng G, Fu J. 2009. Determination of Dechlorane Plus in Serum from Electronics Dismantling Workers in South China. Environ Sci Technol 43:9453-9457.
TetkoRoper DS, Hickey CW. 1994. Behavioural responses of the marine bivalve Macomona liliana exposed to copper- and chlordanedosed sediments. Mar Biol 118:673-680.
Sahlström LM, Sellström U, de Wit CA, Lignell S, Darnerud PO. 2014. Brominated flame retardants in matched serum samples from Swedish first-time mothers and their toddlers. Environ Sci Technol: 48(13), 7584-7592.
Sakuratani Y, Noguchi Y, Kobayashi K, Yamada J, Nishihara T. 2008. Molecular size as a limiting characteristic for bioconcentration in fish. J Environ Biol 29(1):89.92.
Salamova A, Hites RA. 2011. Dechlorane Plus in the Atmosphere and Precipitation near the Great Lakes. Environ Sci Technol 45:9924-9930.
Salamova A, Hermanson MH, and Hites RA. 2014. Organophosphate and Halogenated Flame Retardants in Atmospheric Particles from a European Arctic Site. Environ Sci Technol 48:6133-6140.
Sample BE, Opresko DM, Suter II GW. 1996. Toxicological Benchmarks for Wildlife: 1996 Revision. Health Sciences Research Division, Oak Ridge Tennessee. Submitted to United States Department of Energy. Contract No. DE-AC05-84OR21400.
Saunders AL and Quistad GB. 1983. Dechlorane Plus metabolism by rats. Testing laboratory: Zoecon Corporation. Report no.: Report No. 3761-35-04-83 [cited in OxyChem 2009].
Schenker U, MacLeod M, Scheringer M, Hungerbuhler K. 2005. Improving data quality for environmental fate models: A least-squares adjustment procedure for harmonizing physicochemical properties of organic compounds. Environ Sci Technol 39:8434-8441.
Shanmuganathan M, Zhang Z, Sverko E, Brymer R, Gill B, Smyth SA, and CH Marvin. 2017. The analysis of halogenated flame retardants in Canadian wastewater treatment plants using gas chromatography with tandem mass spectrometry (GC-MS/MS). Water Quality Research Journal, submitted.
She Y, Wu J, Zhang Y, Peng Y, Mo L, Luo X, Mai B. 2013. Bioaccumulation of polybrominated diphenyl ethers and several alternative halogenated flame retardants in a small herbivorous food chain. Environmental Pollution 174:164-170.
Shen L, Reiner E, Macpherson K, Kolic T, Sverko E, Helm PA, Bhavsar S, Brindle ID, Marvin CH. 2010. Identification and Screening Analysis of Halogenated Norbornene Flame Retardants in the Laurentian Great Lakes: Dechloranes 602, 603, and 604. Environ Sci Technol 44:760-766.
Shen L, Reiner EJ, Helm PA, Marvin CH, Hill B, Zhang X, MacPherson KA, Kolic TM, Tomy GT, and Brindle ID. 2011a. Historic trends of Dechloranes 602, 603, 604, Dechlorane Plus and other norbornene derivatives and their bioaccumulation potential in Lake Ontario. Environ. Sci. Technol 45:3333-3340. dx.doi.org/10.1021/es104328r.
Shen L, Reiner E, Macpherson K, Kolic T, Helm P, Richman L, Marvin C, Burniston D, Hill B, Brindle I, McCrindle R, Chittim B. 2011b. Dechloranes 602, 603, 604, dechlorane plus, and chlordane plus, a newly detected analogue, in tributary sediments of the Laurentian Great Lakes. Environ Sci Technol 45:693-699.
Shoeib M, Harner T, Webster GM, Sverko E, Cheng, Y. 2012. Legacy and current-use flame retardants in house dust from Vancouver, Canada. Environ Pollut 169:175-182.
Shoeib M, Ahrens L, Jantunen L, Harner T. 2014. Atmospheric concentrations of organobromine, organochlorine and organophosphate flame retardants in Toronto, Canada. Draft Manuscript.
Siddique S, Xian Q, Abdelouahab N, Takser L, Phillips SP, Feng YL, Wang B, Zhu J. 2012. Levels of dechlorane plus and polybrominated diphenylethers in human milk in two Canadian cities. Environ Int 39:50-55.
Simond AE, Houde M, Lesage V, Verreault J. 2017. Temporal trends of PBDEs and emerging flame retardants in belugas from the St. Lawrence Estuary (Canada) and comparisons with minke whales and Canadian Arctic belugas. Environ Res 156: 494-504.
STP Model [Estimation model]. 2001. Version 1.5. Peterborough (ON): Trent University, Canadian Environmental Modelling Centre.
Su G, Letcher RJ, Moore JN, Williams LL, Martin PA, de Solla SR, and Bowerman WW. 2015. Spatial and temporal comparisons of legacy and emerging flame retardants in herring gull colonies spanning the Laurentian Great Lakes and United States. Environmental Research 142: 720-730.
Sühring R, Busch F, Fricke N, Kotke D, Wolschke H, Ebinghaus R. 2016. Distribution of brominated flame retardants and dechloranes between sediments and benthic fish- A comparison of freshwater and marine habitat. Science of the Total Environment 542: 578-585.
Sverko E, Tomy GT, Marvin CH, Zaruk D, Reiner E, Helm PA, Hill B, and McCarry BE. 2008. Dechlorane Plus levels in sediment of the Lower Great Lakes. Environ. Sci and Technol 42(2):361-366.
Sverko E, Reiner EJ, Tomy GT, Mccrindle R, Shen L, Arsenault G, Zaruk D, Macpherson KA, Marvin CH, Helm PA, et al . 2010. Compounds structurally related to Dechlorane Plus in sediment and biota from Lake Ontario (Canada). Environ Sci Technol 44:574-579.
Sverko E, Tomy GT, Reiner EJ, Li Y-F, McCarry BE, Arnot JA, Law RJ, Hites RA.2011. Dechlorane plus in the environment: A Reivew. Environ Sci Technol 45:5088-5098.
TemaNord; 2011. Schlabach, M, Remberger, M, Brorström-Lundén, E, Norström, K, Kaj, L, Andersson, H, Herzke, D, Borgen A, Harju M. Brominated Flame Retardants (BFR) in the Nordic Environment. Copenhagen (Denmark): Nordic Council of Ministers.
[TIMES] TIssue MEtabolism Simulator [Prediction module]. 2012. Version 2.27.5. Bourgas (BG): Bourgas Prof. Assen Zlatarov University, Laboratory of Mathematical Chemistry.
Tomy G, Pleskach K , Ismail N, Whittle M, Helm P, Sverko E, Zaruk D, Marvin C. 2007.Isomers of Dechlorane Plus in Lake Winnipeg and Lake Ontario Food Webs. Environ Sci Technol 41:2249-2254.
Tomy G, Thomas CR, Zidane TM, Murison KE, Pleskach K , Hare J, Arsenault G. 2008. Examination of Isomer Specific Bioaccumulation Parameters and Potential In vivo Hepatic Metabolites of syn- and anti-Dechlorane Plus Isomers in Juvenile Rainbow Trout (Oncorhynchus mykiss). Environ Sci Technol 42:5562-5567.
[TOPKAT] Toxicity Prediction by Komputer Assisted Technology [Prediction Module]. 2004. Version 6.2. San Diego (CA): Accelrys Software Inc.
Trzyna GE.1975. 28-Day Subacute Dermal Toxicity Study with Dechlorane Plus 25 in Albino Rabbits. Testing laboratory: Industrial BIO-TEST Laboratories, Inc. Report no.: IBT No. 601-06280. Owner company: Hooker Chemical Corporation. Report date: June 13,1975. US EPA TSCAT document OTS0537030.
[US EPA] United States Environmental Protection Agency. 1993. Wildlife Exposure Factors Handbook: Volume I. EPA/600/R-93/187a. Office of Research and Development.
[US EPA] US Environmental Protection Agency. 2003. “Exposure and human health reassessment of 2,3,7,8-tetrachlorodibenzo-p-dioxin (TCDD) and related compounds, Part I: Estimating exposure to dioxin-like compounds, Volume 3: Site-specific assessment procedures, Chapter 4: Estimating exposure media concentrations,” EPA/600/P-00/001Cb, U.S. Environmental Protection Agency, National Center for Environmental Assessment, Washington, DC, December 2003.
[US EPA] US Environmental Protection Agency. 2004. HPV Challenge; Robust Summaries and Test Plans: Dechlorane Plus [PDF], cover letter dated on September 24, 2004 (doc. no. 201-15635).
[US EPA] US Environmental Protection Agency. 2009. HPV Challenge; Robust Summaries and Test Plans: Dechlorane Plus, cover letter dated on March 3, 2009 (doc. no. 201-16774), IUCLID report dated November 7, 2008.
[US EPA] US Environmental Protection Agency. 2011. Screening-level hazard characterization – Dechlorane plus (CASRN 13560-89-9).
[US EPA] US Environmental Protection Agency. 2014. An alternatives assessment for the flame retardant decabromodiphenyl ether (decaBDE) Final Report January 2014 [PDF].
[VCCLAB] Virtual Computational Chemistry Laboratory. ALOGPS [non-Java interface]. 2005. [accessed 2013 October]
Venier M, Hites RA. 2008. Flame Retardants in the Atmosphere near the Great Lakes. Environ Sci Technol 4:4745-4751.
Venier M, Wierda M, Bowerman M, Hites RA. 2010. Flame retardants and organochlorine pollutants in bald eagle plasma from the Great Lakes region. Chemosphere 80:1234-1240.
Venier M, Dove A, Romanak K, Backus S, Hites R. 2014. Flame Retardants and Legacy Chemicals in Great Lakes’ Water. Environ Sci Technol 48(16):9563-72.
Venier M, Salamova A, Hites RA. 2015. Halogenated Flame Retardants in the Great Lakes Environment. Acc Chem Res 48 (7):1853–1861.
Venier M, Audy O, Vojta S, Bečanova J, Romanak K, Melymuk L, Krátká M, Kukučka P, Okeme J, Saini A, Diamond ML, Klánová J. 2016. Brominated flame retardants in the indoor environment – Comparative study of indoor contamination from three countries. Environment International 94:150-160.
Vorkamp K, Bossi R, Riget FF, Skov H, and Sonne C. 2015. Novel brominated flame retardants and dechlorne plus in Greenland air and biota. Environmental Pollution 196:284-289.
Wang DG, Yang M, Qi H, Sverko E, Ma WL, Li YF, Alaee M, Reiner EJ, and Shen L. 2010. An Asia-Specific Source of Dechlorane Plus: Concentration, isomer profiles, and other related compounds. Environ. Sci. Technol 44:6606-6613.
Wang DG, Guo MX, Pei W, Byer JD, Wang Z. 2015. Trophic magnification of chlorinated flame retardants and their dechlorinated analogs in a fresh water food web. Chemosphere 118:293-300.
Wang L, Jia H, Liu X, Yang M, Hong W, Sun Y, Su Y, Qi H, Song W, Lin J, Li Y. 2012. Dechloranes in a river in northeastern China: spatial trends in multi-matrices and bioaccumulation in fish (Enchelyopus elongatus). Ecotoxicology and Environmental Safety 84:262-267.
Wania F. 2006. Potential of degradable organic chemicals for absolute and relative enrichment in the Arctic. Environ Sci Technol 40:569–577.
[WATERNT] Water Solubility Program [Estimation Model]. 2010. Version 1.01. Washington (DC): US Environmental Protection Agency, Office of Pollution Prevention and Toxics; Syracuse (NY): Syracuse Research Corporation. [accessed 2014 January]
Webster E, Mackay D, Di Guardo A, Kane D,and Woodfine D. 2004. Regional differences in chemical fate model outcome. Chemosphere 55:1361-1376.
Weil ED, Levchik, SV, 2009. Flame Retardants for Plastics and Textiles: Practical
Applications. Cincinnati, Ohio: Hanser Publishers. 297 pp.
Wilson R, Jones-Otazo H, Petrovic S, Mitchell I, Bonvalot Y, Williams D, Richardson GM. 2013. Revisiting dust and soil ingestion rates based on hand-to-mouth transfer. Human and Ecological Risk Assessment 19(1): 158-188.
[WSKOWWIN] Water Solubility for Organic Compounds Program for Microsoft Windows [Estimation Model]. 2010. Version 1.42. Washington (DC): US Environmental Protection Agency, Office of Pollution Prevention and Toxics; Syracuse (NY): Syracuse Research Corporation. [accessed 2014 January]
Wu B, Liu S, Guo X, Zhang Y, Zhang X, Li M, Cheng S. 2012. Responses of mouse liver to dechlorane plus exposure by integrative transcriptomic and metabonomic studies. Environ Sci & Technol 46(19):10758-64.
Wu JP, Zhang Y, Luo XJ, Wang J, Chen SJ, Guan YT, Mai BX. 2010. Isomer-Specific Bioaccumulation and Trophic Transfer of Dechlorane Plus in the Freshwater Food Web from a Highly Contaminated Sites, South China. Environ Sci Technol 44:606-611 [Cited in USEPA HCD].
Xian Q, Siddique S, Li T, Feng YL, Takser L, Zhu J. 2011. Sources and environmental behavior of dechlorane plus – A review. Environ Int 2011 37:1273-84.
Xiao H, Shen L, Yushan S, Barresi E, DeJong M, Hung H, Lei Y, Wania F, Reiner E, Sverko E, et al. 2012. Atmospheric concentrations of halogenated flame retardatns at two remote locations: the Canadian high arctic and the Tibetan Plateau. Environ Pollut 161:154-161.
Xiao R, Adolfsson-Erici M, Akerman G, McLachlan MS, MacLeod M. 2013. A benchmarking method to measure dietary absorption efficiency of chemicasl by fish. Environ Toxicol Chem 32(12):2695-2700.
Yan X, Zheng J, Chen KH, Yang J, Luo XJ, Yu LH, Chen SJ, Mai BX, Yang ZY. 2012. Dechlorane plus in serum from e-waste recycling workers: influence of gender and potential isomer-specific metabolism. Environment International 49:31-37.
Yang, Q., Qiu, X., Li, R., Liu, S., Li, K., Wang, F & Zhu, T. 2013. Exposure to typical persistent organic pollutants from an electronic waste recycling site in Northern China.Chemosphere91(2):205-211.
Yang M, Jia H, Ma W, Qi H, Cui S, Li Y. 2012. Levels, compositions, and gas-particle partitioning of polybrominated diphenyl ethers and dechlorane plus in air in a Chinese northeastern city. Atmos Environ 55:73-79.
Yang RQ, Wei H, Guo JH, McLeod C, Li A, Sturchio NC. 2011. Historically and Currently Used Dechloranes in the Sediments of the Great Lakes. Environ Sci Technol 45:5156-5163.
Yang Y, Ji F, Cui Y, Li M. 2016. Ecotoxicological effects of earthworm following long-term Dechlorane Plus exposure. Chemosphere 144: 2476-2481.
Yu L, Luo X, Zheng X, Zeng Y, Chen D, Wu J. 2013. Occurrence and biomagnification of organohalogen pollutants in two terrestrial predatory food chains. Chemosphere 93(3):506-511.
Yu Y, Hung H, Alexandrou N, Roach P, Nordin K. 2015. Multiyear measurements of flame retardants and organochlorine pesticides in air in Canada’s western sub-Arctic. Environ Sci Technol 49:8623-8630.
Zhang Y, Wu JP, Luo XJ, Sun YX, Mo L, Chen SJ, Mai BX. 2011b. Tissue distribution and its dechlorinated analogs in contaminated fish : high affinity for anti-DP. Environmental Pollution 159:3647-3652.
Zhang H, Wang P, Li Y, Shang H, Wang Y, Wang T, Zhang Q, Jiang G. 2013. Assessment on the occupational exposure of manufacturing workers to dechlorane plus through blood and hair analysis. Environ Sci Technol 47(18):10567-73.
Zhang LJ, Ji FN, Li M, Cui YB, Wu B. 2014. Short-term effects of Dechlorane Plus on the earthworm Eisenia fetida determined by a systems biology approach. J Hazard Mater 273:239-246.
Zheng J, Wang J, Luo XJ, Tian M, He LY, Yuan JG, Mai BX, Yang ZY. 2010. Dechlorane Plus in human hair from an e-waste recycling area in South China: comparison with dust. Environ Sci Technol 44(24):9298-303.
Zhou SN, Siddique S, Lavoie L, Takser L, Abdelouahab N, Zhu J. 2014. Hexachloronorbornene-based flame retardants in humans: Levels in maternal serum and milk. Environ Int 66:11-17.
Zhu J, Feng YL, Shoeib M. 2007. Detection of Dechlorane Plus in residential indoor dust in the city of Ottawa, Canada. Environ Sci Technol 41(22):7694-7698.
Zitko V.1980. The uptake and excretion of mirex and dechloranes by Atlantic salmon. Chemosphere 9:73-78.
Appendix A. Structural identity
| CAS RN | Other selected names[a] |
|---|---|
| 13560-89-9 | 1,4:7,10-Dimethanodibenzo[a,e]cyclooctene 1,2,3,4,7,8,9,10,13,13,14,14-dodecachloro-1,4,4a,5,6,6a,7,10,10a,11,12,12a-dodecahydro-; IUPAC name: (1,6,7,8,9,14,15,16,17,17,18,18-Dodecachloropentacyclo[12.2.1.16,9.02,13.05,10]octadeca-7,15-diene); Bis(hexachlorocyclopentadieno)Cyclooctane; Dodecachlorodimethanodibenzocyclooctane; DDCDiMeDiBzcOb; 1,2,3,4,7,8,9,10,13,13,14,14-Dodecachloro- 1,4,4a,5,6,6a,7,10,10a,11,12,12a-dodecahydro- 1,4,7,10-dimethanodibenzo[a,e]cyclooctane; Bis(hexachlorocyclopentadieno)cyclooctane; Dechloran A; Dechlorane Plus; Dechlorane Plus 1000; Dechlorane Plus 25; Dechlorane Plus 2520; Dechlorane Plus 35; Dechlorane Plus 515; Dech Plus; Dodecachlorododecahydrodimethanodibenzocyclooctane; Dodecachlorododecahydrodimethanodibenzocyclooctene |
a Names acquired from: US EPA 2014 Alternatives assessment for Flame Retardant DecaBDE, Bergman et al. 2012, OxyChem MSDS etc.
Selection of analogues and use of (Q)SAR models
The analogues used to inform the sediment and soil toxicity sections of this ecological assessment are presented in Table 2-2. DP is a replacement for the flame retardant use of Mirex (also called Dechlorane, CAS RN 2385-85-5), and therefore Mirex was identified as a potential analogue. Chlordane was also identified by the OECD QSAR Application Toolbox as a structurally and functionally close analogue for which sediment and soil toxicity data were available. DP, Chlordane, and Mirex (as well as other “dechloranes”) are all similarly synthesized from hexachlorocyclopentadiene and are expected to behave similarly in the environment (e.g., partitioning to soil and sediment, stable/persistent etc.) (Environment and Climate Change Canada 1977).
While indices for the analogues vary in predicted similarity (DP and Chlordane are 59.14% (Tanimoto Index) to 92.7% (Chem ID structural similarity), Mirex and DP are 67.4% (Chem ID structural similarity) to 68.9% (Tanimoto Index), the structures (e.g., molecular weight, degree of chlorination) and reactivity profiles support that the substances are appropriate analogues for soil and/or sediment ecotoxicity. Using Chlordane and Mirex as analogues for toxicity is likely conservative as they are more bioavailable and therefore likely more toxic than DP (at least to aquatic organisms) because of their higher water solubility. As a result, these analogues were considered appropriate for use in the ecological effects assessment section (for sediment and soil organisms) to represent DP.
Although Mirex was never registered for use as a pesticide in Canada, it has been used worldwide as a stomach insecticide (formulated in baits) for ant and other insect pests and as a flame retardant in plastics, rubber, paint, paper and electrical goods (Environment and Climate Change Canada 2014, IPCS 1984). Mirex appears on the List of Toxic Substances (Schedule 1) of the Canadian Environmental Protection Act, 1999 (CEPA), and is regulated under the Mirex Regulations, 1989.
Chlordane is an organochlorine pesticide that was used in Canada from the mid-1940s to the1980s, but its registration and use under the Pest Control Products Act were discontinued as of 1991 (CCME 1999). Chlordane appears on the List of Toxic Substances (Schedule 1) of CEPA.
Chlordane occurs in several isomeric forms, the most common of which are the (cis) and (trans) forms (USEPA 1979). The IUPAC chemical name for the cis isomer of Chlordane is 1,2,4,5,6,7,8,8-octachloro-3a,4,7,7a-tetrahydro-4,7-methanoindane and for the trans isomer is 1,2,4,5,6,7,8,8-octachloro-3a,4,7,7a-hexahydro-4,7-methano-1H-indene. Technical Chlordane is a mixture of more than 140 chlorinated hydrocarbons (ATSDR 1989a); technical grade Chlordane is approximately 24% g‑isomer, 19% a‑isomer, 10% Heptachlor, 21% chlordene isomers, 7% nonachlor, and 18.5% related chlorinated compounds (Environment Canada 1998).
Appendix B. Physical-chemical properties
Physical-chemical properties of DP were checked for internal consistency according to the Least-Squares Adjustment Procedure (LSA) (Schenker et al. 2005). To conduct this, the geometric mean or arithmetic mean (for log partition coefficients) of available values for each physical-chemical parameter (vapour pressure, water solubility, octanol solubility, logKow, logKoa, logKaw) was entered into the model. Sub-cooled values were used for vapour pressure, water solubility, and octanol solubility. The values used to determine these means represent the most reliable and independent values available from empirical and modelling data (Table B-1; for all Physical-Chemical values see Table B-2). In determining internal consistency of the properties, the LSA model also produces predicted values (Table B-1).
While experimental based estimates for water solubility and vapour pressure exist for DP, there remains uncertainty with these values. For the purposes of this assessment, the log Kow value 8.78, derived from the LSA method, was selected. To maintain internal consistency of physical chemical values, the LSA method value for water solubility and vapour pressure were also considered. Final selected values are summarized in Table 2-1. Generally, DP is characterized by very low water solubility, low to very low vapour pressure, and a very high organic carbon-water partition coefficient and octanol-water partition coefficient.
| Data source | Vapour pressure (Pa) | Water solubility (mol/m3) | Octanol solubility (mol/m3) | Log Kow | Log Kaw | Log Koa |
|---|---|---|---|---|---|---|
| Experimental DP | ND | 6.12 x10⁻⁸ | 4.67 x10⁻⁷d | ND | ND | ND |
| Experimental DP | ND | 3.81 x10⁻⁷ | 0.719 | ND | ND | ND |
| Episuite Model (no inputs) | 1.53 x10⁻⁹ | 6.77 x 10⁻¹³a | ND | 11.27 | -3.52 | 14.79 |
| Episuite Model | 1.01 x10⁻⁸ | 1.0 x 10⁻⁹b | ND | ND | ND | ND |
| Episuite Model | 3.57 x10⁻¹¹ | ND | ND | ND | ND | ND |
| VCC/AGLOGs | ND | 1.28 x 10⁻⁶ | ND | 8.29 | ND | ND |
| ACD/Percepta | ND | 7.65x 10⁻⁷ | ND | 9.36 | ND | ND |
Geomean/ Meance LSA Input (subcooled liquid value in brackets) |
8.20x 10⁻¹⁰ (1.35x10⁻⁶) | 1.58x10⁻⁸(2.60x10⁻⁵) | 5.79x10⁻⁴ (9.52x10⁻¹) | 9.64 | -3.52 | 14.79 |
Adjusted Mean LSA Outpute (subcooled liquid value in brackets) |
1.08x10⁻⁷ (6.57x10⁻¹¹) | 7.18x10⁻⁷ (4.36x10⁻¹⁰) | 430 (2.62x10⁻¹) | 8.78 | -4.42 | 12.99 |
| % Adjustment | -92 | -97 | 45071 | -80 | -86 | -98 |
a WSKOWWIN 2010
b WATERNT 2010 (fragment method)
c Calculated arithmetic mean for log values since equivalent to geometric mean for antilog values (of partition coefficients)
d In order to maximize independence of parameter estimates, model values reliant on user logkow value were not included in the calculation of water solubility geomean.
e All data sources in Table B-2 (note unit conversions for water solubility), other than octanol solubility (from US EPA (2009) and ECHA (2013a). Individual listed values are solid state values for WS, VP, and Octanol solubility; the subcooled liquid state LSA Geomean/mean iInput and Output Values are in brackets beneath Geomean/mean Input Values“ND“: No data
| Property | Type | Valuea | Temperature (°C) | Reference |
|---|---|---|---|---|
| Physical state | Experimental | White, Crystalline Powder | NA | Occidental Chemical Company 2004 |
| Melting point (ºC) | Experimental | >325 | NA | Merck Index 2001& /cmw/ restrictions Chou et al, 1979. s found. sed? al claim that OxyChem did not specify which was which. USEPA 2009 |
| Melting point (ºC) | Experimental | 350 | NA | USEPA 2009 |
| Melting point (ºC) | Modelled | 349.84 | N/A | MPBPWIN 2010 |
| Melting point (ºC) | Modelled | 170.60 | N/A | MPBPWIN 2010 (Adapted Joback Method) |
| Melting point (ºC) | Modelled | 260.22 (Mean Value) | N/A | MPBPWIN 2010 (Gold and Ogle Method) |
| Boiling point (ºC) | Modelled | 486.83 Irrelevant; expected to degrade before boiling | N/A | MPBPWIN 2010 |
| Density (kg/m3) | Experimental | 1.8 (1.8 g/cm3) 38-42 lb/ ft3 (0.61-0.67 g/cm3 (DP-515 and DP-25) | NS | US EPA 2009 |
| Density (kg/m3) | Experimental | 25-30 lb/ft3 (0.4-0.48 g/cm3) (DP- 35) | NS | US EPA 2009 |
| Vapour pressure (Pa) | Experimental | 0.8 (6x10⁻³ mmHg) | 200 | US EPA 2009 |
| Vapour pressure (Pa) | Modelled | 1.53 x10⁻⁹ (1.15x10-011 mm Hg) | 25 | MPBPWIN 2010 (Modified Grain method) |
| Vapour pressure (Pa) | Modelled | 1.01 x10⁻⁸ (7.59E-011 mm Hg) | 25 | MPBPWIN 2010 (MacKay method) |
| Vapour pressure (Pa) | Modelled | 3.57 x10⁻¹¹ (2.68x10⁻¹³mmHg) | 25 | MPBPWIN 2010 (Antoine method) |
| Vapour pressure (Pa) | Modelled | 1.08 x10⁻⁷ (liquid subcooled) | 25 | Least-Squares Adjustment Method (LSA) output Schenker et al. 2005 |
| Vapour pressure (Pa) | Modelled | 6.57 x10⁻¹¹ (solid; non-subcooled)b | 25 | (LSA) output Schenker et al. 2005 |
| Henry’s Law constant (Pa·m3/mol) | Modelled | 0.754 (7.44x10⁻⁶ atm·m3/mole, 3.04x 10⁻⁴ unitless) (logKaw=-3.52) | 25 | HENRYWIN 2011 (Bond method) |
| Henry’s Law constant (Pa·m3/mol) | Modelled | 1.3b (logKaw= -3.28)) | 25 | LSA Schenker et al. 2005 |
| Log Kow (dimensionless) | Modelled | 11.27 | 25 | KOWWIN 2010 |
| Log Kow (dimensionless) | Modelled | 8.29 | 25 | ALOGPS 2.1 VCCLAB 2005 |
| Log Kow (dimensionless) | Modelled | 9.36 | 25 | ACD/Percepta 1997-2012 |
| Log Kow (dimensionless) | Modelled | 8.78b | 25 | LSA Output Schenker et al. 2005 |
| Log Koc (dimensionless) | Experimental/ Estimated | 6.653 | NS | Chou et al. 1979 |
| Log Koc (dimensionless) | Modelled | 7.68 (estimate from MCI) 7.76d | NS | KOCWIN 2010 |
| Log Koa (dimensionless) | Modelled | 14.79c | 25 | KOAWIN 2010 |
| Log Koa (dimensionless) | Modelled | 12.46d | 25 | KOAWIN 2010 |
| Log Koa (dimensionless) | Modelled | 12.99b | 25 | LSA Schenker et al. 2005 |
| Water solubility (mg/L) | Experimental | 0.249 (249ppb; average of 197 ppb, 301ppb) | 25 | Scharf DJ. 1978 |
| Water solubility (mg/L) | Experimental | ~4.0 x10⁻⁵ (207 ng/L and 572 ng/L for individual isomers)e | 22 | Chou et al. 1979g |
| Water solubility (mg/L) | Experimental | <1.67 x10⁻⁶f | 20 | ECHA 2013b |
| Water solubility (mg/L) | Modelled | 4.42 x10⁻¹⁰c | 25 | WSKOWWIN 2010 |
| Water solubility (mg/L) | Modelled | 7.64 x10⁻⁶d | 25 | WSKOWWIN 2010 |
| Water solubility (mg/L) | Modelled | 6.54 x10⁻⁷ | 25 | WATERNT 2010 |
| Water solubility (mg/L) | Modelled | 8.4 x10⁻⁴ | 25 | ALOGPS 2.1 VCCLAB 2005 |
| Water solubility (mg/L) | Modelled | 5.0 x10⁻⁴ | 25 | ACD/Percepta 1997-2012 |
| Water solubility (mg/L) | Modelled | 4.69 x10⁻⁴ (subcooled liquid)b | 25 | LSA Output Schenker et al. 2005 |
| Water solubility (mg/L) | Modelled | 2.85 x10⁻⁷ (solid; i.e., non-subcooled) | 25 | LSA Output Schenker et al. 2005 |
Abbreviations: log Kow, octanol-water partition coefficient; log Koc, organic carbon-water partition coefficient; log Koa, octanol-air partition coefficient; pKa, acid dissociation constant; N/A, not applicable
a Values in parentheses represent the original ones as reported by the authors or as estimated by the models.
b For Least Squares Adjustment Method (LSA), see Table B-1 for list of values used.
c Used log Kow =11.27 (KOWWIN).
d Used log Kow =8.78 (Least Squares Adjustment Method -LSA).
e USEPA (2009) HPV (IUCLID Data Set of 07-Nov-2008) indicated that indirect result from the sediment-water partitioning experiment suggested that the solubility was about 44 ng/L (total for both isomers). This lower value was also considered the best estimate of water solubility.
f ECHA (2013b) water solubility report summary was published after the data analysis and modelling was completed for the DP assessment, and therefore was not included in the Least Squares Adjustment Method (LSA) for determining selected physical-chemical properties. However, the ECHA (2013b) reported result is very similar to the LSA water solubility value selected for modelling in this assessment, and is considered, where appropriate, in the final assessment.
| Property | Vapour pressure (Pa) | Log Kow | Log Koc | Water solubility (mg/L) |
|---|---|---|---|---|
| Chlordane | 1.0 x 10⁻⁵ | 5.2 – 6.0 | 4.78 | 0.56 |
| Mirex | 1. x 10-4 | 6.89 | 6 | 0.085 |
a Physical-chemical properties as cited in Environment and Climate Change Canada (1998).
b Experimental physical-chemical properties as presented in Episuite (2000-2012).
Appendix C. Estimates of daily intake of DP by various age groups within the general population of Canada
| Route of exposure | 0–6 moa Breast fedb |
0–6 mo Formula fedc |
0–6 mo Not formula fedd |
0.5–4 yre | 5–11 yrf | 12–19 yrg | 20–59 yrh | ≥60 yri |
|---|---|---|---|---|---|---|---|---|
| Ambient airj | 1.2E-05 | 1.2E-05 | 1.2E-05 | 2.6E-05 | 2.0E-05 | 1.1E-05 | 9.7E-06 | 8.4E-06 |
| Indoor airk | 7.7E-05 | 7.7E-05 | 7.7E-05 | 1.7E-04 | 1.3E-04 | 7.4E-05 | 6.3E-05 | 5.5E-05 |
| Drinking waterl | N/A | 1.5E-06 | 5.6E-07 | 6.3E-07 | 4.9E-07 | 2.8E-07 | 2.9E-07 | 3.1E-07 |
| Foodm | 5.5E-03 | 1.1E-03 | 2.9E-03 | 7.7E-03 | 6.6E-03 | 3.8E-03 | 2.9E-03 | 2.3E-03 |
| Dustn | 7.7E-04 | 7.7E-04 | 7.7E-04 | 4.0E-04 | 1.5E-04 | 5.6E-06 | 5.4E-06 | 5.3E-06 |
| Soilo | N/A | N/A | N/A | 5.3E-05 | 4.0E-05 | 1.4E-06 | 1.3E-06 | 1.2E-06 |
| Total Intake | 6.4E-03 | 1.9E-03 | 3.7E-03 | 8.3E-03 | 6.9E-03 | 3.9E-03 | 3.0E-03 | 2.4E-03 |
Abbreviations: N/A, not applicable; mo, months; yr, years
a Assumed to weigh 7.5 kg, to breathe 2.1 m3 of air per day (Health Canada 1998), and to ingest 38 and 0 mg of dust and soil per day, respectively (Wilson et al. 2013).
b Exclusively for breast fed infants, assumed to consume 0.742 L of breast milk per day (Health Canada 1998), and breast milk is assumed to be the only dietary source. The 95th percentile concentrations of total DP (0.054 ng/g ww) in breast milk samples (n=105) collected in 2008-09 from women from Sherbrooke, Quebec, Canada (Zhou et al. 2014; personal communication from EHSRB, Health Canada, dated May 15, 2014), multiplied by a breast milk density of 1.03 g/mL (converted to 0.06 ug/L), was selected for deriving upper-bounding daily intakes of DP for breast milk exposure.
c Exclusively for formula-fed infants, assumed to drink 0.8 L of water per day (Health Canada 1998), where water is used to reconstitute formula. See footnote on food and footnote on water for details.
d Exclusively for not formula-fed infants, assumed to drink 0.7 L of water per day, and to consume 45.1 g of cereal products per day and 99.1 g of mixed dishes and soups per day (Health Canada 1998). Approximately 50% of non-formula-fed infants are introduced to solid foods by 4 months of age, and 90% by 6 months of age (Health Canada 1998).
e Assumed to weigh 15.5 kg, to breathe 9.3 m3 of air per day, to drink 0.7 L of water per day, to consume 54.7 g of fish per day, 162.2 g of cereal products per day, and 149.1 g of mixed dishes and soups per day (Health Canada 1998), and to ingest 41 and 14 mg of dust and soil per day, respectively (Wilson et al. 2013).
f Assumed to weigh 31.0 kg, to breathe 14.5 m3 of air per day, to drink 1.1 L of water per day, to consume 89.8 g of fish per day, 290.1 g of cereal products per day, and 180.0 g of mixed dishes and soups per day (Health Canada 1998), and to ingest 31 and 21 mg of dust and soil per day, respectively (Wilson et al. 2013).
g Assumed to weigh 59.4 kg, to breathe 15.8 m3 of air per day, to drink 1.2 L of water per day, to consume 97.3 g of fish per day, 320.9 g of cereal products per day, and 213.0 g of mixed dishes and soups per day (Health Canada 1998), and to ingest 2.2 and 1.4 mg of dust and soil per day, respectively (Wilson et al. 2013).
h Assumed to weigh 70.9 kg, to breathe 16.2 m3 of air per day, to drink 1.5 L of water per day, to consume 111.7 g of fish per day, 248.4 g of cereal products per day, and 220.5 g of mixed dishes and soups per day (Health Canada 1998), and to ingest 2.5 and 1.6 mg of dust and soil per day, respectively (Wilson et al. 2013).
i Assumed to weigh 72.0 kg, to breathe 14.3 m3 of air per day, to drink 1.6 L of water per day, to consume 72.9 g of fish per day, 229.0 g of cereal products per day, and 213.8 g of mixed dishes and soups per day (Health Canada 1998), and to ingest 2.5 and 1.5 mg of dust and soil per day, respectively (Wilson et al. 2013).
j The maximum concentration of 340 pg/m3, measured in the Great Lakes region (Burdt Island, Ontario; Hung et al. 2014), was selected for deriving upper-bounding estimates of daily intake for ambient air exposure. Canadians are assumed to spend 3 hours outdoors each day (Health Canada 1998).
k The maximum total DP concentration (316 pg/m3, n=23) in indoor air in Toronto, Ontario, Canada (Venier et al. 2016) was selected for deriving upper-bounding estimates of daily intake for indoor air exposure. Canadians are assumed to spend 21 hours indoors each day (Health Canada 1998).
l No drinking water monitoring data were identified. The DP mean concentration of 13.9 pg/L from Lake Ontario, the highest among the Great Lakes (Venier et al. 2014), was selected for deriving upper-bounding estimates of daily intake for drinking water exposure.
m No monitoring data on marketed foods in Canada were identified; however data on three baby food categories were identified for samples collected in the U.S. (Liu et al. 2014). DP maximum concentrations in formula (83.2 pg/g ww), cereal (427 pg/g ww) and purée (23.6 pg/g ww) from the U.S. were selected for deriving upper-bounding estimates of daily intake for exposure to infant formula (infant formula fed group only), cereal products (infant not formula-fed and all higher age groups), and mixed dishes and soups food groups (infant not formula-fed and all higher age groups), respectively. The upper bound mean concentration of 0.85 ng/g ww (7.2 ng/g lw) in Lake Ontario lake trout (Ismail et al. 2009) was selected for deriving upper-bounding estimates of daily intake for exposure to all fish-related food items in the fish food group. Amounts of foods consumed on a daily basis by each age group over 12 food groups were obtained from the 1970-1972 Nutrition Canada Survey (Health Canada 1998).
n The total DP 95th percentile concentration (152.1 ng/g, n=498) from the Canadian baseline study (personal communication from EHSRB, Health Canada, dated June 5, 2017) was selected for deriving upper-bounding estimates of daily intake for dust exposure.
o No monitoring data of soil in North America were identified. Therefore, the maximum soil predicted environmental concentration (PEC) of 59 000 ng/g dw (0.059 mg/kg dw) was selected for deriving upper-bounding estimates of daily intake for soil exposure.
Appendix D. DP in household dust
| Location | Sample type | Sampling year | Sample size | Median [range] (ng/g) | P95 (ng/g) | Reference |
|---|---|---|---|---|---|---|
| Various, Canada | Vacuum | 2007- 2010 | 498 | 14.4 [<MDL (1.2 ng/g for syn-DP; 1.9 ng/g for anti-DP) to 2508] | 152.1 | Kubwabo et al. 2017 (unpublished) |
| Ottawa, ON, Canada | Vacuum | 2002- 2003 | 69 | 14 [2.3 – 182]a | 121 | Zhu et al. 2007 |
| Ottawa, ON, Canada | Vacuum | 2007 | 7 | 22 [14 – 61] | 60 | Zhu et al. 2007 |
| Vancouver, BC, Canada | Vacuum | 2007-2008 | 116 | 6.8 [<0.8–354] | 57.7 | Shoeib et al. 2012 |
| Toronto, ON, Canada (TI) | Vacuum | 2010-2011 | 5 | 8.2 (mean) [DL to 35] | NS | Diamond et al. 2013 |
| Toronto, ON, Canada | Vacuum | 2012 | 20 | 30.9 (mean) [<0.010 – 170] | NS | Diamond et al. 2013 |
| Toronto, ON, Canada | Vacuum | 2013 | 34 (from 23 homes) | 22 [ND-732] | NS | Venier et al. 2016 |
| California, USA | Living Area Surfaces | 2006 | 16 | 10 [3 – 47] | NS | Dodson et al. 2012 |
| California, USA | Living Area Surfaces | 2011 | 16 | 4.5 [<2 –15] | NS | Dodson et al. 2012 |
| Boston, USA | Vacuum | 2002- 2003 | 38 | 13.1 [NS – 111.5] | 44.4 (P90) | Johnson et al. 2013 |
| Guangzhou, China (urban) | Living Area Surfaces | 2008- 2009 | 27 | 13.8 [2.78 – 70.4] | 62.2 | Wang et al. 2011 |
| Rural Area, China | Living Area Surfaces | 2008- 2009 | 20 | 3.95 [ND – 27.1] | 26.8 | Wang et al. 2011 |
| Yuangtan Town, China (rural) | Living Area Surfaces | NS | 10 | 64.9 (mean) [32.6 – 118] | NS | Zheng et al. 2010 |
| Yuangtan Town, China (urban) | Urban Living Area Surfaces | NS | 27 | 18.9 (mean) [2.78 – 70.4] | NS | Zheng et al. 2010 |
Abbreviations: P95, 95th percentile; P90, 90th percentile; ON, Ontario; BC, British Columbia; NS, not specified; ND, not detected; TI, Toronto Intensive pilot study
a Excluding one extreme value of 5683 ng/g.
Appendix E. DP in human breast milk
| Location | Sampling year | n | Range (ng/g lw) |
Median (ng/g lw) |
P95 (ng/g lw) |
Reference |
|---|---|---|---|---|---|---|
| Sherbrooke, QC, Canada | 2008- 2009 | 105 | <0.01 – 15 | 0.074 | 3.5 | Zhou et al. 2014 |
| Kingston, ON, Canada | 2003- 2004 | 39 | <0.05 – 6.4 | 0.74 | 3.4 | Siddique et al. 2012 |
| Sherbrooke, QC, Canada | 2008- 2009 | 48 | <0.05 – 8 | 0.58 | 2.1 | Siddique et al. 2012 |
| Wenling, China; High-exposure group | 2010- 2011 | 44 | 1.01 – 590 | 4.46 | NS | Ben et al. 2013 |
| Wenling, China; Low-exposure group | 2010- 2011 | 44 | 0.83 – 8.05 | 2.19 | NS | Ben et al. 2013 |
Abbreviations: lw, lipid weight; P95, 95th percentile; QC, Quebec; ON, Ontario; DL, detection limit; n, sample size; NS, not specified
Appendix F. DP in human biological matrices
| Location | Sampling year; n | Range (ng/g lw) | Median (ng/g lw) | P95 (ng/g lw) | Reference |
|---|---|---|---|---|---|
| Sherbrooke, QC, Canada | 2008-2009; 102 | ND – 81 | 2.39 | 31.6 | Zhou et al. 2014 |
| Besançon, France | 2003-2005; 48 | ND – 7.04 | 1.20 | NS | Brasseur et al. 2014 |
| Oslo area, Norway | 46 | ND- 31 | 1.3 | NS | Cequier et al. 2014 |
| Wenling, China; High-exposure group | 2010-2-11; 48 | Maternal:1.28 – 900 Placentas: 0.92 – 197 Umbilical: 0.680–89.7 | 8.43 3.21 2.82 | NS | Ben et al. 2014 |
| Wenling, China; Low-exposure group | 2010-2011 | Maternal: 1.69−11.6 Placentas:0.459−2.86 Umbilical: 0.450−27.2 | 3.55 1.09 1.82 | NS | Ben et al. 2014 |
| Guiyu town, China (workers in e-waste dismantling industry) | 2005 | 7.8 – 465 | 42.6 | NS | Ren 2009 |
| Haojiang, China (workers in fishing industry) | 2005 | 0.93 – 50.5 | 13.7 | NS | Ren 2009 |
| Tianjin, China (exposure group of workers and local residents) | 2009 and 2010; 35 | 4.21 – 12.4 | 6.29 | Yang et al. 2013 | |
| Tianjin, China, (control group, in proximity to the e-waste plants but not engaged in dismantling) | 2009 and 2010; 21 | 0.53 – 1.79 | 1.06 | NS | Yang et al. 2013 |
Abbreviations: lw, lipid weight; P95, 95th percentile; n, sample size; ND, not detected; NS, not specified