
Screening assessment - Phthalate substance grouping
Official title: Screening assessment - Phthalate substance grouping
Environment and Climate Change Canada
Health Canada
December 2020
Cat. No.: En14-393/2019E-PDF
ISBN 978-0-660-32979-6

Synopsis
Pursuant to sections 68 and 74 of the Canadian Environmental Protection Act, 1999 (CEPA), the Minister of the Environment and the Minister of Health have conducted a screening assessment of 14 phthalate esters (phthalates), known collectively as the Phthalate Substance Grouping. Substances in this grouping were identified as priorities for assessment as they met categorization criteria under subsection 73(1) of CEPA or were considered a priority on the basis of other human health concerns. This screening assessment follows the August 2015 publication of four state of the science (SOS) reports and an approach document for cumulative risk assessment (CRA) of phthalates, and it presents information relevant to concluding on the substances in this grouping under section 64 of CEPA.
The Chemical Abstracts Service Registry Numbers (CAS RNFootnote 1 ), Domestic Substances List (DSL) names and acronyms for phthalates in the Phthalate Substance Grouping screening assessment are listed in the table below.
| CAS RN | DSL name | Acronym | Subgroup |
|---|---|---|---|
| 131-11-3a | 1,2-Benzenedicarboxylic acid, dimethyl ester | DMP | Short-chain |
| 84-69-5a | 1,2-Benzenedicarboxylic acid, bis(2-methylpropyl) ester | DIBP | Medium-chain |
| 5334-09-8 | 1,2-Benzenedicarboxylic acid, cyclohexyl 2-methylpropyl ester | CHIBP | Medium-chain |
| 84-64-0 | 1,2-Benzenedicarboxylic acid, butyl cyclohexyl ester | BCHP | Medium-chain |
| 84-61-7 | 1,2-Benzenedicarboxylic acid, dicyclohexyl ester | DCHP | Medium-chain |
| 523-31-9 | 1,2-Benzenedicarboxylic acid, bis(phenylmethyl) ester | DBzP | Medium-chain |
| 68515-40-2 | 1,2-Benzenedicarboxylic acid, benzyl C7-9-branched and linear alkyl esters | B79P | Medium-chain |
| 27987-25-3 | 1,2-Benzenedicarboxylic acid, bis(methylcyclohexyl) ester | DMCHP | Medium-chain |
| 71888-89-6a | 1,2-Benzenedicarboxylic acid, di-C6-8-branched alkyl esters, C7-rich | DIHepP | Medium-chain |
| 27215-22-1 | 1,2-Benzenedicarboxylic acid, isooctyl phenylmethyl ester | BIOP | Medium-chain |
| 16883-83-3 | 1,2-Benzenedicarboxylic acid, 2,2-dimethyl-1-(1-methylethyl)-3-(2-methyl-1-oxopropoxy)propyl phenylmethyl ester | B84P | Medium-chain |
| 68515-48-0a / 28553-12-0 | 1,2-Benzenedicarboxylic acid, di-C8-10-branched alkyl esters, C9-rich; 1,2-Benzenedicarboxylic acid, diisononyl ester | DINP | Medium-chain / Long-chain b |
| 26761-40-0 / 68515-49-1a | 1,2-Benzenedicarboxylic acid, diisodecyl ester; 1,2-Benzenedicarboxylic acid, di-C9-11-branched alkyl esters, C10-rich | DIDP | Long-chain |
| 3648-20-2 | 1,2-Benzenedicarboxylic acid, diundecyl ester | DUP | Long-chain |
a This substance was not identified under subsection 73(1) of CEPA but was included in this assessment as it was considered a priority on the basis of other human health concerns.
b For the purposes of the health review, DINP was included with the medium-chain phthalate esters subgroup, and for the purposes of the ecological review it was included with the long-chain phthalate subgroup (see Environment Canada, Health Canada 2015c for more details).
Phthalates in the Phthalate Substance Grouping assessment were divided into short-chain, medium-chain and long-chain subgroups, depending on the length of the carbon backbone in the ester side-groups. The primary basis for the subgroups from a health hazard perspective was a structure activity relationship (SAR) analysis using studies related to certain events in the mode of action for phthalate-induced androgen insufficiency during male reproductive development in the rat. From an ecological perspective, subgrouping was based primarily on differences in log Kow and water solubility and their resulting effects on bioaccumulation and ecotoxicity. Phthalates within each subgroup are likely to have similar chemical properties, while toxicological properties are largely, but not exclusively, similar. The above table also identifies the subgroup to which each phthalate in the grouping was assigned.
Fourteen additional phthalates on the Domestic Substances List DSL were included within the scope of the screening assessment in the context of their potential to contribute to cumulative risk from combined exposure to phthalates. Substance identity information for the additional phthalates considered in this assessment is provided in the table below. Thirteen of the 14 additional phthalates were not assessed individually and therefore no conclusions for them, under section 64 of CEPA, iswere made regarding them. The remaining substance, DEHP, was previously assessed in 1994 under the Priority Substance List (PSL). This previous assessment concluded that DEHP is harmful to human health and meets the criteria under paragraph 64(c) of CEPA. However, at that time, there was insufficient information to provide an ecological conclusion. Information has since become available to support a conclusion on its potential to cause harm to the environment.
CAS RN |
Domestic Substances List DSL name |
Acronym |
Subgroup |
|---|---|---|---|
84-66-2 |
1,2-Benzenedicarboxylic acid, diethyl ester |
DEP |
Short-chain |
131-16-8 |
1,2-Benzenedicarboxylic acid, dipropyl ester |
DPrP |
Medium-chain |
84-74-2 |
1,2-Benzenedicarboxylic acid, dibutyl ester |
DBP |
Medium-chain |
85-68-7 |
1,2-Benzenedicarboxylic acid, butyl phenylmethyl ester |
BBP |
Medium-chain |
84-75-3 |
1,2-Benzenedicarboxylic acid, dihexyl ester |
DnHP |
Medium-chain |
111381-89-6 |
1,2-Benzenedicarboxylic acid, heptyl nonyl ester, branched and linear |
79P |
Medium-chain |
27554-26-3 |
1,2-Benzenedicarboxylic acid, diisooctyl ester |
DIOP |
Medium-chain |
117-81-7 |
1,2-Benzenedicarboxylic acid, bis(2-ethylhexyl) ester |
DEHP |
Medium-chain |
68648-93-1 |
1,2-Benzenedicarboxylic acid, mixed decyl and hexyl and octyl diesters |
610P |
Long-chain |
117-84-0 |
1,2-Benzenedicarboxylic acid, dioctyl ester |
DnOP |
Long-chain |
68515-43-5 |
1,2-Benzenedicarboxylic acid, di-C9-11-branched and linear alkyl esters |
D911P |
Long-chain |
111381-91-0 |
1,2-Benzenedicarboxylic acid, nonyl undecyl ester, branched and linear |
D911P-2 |
Long-chain |
85507-79-5 |
1,2-Benzenedicarboxylic acid, diundecyl ester, branched and linear |
DIUP |
Long-chain |
68515-47-9 |
1,2-Benzenedicarboxylic acid, di-C11-14-branched alkyl esters, C13-rich |
DTDP |
Long-chain |
Results from a CEPA section 71 survey for 2012 determined that 6 of the 28 phthalates being considered in the assessment (DINP, DIDP, DUP, DEHP, D911P and DIUP) were manufactured in and/or imported into Canada in quantities greater than 10 million kg/year, while 7 (BCHP, CHIBP, DBzP, DMCHP, BIOP, DnHP and DPrP) were below the reporting threshold of 100 kg/year. Manufacture and import quantities for the remaining 15 phthalates were in the range of 10 000 to 1 000 000 kg/year. Phthalates are used in a variety of consumer, commercial and industrial products in Canada, including plastics, paints and coatings, adhesives and sealants, automotive parts, electronics, and personal care products.
Water is expected to be the primary receiving medium for phthalates, although some release into air may also occur. When released into the environment, short-chain phthalates are predicted to distribute into water, air and soil, while long-chain phthalates will distribute mainly into soil and sediment with lesser proportions present in the water column. Substances in the medium-chain subgroup exhibit a range of physical-chemical properties; therefore the predicted distribution among environmental media varies across the substances.
Phthalates biodegrade and are not expected to persist in the environment, although degradation rates vary with phthalate molecular size and physicochemical properties, substrate concentration and environmental conditions. Degradation proceeds more slowly under low oxygen conditions, such as may occur in sediment and soil, potentially increasing exposure times for organisms residing in these media. As well, information on Canadian phthalate use and release patterns suggests that exposure to phthalates in the Canadian environment may be continuous. Because of their rapid biodegradation, exposure to phthalates will be greatest for organisms inhabiting areas close to release sites.
In the environment, phthalates are bioavailable but do not have high bioaccumulation and biomagnification potential given a high rate of biotransformation in biota. Most long-chain phthalates demonstrate low hazard potential in aquatic and terrestrial species, while short- and medium-chain phthalates exhibit moderate to high hazard potential. While narcosis is an important mode of toxic action for phthalates, particularly under short-term exposure, there is strong evidence that some phthalates may also elicit longer-term chronic adverse effects through other, specific modes of action. In particular, some phthalates may have the ability to affect the normal functioning of endocrine systems in organisms. While strong in vivo evidence of effects on endocrine systems in aquatic organisms has only been demonstrated for a small number of medium-chain phthalates, evidence suggests that many medium-chain phthalates and some short-chain and long-chain phthalates possess properties that could allow them to adversely influence endocrine activity under some conditions.
Results from an analysis of risk quotients comparing estimated potential exposures for individual phthalates (predicted environmental concentration [PEC]) with their potential for adverse effects (predicted no-effect concentration [PNEC]) determined that all 14 phthalates in the Phthalate Substance Grouping present a low risk of causing adverse effects to aquatic species given current exposure levels in the Canadian environment. One additional phthalate, DEHP, has the potential to cause adverse effects in populations of aquatic organisms in Canada at current exposure levels.
In addition, tissue residue analyses were conducted for phthalates having dietary uptake as the primary exposure pathway. The results indicated that maximum tissue concentrations based on solubility limits will be lower than levels associated with adverse acute or chronic lethality effects due to narcosis. A cumulative risk analysis using the Sum of Internal Toxic Units (ITUs) approach determined a highest total ITU value of 0.2. This value was considered to be conservative as it assumed maximum internal tissue concentrations and highest predicted exposure levels for each of the 28 phthalates examined in the assessment. The results indicate there is no ecological concern due to cumulative effects based on lethality and a narcotic mode of action.
For the general population in Canada, exposure estimates derived from biomonitoring data, when available, were compared to environmental media and food exposure estimates. The principal source of exposure to DMP is expected to be breast milk and food, with indoor air and dust also acting as contributors. Dermal and inhalation (aerosol) exposure to personal care products were also evaluated for adults and infants. Sources of exposure for medium-chain phthalates are indoor air, dust, food and breast milk. Given the information received indicating that a portion of these substances in manufactured items may come in contact with skin, exposure scenarios were identified to characterize dermal exposure for adults and infants. Finally, DIBP and DINP may also be present in children’s toys and articles; therefore, oral exposure from mouthing these products was also evaluated. The principal source of exposure to DIDP and DUP for the general population is expected to be house dust (oral ingestion) as well as food and beverages for DIDP (oral ingestion). Exposure scenarios were identified to characterize dermal exposure for adults and children for both long-chain phthalates.
With regard to human health, the health effects data for medium-chain phthalates show that there is evidence of effects in animal studies that includes developmental, reproductive and systemic effects related to the liver and kidneys. Of these, depending on the phthalate in question, the critical effect for risk characterization is developmental effects on males, as the available evidence is strongest for effects on the development of the reproductive system, such as indications of feminization in males, reproductive tract malformations, and effects on fertility related to a relatively well-studied mode of action called the “rat phthalate syndrome” (RPS). This syndrome has been associated with the lowest levels of exposure to this subgroup examined to date in animal studies. The health effects database for short-chain and long-chain phthalate esters shows no evidence of adverse effects on the development of the reproductive system in males. The critical levels selected for risk characterization for DMP were mainly related to mild changes in brain weights after chronic dermal exposure. The health effects database for long-chain phthalates shows that the critical effect for risk characterization is effects on the liver.
Comparisons of estimates of exposure to the 10 medium-chain phthalates in the Phthalate Substance Grouping from various sources, such as environmental media, food, contact with plastic articles (PVC, polyurethane, polyester, etc.), toys and/or personal care products, as well as biomonitoring levels (if available) for all age groups with the appropriate critical effect levels, result in margins of exposure (MOEs) that are considered adequate to address uncertainties in the exposure and health effects databases. Further, these margins are also considered protective of potential reproductive effects not only in males exposed at older life stages but also in females, in addition to effects in other organ systems. Comparisons of estimates of exposure to DMP from environmental media, food, and personal care products, as well as biomonitoring levels for all age groups, with the appropriate critical effect levels, result in MOEs that are considered adequate to address uncertainties in the exposure and health effects databases. Comparisons of estimates for exposure to DIDP and DUP from various sources such as environmental media, food and contact with plastic articles as well as from biomonitoring levels, as available, with critical effect levels results in margins that are considered adequate to address uncertainties in the exposure and health effects databases. Those margins are also protective of potential limited developmental and reproductive effects of DIDP and DUP toxicity not only in males, but also in females as well as other systemic effects.
Results of the CEPA section 71 industry survey indicate that CHIBP, BCHP and BIOP are not currently in use above the reporting threshold of 100 kg, and the likelihood of exposure to the general population in Canada is considered to be low. Hence, the potential risk to human health is considered to be low for these three substances.
On the basis of the information available, there is evidence that phthalates in the medium-chain subgroup have a common mode of action, as they elicit effects on the developing male reproductive system indicative of RPS. Although the MOEs associated with the original 10 medium-chain phthalates included in this assessment are currently considered adequate on an individual substance basis, these MOEs do not address potential risk from concurrent exposure to these and other similar phthalates. As mentioned above, an additional 5 phthalates (BBP, DBP, DEHP, DnHP, and DIOP) were considered in the evaluation of cumulative risk for human health given information indicating that their mode of action is likely to be similar to that of phthalates in the medium-chain subgroup, as well as evidence that they may represent a potential for exposure to the general population of Canada.
A CRA, using a conservative, lower-tiered hazard index (HI) approach has been conducted and indicates no concern for potential cumulative risk of medium-chain phthalates for the general Canadian population, specifically the more sensitive subpopulations (pregnant women/women of childbearing age, infants, and children) at current exposure levels. The HI values for the three subpopulations with the highest estimated exposure levels are all below 1. Hence, further refinement to a higher-tiered assessment is not necessary at this time.
Overall conclusion
Considering all available lines of evidence presented in this screening assessment, there is low risk of harm to the environment from the 14 phthalates in the Phthalate Substance Grouping (DMP, DIBP, CHIBP, BCHP, DCHP, DBzP, B79P, DMCHP, DIHepP, BIOP, B84P, DINP, DIDP and DUP); however, there is risk of harm to the environment from one additional phthalate, DEHP. DEHP was previously assessed by Environment Canada and Health Canada in 1994 under the Priority Substances Assessment Program. The assessment concluded that DEHP is harmful to human health in Canada. However, a conclusion for potential harm to the environment could not be determined at that time because of insufficient information.
It is concluded that the 14 substances in the Phthalate Substance Grouping do not meet the criteria under paragraphs 64(a) or (b) of CEPA as they are not entering the environment in a quantity or concentration or under conditions that have or may have an immediate or long-term harmful effect on the environment or its biological diversity or that constitute or may constitute a danger to the environment on which life depends. It is concluded that DEHP meets the criteria under paragraph 64(a) of CEPA as it is entering or may enter the environment in a quantity or concentration or under conditions that have or may have an immediate or long-term harmful effect on the environment or its biological diversity. However, it is concluded that DEHP does not meet the criteria under paragraph 64(b) of CEPA as it is not entering the environment in a quantity or concentration or under conditions that constitute or may constitute a danger to the environment on which life depends.
On the basis of the information presented in this screening assessment, it is concluded that all 14 phthalates in the Phthalate Substance Grouping do not meet the criteria under paragraph 64(c) of CEPA as they are not entering the environment in a quantity or concentration or under conditions that constitute or may constitute a danger in Canada to human life or health. Also, the previous conclusion made in the 1994 PSL assessment of DEHP, that it meets the criteria under paragraph 64(c) of CEPA, remains valid.
Therefore, it is concluded that DEHP meets one or more of the criteria set out in section 64 of CEPA. DEHP has been determined to not meet the persistence or bioaccumulation criteria as set out in the Persistence and Bioaccumulation Regulations of CEPA.
1. Introduction
Pursuant to sections 68 and 74 of the Canadian Environmental Protection Act, 1999 (CEPA) (Canada 1999), the Minister of the Environment and the Minister of Health have conducted a screening assessment of 14 phthalate esters (phthalates), referred to collectively as the Phthalate Substance Grouping, to determine whether these substances present or may present a risk to the environment or to human health.
These substances are part of the Substance Groupings Initiative, a key element of the Government of Canada’s Chemicals Management Plan (CMP). The substances in this grouping were identified as priorities for assessment as they met categorization criteria under subsection 73(1) of CEPA or were considered a priority on the basis of other human health concerns (ECCC, HC [modified 2007]). Certain substances within this substance grouping have been identified by other jurisdictions as a concern due to their potential reproductive and developmental effects in humans.
Some phthalates may have common health or ecological effects of concern, so the potential for cumulative risk from combined exposure to these substances was addressed by considering an additional 14 phthalates. The additional phthalates did not meet categorization criteria and were therefore not identified as priorities for assessment. However, they were selected for inclusion in the evaluation of cumulative risk on the basis of information indicating that their mode of action is likely to be similar to that of phthalates in the grouping, as well as evidence that they may represent a potential for exposure to the general population of Canada and to the Canadian environment. Four of the additional phthalates (DBP, BBP, DEHP and DnOP) were previously assessed, on an individual basis, in the First or Second Priority Substances Lists (PSL1 and PSL2) (Environment Canada and Health Canada 1993, 1994a,b, 2000). DBP and BBP were determined to not present a risk to the environment or to human health. DnOP was found to not present a risk to the environment; however, at the time of the assessment, the available information was not sufficient to allow a conclusion in terms of human health. A subsequent report published by Health Canada in 2003 concluded that DnOP did not pose a risk to human health. DEHP was determined to present a risk to human health in Canada; however, there was insufficient information to conclude on the potential for risk to the environment at that time.
This screening assessment includes consideration of information on chemical properties, environmental fate, hazards, uses and exposure, including additional information submitted by stakeholders. Relevant data were identified up to August 2018 for the ecological portion and up to January 2018 for the health portion of this screening assessment. Empirical data from key studies, as well as some results from models, were used to reach conclusions. When available and relevant, information presented in assessments from other jurisdictions was considered.
This screening assessment follows the August 2015 publication of four state of the science (SOS) reports (Environment Canada, Health Canada 2015a,b,c,d) for the 14 substances in the Phthalate Substance Grouping, and of a document entitled Proposed Approach for Cumulative Risk Assessment of Certain Phthalates under the Chemicals Management Plan (Environment Canada, Health Canada 2015e). These documents were released ahead of the screening assessment in order to allow for the receipt of comments and suggestions from interested parties relating to the proposed CRA approach. Comments received during the 60-day public comment period were taken into consideration during the preparation of this screening assessment. The screening assessment summarizes the information presented in the four SOS reports and incorporates relevant new information. As well, the assessment presents risk characterizations for phthalates in the grouping, including analysis of the potential for cumulative risk (ecological risk and risk to human health), and provides conclusions under section 64 of CEPA.
This screening assessment was prepared by staff in the CEPA Risk Assessment Program at Health Canada and Environment and Climate Change Canada and incorporates input from other programs within these departments. The ecological and human health portions of this assessment have undergone external review and/or consultation. Comments on the technical portions relevant to the environment were received from Dr. Thomas Backhaus (Faust & Backhaus Environmental Co., Germany), Sonja Bissegger (Royal Military College of Canada), Dr. Valerie Langlois (Royal Military College of Canada), Dr. Lynn McCarty (L.S. McCarty Scientific Research & Consulting, Canada), and Patricia Schmieder (U.S. Environmental Protection Agency). Comments on the technical portions relevant to human health were received from Linda Teuschler (Private consultant – retired from US EPA), Donna Vorhees (The Science Collaborative), Bernard Gadagbui (Toxicology Excellence for Risk Assessment), and Dr. Raymond York (RG York & Associates). Additionally, the draft of this screening assessment was subject to a 60-day public comment period. While external comments were taken into consideration, the final content and outcome of the screening assessment remain the responsibility of Health Canada and Environment and Climate Change Canada.
This screening assessment focuses on information critical to determining whether substances meet the criteria as set out in section 64 of CEPA by examining scientific information and incorporating a weight of evidence approach and precautionFootnote 2 . This screening assessment presents the critical information and considerations on which the conclusions are based. Additional details are provided in the SOS reports and the CRA document referred to above.
2. Identity of substances
The phthalate esters (phthalates) examined in this screening assessment are listed in Table 2-1. Structurally, these phthalates are comprised of a benzene ring with two ester side groups in the ortho position.
Substances in the Phthalate Substance Grouping were divided into short-chain, medium-chain and long-chain subgroups, depending on the length of the carbon backbone (i.e., the longest straight chain of carbons) in their ester side-groups. Short-chain phthalates are those with a carbon backbone length of 1 or 2, medium-chain phthalates have a backbone length of 3 to 7 carbons and long-chain phthalates have a backbone length of 8 carbons or greater. The nature of the ester side-groups, which can be linear, branched or cyclic, determines both the identity of the particular phthalate and its physical and toxicological properties.
The primary basis for the subgroups from a health hazard perspective was a structure activity relationship (SAR) analysis using studies related to important events in the mode of action for phthalate-induced androgen insufficiency during male reproductive development in the rat. The effects of phthalate esters for these important events appear to be structure-dependent and highly related to the length and nature of their alkyl chain. From an ecological perspective, subgrouping was based primarily on differences in log Kow and water solubility and their resulting effects on bioaccumulation and ecotoxicity. For the purposes of the health review, DINP was included with the medium-chain phthalates subgroup, while for the purposes of the ecological review, it was considered to align more closely with the long-chain phthalate subgroup.
The chemical structure, molecular weights, water solubilities and octanol-water partition coefficients (log Kow) for phthalates in the Phthalate Substance Grouping are listed in Appendix A. Additional information is provided in Environment Canada, Health Canada (2015a,b,c,d,e), and Environment and Climate Change Canada (ECCC 2018). New compositional information on the UVCB phthalate, 1,2-benzenedicarboxylic acid, benzyl C7-9-branched and linear alkyl esters (B79P, CAS RN 68515-40-2) was received during the 60-day public comment period for the draft screening assessment and this led to a review of all aspects relating to the physical-chemical properties, fate, toxicity and environmental occurrence of this substance. Changes resulting from this review are highlighted in the relevant sections of the screening assessment.
In some cases, a read-across approach using data from analogues and the results of quantitative structure-activity relationship (QSAR) models were used to inform the ecological and human health assessments. Model results and descriptions of methods used for analogue selection are provided in Environment Canada, Health Canada (2015a,b,c,d).
| Subgroup | Phthalate Substance Grouping Acronym (CAS RN) | Additional phthalates Acronym (CAS RN) |
|---|---|---|
| Short-chain | DMP (131-11-3) | DEP (84-66-2) |
| Medium-chain | DIBP (84-69-5); CHIBP (5334-09-8); BCHP (84-64-0); DCHP (84-61-7); DBzP (523-31-9); B79P (68515-40-2); DMCHP (27987-25-3); DIHepP (71888-89-6); BIOP (27215-22-1); DINP (68515-48-0/28553-12-0)a; B84P (16883-83-3) | DPrP (131-16-8); DBP (84-74-2)b; BBP (85-68-7)c; DnHP (84-75-3); 79P (111381-89-6); DIOP (27554-26-3); DEHP (117-81-7)b |
| Long-chain | DIDP (26761-40-0/68515-49-1); DUP (3648-20-2) | 610P (68648-93-1); DnOP (117-84-0)b; D911P (68515-43-5); D911P-2 (111381-91-0); DIUP (85507-79-5); DTDP (68515-47-9) |
Abbreviation: CAS RN, Chemical Abstracts Service Registry Number
a DINP was considered as a medium-chain phthalate for the purposes of the health assessment, and as a long-chain phthalate for the purposes of the ecological assessment.
b Included in the PSL1
c Included in the PSL2
3. Physical and chemical properties
The chemical properties of substances in the Phthalate Substance Grouping are primarily determined by the molar volume of the substance and the length of the alkyl side-chains substituted on the diester groups (Cousins et al. 2003). Substances in the grouping are oily liquids at typical ambient temperatures. Melting points for substances in the grouping vary between -64°C and 66°C, and boiling points are between 205°C and 463°C. Therefore, some phthalates in the grouping have the potential to be present in the solid state at low temperatures in the environment. In general, water solubility and vapour pressure decrease with increasing molar volume and alkyl side-chain length, while the tendency to adsorb to organic materials and particulates increases. For example, the short-chain phthalate DMP has very high water solubility (4000 mg/L), moderate vapour pressure (0.4 Pa) and low partition coefficients (log Kow 1.6, log Koc between 1.9 and 2.5), while the long-chain phthalate DIDP has very low water solubility and vapour pressure (1.7 × 10‑4 mg/L, 6.7 × 10⁻⁵ Pa) and high to very high partition coefficients (log Kow > 8, log Koc 5.5). Medium-chain phthalates display a range of chemical property values intermediate between those of short- and long-chain phthalates. Detailed information about chemical property values for substances in the Phthalate Substance Grouping is provided in the SOS reports (Environment Canada, Health Canada 2015a,b,c,d).
Chemical property data used for B79P were reviewed following the receipt of new compositional information for this UVCB phthalate submitted during the 60-day public comment period for the draft screening assessment. As experimental data were not available, (Q)SAR models were used to generate data for boiling point, water solubility, vapour pressure, Henry’s Law constant, and partition coefficients. Physical-chemical property values selected for B79P, as well as further information on the derivation of these values, are presented in Table A-2 of Appendix A.
4. Sources
Anthropogenic activities are the major source of phthalates in the environment. An industry survey issued pursuant to section 71 of CEPA was conducted in 2013 to obtain information on quantities in commerce in 2012 for substances in the Phthalate Substance Grouping and for the additional phthalates in Canada (Canada 2013). Results are presented in Tables 4‑1 and 4‑2 (Environment Canada 2014). Because of the targeted nature of the survey, reported use quantities may not fully reflect all uses in Canada.
| Phthalate Acronym | Total manufacture (kg)a | Total import (kg)a | Total export (kg)a |
|---|---|---|---|
| DMP | < reporting thresholdb | 10 000–100 000 | < reporting threshold |
| DIBP | < reporting threshold | 10 000–100 000 | < reporting threshold |
| DCHP | < reporting threshold | < 10 000 | < reporting threshold |
| DIHepP | < reporting threshold | < 10 000 | < reporting threshold |
| B79P | < reporting threshold | 100 000–1 000 000 | 100 000–1 000 000 |
| B84P | < reporting threshold | 100 000–1 000 000 | 100 000–1 000 000 |
| DINP | 1 000 000–10 000 000 | > 10 000 000 | 1 000 000–10 000 000 |
| DIDP | 10 000–100 000 | 1 000 000–10 000 000 | 100 000–1 000 000 |
| DUP | > 10 000 000 | 100 000–1 000 000 | 1 000 000–10 000 000 |
| BCHP | < reporting threshold | < reporting threshold | < reporting threshold |
| CHIBP | < reporting threshold | < reporting threshold | < reporting threshold |
| DBzP | < reporting threshold | < reporting threshold | < reporting threshold |
| DMCHP | < reporting threshold | < reporting threshold | < reporting threshold |
| BIOP | < reporting threshold | < reporting threshold | < reporting threshold |
a Values reflect quantities reported in response to the survey conducted under section 71 of CEPA (Environment Canada 2014). See survey for specific inclusions and exclusions (schedules 2 and 3).
b Reporting threshold: a total quantity greater than 100 kg of a substance, at a concentration equal to or above 0.001% by weight (w/w%) (Canada 2013).
| Phthalate Acronym | Total manufacture (kg)a | Total import (kg)a |
Total export (kg)a |
|---|---|---|---|
| BBP | < reporting thresholdb | 100 000–1 000 000 | 100 000–1 000 000 |
| DBP | < reporting threshold | 100 000–1 000 000 | 10 000–100 000 |
| DEHP | 1 000 000–10 000 000 | 100 000–1 000 000 | 10 000–100 000 |
| DIOP | < reporting threshold | < 10 000 | 0 |
| DEP | < reporting threshold | < 10 000 | < 10 000 |
| 79P | < reporting threshold | 10 000–100 000 | < reporting threshold |
| 610P | 100 000–1 000 000 | 100 000–1 000 000 | 100 000–1 000 000 |
| DnOP | < reporting threshold | 100 000–1 000 000 | < reporting threshold |
| D911P-2 | < reporting threshold | 10 000–100 000 | < reporting threshold |
| D911P | > 10 000 000 | 100 000–1 000 000 | 1 000 000–10 000 000 |
| DTDP | < reporting threshold | 100 000–1 000 000 | < reporting threshold |
| DIUP | 1 000 000–10 000 000 | 100 000–1 000 000 | 100 000–1 000 000 |
| DnHP | < reporting threshold | < reporting threshold | < reporting threshold |
| DPrP | < reporting threshold | < reporting threshold | < reporting threshold |
a Values reflect quantities reported in response to the survey conducted under section 71 of CEPA (Environment Canada 2014). See survey for specific inclusions and exclusions (schedules 2 and 3).
b Reporting threshold: a total quantity greater than 100 kg of a substance, at a concentration equal to or above 0.001% by weight (w/w%) (Canada 2013).
5. Uses
The results of a CEPA section 71 industry survey for 2012 included information on uses for 21 phthalates (Environment Canada 2014). No information was available for the other 7 substances.
Canadian uses identified for phthalate substances included in the Phthalate Substance Grouping are summarized in the SOS reports (Environment Canada, Health Canada 2015a,b,c,d). For the additional phthalates, Canadian uses are identified in Tables 5-1, 5-2 and 5-3. Additionally, international uses of phthalates can also be found in the SOS documents (Environment Canada, Health Canada 2015a,b,c,d).
| Major usesb | DBP | BBP | DEHP | DIOP | DEP | 79P |
|---|---|---|---|---|---|---|
| Adhesives and sealants | Y | Y | N | Y | N | Y |
| Paints and coatings | Y | Y | Y | N | N | N |
| Electrical/ electronics | Y | Y | N | N | N | N |
| Building materials | Y | Y | Y | N | N | N |
| Automotive and transportation products | N | Y | Y | N | N | Y |
| Lubricants and greases | N | N | Y | N | N | N |
| Printing inks | Y | Y | N | N | N | N |
| Fabric and textiles | Y | Y | Y | N | N | N |
| Personal care products | N | N | N | N | Y | N |
| Children’s toys and childcare articlesc | Y | Y | Y | N | N | N |
| Plastic and rubber materials | Y | Y | Y | N | Y | N |
Abbreviations: Y = use was reported for this substance; N = use was not reported for this substance.
a Use information for phthalate substances reported to be in commerce in Canada (Environment Canada 2014)
b All information obtained from section 71 industry survey conducted under CEPA (Environment Canada 2014).
c Presence of DBP, BBP, and DEHP in these types of products is currently restricted to ≤1,000 mg/kg (Phthalates Regulations under the Canada Consumer Product Safety Act [Canada 2016]).
| Major usesb | 610P | DnOP | D911P-2 | D911P | DTDP | DIUP |
|---|---|---|---|---|---|---|
| Adhesives and sealants | N | N | Y | N | N | Y |
| Paints and coatings | N | N | N | N | N | N |
| Electrical/ electronics | N | Y | Y | Y | Y | Y |
| Building materials | N | N | N | N | N | N |
| Automotive and transportation products | Y | N | Y | Y | N | Y |
| Lubricants and greases | N | N | N | N | Y | N |
| Printing inks | N | N | N | N | N | N |
| Fabric and textiles | N | N | N | N | N | N |
| Personal care products | N | N | N | N | N | N |
| Children’s toys and childcare articles | N | N | N | N | N | N |
| Plastic and rubber materials | Y | Y | N | Y | N | Y |
Abbreviations: Y = use was reported for this substance; N = use was not reported for this substance.
a Use information for phthalate substances reported to be in commerce in Canada (Environment Canada 2014).
b All information obtained from section 71 industry survey conducted under CEPA (Environment Canada 2014).
| Use | BBP | DBP | DEHPh | DnHP | DIOP |
|---|---|---|---|---|---|
| Food additiveb | N | N | N | N | N |
| Incidental food additiveb | N | N | N | N | N |
| Food packaging materialsb | Y | Y | Y | N | Y |
| Medicinal or non-medicinal ingredients in disinfectant, human or veterinary drug productsc | N | Y | N | N | N |
| Natural Health Products Ingredients Databased | N | Y | N | N | N |
| Licensed Natural Health Products Database being present as a non-medicinal ingredient in natural health products in Canadae | N | Y | N | N | N |
| Notified to be present in cosmetics under the Cosmetic Regulationsf | N | Y | N | N | N |
| Formulant in registered pest control products registered in Canadag | Y | N | N | N | N |
Abbreviations: Y = use was reported for this substance; N = use was not reported for this substance.
a Select additional phthalates are those phthalate substances included in the CRA for human health only.
b September 2014 emails from the Food Directorate (FD), Health Canada (HC) to the Risk Management Bureau (RMB), HC; unreferenced.
c DPD [modified 2014].
d NHPID [modified 2019].
e LNHPD [modified 2019], September 2014 email from the NNHPD, HC, to the RMB, HC; unreferenced.
f July 2015 email from the Consumer Product Safety Directorate (CPSD), HC, to Existing Substances Risk Assessment Bureau (ESRAB), HC; unreferenced.
g April 2012 email from the Pest Management Regulatory Agency (PMRA), HC, to the RMB, HC; unreferenced.
h DEHP is on the List of Prohibited and Restricted Cosmetic Ingredients in Canada (Health Canada [modified 2011a]) and was not reported as used in Canada (July 2015 email from the CPSD, HC to ESRAB, HC; unreferenced).
6. Releases to the environment
There are no known major natural sources of phthalates, and releases to the environment are associated with anthropogenic activities. Releases may occur during the manufacture and processing of phthalates, including transportation and storage, as well as during production, use and disposal of products that contain phthalates (e.g., release of phthalates into wastewater systems from use of cosmetics). Phthalates present in products and manufactured items may be released to the environment as the product or item is degraded by weathering forces such as sunlight and rainfall. Phthalates are not chemically bound to polymer matrices during processing activities and can migrate to the surface of polymer products over time. The rate of this migration is expected to be slow and will be counteracted by chemical and physical attractive forces that work to hold the phthalates within polymers. Given their consumer and industrial applications, releases of phthalates to the environment are expected to occur primarily to air and to water.
Information on releases of phthalates in Canada is limited. Six phthalates (DMP and five of the additional phthalates, i.e., DEP, DBP, BBP, DEHP and DnOP) are reportable to the National Pollutant Release Inventory (NPRI), where all reported releases were to air (NPRI 2010-2014). For the section 71 survey, many submissions indicated no or unknown releases (Environment Canada 2014).
Further discussion on the potential for environmental release is provided in Environment Canada, Health Canada (2015a,b,c,d).
7. Environmental fate and behaviour
7.1 Environmental distribution
The EQC Level III fugacity model (New EQC 2011) was used to predict the environmental mass-fraction distributions of the short-, medium-, and long-chain phthalates. Environmental distribution trends were largely driven by the phthalates’ capacity to solubilize in water, volatilize or adsorb to particles, where smaller more soluble substances tended to be associated with the air and aquatic media, and larger substances with limited water solubility tended to adsorb to sediment or remain in soil. The EQC model results show that the short-chain phthalates distribute into water, soil and air, but not into sediment, the medium-chain phthalates distribute more evenly between water and sediment, and the long-chain phthalates distribute mainly into sediment, with a lesser proportion remaining in water. Soil was predicted to be an important receiving compartment for the medium- and long-chain phthalates (that is, if released to air or soil, the medium- and long-chain phthalates primarily remain in soil). The results from the Level III fugacity modelling showing percent distribution into water, soil and sediment based on simulated release into each compartment are summarized in ECCC (2018).
On the basis of the known uses and releases of phthalates (see Sections 5 and 6), water is considered to be the key receiving environmental compartment of phthalates.
7.2 Environmental persistence
The degradation of phthalates is well-characterized, and phthalates are known to be degraded by abiotic and biotic processes. Numerous studies have been conducted for the short-chain phthalates DMP and DEP, the medium-chain phthalates DIBP, DCHP, BBP, DBP and DEHP, and the long-chain phthalates DIDP, DUP and DINP. Many of these studies have been used to characterize the less-studied phthalates, including the medium-chain phthalates BCHP, CHIBP, DBzP, B79P, DMCHP, BIOP, B84P, 79P, DIOP, DnHP, DPrP and DIHepP, and the long-chain phthalates 610P, D911P, D911P-2, DTDP, DIUP and DnOP. Summaries of degradation studies and QSAR modelling are available in the SOS reports (Environment Canada, Health Canada 2015a,b,c,d) and in ECCC (2018).
Abiotically, phthalates undergo hydrolysis, which tends to be slow, and relatively fast photolysis (Peterson and Staples 2003). It is biodegradation—particularly in aerobic conditions, by micro-organisms, including the green microalgae species (Chang et al. 2005; Yan and Pan 2004; Yan et al. 2002), phytoplankton (Li et al. 2007) and fungi (Ganji et al. 1995; Sivamurthy et al. 1991; Engelhardt et al. 1977; Kim and Lee 2005; Lee et al. 2007; Kim et al. 2002a, 2003, 2007)—that contributes most to the breakdown of these substances in the environment. The observed biodegradation rates vary and are influenced by the molecular size and physicochemical properties of phthalates, substrate concentration and environmental conditions. The (Q)SAR model-generated data are in agreement with the experimental data. The biodegradation of phthalate esters releases monoalkyl phthalate esters (MPEs) into the environment (McConnell 2007). Most studies suggest that biodegradation rates of MPEs may proceed faster than those of the corresponding diester parent phthalates (Peterson and Staples 2003). MPEs were shown to be quickly degraded in natural sediments (Otton et al. 2008).
Studies have demonstrated that phthalates with shorter side-chains can be readily biodegraded and mineralized, whereas phthalates with longer side-chains tend to be somewhat less biodegradable (Wang et al. 2000; Chang et al. 2004; Zeng et al. 2004; Lertsirisopon et al. 2006; Liang et al. 2008). The differences in biodegradability among phthalates are attributed to the steric effects of the side-chains, where binding of hydrolytic enzymes can become hindered, resulting in limited hydrolysis. Differences in phthalate isomers can also influence rates of degradation, as phthalate-hydrolyzing enzymes are structurally specific (Liang et al. 2008).
The short-chain phthalate DMP has a long modelled half-life in air. Its measured concentrations in biota in Hudson’s Bay and in air and water of the Norwegian Arctic indicate that it has some potential for long-range transport (Morin 2003). Medium- and long-chain phthalates are not persistent in air, and modelling results suggest that they are unlikely to have the potential for long-range transport (see Environment Canada, Health Canada 2015a,b,c,d), although DEHP, DBP, DIBP, DnBP, and DINP and the short-chain phthalate DEP can be associated with fine particles in areas close to emission sources (Ma et al. 2014; Ruzicková et al. 2016). DIBP was also found in biota in the Arctic (Morin 2003). Fine particle transport is considered a plausible explanation for the observed presence of DMP and DIBP in remote areas.
Phthalates have been detected in fresh water worldwide and tend to adsorb to sediments (Chang et al. 2005). In surface water, most phthalates are readily biodegradable (Furtmann 1994). In sediments, both aerobic and anaerobic microorganisms can degrade phthalates (Hashizume et al. 2002; Chang et al. 2004; Kim et al. 2008). However, despite their inherent biodegradability, phthalates can exhibit long half-lives in sediments because of the high degree of sorption driven by their hydrophobicity (Kickham et al. 2012). In aerobic biodegradation studies conducted according to the Organisation for Economic Cooperation and Development (OECD) guidelines and where wastewater treatment system sludge is used as substrate, phthalates were found to be both inherently and readily biodegradable (Environment Canada, Health Canada 2015a,b,c,d). The apparent variability in test results can be attributed to the differences in experimental protocols, concentrations of the test substance, and the substrate.
In soil, the patterns for biodegradation rates are generally very similar to those in water (Peterson and Staples 2003). Environmental conditions, such as temperature, soil moisture and oxygen levels, as well as initial substance concentrations and soil type, all have an impact on the biodegradation rate (Peterson and Staples 2003; Madsen et al. 1999; Scheunert et al. 1987). For example, half-lives for DEHP in different types of soil ranged from 2 days in loam soil to 69.3 days in sand (Rüdel et al. 1993; Shanker et al. 1985; Roslev et al. 1998; Peterson and Staples 2003) and were up to 77 days in bioremediated soil from an industrial site in Brazil (Ferreira and Morita 2012).
7.3 Potential for bioaccumulation
Bioaccumulation data for the substances in the Phthalate Substance Grouping and certain additional phthalates that were used for read-across (i.e., BBP and DEHP) are provided in the SOS reports (Environment Canada, Health Canada 2015a,b,c,d). Bioaccumulation data for other additional phthalates or obtained after the SOS reports were published are in agreement with the data presented in the SOS reports and are summarized in ECCC (2018).
Phthalates are bioavailable in the environment and certain phthalates have been measured in biota. The experimental and modelled bioaccumulation data and measurements of phthalate metabolites in aquatic organisms suggest that phthalates are effectively metabolized and thus do not tend to significantly bioaccumulate. Measured bioconcentration factors (BCFs) and bioaccumulation factors (BAFs) for aquatic species range from as low as 1 to over 3000 L/kg, with the majority of the reported values below 1000 L/kg. Biotransformation rates were found to be in the range of less than 1 to 3.5 day-1. Data for sediment- and soil-dwelling organisms were also available for some phthalates and indicated that bioaccumulation in these media is not significant. Field studies confirm that phthalates do not biomagnify in the food chain (summarized in Environment Canada, Health Canada 2015a,b,c,d).
8. Potential to cause ecological harm
8.1 Ecological effects assessment
Detailed summaries of the available effects studies for substances in the Phthalate Substance Grouping and for a number of additional phthalates and the related critical body residue calculations are presented in the SOS reports (Environment Canada, Health Canada 2015a,b,c,d). Results of additional studies, including data from newly available studies for both Grouping substances and additional phthalates, are tabulated in ECCC (2018). Results from toxicity studies on rodents considered as surrogates for piscivorous mammals, such as mink and otters, are presented in Health Canada (2015) and in the Human Health Effects section of this screening assessment. An analysis of the overall ecological effects dataset for phthalates, observations related to their modes of action, and key ecological effects are summarized below. Emphasis is placed on aquatic organisms, given that water is considered to be the key receiving environmental compartment of phthalates. Data on both freshwater and marine organisms are considered collectively, with no distinction made between them, as there is no evidence to indicate that one or the other would have greater sensitivity to phthalates.
At acute exposure levels, phthalates have been shown to act through diester toxicity, which is a non-specific mode of action similar to baseline (non-polar) narcosis and polar narcosis, but resulting in slightly higher toxicity (Veith and Broderius 1987; Veith and Broderius 1990; Adams et al. 1995). The body of data indicates that under longer-term exposures many phthalates also act through specific modes of action (MoAs). These MoAs are well documented in mammalian studies for the medium-chain phthalates, notably androgen-dependent effects affecting development of the male reproductive tract (reviewed in Health Canada 2015). In aquatic organisms, studies with exposures to phthalates of lower chain lengths, i.e., the short- and a number of medium-chain phthalates, show an array of apical and non-apical effects. Non-apical effects have been linked to estrogen and thyroid-mediated cellular pathways; however, the androgen-dependent responses have not been extensively studied in non-mammalian organisms. Other non-apical responses for critical cellular pathways implicated in normal growth, development and reproduction, such as those associated with antioxidant and cellular stress response, energy metabolism, and cellular detoxification mechanisms have been identified for certain short- and medium-chain phthalates, as well as the long-chain phthalates DINP, DIDP and DnOP (see section 8.1.1 and ECCC 2018). It is noted that for certain well-studied phthalates (e.g., BBP, DBP, DEHP) there is often variability or inconsistency among studies and model results in the observed effects or responses, such as changes in vitellogenin (VTG) levels or model estimates of receptor binding affinities. While this is likely due to factors such as the species and life stage considered, as well as differences in test design and study conditions, it makes it a challenge to elucidate the precise MoA(s) underlying the observed effects.
8.1.1 Toxicity to aquatic organisms
Water solubility and log Kow are important parameters that affect bioavailability of a substance in environmental media, thereby influencing its toxicity. Substances with very low water solubilities are likely to be less bioavailable in the environment through direct water uptake, with more likely exposure through the diet. For example, a decreasing trend in toxicity was reported for the phthalates DMP, DEP, DBP, BBP, DnOP and DIOP in acute toxicity testing with the bacterium, Vibrio qinghaiensis sp.-Q67 (Ding et al. 2017). The researchers correlated the observed decrease in toxicity with increased hydrophobicity (log Kow) and hypothesized that in addition to greater hydrophobicity, the larger molecular volume associated with increasing alkyl side chain length may also contribute to decreasing acute toxicity due to reduced uptake potential across cell membranes. Log Kow can be an important parameter in predicting acute toxicity for many MoAs, e.g., non-polar narcosis, polar narcosis, ester narcosis, but not for others characterized by reactive mechanisms, including electrophile MoAs.
Interestingly, log Kow was also observed to correlate with a receptor-based MoA, i.e., estrogen receptor (ER) binding affinity. For a series of industrial chemicals including phthalates, the binding affinity to rainbow trout ER was found to increase linearly with log Kow values in the range of 1.6 to 4.6 (DMP to DBP and BBP) and to remain nearly constant at greater lipophilicity, as seen for DnHP with a log Kow of 6.6 (Hornung et al. 2014). Phthalates with higher log Kow (e.g., DEHP, DnOP) did not bind to the ER. For long-chain phthalates, which are characterized by very low water solubilities and high log Kow values, diester toxicity seems to be the prevalent acute mode of action. It has been suggested that phthalates with alkyl chains of six or more carbons may be less likely to cause intrinsic toxicity to aquatic organisms as their rapid metabolism and low water solubility prevent the critical toxicity body burden from being reached (Bradlee and Thomas 2003). Indeed, for many of the phthalates with carbon backbones of 8 or more carbons, acute effects have only rarely been reported below solubility limits, and the calculated tissue residues were low, not exceeding thresholds for lethal effects (see Table 8-3). However, high toxicities have been noted for the poorly soluble medium-chain phthalates with backbones of 6 or 7 carbons, e.g., DEHP (summarized in Environment Canada, Health Canada 2015b; ECCC 2018).
An analysis of the available effects data for aquatic organisms was conducted for each phthalate. A simplified schematic is presented in Table 8-1, where data availability is noted for each substance from
Large data gaps were found in ecological effects information for phthalates, even though certain phthalates, such as DEHP, BBP and DBP, have been relatively well studied. Of particular importance is the lack of studies characterizing the relative potency of phthalates across the subgroups. The few studies that look at effects in the same biological system include only a small subset of phthalates, and since different endpoints are characterized, a direct comparison is not possible. Mankidy et al. (2013) observed that DEHP was more potent than BBP, on the basis of potency as an agonist of the aryl hydrocarbon receptor (AhR), whereas Zhou et al. (2011a) established a potency order of DBP>DEP>DMP>DnOP>DEHP based on abalone metamorphosis. Gardner et al. (2016) reported enhanced toxicity with increasing alkyl chain length for developing frog embryos exposed to three shorter chain phthalates, with DBP (four carbons in alkyl chain) exhibiting greater toxicity than DPrP (three carbons in alkyl chain), and DEP (two carbons in alkyl chain) being the least toxic. Teratogenic risk did not change markedly with alkyl chain length, with only DBP determined to be teratogenic at the concentrations tested (Gardner et al. 2016). A similar trend with alkyl chain length was observed for growth inhibition in the dinoflagellate, Karenia brevis. Phthalates with alkyl side chains containing less than six carbons significantly inhibited growth in the algae, with toxicity increasing with increasing side chain length, i.e. for toxicity, BBP>DIBP>DBP>DEP (Liu et al. 2016a). Phthalates with side chains containing more than six carbons (DEHP, DINP, DIDP) did not inhibit algal cell growth, an effect attributed to their low water solubility. As well, DMP showed no adverse effects, possibly due to algal degradation of DMP (Yan et al. 1995; Liu et al. 2016a).
Another limitation found in many studies is the tendency to conduct them at exposure concentrations that are high or that exceed water solubility limits, which makes interpretation of results complicated and the results of lesser relevance to environmental conditions. It is noted that in the few
| Substance (CAS RN) | Standard tests for apical effects | Estrogen-mediated pathways | Androgen-mediated pathways | Thyroid-mediated pathways |
|---|---|---|---|---|
| DMP | Y/N | Y/N | N |
Y |
| DEP | Y | Y | Y | - |
| DPrP | Y | Y | - |
- |
| DIBP | - |
- |
- |
- |
| DBP | Y | Y | Y | Y |
| CHIBP | - |
- |
- |
- |
| BCHP | - |
- |
- |
- |
| BBP | Y | Y | Y | Y |
| DCHP | Y | Y | Y | Y |
| DnHP | - |
Y | - |
- |
| DBzP | - |
- |
- |
- |
| B79P | Y | - |
Y | - |
| DMCHP | - | - |
- | - |
| DIHepP | - |
- |
- |
N |
| 79P | - |
- |
- |
- |
| BIOP | - |
- |
- |
- |
| DIOP | N | - |
- |
- |
| DEHP | Y | Y/N | Y | Y |
| DINP | N | Y/N | Y | - |
| B84P | - |
- |
- |
- |
| 610P | - |
- |
- |
- |
| DnOP | Y | Y/N | - |
Y |
| D911P | - |
- |
- |
- |
| D911P-2 | - |
- |
- |
- |
| DIDP | N | Y/N | Y | - |
| DIUP | - |
- |
- |
- |
| DTDP | - |
- |
- | - |
| DUP | - |
- |
- |
- |
Abbreviations: Y, data available showing effects; N, data available showing no effects; Y/N, conflicting data; ̶ ,data were not identified.
a Some studies on phthalates were conducted at high exposure concentrations, and above the water solubility limit of the tested phthalate.
| Substance (CAS RN) | Rainbow trout ER binding (parent) (ER Expert System v3) | Rainbow trout ER binding (metabolite) (ER Expert System v3) | Rodent ER binding (parent) (TIMES 2014) | Rodent ER binding (metabolite) (TIMES 2014) | Rodent AR binding (parent) (TIMES 2014) |
|---|---|---|---|---|---|
| DMP | Y | No metabolites predicted | N | N | N |
| DEP | Y | N | Y | N | N |
| DPrP | Y | N | N | N | Y |
| DIBP | Y | N | N | N | Y |
| DBP | Y | N | Y | N | Y |
| CHIBP | Y | N | n/a | n/a | n/a |
| BCHP | Y | N | Y | Y | n/a |
| BBP | Y | N | Y | N | Y |
| DCHP | Y | N | Y | Y | n/a |
| DnHP | Y | N | Y | N | N |
| DBzP | Y | N | Y | N | N |
| B79P | n/a | N | Y | Y | N |
| DMCHP | n/a | N | Y | n/a | n/a |
| DIHepP | n/a | N | Y | Y | N |
| 79P | N | N | N | N | N |
| BIOP | n/a | N | n/a | n/a | n/a |
| DIOP | N | N | Y | Y | N |
| DEHP | N | N | Y | Y | N |
| DINP | N | N | N | Y | Y |
| B84P | n/a | N | n/a | n/a | n/a |
| 610P | N | N | N | N | n/a |
| DnOP | N | N | N | N | N |
| D911P | N | N | N | Y | n/a |
| D911P-2 | N | N | N | Y | n/a |
| DIDP | N | N | N | N | n/a |
| DIUP | N | N | N | Y | n/a |
| DTDP | N | N | N | N | n/a |
| DUP | N | N | N | Y | n/a |
Abbreviations: Y, receptor binder; N, receptor non-binder; n/a, result not available or substance was outside of the model domain.
Below is a brief summary of some of the available effects data for the short-, medium-, and long-chain phthalates that describes both standard studies and those describing specific MoAs. It is meant to highlight effect levels across phthalate subgroups, as observed based on standard and non-standard testing. Available ecological effects information has been previously summarized in detail in Environment Canada, Health Canada (2015a,b,c,d), and additional and newly published studies are noted in ECCC (2018).
Standard toxicity testing indicates that, in general, the soluble short-chain phthalates have low acute and chronic toxicity to fish, invertebrates, and algae, likely due to factors such as low hydrophobicity, high degradability and metabolic potential. For DMP and DEP, fish acute median lethal concentration (LC50) values were in the range of 10 to 120 mg/L (summarized in ECCC 2018). Similarly, LC50 values and median effective concentration (EC50) values for effects such as immobility and changes in biomass, on mysid shrimp, daphnids and algae were noted at exposure concentrations generally greater than 10 mg/L (summarized in Environment Canada, Health Canada 2015a; ECCC 2018). In contrast, studies with abalone suggest that this species is particularly sensitive to DMP and DEP exposure, with adverse effects established through modes of action other than narcosis. For DMP, effects on larval settlement were noted at an exposure concentration of 0.05 mg/L (Yang et al. 2009), and a no observed effect concentration (NOEC) for metamorphosis was determined as 0.02 mg/L, with a 50% reduction in metamorphosis at 0.2 mg/L (Liu et al. 2009). In terms of reproductive effects, DMP-treated abalone sperm were found to exhibit dose-dependent decreases in fertilization efficiency, morphogenesis and hatchability at exposure concentrations between 0.01 mg/L and 0.1 mg/L (Zhou et al. 2011b). Reduced sperm ATPase activities and alterations to the expression patterns of physiologically-regulated genes such as cyp3a, 17β-hsd 11 and 17β-hsd 12 were also observed and were considered to have contributed to the observed effects on fertilization and embryogenesis (Zhou et al. 2011b). At an exposure concentration of 0.2 mg/L, DEP was found to reduce metamorphosis rates, and at 2 mg/L it resulted in increased abnormality rates of abalone embryos and reduced hatching rates (Zhou et al. 2011a). Several possible toxicological mechanisms were proposed for the action of phthalates on the embryos, including affecting activity of the Na+-K+ pump and/or Ca2+-Mg2+ pump, altering the peroxidase level and subsequent malondialdehyde production, damaging extra-embryonic membrane structure, as well as altering the expression of several endocrine-related genes (gpx, cyp3a, and 17β-hsd 12). The researchers concluded that the five phthalates tested (DEP, DBP, DMP, DEHP and dioctyl phthalate or DOP) affected the embryonic ontogeny of abalone by interfering with osmoregulation, inducing oxidative stress, damaging embryo envelope structure, and disrupting physiological homeostasis (Zhou et al. 2011a). A recent study by Mathieu-Denoncourt et al. (2016) reported delayed development and increased frequency of malformations in tadpoles of Western clawed frog exposed to lowest DMP concentrations of 0.1 mg/L, indicating that some early life stage amphibians may also be sensitive to short-chain phthalates exposure.
For the medium-chain phthalates, moderate to high toxicity has been observed in numerous studies with aquatic organisms (summarized in Environment Canada, Health Canada 2015b; ECCC 2018). Results indicate that those with side-chain backbones of six or fewer carbons—i.e., DBP, BBP, DCHP and DEHP—are highly hazardous to fish, invertebrates, and algae, where LC50 and effects such as behavioral abnormalities in fish, reproductive effects in daphnids, and effects on biomass in algae were observed at an exposure concentration of less than 1 mg/L. Secondary effects linked to estrogenic, thyroid-, or anti-androgenic modes of action are also relatively well documented for these substances, although inconsistent responses have been observed for alteration of VTG levels in studies with BBP and DEHP. BBP was shown to displace estradiol from the hepatic estrogen receptor, to inhibit ER binding, to either alter VTG production in rainbow trout following intra-peritoneal injection (Christiansen et al. 2000) or to have no impact on VTG levels in studies with fathead minnow (Study Submission 2014d; Harries et al. 2000), to impact gonadal histology (Study Submission 2014d) and to reduce spermatogonia of fathead minnows (EC 2009; ECHA c2007-2015). BBP also exhibited a small but significant increase in the expression of mRNA of the androgen receptor in developing fish embryos (Mankidy et al. 2013) and has been linked with developmental toxicity and cardiac defects in zebrafish embryos (Sun and Liu 2017). A recent study using larval midge, Chironomus riparius, demonstrated significant downregulation of genes associated with ribosome synthesis following exposure to very low concentrations (1 × 10⁻⁶ mg/L) of BBP, indicating potential for impairment of biogenesis pathways for genes essential to cell metabolism and cellular protein synthesis (Herrero et al. 2016).
Most toxicity studies for DCHP in fish, amphibians, invertebrates and algae were conducted at exposure concentrations that approach or exceed the substance’s reported water solubility limit of 1 mg/L (ECHA c2007–2014b; Mathieu-Denoncourt et al. 2016). Two Daphnia studies, within the water solubility limit for DCHP, showed effects at low exposure concentrations, but only with chronic exposure (21-day EC50 and NOEC for loss of mobility at 0.68 and 0.18 mg/L, respectively) (ECHA c2007–2014b). Mathieu-Denoncourt et al. (2016) reported increased mortality, increased frequency of malformations, and significant up-regulation of cellular stress-related messenger-RNA (mRNA) in larval Western clawed frog, Silurana tropicalis, at a lowest exposure concentration of 4.1 mg/L DCHP. While this concentration slightly exceeds the 1 mg/L solubility value, the use of solvent (DMSO) may have slightly altered the substance solubility such that the reported measured concentration of 4.1 mg/L can be considered to fall within a reasonable range of the solubility value. For DBP, 96-hour LC50s of less than 1 mg/L to 7.3 mg/L in fish were determined (Buccafusco et al. 1981; Mayer and Ellersieck 1986; CMA 1984; Hudson et al. 1981; Adams et al. 1995). DBP did not induce VTG in rainbow trout or zebrafish at concentrations up to 1 mg/L (Van den Belt et al. 2003). DBP exposure concentrations in the range of 0.005 to 0.5 mg/L in different studies increased larval mortality and teratogenicity (Ortiz-Zarragitia et al. 2006), increased activity of anti-oxidant enzymes and immune-related enzymes (Xu et al. 2013), and altered plasma 11-ketotestosterone and spiggin levels (Aoki 2010; Aoki et al. 2011).
For DEHP, Carnevali et al. (2010) found a significant reduction in fecundity of female zebrafish exposed to nominal concentrations ranging from 2 × 10‑5 to 0.40 mg/L. Corradetti et al. (2013) also found that exposure to DEHP at a concentration of 2 × 10⁻⁴ mg/L impaired reproduction in zebrafish by inducing a number of changes, including reduced embryo production. Histological changes in fish spermatozoa and gonads (indication of intersex) and retardation of oocyte development following exposure to DEHP have also been reported (Ye et al. 2014; Kim et al. 2002b; Norman et al. 2007). DEHP significantly altered pericardial, head and yolk morphology in embryonic zebrafish exposed to 0.002 mg/L from 3 to 24 hours post fertilization (hpf) (Kinch et al. 2016). The effects were less marked in fish exposed from 3 to 48 hpf or 3 to 72 hpf, indicating a window of exposure sensitivity from 3 to 24 hpf for overall contaminant-induced changes to morphological development and from 3 to 48 hpf for pericardial and head development. In addition to exposure time and life stage specificity, tissue specificity was also evident in the study results. Changes to head morphology following DEHP exposure did not differ significantly from those of thyroid hormone, suggesting that the effects of DEHP on head morphology may in large part be transduced by interaction with thyroid hormone receptors (Kinch et al. 2016). Embryonic marine medaka exposed to 0.1 and 1 mg/L DEHP for up to 10 days post fertilization exhibited significant and concentration-dependent induction of two major endocrine-responsive genes (ER, PPAR), as well as genes associated with detoxification mechanisms in the body (CYP19) (Ye et al. 2016). The induction effects were attributed to bioaccumulation of DEHP in the fish and were no longer evident after a 12-day depuration period in clean sea water. The time-dependent increase of DEHP burdens during embryonic stages and subsequent decrease of these burdens in larval stages emphasized the importance of metabolism in the elimination of accumulated DEHP. Metabolic ability is more developed in larval fish as compared with earlier developmental stages such as the embryo, thereby facilitating removal of DEHP from the body (Ye et al. 2016).
Liu et al. (2016b) derived Predicted No-Effect Concentrations (PNECs) for DEHP in aquatic species using Species Sensitivity Distributions (SSDs) for endpoints of survival, growth and development, biochemical and molecular biology, reproduction (combined vertebrate and invertebrate data), fish reproduction, and invertebrate reproduction. Chronic PNECs based on potencies to cause lesions in the reproductive tissues of fish ranged from 0.04 to 0.20 µg/L and were significantly less than PNECs derived for other endpoints and taxa, such as invertebrates. The results demonstrated that reproduction was the most sensitive endpoint to DEHP, especially for reproductive toxicity in fish (Liu et al. 2016b).
A review of ecotoxicity data for B79P was conducted following receipt of new compositional information for this UVCB phthalate. A 96h LC50 of >1000 mg/L for rainbow trout, Oncorhynchus mykiss, is reported in the ECHA (c2007-2018) dossier for B79P, as well as a 48h EC50 of 4.5 mg/L for the water flea, Daphnia magna. However, clumping of the Daphnia was observed at lower concentrations of 1.0 and 1.8 mg/L (ECHA c2007-2018) and, for this reason, the results of this study are not considered suitable for inclusion in this screening risk assessment. The B79P ECHA dossier includes toxicity data for a commercial formulation of B84P (CAS RN 16883-83-3) as supporting information based on a reported close structural similarity of this formulation to that of B79P (ECHA c2007-2018). Two acute fish studies and one acute algal study are available for B84P, with median effect (L/EC50) values of >1000 mg/L for all three studies (ECHA c2007-2018). The combined results suggest that B79P will have low potential for acute adverse effects in aquatic organisms. It should be noted, however, that the B79P toxicity studies were conducted in 1980, while those of B84P were conducted in 1979. The age of the studies introduces uncertainty into the results, as it is not clear how well the formulations used in testing represent those currently in use.
The ECOSAR model (v1.11; ECOSAR 2012) of EPI Suite (c2000-2012), run with user-input physical-chemical valuesFootnote 3 , predicts that B79P will have no acute aquatic effects at substance saturation, supporting the empirical data provided in ECHA (c2007-2018). However, modelled chronic values (ChV) of 0.003 to 0.044 mg/L, 0.007 to 0.028 mg/L and 0.035 to 0.066 mg/L were obtained for fish, daphnia and green algae, respectively, suggesting that chronic effects are possible (ECOSAR 2012).
A 2017 ECHA decision report published after the addition of B79P to the European Union’s Community rolling action plan (CoRAP) list describes further evidence of the potential for chronic effects. The decision report identified several concerns associated with the exposure of mammalian test species to B79P, including the potential for developmental and reproductive effects and evidence for possible endocrine and/or thyroid mediated modes of action (ECHA 2017). These concerns applied not only to B79P, but also to several potential metabolites of B79P that are also known to be metabolites of BBP (CAS RN 85-68-7) and DINP (CAS RNs 68515-48-0 and 28553-12-0), two phthalates with a recognized anti-androgenic mode of action (ECHA 2013, 2017). The results of
The available aquatic effects data for the medium- and long-chain phthalates with very low water solubilities and high log Kow values—i.e., DIHepP, B79P, DINP, D911P, D911P-2, DIDP, DIUP, DTDP, DUP, B84P and DIOP—were above water solubility limits. It is noted that for these substances, dietary exposure is likely the more relevant route of uptake in the environment. Therefore, for DIHepP, B79PFootnote 4 , B84P, DINP, DIDP and DUP, tissue residues (TRs) were calculated using substance-specific bioaccumulation factors (BAFs), molecular weights and water solubilities. The TR represents the internal whole body concentration of a phthalate resulting from exposure at its limit of solubility in water, taking into account its toxicokinetics as approximated by the BAF. The calculated TR values for medium-chain phthalates ranged from 5.4 × 10⁻³ mmol/kg (1.96 mg/kg) for DIHepP to 0.13 mmol/kg (59.1 mg/kg) for B84P and were low for the long-chain phthalates DINP at 2.6 × 10⁻⁴ mmol/kg (0.12 mg/kg), DIDP at 1.5 × 10⁻⁵ mmol/kg (0.007 mg/kg), and DUP at 5.8 × 10⁻⁸ mmol/kg (0.000028 mg/kg). Critical body residues (CBR) associated with acutely lethal baseline narcosis in small aquatic organisms typically range from about 2 to 8 mmol/kg, while those for chronic exposures range from 0.2 to 0.8 mmol/kg (McCarty and Mackay 1993). The calculated internal concentrations for the subset of the medium-chain and long-chain phthalates indicate that these phthalates are unlikely to reach levels sufficient to cause acute or chronic lethal effects toxicity in aquatic organisms, as the CBR thresholds are not surpassed. It is noted that CBR thresholds have not been developed for other modes of action including diester toxicity, and baseline narcosis is therefore assumed for those phthalates with TR calculations. It is recognized that somewhat lower CBR thresholds may be associated with other MoA(s), and thus baseline narcosis MoA may underestimate the potential toxicity, particularly under chronic exposure. Nonetheless, an overlap between CBRs for narcosis and diester toxicity is expected; accordingly, the narcosis CBR is considered appropriate for use with phthalates.
8.1.1.1 Predicted no-effect concentrations for the aquatic compartment
When experimental data were not available, modelled and analogue data were used to select critical toxicity values for the short- and medium-chain phthalates (summarized in Environment Canada, Health Canada 2015a,b). Predicted no-effect concentrations (PNECs), obtained by dividing critical toxicity values (CTVs) by the appropriate assessment factors (AFs), were then calculated and ranged from 0.00007 mg/L (DEHP) to 0.19 mg/L (DIBP). The CTVs, AFs and calculated PNECs for each phthalate are presented in Table 8-3. When PNECs could not be derived, TR to CBR comparisons were made. PNECs for the additional phthalates, which are not being assessed, ranged from 0.003 mg/L to 0.33 mg/L and can be found in ECCC (2018).
| Substance (CAS RN) | CTV (mg/L) | Species; Effect level | Reference | AFa | PNEC (mg/L) [converted to mmol/Lb] |
|---|---|---|---|---|---|
| DMP (131-11-3) | 0.01 | Abalone; 1-h LOEC (fertilization rate and hatching success) | Zhou et al. 2011b | 10 | 0.001 [5.1x10⁻⁶] |
| DIBP (84-69-5) | 0.56 | Daphnia; 21-d NOEC | ECHA c2007–2014a | 3 | 0.19 [6.8x10⁻⁴] |
| CHIBP (5334-09-8) | 0.018c | Fathead minnow; 126-d LOEC (increase in spermatogonia) | Study Submission 2014b; EC 2009 | 3 | 0.006 [2.0x10⁻⁵] |
| BCHP (84-64-0) | 0.018c | Fathead minnow; 126-d LOEC (increase in spermatogonia) | Study Submission 2014b; EC 2009 | 3 | 0.006 [2.0x10⁻⁵] |
| DCHP (84-61-7) | 0.181 | Daphnia 21-d NOEC (loss of mobility) | ECHA c2007–2014b | 3 | 0.06 [1.8 x10⁻⁴] |
| DBzP (523-31-9) | 0.08 | Fathead minnow; 96-h LC50 | Geiger et al. 1985 | 30 | 0.003 [8.6 × 10⁻⁶] |
| B79P (68515-40-2) | No effects observed below solubility limits | ‒ | ‒ | ‒ | PNEC not derived; TR for fish calculated as 0.03 mmol/kg |
| DMCHP (27987-25-3) | 0.181 | Green algae; 72-h EC50 (biomass increase) | ECHA c2007-2014b | 3 | 0.06 [1.7 × 10⁻⁴] |
| DIHepP (71888-89-6) | No effects observed below solubility limits | ‒ | ‒ | ‒ | PNEC not derived; TR for fish calculated as 5.39 × 10⁻³ mmol/kg |
| BIOP (27215-22-1) | 0.032 | Green algae; 96-h EC60 | ECOSAR v1.0 | 10 | 0.0032 [8.7 × 10⁻⁶] |
| DEHP (117-81-7) | 0.0002d | Zebrafish; 21-d EC90 (reduced embryo production) | Corradetti et al. 2013 | 3 | 0.00007 [1.7 × 10⁻⁷] |
| DINP (68515-48-0 / 28553-12-0) | No effects observed below solubility limits | ‒ | ‒ | ‒ | PNEC not derived; TR for fish calculated as 2.6 × 10⁻⁴ mmol/kg |
| B84P (16883-83-3) | No effects observed below solubility limits | ‒ | ‒ | ‒ | PNEC not derived; TR for fish calculated as 0.1 mmol/kg |
| DIDP (26761-40-0 / 68515-49-1) | No effects observed below solubility limits | ‒ | ‒ | ‒ | PNEC not derived; TR for fish calculated as 1.5 × 10⁻⁵ mmol/kg |
| DUP (3648-20-2) | No effects observed below solubility limits | ‒ | ‒ | ‒ | PNEC not derived; TR for fish calculated as 5.8 × 10⁻⁸ mmol/kg |
Abbreviations: AF, assessment factor; TR, tissue residue; CTV, critical toxicity value; d, day; EC, effect concentration; h, hour; LOEC, lowest observed effect concentration; PNEC, predicted no-effect concentration; NOEC; no observed effect concentration; ‒, not applicable.
a Assessment factors in the range of 3 to 30 were applied to the critical toxicity values, on the basis of the duration of exposure period (acute or chronic), the overall robustness of the available dataset (considering factors such as the variety and sensitivity of tested species, quality and number of endpoints), and extrapolating to inter/intra species variation, short- to long-term effects, and high- to low-level effects.
b To facilitate comparison between PNECs and the calculated TRs, units in mg/L were converted to mmol/L (by dividing the substance’s PNEC by its molecular weight).
c This CTV is based on data for BBP; see Environment Canada, Health Canada (2015b) for read-across rationale.
d Carnevali et al. 2010 reported a lower toxicity value for DEHP for reduced fecundity in zebrafish, but this was not used as the CTV because of the lack of appropriate statistical analysis.
8.1.2 Toxicity to sediment-dwelling organisms
Sediment toxicity data are very limited for phthalates. Data for the short-chain phthalate DEP indicate low toxicity. Data for the medium-chain phthalates DBP and DEHP also indicate low toxicity (Call et al. 2001b; Brown et al. 1996). BBP, however, was found to be highly toxic to sediment-dwelling organisms (in water exposure studies) (Call et al. 2001a). For those medium-chain phthalates where PNECs in sediment could be calculated, they ranged from 14.8 mg/kg dw (DCHP) to 97.8 mg/kg dw (DMCHP), and were well below the calculated values for maximum saturation in sediment (where maximum saturation in sediment was calculated using the substance’s water solubility, organic carbon-water partition coefficient (Koc), and a default value of 0.04 for Canadian sediment organic carbon content). Tissue residue calculations were done for those medium-chain phthalates where effects data were above water solubility limits or not available. The highest calculated tissue residue in sediment-dwelling organisms was for DIHepP at 0.05 mmol/kg, which indicates that internal concentrations for medium-chain phthalates are unlikely to reach levels sufficient to cause acute or chronic lethal effects. In sediment toxicity studies for the long-chain phthalates, no adverse effects were observed up to the highest concentrations tested, even including those concentrations which exceeded maximum saturation limits for the substances under the study conditions. The calculated maximum tissue residue for DIDP, for example, was 0.008 mmol/kg, which is below levels sufficient to cause acute or chronic toxicity by narcosis MoA.
8.1.3 Toxicity to soil-dwelling organisms
Limited soil toxicity studies available for some short-chain phthalates (e.g., DMP) and medium-chain phthalates (e.g., BBP) indicate that these phthalates are not highly toxic to soil-dwelling organisms (Environment Canada, Health Canada 2015a,b; ECCC 2018). For the long-chain phthalates, CBR analyses for DINP and DIDP indicated that, up to soil saturation limits, internal concentrations of these substances are unlikely to reach levels sufficient to cause adverse effects (summarized in Environment Canada, Health Canada 2015c,d).
8.1.4 Toxicity to wildlife
Exposure of wildlife to short-chain phthalates via inhalation was evaluated, as these substances have a relatively high residence time in air (summarized in Environment Canada, Health Canada 2015e). An inhalation study for rats exposed to DEP (SCCNFP 2002) was used to derive a PNEC of 49 mg/m3.
Toxicity of phthalates to wildlife via food web exposure was not assessed quantitatively. Studies on secondary poisoning of wildlife were not found in the literature. Also, as noted previously in this report, phthalates are rapidly biotransformed in vertebrates and have low bioaccumulation and biomagnification potential. Therefore, exposure through the food web is not expected to pose a concern.
8.2 Ecological exposure assessment
Phthalates have been measured in all environmental media including air, water, sediment, soil and biota in Canada and worldwide. Measured concentrations for the Phthalate Substance Grouping were presented in the SOS reports (Environment Canada, Health Canada 2015a,b,c,d). Measured concentrations for the additional phthalates in Canadian environmental media, as well as new Canadian data for the Grouping phthalates, are summarized in ECCC (2018).
Pelletier et al. (2016) reported concentrations of 12 phthalates in Canadian surface sediment, sediment cores, and suspended sediment samples collected from locations in Atlantic Canada, Quebec, Ontario and British Columbia (BC) over the period 2013 to 2015. Samples were analyzed for five phthalates in the Phthalate Substance Grouping (DMP, DIBP, DCHP, DBzP and DINP) and seven of the additional phthalates (DEP, DPrP, DBP, BBP, DnHP, DEHP and DnOP). DPrP was not detected in any of the 208 samples collected (detection limit 0.2 ng/g dw), while DCHP was found in only three samples of Ontario surface sediment (concentration range 6.3 to 20 ng/g dw, detection limit 0.9 ng/g dw) and DnHP was present in three samples of surface sediment (Ontario and BC) and one suspended sediment sample (Quebec) at concentrations of 4.8 to 11 ng/g dw (detection limit 0.3 to 5 ng/g dw). Highest concentrations were measured for DEHP, which was also the only phthalate to be detected in all 208 samples. Maximum concentrations reported for DEHP were 8900 (Ontario surface sediment), 12 000 (BC surface sediment) and 6000 ng/g dw (Quebec suspended sediment, detection limit 1.0 ng/g dw). Data for all 12 phthalates are provided in ECCC (2018).
Low concentrations of DIBP, DEP and DBP were measured in five of 100 samples of lake trout, Salvelinus namaycush, collected in 2014 from locations in the Yukon and Ontario (McGoldrick et al. 2016). Fish tissues were analyzed for four phthalates in the Phthalate Substance Grouping (DMP, DIBP, DCHP and DBzP) and six additional phthalates (DEP, DBP, BBP, DnHP, DEHP and DnOP). Concentrations of 2.9 and 4.4 ng/g ww, 10.4 and 25.3 ng/g ww, and 39.1 ng/g ww were measured for DIBP, DEP, and DBP, respectively. The same study analyzed tissues from walleye, Sander vitreous, collected in 2014 from sites in Quebec, Ontario and Manitoba. Concentrations in the 20 samples were below detection limits for all phthalates (range of detection limits was 13 to 112 ng/g ww for both species). Data from the study are provided in ECCC (2018).
Information on phthalate concentrations in wastewater in Canada was obtained through a sampling campaign carried out by ECCC’s Monitoring and Surveillance Program for the years 2014 to 2017. Samples of influent and effluent of on-site wastewater treatment systems at 5 industrial facilities involved in the manufacture or use of phthalates were collected and analyzed, along with samples of influent and effluent of the off-site wastewater treatment systems (WWTS)Footnote 5 to which the industrial sites direct their effluents. In addition to these 5 industrial sites and corresponding WWTS, the influents and effluents of 21 other Canadian WWTS were sampled and analyzed, bringing the total number of WWTS sampled over this four-year period to 31 (personal communication; unpublished environmental surveillance data received in 2015 and 2018 by Ecological Assessment Division, ECCC, from Aquatic Contaminants Research Division, ECCC; unreferenced). Predicted environmental concentrations (PECs) in receiving waters near the WWTS discharge point were derived using effluent data from the off-site WWTS, while industrial on-site WWTS effluent data were used to inform potential phthalate sources as well as to estimate emission rates for similar types of facilities that were not monitored in the Monitoring and Surveillance Program. Detection limits ranged from 0.002 µg/L to 21 μg/L for individual phthalates. Removal efficiencies for industrial facilities with on-site treatment were greater than 50%, with half being greater than 90% and the lowest being less than 6%. Phthalate removal efficiencies at off-site WWTS ranged from 10 to 99% with 75% of WWTS having removal efficiencies of greater than 50%
Surface water PECs were calculated using the following equation:
where
PEC: predicted environmental concentration in the receiving water body, µg/L
Ceff: phthalate concentration in the WWTS effluent, µg/L
DF: receiving water dilution factor (ratio of the WWTS effluent flow to the flow of the receiving water body), dimensionless.
In the risk quotient approach,Footnote 6 the 10th percentile flow of the receiving water body was used to calculate the DF. A 10th percentile flow is used to represent conditions during approximately the lowest flow over 30-day periods, which are equivalent to typical chronic toxicity test durations. The 30-day low flows are expected and assumed to occur consecutively (summer). The resulting environmental concentrations are then compared directly to an effects concentration. Additionally, to estimate concentrations of phthalates near the point of release (near-field), the DF was limited to 10.
Taking into account the longer period of time required for phthalates to accumulate in an organism’s tissues, the DF for the cumulative approachFootnote 7 was calculated using the 50th percentile flow of the receiving water body. The 50th percentile flow is used as it is deemed to more appropriately reflect the average environmental concentrations that would lead to accumulation in the organism’s tissues. The use of this longer averaging period is also considered more appropriate for cumulative effects, as the highest concentrations of phthalates (used in the cumulative approach) occur at different times and locations. Short-term releases of aggregated quantities of phthalates are not expected to occur. In the case of the cumulative approach, no limit to the DF was set because the cumulative approach is not restricted to the area (near-field) where the release occurs.
PECs for industrial users and manufacturers of phthalates that were not covered by the sampling campaign were calculated using emission factors obtained from similar industrial sites where monitoring data were available. Removal rates for on-site or off-site WWTS that were not sampled were also estimated using the monitoring data for WWTS with similar types of treatment. In these cases, PECs were calculated using the following equation:
where
PEC: predicted environmental concentration in the receiving waterbody, µg/L
Q: total yearly quantity of substance manufactured or used at an industrial site, kg/yr-site
C: conversion factor from kg to µg, 1x10⁹ µg/kg
E: emission factors, fraction
R: WWTS removal rate, fraction
N: number of annual release days, d/yr
F: effluent flow, L/d
DF: receiving water dilution factor (ratio of the WWTS effluent flow to the flow of the receiving water body), dimensionless.
In the risk quotient approach, the 10th percentile flow of the receiving water body was used to calculate the DF. To estimate concentrations of phthalates near the point of release (near-field), the DF was limited to 10. Taking into account the longer period of time required for phthalates to accumulate in an organism’s tissues, the DF for the cumulative approach was calculated using the 50th percentile flow. Also, no limit to the DF was set because the cumulative approach is not restricted to the area (near-field) where the release occurs.
Table 8-4 shows the ranges of near-field PECs developed from the monitoring and modelling discussed above. Approximately 1500 PECs have been generated this way. Of the quantities manufactured or used that were reported under the s.71 survey for 2012, 95% have been accounted for by the monitoring and modelling. The remaining 5% are small volume uses and uses that are not expected to lead to significant aquatic release. The four substances with the highest PECs were DIDP (11.5 µg/L), DINP (3.4 µg/L), DEP (2.9 µg/L) and DCHP (2.8 µg/L).
| Substance (CAS RN) | Range PECs (µg/L) | Detection limit range (µg/L) | Frequency of detection in WWTS influentsa | Frequency of detection in WWTS effluentsa |
|---|---|---|---|---|
| DMP (131-11-3) | 5.0 × 10⁻⁴–0.40 | 1.0 × 10⁻²–0.71 | 140 / 302 | 107 / 301 |
| DEP (84-66-2) | ND–2.9 | 0.00–3.1 | 232 / 302 | 119 / 301 |
| DPrP (131-16-8) | 8.0 × 10⁻⁴–0.05 | 0.00–0.09 | 86 / 302 | 65 / 301 |
| DIBP (84-69-5) | 3.6 × 10⁻³–1.09 | 0.07–2.2 | 150 / 302 | 91 / 301 |
| DBP (84-74-2) | 0.02–0.86 | 0.42–3.4 | 137 / 302 | 120 / 301 |
| CHIBP (5334-09-8) | NA | NA | 0 / 0 | 0 / 0 |
| BCHP (84-64-0) | ND–0.15 | 7.0 × 10⁻³–0.44 | 95 / 302 | 50 / 301 |
| BBP (85-68-7) | ND–2.0 | 0.00–3.4 | 87 / 302 | 57 / 301 |
| DCHP (84-61-7) | 5.0 × 10⁻⁴–2.8 | 0.00–5.5 | 69 / 302 | 18 / 301 |
| DnHP (84-75-3) | ND–0.01 | 2.0 × 10⁻³–0.01 | 49 / 167 | 53 / 167 |
| DBzP (523-31-9) | 1.0 × 10⁻⁴ –0.02 | 3.0 × 10⁻³–0.01 | 106 / 302 | 53 / 301 |
| B79P (68515-40-2) | ND–0.44 | 0.88 | 145 / 277 | 30 / 283 |
| DMCHP (27987-25-3) | ND–0.02 | 0.00–0.01 | 129 / 302 | 81 / 301 |
| DIHepP (71888-89-6) | 4.0 × 10⁻⁴ –0.40 | 0.01–0.20 | 148 / 167 | 54 / 167 |
| 79P (111381-89-6) | ND–0.03b | NA | 0 / 0 | 0 / 0 |
| BIOP (27215-22-1) | 1.0 × 10⁻⁴–0.01 | 0.00– 0.01 | 118 / 302 | 61 / 301 |
| DIOP (27554-26-3) | ND–0.96 | 0.00–2.3 | 14 / 167 | 9 / 167 |
| DEHP (117-81-7) | 3.2 × 10⁻³–1.63 | 1.3–13 | 209 / 311 | 51 / 310 |
| DINP 68515-48-0 / 28553-12-0) | ND–3.4b | 0.33–2.8 | 166 / 167 | 46 / 167 |
| B84P (16883-83-3) | ND–1.0 | 0.02–2.5 | 74 / 167 | 29 / 167 |
| 610P (68648-93-1) | 0.50b–1.1b | NA | 0 / 0 | 0 / 0 |
| DnOP (117-84-0) | 1.0 × 10⁻³–0.36 | 0.02–0.39 | 110 / 167 | 34 / 167 |
| D911P (68515-43-5) | 0.16b–1.1b | NA | 0 / 0 | 0 / 0 |
| D911P-2 (111381-91-0) | 2.0 × 10⁻³b | NA | 0 / 0 | 0 / 0 |
| DIDP (26761-40-0 / 68515-49-1) | ND–11.5 | 0.14–21 | 157 / 167 | 100 / 167 |
| DIUP (85507-79-5) | ND–0.04a | 0.00–0.12 | 159 / 167 | 35 / 167 |
| DTDP (68515-47-9) | ND–4.2 × 10⁻³ | 0.00–4.0 × 10⁻³ | 142 / 167 | 64 / 167 |
| DUP (3648-20-2) | ND –0.09 | 0.00–0.10 | 157 / 167 | 43 / 167 |
Abbreviations: ND, not detected; NA, not analyzed; PEC, predicted environmental concentration; WWTS, wastewater treatment system.
a Number of samples in which the phthalate was detected, divided by the total number of samples.
b Modelled PEC based on industrial emission factors and s. 71 quantities.
An analysis of the locations where both industrial and municipal monitoring data were available suggests that phthalate loading from the known industrial phthalates manufacturers or users generally accounted for less than 10% of the total phthalate loading in the off-site WWTS influents. This suggests that a large part of the phthalates found in the influents of off-site WWTS may be coming from other sources, such as wastewater from residential and commercial sources, industrial sources not captured by the s. 71 survey reporting requirements, or landfill leachate. Several phthalates were measured at low concentrations in leachate samples collected from four landfill sites in 2017 and these phthalates were also present in the influents of WWTS receiving the leachates. While the number of phthalates and overall phthalate concentrations varied widely between WWTS, in general, DEP, DBP, BBP, DIBP and DEHP were detected most frequently and at relatively higher concentrations in both WWTS influents and leachate samples.It should be noted that the solubility of substances in a real-world setting often differs from that measured under laboratory conditions and is influenced by many factors, including the physicochemical properties of the environment and the presence of solubilizing substances such as humic acids in the water. A measured environmental concentration value was considered acceptable if it fell within a factor of 10 of the laboratory-based value, and this was the case for all but three of the phthalates measured in the WWTS samples. For the three largest and least soluble phthalates, DIUP, DTDP and DUP, measured or modelled concentrations exceeded some modelled water solubility estimates but were within a factor of 10 for other estimates. The PEC values for these phthalates were considered suitable for reporting in the assessment as they were within the range of the extremely low solubility predicted for these substances.
8.3 Characterization of ecological risk
8.3.1 General considerations
Phthalates are released both during various industrial activities and continuously through consumer use of products and manufactured items that contain phthalates, with environmental releases occurring primarily to water via off-site wastewater treatment systems. Phthalates are not chemically bound to polymer matrices, so they can migrate slowly to the polymer surface, and then possibly enter the environment. Phthalates will biodegrade rapidly and are not expected to be recalcitrant in the environment. Degradation may be slightly slower under anaerobic conditions, thereby increasing the duration of exposure to organisms. According to information about releases and the predicted distribution in the environment, aquatic and soil-dwelling organisms close to release sites will have the highest potential for exposure. Phthalate concentrations are expected to decrease with increasing distance from points of release; however, long-range atmospheric transport potential has been identified for the short-chain phthalate DMP (Morin 2003). There is also evidence that other phthalates are transported in the atmosphere on fine particles (Ruzicková et al. 2016).
The aquatic compartment is thought to be the key receiving environmental compartment for all phthalates. Releases to the aquatic compartment are continuous, and even the long-chain phthalates, which are highly hydrophobic, are detected in water. Distribution of phthalates between environmental media depends primarily on which medium they are emitted to and also on their water solubility and partition coefficients. Short-chain and some medium-chain phthalates are expected to reside predominantly in water, and the long-chain and other medium-chain phthalates are expected to partition to sediments and adsorb to particles. Toxicity data available for soil- and sediment-dwelling organisms indicate that effects are not likely to occur at environmentally relevant concentrations. No toxicity below solubility limits or soil/sediment saturation levels was found for long-chain phthalates and some of the larger medium-chain phthalates (e.g., DIHepP, B84P). The focus of this assessment is therefore on aquatic organisms, for which deleterious effects from phthalate exposure have been observed. Acute effects of short- and medium-chain phthalates in aquatic organisms range from high (LC50 of 0.08 mg/L) to moderate (LC50 of 10 mg/L).
8.3.2 Cumulative risk assessment using grouping and additional phthalates
Where similar chemicals are potentially exerting combined effects on organisms through a common mode of action (MoA), it is appropriate to consider assessing risk from the cumulative exposure, rather than considering risk from each individual substance separately. In determining whether to conduct a CRA, the most important consideration is whether there is co-occurrence of the substances in one or more environmental media. In the case of phthalates, there are several lines of evidence to suggest the potential for co-occurrence in the environment. These include their uses, releases, degradation processes, and presence in wastewater treatment system effluents. The selection of which CRA method to use depends on whether there is a common MoA among the substances. There is sufficient evidence that, under short-term exposures, all phthalates are acting through narcosis and can be considered together in a CRA based on concentration addition (CA).
The selection of the specific CRA method depends on what types of data are available to characterize the effect and exposure concentrations of each substance. The Sum of Internal Toxic Units method was chosen from among the various CA methods available. This approach involves summing toxic units on the basis of internal toxic units (i.e., concentrations in organism tissues), rather than on the basis of external (i.e., water) exposure concentrations of substances. This is also referred to as a CBR approach.
The sum of internal toxic units (ITUmix) for a group of substances is calculated using the equation shown below. For this CRA, the internal toxic unit for each substance is estimated by multiplying its estimated concentration in water (PECi) by the bioaccumulation factor (BAFi), and dividing by the critical body residue (CBR) associated with chronic lethality in aquatic organisms (0.2 mmol/kg for narcosis; McCarty and Mackay 1993), multiplying CBRi by MWi (the molecular weight of the substance), and finally applying an assessment factor (AF). An AF of 5 was applied because the CBR is based on lethality, so the AF is intended to extrapolate from median lethal effects to sublethal low- or no-level effects. A larger factor was not deemed necessary since the CBR is already for chronic (long-term) exposure.
Further detail about CRA methods, including the Sum of Internal Toxic Units (ITU) method, are found in a separate document (Environment Canada, Health Canada 2015e).
All 28 phthalates (the 14 substances in the Phthalate Substance Grouping and 14 additional phthalates) were included in a CRA calculation. Although no effects are typically observed for the long-chain phthalates when tested individually up to their solubility limits, they are the highest volume phthalates in Canadian commerce, and monitoring data shows that some of them are present in wastewater effluents and surface waters at high concentrations. The approach chosen (ITU method) accounts for the possibility that they might still be contributing to cumulative effects based on lethality due to the narcosis MoA. Support for this approach is provided by Mayer and Reichenberg (2006), who found that highly hydrophobic substances that do not demonstrate narcotic effects on their own could still contribute to the toxicity of complex mixtures.
For the ITU calculations, the highest PEC determined for each phthalate was used, resulting in a conservative assumption that the highest concentrations of all phthalates were co-occurring at the same site. The CBR value used (in the denominator) was 0.2 mmol/kg for chronic lethal exposures (McCarty and Mackay 1993). The results of the ITU calculations are shown in Appendix B (Table B-1). The sum of internal toxic units across the 28 phthalates, prior to application of an assessment factor, is 0.035. The highest toxic unit in the mixture is for BBP (0.099). Eleven phthalates account for approximately 95% of the cumulative risk based on narcosis: BBP, DIOP, D911P, DCHP, DINP, DIDP, DIBP, DEHP, DBP, DEP, and DIHepP (Appendix B, Figure B-1).
When the AF of 5 is applied to the sum of ITUs, the final ITUmix is 0.2 (0.035 x5). This indicates that there is low risk from the mixture. An examination of contributions of the various phthalates to the mixture toxicity indicates that the overall toxicity is largely dominated by one substance, BBP (see Appendix B1).
In addition to determining the final ITUmix based on the highest PEC for each phthalate, an ITUmix was also calculated based on the median PEC for each phthalate. This was done to provide an indication of the relative risk under more realistic or typical conditions. Results of these calculations are also shown in Appendix B (Table B-2). An ITUmix of 0.006 was determined based on median PECs.
8.3.3 Calculation of individual risk quotients and consideration of endocrine effects
In the SOS reports (Environment Canada, Health Canada 2015a,b,c,d), risk quotient (RQ) analyses for the aquatic medium were done for the short-chain and some of the medium-chain phthalates. For the other medium-chain and the long-chain phthalates, their low water solubility and high hydrophobicity suggest that dietary exposure will be the major route of exposure for organisms, rather than the surrounding medium. For this reason, tissue residues were calculated on the basis of bioaccumulation factors and water solubility and compared with the critical body residues (CBRs) for narcosis to estimate the potential for the substance to reach internal concentrations that are sufficiently high to cause effects through baseline narcosis. None of the individual RQ or CBR results for substances in the Phthalate Substance Grouping indicated a risk of harm to aquatic organisms through narcotic effects. It should be noted that the CBRs were conservative because they were calculated using the maximum water solubility for each substance and assumed 100% bioavailability; they would be even lower if actual environmental concentrations had been used instead of water solubility limits.
The ITU approach used in this assessment employs lethality CBRs based on data for narcotic chemicals. However, effects from specific modes of action, including endocrine activity, may occur at lower exposure levels than narcotic effects. A cumulative approach based on endocrine activity is not presently viable given the data limitations. Therefore, in addition to the CRA based on narcosis, risk quotients (RQs) for individual phthalates in the Grouping were also calculated, using PNECs and PECs as determined in Tables 8-3 and 8-4, respectively (see Table 8-5). Although RQs were presented for the Grouping phthalates in the SOS reports, these were recalculated for this assessment using more recent PNECs and PECs, specifically those shown in Tables 8-3 and 8-4. The results of the RQ analysis are presented in Table 8-5. The analysis considered both median and highest PEC values, with highest PECs representing ‘worst case’ exposure conditions and median PEC values indicative of exposure under more realistic or typical environmental conditions. Highest PECs ranged from 0.01 to 11.5 µg/L, while median PEC values were 0.0005 to 0.199 µg/L. Corresponding RQs were 2.5 × 10⁻⁴ to 23.3 for highest exposure concentrations, while much lower RQs of 8.3 × 10⁻⁶ to 2.84 were determined based on median exposure values.
RQs were less than one for all 14 phthalates in the Phthalate Substance Grouping, indicating low potential for harm to aquatic organisms in the Canadian environment. However, the RQ based on impaired spermatogenesis and reduced embryo production in zebrafish calculated for the additional phthalate, DEHP, exceeded one, indicating a potential for risk. Risk quotients for the other 13 additional phthalates, which are not being assessed, are presented in ECCC (2018) and were all less than one.
| Substance (CAS RN) | Highest PEC (µg/L) | Median PEC (µg/L) | PNEC (µg/L) | Highest RQ (PEC/PNEC) | Median RQ (PEC/PNEC) |
|---|---|---|---|---|---|
| DMP (131-11-3) | 0.40 | 0.03 | 1.0 | 0.40 | 0.03 |
| DIBP (84-69-5) | 1.09 | 0.08 | 190 | 0.006 | 4.2 × 10⁻⁴ |
| CHIBP (5334-09-8) | not analyzed | not analyzed | 6 | NC | NC |
| BCHP (84-64-0) | 0.15 | 0.0008 | 6 | 0.025 | 1.3 × 10⁻⁴ |
| DCHP (84-61-7) | 2.8 | 0.001 | 60 | 0.05 | 1.7 × 10⁻⁵ |
| DBzP (523-31-9) | 0.02 | 0.0006 | 3 | 0.006 | 2.0 × 10⁻⁴ |
| B79P (68515-40-2) | 0.44 | 0.044 | PNEC not derived; TR for fish calculated as 0.03 mmol/kg | NC | NC |
| DMCHP (27987-25-3) | 0.02 | 0.0005 | 60 | 2.5 × 10⁻⁴ | 8.3 × 10⁻⁶ |
| DIHepP (71888-89-6) | 0.40 | 0.006 | PNEC not derived; TR for fish calculated as 5.39 × 10⁻³ mmol/kg | NC | NC |
| BIOP (27215-22-1) | 0.01 | 0.0005 | 3.2 | 3.5× 10⁻³ | 1.6 × 10⁻⁴ |
| DEHP (117-81-7) | 1.63 | 0.199 | 0.07 | 23.3 | 2.84 |
| DINP 68515-48-0 / 28553-12-0) | 3.4 | 0.06 | PNEC not derived; TR for fish calculated as 2.6 × 10⁻⁴ mmol/kg | NC | NC |
| B84P (16883-83-3) | 1.0 | 0.008 | PNEC not derived; TR for fish calculated as 0.10 mmol/kg | NC | NC |
| DIDP (26761-40-0 / 68515-49-1) | 11.5 | 0.07 | PNEC not derived; TR for fish calculated as 1.5 × 10⁻⁵ mmol/kg | NC | NC |
| DUP (3648-20-2) | 0.09 | 0.002 | PNEC not derived; TR for fish calculated as 5.8 × 10⁻⁸ mmol/kg | NC | NC |
Abbreviations: NC, not calculated (because no adverse effects were observed below solubility limits); PEC, predicted environmental concentration (based on dilution factor of 10 and 10th percentile flow); PNEC, predicted no-effect concentration; TR, tissue residue.
8.3.4 Consideration of the lines of evidence and conclusion
To characterize the ecological risk of phthalates in the Phthalate Substance Grouping, technical information for various lines of evidence was considered (as discussed in the relevant sections of this report) and qualitatively weighted. The key lines of evidence supporting the assessment conclusion are presented in Table 8-6. The level of confidence refers to the combined influence of data quality and variability, data gaps, causality, plausibility and any extrapolation required within the line of evidence. The relevance refers to the impact the line of evidence has when determining the potential to cause harm in the Canadian environment. Qualifiers used in the analysis ranged from low to high, with the assigned weight having five possible outcomes.
| Line of evidence | Level of confidencea | Relevance in assessmentb | Weight assignedc |
|---|---|---|---|
| Wide use in products, so potential for continuous release and exposure. | Moderate | Moderate | Moderate |
| Appropriate environmental media of distribution have been considered. | High | Moderate | Moderate to High |
| Overall persistence considered. Generally not persistent although DMP may remain longer than 2 days in air. | High | High | High |
| Short-chain phthalates (e.g., DMP) distribute to and may persist in air; limited rodent inhalation data suggests low toxicity. | Moderate | Low | Low to Moderate |
| Most demonstrate low bioaccumulation potential, although moderate potential in some medium-chain phthalates and all are bioavailable. | High | High | High |
| Short-chain phthalates and long-chain phthalates show low toxicity by narcosis. Medium-chain phthalates have moderate to high toxicity. | High | High | High |
| CBR analyses for long-chain phthalates and some medium-chain phthalates indicate tissue levels unlikely to reach those sufficient to cause adverse effects through narcosis. | High | High | High |
| Evidence of rapid and efficient metabolism of phthalates in organisms, with formation of less toxic metabolites. | High | High | High |
| Strong evidence of adverse effects on endocrine systems for some (e.g. DEHP); analysis of |
Moderate | High | Moderate to High |
| Secondary poisoning not expected because phthalates have low persistence and bioaccumulation. | Moderate | Low | Low to Moderate |
| Risk quotients indicate risk to aquatic organisms from DEHP. | High | High | High |
| Cumulative risk analysis indicates low potential for cumulative risk through narcotic mode of action (highest sum of ITUs =0.2). There is uncertainty with the AF used because it is not specifically derived for a CRA analysis using ITUs. | Moderate | High | Moderate to High |
a Level of confidence is determined according to data quality, data variability, data gaps (i.e., are the data fit for purpose).
b Relevance refers to the impact of the evidence in the assessment.
c Weight is assigned to each line of evidence according to the overall combined weights for level of confidence and relevance in the assessment.
Phthalates examined in this screening assessment are not persistent, although all biodegrade more slowly under low oxygen conditions, and short-chain phthalates such as DMP may remain resident in air for periods of longer than two days and may be found in areas far from the source of release. Phthalates are used in a variety of consumer, commercial and industrial applications, creating the potential for widespread release into the Canadian environment. Some phthalates, in particular DINP and the long-chain phthalates DIDP and DUP, are manufactured and/or imported in large quantities. Constant release of phthalates into the environment may result in continuous exposure for organisms residing in near-field receiving media. Phthalates are released mainly into air and water, and while all phthalates are predicted to distribute into water, only short-chain phthalates such as DMP are predicted to distribute appreciably to air. Therefore, water is the primary medium of concern for the phthalates being considered in this assessment.
Phthalates are bioavailable but do not have high bioaccumulation potential because of high rates of biotransformation in biota. Long-chain phthalates demonstrate low toxicity to aquatic organisms, while short- and medium-chain phthalates exhibit moderate to high toxicity. Phthalates are efficiently metabolized, with the formation of less toxic metabolites that can be readily excreted. Narcosis is an important mode of toxic action for phthalates. However, there is strong evidence that some phthalates may also elicit effects through other modes of action. In particular, some phthalates may have the ability to adversely affect the normal functioning of endocrine systems, such as gonadal development, in organisms. While in vivo evidence of effects on the endocrine system has only been definitively demonstrated for a small number of phthalates, such as DEHP, an analysis of in vivo, in vitro, and in silico data suggests that many phthalates possess properties that could allow them to adversely influence endocrine activity under some conditions. There are considerable in vivo data for medium-chain phthalates in mammals indicating endocrine effects on the development of the male reproductive tract. Given that pathways are highly conserved within vertebrates, it might be expected that, if tested, many of the data-poor medium-chain phthalates could also show effects on endocrine systems in aquatic species, such as fish.
An analysis of risk quotients determined that all 14 phthalates in the Phthalate Substance Grouping present a low risk of causing harm to aquatic species under current exposure levels in the Canadian environment. One additional phthalate, DEHP, has the potential to cause adverse effects in populations of aquatic organisms in Canada at current exposure levels. The risk quotient analysis considered both highest and median predicted exposure concentrations (PECs) in order to compare ‘worst case’ environmental exposures with those occurring under more realistic or typical conditions. Risk quotients based on median PECs were about 10 to 200 times lower than those derived using highest PECs, indicating that organisms are most commonly exposed to substantially lower environmental concentrations than those represented by highest PEC values. The risk quotient for DEHP, however, exceeded one when both the highest PEC (risk quotient 23.3) and median PEC (risk quotient 2.84) were used. The analysis of cumulative risk also determined a much lower risk under median or typical environmental exposure concentrations as compared with highest PECs. The sum of internal toxic units, considering narcotic effects, for the 28 phthalates considered in the cumulative risk analysis was 0.2 when highest PECs were used and 0.006 when based on median PECs.
Considering all available lines of evidence presented in this screening assessment, there is low risk of harm to the environment from the 14 phthalates in the Phthalate Substance Grouping (DMP, DIBP, CHIBP, BCHP, DCHP, DBzP, B79P, DMCHP, DIHepP, BIOP, B84P, DINP, DIDP and DUP). However, the additional phthalate, DEHP, is considered to have potential to cause ecological harm in Canada and therefore meets the criteria under section 64(a) of CEPA. DEHP was assessed by Environment Canada and Health Canada in 1994 under the Priority Substances Assessment Program. That assessment concluded that DEHP posed a risk to human health in Canada, but was not able to conclude on the potential for risk to the environment due to insufficient information. Sufficient data were gathered in the course of this assessment to now conclude on the potential for DEHP to cause ecological harm in Canada.
In addition to DEHP, certain short- and medium-chain phthalates (i.e., DMP, DEP, DPrP, DIBP, BCHP, DCHP, DBzP, B79P, DMCHP, BIOP, DBP, BBP, DnHP, and DINP), as well as the long-chain phthalate DnOP, may be highly hazardous because of their potential for effects on the endocrine system. However, under conservative consideration of current exposure levels, these substances are not expected to pose a risk.
8.3.5 Uncertainties in evaluation of ecological risk
The nature and extent of the potential for phthalates evaluated in this assessment to cause adverse effects on the endocrine system in aquatic organisms is a key uncertainty. Effects on endocrine systems have been extensively studied for a few phthalates, but large data gaps remain for the majority of them. Additionally, there are inconsistent/variable study methodologies and sometimes conflicting results. Certain longer chain phthalates (>C7) may have some minor endocrine activity, or might enhance the activity of other endocrine-active substances, but the evidence does not seem to indicate that this is a significant effect for these phthalates. Consequently, while an analysis of data for endocrine activities (see Tables 8-1 and 8-2) suggests that many phthalates can potentially influence endocrine activity, the results were not sufficient to support a conclusion, under section 64 of CEPA, for all phthalates under assessment. However, phthalates with evidence for endocrine activity will be flagged for further evaluation in the event of a change to exposure conditions (for example, through increased use quantities) or receipt of additional toxicity information.
The lack of in vivo aquatic toxicity data on effects in endocrine systems is also an important uncertainty in the assessment. These data are not available for many of the phthalates examined in this assessment and would be particularly useful for the medium-chain phthalates as substances in this subgrouping exhibit the highest aquatic toxicity and are therefore expected to be more reactive than the short- and long-chain phthalates. Also, for those phthalates that have been tested for effects to the endocrine system, there is often a lack of testing at low, environmentally relevant concentrations. Therefore, although research is ongoing, it is currently unknown whether they might still cause adverse effects at concentrations found in the environment.
There are very limited empirical effects data of phthalates for soil- and sediment-dwelling organisms. Measurements of phthalates in soils and sediments have also been limited. Although available data suggest low concern for these environmental media, a more robust dataset would help characterize effects in these media more clearly.
There is uncertainty with respect to the sources of phthalates in the aquatic environment. For DEHP, modelling suggests that aquatic releases from industrial users (i.e., plastic products manufacturers) may be a potential source. Furthermore, considering the measured concentrations of phthalates in WWTS that receive both domestic and industrial wastewaters, the contribution of industrial activities may not be the main source of phthalates in most cases. Rather, the main sources are potentially linked to contribution from consumer or commercial inputs or landfill leachate, but it is not possible to specifically attribute the sources.
9. Potential to cause harm to human health
9.1 Exposure assessment
The exposure assessment for human health was completed using available and relevant data, including biomonitoring data, environmental media and food occurrence data, and exposures estimated from the use of products available to consumers. Biomonitoring data considered for the exposure assessment included data from the Canadian Health Measures Survey (CHMS) Cycles 1 and 2 (Health Canada 2011b, 2013), the First Nations Biomonitoring Initiative (FNBI) (AFN 2013), the Plastics and Personal Care Product Use in Pregnancy survey (P4) (Arbuckle et al. 2016), the Maternal Infant Research on Environmental Chemicals study (MIREC) (Arbuckle et al. 2014), the Maternal Infant Research on Environmental Chemicals – Child Development Plus study (MIREC-CD Plus) (personal communication from Environmental Health Sciences and Radiation Directorate [EHSRD], HC, to the ESRAB, HC, October 2013, 2014, unreferenced), and the National Health and Nutrition Examination Survey (NHANES) (CDC 2014). Since the publication of the draft screening assessment, several phthalate metabolites have also been measured in CHMS Cycle 5 (Health Canada 2019). Daily intakes based on these data are not expected to exceed those estimated from the previously reported biomonitoring studies.
9.1.1 Short-chain phthalates
DMP
Exposure estimates were calculated using human biomonitoring data as well as data on DMP occurrence in indoor air, soil, dust, food and cosmetics. They are presented in the SCP SOS report (Environment Canada, Health Canada 2015a) and summarized below. Since the publication of the SOS report, DMP has been analyzed in foods included in the 2013 Canadian Total Diet Study (TDS). While it was not quantified in any food composites above the method detection limit in Canada (average MDL=1.13 ng/g; Cao et al. 2015), it was reported in fish in the United States (Martins et al. 2016), indoor air and dust in homes in the United States (Tran and Kannan 2015; Subedi et al. 2017), in agricultural soils in Canada (Khosravi and Price 2015) and in various studies internationally. In addition, it was reported in mineral water and soda water in China (Yang et al.2017), but was not detected in bottled water in Iran (Pourzamani et al. 2017). However, these reported values did not change the previously presented exposure estimates (Environment Canada, Health Canada 2015a).
The highest exposed group according to biomonitoring data (all sources, MIREC-CD Plus) are male children aged 2 to 3 years, with median and 95th percentile intakes of 0.19 and 0.66 µg/kg bw/day, respectively. For older populations (12 years and over) the highest exposed group (all sources, NHANES) is males aged 12 to 19 years, with median and 95th percentile intakes of 0.042 and 0.29 µg/kg bw/day, respectively.
The subpopulation with the highest exposure to DMP from environmental media and food consisted of breastfed infants, with total daily intake of 0.019 and 0.26 µg/kg bw/day estimated on the basis of central tendency and upper-bounding concentrations, respectively.
Estimated daily intake of DMP from use of diaper cream (infants aged 0 to 0.5 years, dermal) was 2.7 µg/kg bw/day (lower-end exposure scenario) and 8.2 µg/kg bw/day (upper-bounding exposure scenario). For adults aged 20 years and over, estimated intakes from the use of hairsprays and hair dyes were 6.6 µg/kg bw/day (lower end) and 20 µg/kg bw/day (upper bound) and 140 µg/kg bw/event (lower end) and 420 (upper bound) µg/kg bw/event, respectively.Footnote 8
For more details, please refer to the SCP SOS report (Environment Canada, Health Canada 2015a).
9.1.2 Medium-chain phthalates and additional phthalates
Medium-chain phthalates
For detailed information on all 11 medium-chain phthalates in this section, please refer to the MCP SOS report and the DINP SOS report (Environment Canada, Health Canada 2015b; Environment Canada, Health Canada 2015c).
DIBP
Exposure estimates were calculated using biomonitoring data as well as data on DIBP occurrence in air, drinking water, dust, food, plastic items and cosmetics. They are presented in the MCP SOS report (Environment Canada, Health Canada 2015b) and summarized below. Since the publication of the SOS report, DIBP has been analyzed in foods included in the 2013 Canadian Total Diet Study (TDS). DIBP was detected in 27 of 159 composite food samples at an average MDL of 7.25 ng/g (mean of positives = 8.26 ng/g, range of 2.41 to 39.8 ng/g; Cao et al. 2015). DIBP has been reported in 100% of indoor air (range: 0.035-0.67 µg/m3, median: 0.18 µg/m3, mean: 0.21 µg/m3) and household dust (range: 2.22-25.6 µg/g, median: 6.14 µg/g, mean: 7.25 µg/g) samples from 51 homes in Canada (Health Canada 2017). DIBP has also been detected in indoor air and dust in homes in the United States (Tran and Kannan 2015; Subedi et al. 2017) and in various studies internationally. DIBP was also reported in certain toys and childcare articles in Canada (range: 0.003-22%; 5 of 27 samples; Health Canada 2018a) and in toys in New Zealand (Ashworth et al. 2018), and in household residual waste plastic in Denmark (Pvinenko et al. 2016). It was also reported in jeans, and to subsequently rub-off to legs in adults (as measured via dermal wipes), in China (Gong et al. 2016) and in cotton and polyester fabrics purchased in the United States (Saini et al. 2016). It was not detected in baby teethers in Thailand (Makkliang et al. 2017). However, these reported values did not change the previously presented exposure estimates (Environment Canada, Health Canada 2015b).
The highest exposed group according to biomonitoring data (all sources, CHMS Cycle 2, 2009-2011, n = 2547, 3-79 years) is male children aged 6 to 11 years, with estimated mean intakes of 1.5 µg/kg bw/day and median and 95th percentile intakes of 0.76 and 5.3 µg/kg bw/day, respectively. For older populations (12 years and over), the highest exposed group (all sources, CHMS) is 20-to-49-year-old females, with mean intakes of 0.56 µg/kg bw/day and median and 95th percentile intakes of 0.46 and 1.4 µg/kg bw/day, respectively.
The subpopulation with the highest exposure from environmental media and food consisted of breastfed infants, with total daily intakes of 1.6 and 5.9 µg/kg bw/day estimated on the basis of central tendency and upper-bounding concentrations, respectively. Daily intakes for DIBP for infants (0 to 1.5 years) from exposure from mouthing plastic toys and childcare articles were estimated at 62.8 and 251 µg/kg bw/day on the basis of lower-end and upper-bounding exposure scenarios, respectively. Estimated daily intakes for infants from dermal exposure to plastic items, based on a lower-end and upper-bounding exposure scenarios, were 30.7 and 245.3 µg/kg bw/day, respectively. For adults exposed to plastic items (females aged 20 years and over), estimated daily intakes, based on lower-end and upper-bounding exposure scenarios, were 30.8 and 96.3 µg/kg bw/day, respectively. Estimated daily intake of DIBP from use of body lotions was 0.03 µg/kg bw/day for adults aged 20 to 59 years.
DCHP
Exposure estimates were calculated using data on DCHP occurrence in dust and food. Since the publication of the MCP SOS report, DCHP has been analyzed in foods included in the 2013 Canadian TDS but was detected in only 1 of 159 composite food samples, at a concentration of 64.9 ng/g (average MDL=1.58 ng/g; Cao et al. 2015). However, this new information did not significantly change the exposure estimates presented previously (Environment Canada, Health Canada 2015b).
The subpopulation with the highest exposure from environmental media and food consisted of children (aged 6 months to 4 years), with total daily intakes of 0.0018 and 0.15 µg/kg bw/day estimated on the basis of central tendency and upper-bounding concentrations, respectively. For populations aged 12 years and over, the highest exposed group is adolescents (aged 12 to 19 years), with total daily intakes of <0.001 and 0.065 μg/kg bw/day estimated on the basis of central tendency and upper-bounding concentrations, respectively.
Intakes were not calculated on the basis of biomonitoring data, because the majority of samples were measured below the limit of detection (CHMS Cycles 1 (2007-09) and 2 (2009-11), MIREC-CD Plus, MIREC, P4).
DMCHP
Exposure estimates were calculated using data on DMCHP occurrence in dust. They are presented in the MCP SOS report (Environment Canada, Health Canada 2015b) and summarized below.
The subpopulation with the highest exposure from dust consisted of infants (0 to 6 months old) with total daily intake of 0.0027 and 0.054 µg/kg bw/day estimated on the basis of central tendency and upper-bounding concentrations, respectively. For populations aged 12 years and over, total daily intakes are <0.001 μg/kg bw/day.
DBzP
Exposure estimates were calculated using data on DBzP occurrence in dust. Since the publication of the MCP SOS report, DBzP has been analyzed in foods included in the 2013 Canadian TDS and was not quantified above the MDL (average MDL=12.7; Cao et al. 2015). Exposure estimates for DBzP are presented in the MCP SOS report (Environment Canada, Health Canada 2015b) and summarized below.
The subpopulation with the highest exposure from dust consisted of infants (0 to 6 months old), with total daily intakes of 0.016 and 0.097 µg/kg bw/day estimated on the basis of central tendency and upper-bounding concentrations, respectively. For populations aged 12 years and over, total daily intakes of <0.001 and 0.0011 μg/kg bw/day estimated on the basis of central tendency and upper-bounding concentrations, respectively, are observed for all age groups.
B84P
Exposure estimates were calculated using data on B84P occurrence in dust and plastic items. They are presented in the MCP SOS report (Environment Canada, Health Canada 2015b) and summarized below. Since the publication of the SOS report, B84P was not detected (27 samples) in certain toys and childcare articles in Canada (Health Canada 2018a). These recent Canadian data affirm the conservative nature of the exposure estimates from dermal contact with plastic items presented previously (Environment Canada, Health Canada 2015b).
The subpopulation with the highest exposure from dustFootnote 9 consisted of infants (0 to 6 months old), with total daily intakes of 0.0063 and 0.047 µg/kg bw/day estimated on the basis of central tendency and upper-bounding concentrations, respectively.
Estimated daily intakes for infants from dermal exposure to B84P from plastic items, calculated on the basis of lower-end and upper-bounding exposure scenarios, were 2.7 and 21.6 µg/kg bw/day, respectively. For adults exposed to plastic items (females aged 20 years and older), lower-end and upper-bounding estimates of daily intake were 2.7 and 8.5 µg/kg bw/day, respectively.
DIHepP
Exposure estimates were calculated using data on DIHepP occurrence in dust. They are presented in the MCP SOS report (Environment Canada, Health Canada 2015b) and summarized below.
The subpopulation with the highest exposure from dust consisted of infants (0 to 6 months old), with total daily intakes of 0.096 and 1.1 µg/kg bw/day estimated on the basis of central tendency and upper-bounding concentrations, respectively (for more details refer to Environment Canada, Health Canada 2015b). For populations aged 12 years and over, the highest exposed group is adolescents (aged 12 to 19 years), with total daily intakes of 0.0011 and 0.013 μg/kg bw/day estimated on the basis of central tendency and upper-bounding concentrations, respectively.
B79P
Exposure estimates were calculated using data on B79P occurrence in dust and plastic items. They are presented in the MCP SOS report (Environment Canada, Health Canada 2015b) and summarized below. Since the publication of the SOS report, B79P was not detected (27 samples) in certain toys and childcare articles in Canada (Health Canada 2018a). These recent Canadian data affirm the conservative nature of the exposure estimates from dermal contact with plastic items presented previously (Environment Canada, Health Canada 2015b).
The subpopulation with the highest exposure from dust consisted of infants (0 to 6 months old), with total daily intakes of 0.0063 and 0.047 µg/kg bw/day estimated on the basis of central tendency and upper-bounding concentrations, respectively. For populations aged 12 years and over, total daily intakes are <0.001 μg/kg bw/day.
Estimated daily intakes for infants from dermal exposure to B79P from plastic items, as calculated on the basis of lower-end and upper-bounding exposure scenarios, were 2.7 and 21.6 µg/kg bw/day, respectively. For adults exposed to plastic items (females aged 20 years and over), estimated daily intakes, based on lower-end and upper-bounding exposure scenarios, were 2.7 and 8.5 µg/kg bw/day respectively.
DINP
Exposure estimates were calculated using biomonitoring data as well as data on DINP occurrence in dust, food, and plastic items. They are presented in the DINP SOS report (Environment Canada, Health Canada 2015c) and summarized below. Since the publication of the SOS report, DINP has been reported in 100% of indoor air (range: 0.003-2 µg/m3, median: 0.012 µg/m3, mean: 0.1 µg/m3) and household dust (range: 79-1443 µg/g, median: 260 µg/g, mean: 323 µg/g) samples in 51 homes in Canada (Health Canada 2017). DINP has also been reported internationally to be present in indoor air (Blanchard et al. 2014, Takeuchi et al. 2014; Luongo et al. 2016; Wei et al. 2017; Giovanoulis et al. 2018), dust (Blanchard et al. 2014; Luongo and Östman 2015; Giovanoulis et al. 2018), soils (Tran et al. 2015) and tap water (Yang et al. 2014). In addition, DINP was not detected (27 samples) in certain toys and childcare articles in Canada (Health Canada 2018a). DINP was measured in toys and childcare articles above the regulated limit in 10% of toys tested in Europe (ECHA 2018). It was also reported to be present in toys in New Zealand (Ashworth et al. 2018) and Israel (Negeve et al. 2018). DINP was also reported in cotton and polyester fabrics purchased in the United States (Saini et al. 2016). However, these reported values did not change the exposure estimates presented previously (Environment Canada, Health Canada 2015c).
The highest exposed group according to biomonitoring data (all sources, NHANES) is male children aged 6 to 11 years, with mean intakes of 4.6 µg/kg bw/day, and median and 95th percentile intakes of 4.2 and 25 µg/kg bw/day, respectively. For older populations (aged 12 years and over), the highest exposed group (all sources, NHANES) is 12-to-19-year-old males, with mean intakes of 3.0 µg/kg bw/day, and median and 95th percentile intakes of 2.6 and 33 µg/kg bw/day, respectively. For adults aged 20 years and over, daily intakes are 2.8 μg/kg bw/day (mean), 2.4 μg/kg bw/day (median), and 24 μg/kg bw/day (95th percentile) for males and 2.3 μg/kg bw/day (mean), 1.9 μg/kg bw/day (median), and 23 μg/kg bw/day (95th percentile) for females.
The subpopulation with the highest exposure from dust and food consisted of children (aged 6 months to 4 years), with total daily intakes of 1.8 and 20.8 µg/kg bw/day estimated on the basis of central tendency and upper-bounding concentrations, respectively. For populations aged 12 years and over, the highest exposed group is adolescents (aged 12 to 19 years), with total daily intakes of 1.0 and 11.9 μg/kg bw/day estimated on the basis of central tendency and upper-bounding concentrations, respectively (see Appendix D, Table D-6).
Daily intakes for DINP for infants (aged 0 to 1.5 years) from mouthing plastic toys and childcare articles, were estimated on the basis of lower-end and upper-bounding exposure scenarios, to be 30 and 120 µg/kg bw/day, respectively. Estimated daily intakes for infants from dermal exposure to plastic items, based on lower-end and upper-bounding exposure scenarios, were 1.1 and 8.6 µg/kg bw/day, respectively. For females aged 20 years and over, estimated daily intakes from dermal exposure to plastic items, based on lower-end and upper-bounding exposure scenarios, were 1.1 and 3.4 µg/kg bw/day, respectively.
CHIBP, BCHP and BIOP
Given the absence of reporting to the s. 71 industry survey (CHIBP, BCHP and BIOP), non‑detection in dust (CHIBP and BCHP), non-detection in products available to consumers (BCHP; emission chamber study, NRC 2012), non-detection in children’s toys (CHIBP; Health Canada 2018a), negligible modelled indoor air concentrations (CHIBP), and the absence of information as to their presence in product databases (CHIBP, BCHP and BIOP), general population exposure to CHIBP, BCHP and BIOP from environmental media and products available to consumers is expected to be negligible (Environment Canada, Health Canada 2015b).
Additional medium-chain phthalates
BBP
Biomonitoring
Monobenzylphthalate (MBzP), the main monoester metabolite of BBP, was monitored in the CHMS Cycle 1 (2007–2009, n = 3325, 6-49 years) and Cycle 2 (2009–2011, n = 2559, 3-79 years), with 100% detection in all samples (Health Canada 2011b, 2013). Additionally, MBzP was measured as part of the First Nations Biomonitoring Initiative (FNBI) of the Assembly of First Nations (n=492 for on-reserve and Crown-land populations aged 20 years and over). Urine concentrations for MBzP (geometric mean) were reported to be statistically higher in FNBI samples than those observed in the CHMS Cycle 1 for population aged 20 years and older population (AFN 2013).
MBzP was also monitored by Health Canada in three cohort studies: P4 (n = 80 pregnant women and 55 infants, 1260 individual maternal spot samples collected over up to 5 visits and 84 individual infant spot urines collected over up to 2 visits (Arbuckle et al. 2016, Table S3), MIREC (n = 1788 pregnant women, spot urine samples: Arbuckle et al. 2014), and MIREC-CD Plus (198 children aged 2 to 3 years, 1 spot sample per individual; personal communication from Environmental Health Sciences and Radiation Directorate [EHSRD], HC, to ESRAB, HC, October 2013, 2014, unreferenced). All three studies reported high detection frequencies of MBzP (100%, 99% and 94%, respectively).
Finally, in the United States, the NHANES also monitored MBzP in urine during survey years 1999 to 2012 and reported high detection frequencies (CDC 2014).
Using the CHMS (Cycle 2), P4, MIREC and MIREC-CD Plus datasets, reverse dosimetry intake estimates were generated. Metabolite concentrations were adjusted for urine dilution using the creatinine correction method, a commonly used method for phthalate biomonitoring assessment (Fromme 2007; Frederiksen et al. 2013; Christensen et al. 2014; US CPSC CHAP 2014). Daily creatinine excretion rates for participants were estimated using the Mage equation. Biomonitoring intakes are presented in Table 9-1 below (see Appendix C for further information on the methodology).
| Age group | Study | Male/ Female | n | Arithmetic mean | 50th | 75th | 95thh |
|---|---|---|---|---|---|---|---|
| 1–4 months | P4 | males and females | 48 | 0.607 | 0.253 | 0.513 | 1.802 |
| 2–3 years | MIREC-CD Plus | males and females | 198 | 0.873 | 0.379 | 0.853 | 2.97 |
| 3–5 years | CHMS | males and females | 519 | 1.4 | 0.76 | 1.6 | 4.5 |
| 6–11 years | CHMS | males | 261 | 1.2 | 0.79 | 1.6 | 3.4 |
| 6–11 years | CHMS | females | 253 | 0.93 | 0.61 | 1.1 | 2.7 |
| 12–19 years | CHMS | males | 255 | 0.53 | 0.36 | 0.59 | 1.4 |
| 12–19 years | CHMS | females | 255 | 0.46 | 0.28 | 0.53 | 1.6 |
| 18+ years | MIREC | females (pregnant) | 1727 | 0.53 | 0.27 | 0.53 | 1.60 |
| 19+ years | P4 | females (pregnant) | 31c | 1.0 | 0.31 | 0.86 | 3.01 |
| 20–49 years | CHMS | males | 290 | 0.33 | 0.2 | 0.35 | 0.97b |
| 20–49 years | CHMS | females | 286 | 0.37 | 0.19b | 0.36b | 1.2 |
| 50–79 years | CHMS | males | 211 | 0.22 | 0.13 | 0.23 | 0.61b |
| 50–79 years | CHMS | females | 216 | 0.24 | 0.15 | 0.3 | - |
- = No data
a Data for males and females from: P4 and MIREC pregnant women, P4 infants, MIREC-CD Plus children (preliminary results), and CHMS (Cycle 2)
b Use data with caution.
c n = 31 women, 542 individual spot samples, women provided multiple urine samples over two visits.
The highest exposed group according to biomonitoring data (all sources, CHMS) is children aged 3 to 5 years with median and 95th percentile intakes of 0.76 and 4.5 µg/kg bw/day, respectively. For older populations (aged 12 years and over), the highest exposed group (all sources, P4) is pregnant women (aged 19 years and over) with median and 95th percentile intakes of 0.31 and 3.01 µg/kg bw/day, respectively.
Environmental media and food
The subpopulation with the highest exposure to BBP from environmental media and food consisted of children (aged 0.5 to 4 years ), with total daily intakes of 0.58 and 3.01 µg/kg bw/day estimated on the basis of central tendency and upper-bounding concentrations, respectively (Appendix D, Table D-1a).
Indoor air and dust
BBP was measured in indoor air in Canadian homes in Ottawa and Toronto (detected in 100% of 51 homes, range: 0.72-65.9 ng/m3, median: 2.8 ng/m3, mean: 4.8 ng/m3; Health Canada 2017). Another study measured BBP in indoor air in 75 Canadian homes; all samples were less than the limit of detection (LOD) (LOD was not reported; Zhu et al. 2007). BBP has also been measured in indoor air in homes in the United States and internationally (Fromme et al. 2004; Rudel et al. 2010; Bergh et al. 2011a; Pei et al. 2013; Blanchard et al. 2014; Lin et al. 2014; Takeuchi et al. 2014; Tran and Kannan 2015; Bu et al. 2016; Luongo et al. 2016; Tran et al. 2017; Wei et al. 2017; Giovanoulis et al. 2018). The median (2.8 ng/m3) and maximum (65.9 ng/m3) concentrations from the Canadian study (Health Canada 2017) were used to estimate the general population daily intake of BBP from indoor air (Appendix D, Table D-1a).
BBP was surveyed in the Canadian House Dust Study (CHDS) and was detected in 100% of 126 homes sampled across Canada (range: 0.6 to 944 µg/g, median: 42.3 µg/g, 95th percentile: 512 µg/g) (Kubwabo et al. 2013). In addition, BBP was measured in dust sampled from Canadian homes in Ottawa and Toronto, ON, Canada (detected in 100% of 51 homes, range: 0.72-1175 µg/g, median: 6.45 µg/g, mean: 27.6 µg/g; Health Canada. 2017). Internationally, BBP has also been reported in house dust (Fromme et al. 2004; Bornehag et al. 2005; Kolarik et al. 2008; Langer et al. 2010; Bergh et al. 2011a; Guo and Kannan 2011; Hsu et al. 2012; Kang et al. 2012; Gevao et al. 2013; Orecchio et al. 2013; Papadopoulos et al. 2013; Blanchard et al. 2014; Lin et al. 2014; Dodson et al. 2015; Luongo and Östman 2015; Bu et al. 2016; He et al. 2016; Luongo et al. 2016; Subedi et al. 2017; Tran et al. 2016; Muenhor et al. 2018; Giovanoulis et al. 2018).
The CHDS (Kubwabo et al. 2013) was identified as the key study for exposure characterization, since it was representative of homes across Canada. The median (42.3 µg/g) and 95th percentile (512 µg/g) concentrations were used to estimate the Canadian general population daily intake of BBP from dust (Appendix D, Table D-1a).
BBP has applications as a plasticizer in the manufacturing of automobiles and automobile parts (ECHA 2012; Environment Canada 2014). For the general population, indirect exposure (e.g., off-gassing) is considered a relevant source. Tran et al (2007) and Chi et al (2017) reported BBP as being present in air in vehicles in Vietnam (range: 3.59 to 121 ng/m3, median: 5.2 ng/m3, mean: 31 ng/m3) and China (mean: 3401 ng/m3), respectively. Albar et al. (2017) reported BBP in dust (range: 0.23-19.5 ug/g) from vehicles. However, no Canadian data on this exposure source has been identified, which is currently an uncertainty in the screening assessment.
Food, infant formula and breast milk
In Canada, BBP presence in food was measured in samples from the 2013 Canadian TDS (Cao et al. 2015). BBP was detected in 32 of 159 food composite samples (average MDL = 3.10 ng/g), with a mean concentration of 12.4 ng/g and a range of 1.86 to 82.7 ng/g (Cao et al. 2015). Milk, soft drinks, and fruit juice are the major sources of intake for all population groups. In addition, BBP presence in food was monitored as part of the Canadian Food Inspection Agency’s (CFIA) 2013-2014 and 2014-2015 Food Safety Action Plan (FSAP) surveys (personal communication from the FD, HC, to ESRAB, HC, April 2014; unreferenced). BBP was detected in less than 1% of 1518 (LOD: 0.1 µg/g) packaged and processed food samples at concentrations ranging from 0.3 to 1.9 µg/g, with a mean of the positive samples of 0.75 µg/g. Internationally, BBP has been detected in food and beverages (Sajid et al. 2016; Li et al. 2016; Yang et al. 2017; Giovanoulis et al. 2018).
Additionally, breast milk was monitored as part of the MIREC study. BBP was not detected in any samples (n=305; MDL=0.00741 µg/g; personal communication from the FD, HC, to ESRAB, HC, October 2014; unreferenced). Internationally, BBP was detected in breast milk from one study in Sweden (Högberg et al. 2008) and not detected in another study in Germany (Fromme et al. 2011). However, BBP readily metabolizes to MBzP in the human body (Koch and Calafat 2009; Frederiksen et al. 2011), and as a result, BBP, as the parent compound, may not be found in breast milk in high quantities.
MBzP was measured in breast milk as part of the P4 study (n = 56 breast milk samples collected from study participants). It was detected in 34% of breast milk samples, with the median value reported as below the LOD (0.018 µg/L) and the maximum value reported as 0.16 µg/L (Arbuckle et al. 2016, Table S3). Internationally, MBzP has been detected in breast milk (Mortensen et al. 2005; Högberg et al. 2008).
In the P4 study, MBzP was detected in <5% of samples of infant formula (n=23; LOD=0.018 µg/L) (Arbuckle et al. 2016, Table S3). The CFIA surveillance data from the 2013-2014 and 2014-2015 FSAP surveys did not detect BBP (LOD= 0.1 µg/g) in any samples of infant foods (n=44), infant formula (n=59) or infant cereals (n=19). Internationally, BBP was reported to be present in various baby foods in Italy (Russo et al. 2016); however, it was not detected in infant formulas in two European studies (Sørensen 2006; Bradley et al. 2013a).
Using Canadian TDS data, probabilistic estimates of dietary intakes were derived for BBP and results are outlined in Appendix D, Table D-1b (for methodology for estimating probabilistic intakes, see Appendix E). Results for BBP in breast milk and infant formula that were below the LOD (i.e., 0.018 µg/L) were set to half the LOD (Appendix D, Table D-1a).
Ambient air, drinking water and soil
No recent Canadian data were identified for BBP in ambient air. Rudel et al. (2010) measured outdoor air outside homes in the United States (detected in 5% of 43 samples [method reporting limit = 6 ng/m3], median: not reported, maximum: 8.5 ng/m3). Internationally, BBP has been reported in ambient air (Li and Wang 2015). Rudel et al. (2010) was identified as the relevant study for exposure characterization (sampling from North America), and half the method reporting limit (method reporting limit [MRL] = 6 ng/m3) and maximum (8.5 ng/m3) concentrations were used to estimate potential exposures to BBP via ambient air (Appendix D, Table D-1a).
No Canadian data were identified for BBP in drinking water. BBP was analyzed for, but not detected in, Canadian bottled water (MDL: 0.085 µg/L; Cao 2008). Similarly, BBP was not detected in any samples of well water intended to be bottled in Spain (Bono-Blay et al. 2012). Internationally, BBP has been detected in bottled water (Jeddi et al. 2015, Lv et al. 2015; Pourzamani et al. 2017), drinking water (Liu et al. 2015), mineral and soda water (Yang et al.2017) and surface waters (Net et al. 2015, Selvaraj et al. 2015; Niu et al. 2018). It was not detected in any samples of tap water or river water in Spain (Dominguez-Morueco et al. 2014) or in bottled water in Egypt (Zaki et al. 2018). In the absence of Canadian or North American data on levels of BBP in tap water, half the MDL (i.e., 0.085 µg/L) for BBP in bottled water was used to estimate the general population daily intake from drinking water (Cao et al. 2008) in Canada (Appendix D, Table D-1a).
Khosravi and Price (2015) reported various phthalates in agricultural soils in both control and biosolid amended soils collected in Nova Scotia, Canada. BBP was reported at 0.13 ng/g (control soil) and 2.4 ng/g (biosolid amended soil) (Khosravi and Price 2015). Internationally, BBP has been detected in soils (Cheng et al. 2015; Tran et al. 2015; Wang et al. 2015; Li et al. 2016; Skrbic et al. 2016; Wang et al. 2018; Zhao et al. 2018). Conversely, Hongjun et al. (2014) did not detect BBP in any samples of urban, suburban or rural soils in China. The reported concentration of BBP in control agricultural soils (0.13 ng/g; Khosravi and Price 2015) was used to estimate potential exposures to BBP via soil in Canada (Appendix D, Table D-1a).
Products available to consumers
Globally, BBP may also be present in a wide variety of manufactured items, including childcare articles, children’s toys, do-it-yourself (DIY) products, paints, household residual waste plastic, and exercise balls (HPD 1993- ; ECHA 2012; Korfali et al. 2013; AGDH 2015; Pvinenko et al. 2016). In Canada, BBP has also been reported as a plasticizer used in various types of manufactured items (NRC 2012; See Table 2-2; Environment Canada 2014).
Toys and childcare articles
Health Canada has surveyed soft vinyl toys and childcare articles over a number of years for multiple phthalates, including BBP, and it was detected in only one sample from the 2008 survey (below the restricted limit) and has not been detected since (Health Canada 2007, 2009, 2012, 2014, 2018a). BBP was also monitored in toys purchased in Canada, but made elsewhere; it was detected at 0.001% to 0.02% (Stringer et al. 2000). Internationally, BBP was monitored in toys in India (3 of 24 toy samples, all at <0.1%; Johnson et al. 2011) and in New Zealand (0.01-0.031%; Ashworth et al. 2018). .
Currently, Canada (like the United States and the European Union) has regulations in place limiting the amount of certain phthalates (including BBP) in toys and childcare articles (Phthalates Regulations under the Canada Consumer Product Safety Act [Canada 2016]). In Europe, results from the 2016 enforcement project (ECHA 2018) indicated that phthalates had one of the highest non-compliant rates, with 20% of toys in violation of REACH Annex XV11 entry 51 (DEHP, DBP, BBP; ECHA 2018).The United States Consumer Product Safety Commission (US CPSC) recently stated that less than 10% of exposures to BBP for infants and children would result from mouthing of toys and childcare articles (US CPSC CHAP 2014).
Given the regulations in place for BBP in toys and childcare articles in Canada and the lack of detection of BBP in toys and childcare articles reported in Canadian monitoring studies since 2008, exposure is expected to be negligible and oral intakes from mouthing toys and/or childcare articles were not estimated.
Personal care products
On the basis of notifications submitted under the Cosmetic Regulations, BBP is not expected to be present in cosmetics in Canada (personal communication from the CPSD, HC, to ESRAB, HC, July 2015; unreferenced). Internationally, BBP has been detected in various types of personal care productsFootnote 10 (Guo and Kannan 2013; Guo et al. 2013; Bao et al. 2015). In contrast, Liang et al. (2013) did not detect BBP in cosmetics in China. This presence may be due to potential migration from packaging. A summary of recent studies measuring concentrations of BBP in personal care products reported in North America is outlined in Table 9-2.
| Detection frequency and product typesa | Concentration (µg/g) | Reference (country) |
|---|---|---|
| 12% of 41 rinse-off products | ND–0.18 | Guo and Kannan 2013 (United States) |
| 13% of 109 leave-on products | ND–78.3 | Guo and Kannan 2013 (United States) |
| 5% of 20 baby products | ND–0.14 | Guo and Kannan 2013 (United States) |
a Limits of detection: Koniecki et al. 2011 (0.1 µg/g), Guo and Kannan 2013 (0.01 µg/g)
BBP was not reported as used in Canada. The United States reported low detection frequencies (5% to 13%), and the majority of the concentrations in all studies were in the sub-ppm range. Exposure to BBP from personal care products is therefore not considered significant. In addition, NICNAS (AGDH 2015) and US CPSC CHAP (2014) reported that the cosmetic use of BBP is likely to be rare and they did not assess exposure from this source. For that reason, exposure estimates from this source were not generated.
Other products available to consumers
Globally, BBP may be found in paint products (US CPSC CHAP 2014; AGDH 2015). This use has also been reported in Canada (Environment Canada 2014). The US CPSC CHAP (2014) reported that aerosol paints may contribute to >10% of exposure to BBP for adults, infants, toddlers and children.
In addition, BBP may have applications in the production of articles that may come in contact with skin (ECHA 2012; AGDH 2015). However, BBP was reported in only 1 of 35 samples of children’s clothing (Brigden et al. 2013) and in less than 35% of samples of jeans and dermal wipes that account for subsequent rub-off to legs in adults in China (Gong et al. 2016). However, Saini et al. (2016) detected BBP in cotton and polyester fabrics (>90% detection) purchased in the United States. The US CPSC CHAP (2014) did not evaluate dermal exposure to items containing BBP.
However, since exposure to BBP from these uses is considered to be captured by the available Canadian biomonitoring data estimates of exposure were not calculated.
DBP
Biomonitoring
Mono-n-butyl phthalate (MnBP), the major monoester metabolite of DBP, was monitored in the CHMS Cycle 1 (2007-2009; n = 3235, 6-49 years) and Cycle 2 (2009-2011; n = 2555, ages 3-79 years) with 99% detection in all samples (Health Canada 2011b, 2013). Additionally, MnBP was measured as part of the First Nations Biomonitoring Initiative (n=492 for on-reserve and Crown-land populations aged 20 years and over). Urine concentrations for MnBP (geometric mean) were reported to be similar in FNBI samples to those reported in the CHMS Cycle 1 for population aged 20 years and older (AFN 2013).
MnBP was also monitored by Health Canada in three cohort studies: P4, MIREC and the MIREC-CD Plus. All three studies reported high detection frequencies of MnBP (100%, 99% and 100%, respectively; Arbuckle et al. 2016, Table S3; Arbuckle et al. 2014; personal communication from EHSRD, HC, to ESRAB, HC, October 2013, 2014, unreferenced). An additional metabolite of DBP (MHBP) was also monitored and detected at high frequency (92% and 100%, respectively) in the P4 and MIREC-CD Plus studies (personal communication from EHSRD, HC, to ESRAB, HC, October 2013, 2014; unreferenced).
Using the CHMS (Cycle 2), P4, MIREC and MIREC-CD Plus datasets, reverse dosimetry intake estimates were generated as previously described. Biomonitoring intakes are presented in Table 9-3 below (see Appendix C for further information on the methodology).
| Age group | Study | Male/ Female | n | Arithmetic mean | 50th | 75th | 95th |
|---|---|---|---|---|---|---|---|
| 1–4 months | P4 | males and females | 48 | 0.830 | 0.572 | 1.126 | 1.900 |
| 2–3 years | MIREC-CD Plus | males and females | 192 | 1.19 | 0.939 | 1.39 | 2.71 |
| 3–5 years | CHMS | males and females | 519 | 2.4 | 1.7 | 2.5 | 5.3b |
| 6–11 years | CHMS | males | 260 | - | 1.3 | 2.3a | - |
| 6–11 years | CHMS | females | 253 | - | 1.3 | 2.1 | 5.3b |
| 12–19 years | CHMS | males | 255 | 1.4 | 0.85 | 1.4 | 3.2b |
| 12–19 years | CHMS | females | 255 | 0.84 | 0.71 | 1.1 | 1.8 |
| 18+ years | MIREC | females (pregnant) | 1728 | 1.24 | 0.66 | 1.04 | 2.66 |
| 19+ years | P4 | females (pregnant) | 31c | 1.39 | 0.55 | 0.96 | 4.11 |
| 20–49 years | CHMS | males | 290 | 0.86 | 0.58 | 0.9 | 1.8b |
| 20–49 years | CHMS | females | 284 | 0.91b | 0.55 | 0.79 | 0.6b |
| 50–79 years | CHMS | males | 210 | 0.6 | 0.43 | 0.67 | 1.5 |
| 50–79 years | CHMS | females | 216 | 0.69 | 0.51 | 0.72 | 1.7b |
- = No data
a Data for males and females from: P4 and MIREC pregnant women, P4 infants, MIREC-CD Plus children (preliminary results), and CHMS (Cycle 2)
b Use data with caution
c n = 31 women, 542 individual spot samples, women provided multiple urine samples over two visits.
The highest exposed group according to biomonitoring data (all sources, CHMS) is children aged 3 to 5 years, with median and 95th percentile intakes of 1.7 and 5.3 µg/kg bw/day, respectively. For older populations, the highest exposed group (all sources, P4) is pregnant women (aged 19 years and over), with median and 95th percentile intakes of 0.55 and 4.11 µg/kg bw/day, respectively.
Environmental media and food
The subpopulation with the highest exposure to DBP from environmental media and food consisted of children (aged 0.5 to 4 years), with total daily intakes of 0.88 and 2.96 µg/kg bw/day estimated on the basis of central tendency and upper-bounding concentrations, respectively (Appendix D, Table D-2a).
Indoor air and dust
DBP was measured in indoor air in Canadian homes in Ottawa and Toronto (detected in 100% of 51 homes, range: 15.6-885 ng/m3, median: 105 ng/m3, mean: 155 ng/m3; Health Canada. 2017). Another study measured DBP in indoor air in 75 Canadian homes (median: 200 ng/m3, range: 130- 1100 ng/m3;Zhu et al. 2007). DBP has also been measured in indoor air in homes in the United States and internationally (Blanchard et al. 2014; Lin et al. 2014; Takeuchi et al. 2014; Tran and Kannan 2015; Bu et al. 2016; Luongo et al. 2016; Tran et al. 2017; Wei et al. 2017; Giovanoulis et al. 2018). The higher Canadian indoor air concentrations from Zhu et al. (2007) (median: 200 ng/m3 and maximum: 1100 ng/m3) were conservatively used to estimate the general population daily intake of DBP from indoor air in Canada (Appendix D, Table D-2a).
DBP was surveyed in the CHDS and was detected in 99% of 126 homes sampled across Canada (range: ND–1392 µg/g, median: 16.8 µg/g, 95th percentile: 95.4 µg/g; Kubwabo et al. 2013). In addition, DBP was measured in dust sampled from Canadian homes in Ottawa and Toronto, ON, Canada (detected in 100% of 51 homes, range: 1.9-872 µg/g, median: 8.8 µg/g, mean: 50.6 µg/g; Health Canada. 2017). Internationally, DBP has also been reported in house dust (Dodson et al. 2015; Luongo and Östman 2015; Bu et al. 2016; He et al. 2016; Luongo et al. 2016; Subedi et al. 2017; Giovanoulis et al. 2018).
The CHDS (Kubwabo et al. 2013) was identified as the key study for exposure characterization, since it was representative of homes across Canada. The median (16.8 µg/g) and 95th percentile (95.4 µg/g) concentrations were used to estimate the Canadian general population daily intake of DBP from dust (Appendix D, Table D-2a).
DBP has applications as a plasticizer in the manufacturing of automobiles and automobile parts (ECHA 2012; AGDH2013a). For the general population, indirect exposure (e.g., off-gassing) is considered a relevant source. Tran et al (2007) and Chi et al (2017) reported DBP to be present in air in vehicles in Vietnam (range: 2.22 to 145 ng/m3, median 46.7 ng/m3, mean: 57.1 ng/m3) and China (mean: 2690 ng/m3), respectively. Albar et al. (2017) reported DBP in dust (range: 0.49-50 µg/g) from vehicles. However, no Canadian data on this exposure source has been identified, which is currently an uncertainty in the screening assessment.
Food, infant formula and breast milk
In Canada, DBP presence in food was monitored in samples from the 2013 Canadian TDS (Cao et al. 2015). DBP was detected in 44 of 159 food composite samples (average MDL=16.6 ng/g) with a mean concentration of the positive samples of 23.2 ng/g and a range of 6.21 – 208 ng/g (Cao et al. 2015). Milk, soft drinks, bread, and ice cream are the major sources of intake for the overall population. In addition, DBP presence in food was monitored as part of the CFIA 2013-2014 and 2014-2015 FSAP surveys (personal communication from the FD, HC, to ESRAB, HC, April 2014; unreferenced). DBP was detected in 14% of 1518 (LOD: 0.1 µg/g) packaged and processed food samples. DBP concentrations ranged from 0.26 to 4.3 µg/g with a mean concentration of the positive samples of 0.76 µg/g. Internationally, DBP has been detected in food and beverages (Sajid et al. 2016; Li et al. 2016; Yang et al. 2017; Giovanoulis et al. 2018).
MnBP was measured in breast milk as part of the P4 study (n = 31 women, 56 breast milk samples collected from study participants, LOD=0.057 µg/L). It was detected in 100% of breast milk samples, with median and maximum values reported as 0.656 and 5.18 µg/L, respectively (personal communication from EHSRD, HC, to ESRAB, HC, October 2013; unreferenced). Internationally, MnBP has been measured in breast milk in Europe (Fromme et al. 2011).
Breast milk was also monitored as part of the MIREC study. DBP was detected in 21 samples (n=305, median=0.0129 µg/g, range= <MDL-0.030 µg/g, MDL=0.0149 µg/g; personal communication from FD, HC, to ESRAB, HC, October 2014; unreferenced). Internationally, DBP was detected in breast milk from one study in Sweden (Högberg et al. 2008) and Germany (Fromme et al. 2011). However, DBP readily metabolizes to MnBP in the human body (Koch and Calafat 2009) and would therefore not be expected in breast milk in high frequency.
Recently, an analysis of 23 infant formula samples in the P4 study showed 80% detection of MnBP (LOD: 0.057 µg/L, median: 0.299 µg/L, maximum: 1.16 µg/L) (Arbuckle et al. 2016, Table S3). However, measurement of this metabolite in infant formula was affected by high field blank levels (possible contamination; Arbuckle et al. 2016, Table S3); and therefore, was not used to quantify intakes. The CFIA surveillance data did detect DBP in 3 samples of infant foods (n=20, median: ND, 95th percentile: 0.675 µg/g), 12 samples of infant formula (n=32, median: ND, 95th percentile: 1.12 µg/g) and 4 samples of infant cereals (n=7, median: 0.42 µg/g, 95th percentile: 1.79 µg/g; personal communication from the FD, HC, to ESRAB, HC, April 2014; unreferenced). Internationally, DBP has been reported to be present in various baby foods in Italy (Russo et al. 2016) and in infant formulas in Italy and Europe (Cirillo et al. 2015), but not in the United Kingdom (Bradley et al. 2013a).
Using TDS data, probabilistic estimates of dietary intakes for DBP were derived for the Canadian general population and results are outlined in Appendix B, Table B-2b (the methodology for estimating probabilistic intakes is provided in Appendix E). Median (0.656 µg/L) and maximum (5.18 µg/L) values of MnBP (metabolite of DBP) in breast milk measured in the P4 study was used for risk characterization (Appendix D, Table D-2a).
Ambient air, drinking water and soil
No recent Canadian data were identified for DBP in ambient air. Rudel et al. (2010) measured outdoor air outside homes in the United States (detected in 35% of 43 samples [MRL = 7 ng/m3], maximum: 32 ng/m3). Internationally, DBP has been reported in ambient air (Li and Wang 2015). Rudel et al. (2010) was identified as the relevant study for exposure characterization (sampling from North America), and half the MRL (7 ng/m3) and maximum (32 ng/m3) concentrations were used to estimate potential exposures to DBP via ambient air (Appendix D, Table D-2a).
No Canadian data were identified for DBP in drinking water. In Canada, Cao et al. (2008) surveyed phthalates in bottled carbonated and non-carbonated water and detected and quantified DBP in all 11 samples (range: 0.075 – 1.72 µg/L). Internationally, DBP was also detected in bottled water samples (Jeddi et al. 2015; Lv et al. 2015; Pourzamani et al. 2017; Zaki et al. 2018), mineral and soda water (Yang et al.2017), surface waters (Li et al. 2015; Net et al. 2015; Selvaraj et al. 2015; Martins et al. 2016; Li et al. 2017; Ji et al. 2018), and tap water (Liu et al. 2015). In the absence of Canadian and North American data on levels of DBP in tap water, mean (0.357 µg/L) and maximum (1.72 µg/L) concentrations of DBP in bottled non‑carbonated water were used to estimate the general population daily intake from drinking water (Cao et al. 2008) in Canada (Appendix D, Table D-2a).
Khosravi and Price (2015) reported various phthalates in agricultural soils in both control and biosolid amended soils collected in Nova Scotia, Canada. DBP was reported at 0.14 ng/g (control soil) and 1.1 ng/g (biosolid amended) (Khosravi and Price 2015). Internationally, DBP has been detected in soils (Cheng et al. 2015; Tran et al. 2015; Wang et al. 2015). The reported concentration of DBP in control agricultural soils (0.14 ng/g; Khosravi and Price 2015) was used to estimate potential exposures to DBP via soil in Canada (Appendix D, Table D-2a).
Products available to consumers
Globally, DBP may also be present in a wide variety of manufactured items, including childcare articles, children’s toys, DIY products, gloves, household residual waste plastic and exercise balls (HPD 1993- ; Stringer et al. 2000; ECHA 2012; Chao et al. 2013; Korfali et al. 2013; AGDH 2013a; Pvinenko et al. 2016). In Canada, DBP has also been reported as a plasticizer used in various types of manufactured items (NRC 2012; See Table 2-2; Environment Canada 2014).
Toys and childcare articles
Numerous studies have examined the concentrations of DBP in childcare articles and toys (Stringer et al. 2000; Biedermann-Brem et al. 2008; Johnson et al. 2011; Korfali et al. 2013; Ashworth et al. 2018). A summary of DBP reported in toys and childcare articles available in Canada are presented in Table 9-4.
| Detection frequency | Percent content | Reference |
|---|---|---|
| 0 of 27 samples | <0.1% | Health Canada 2018a (Canada) |
| 0 of 117 samples | <0.1% | Health Canada 2014 (Canada) |
| 1 of 62 samples | >0.1% | Health Canada 2012 (Canada) |
| 1 of 38 samples | >0.1% | Health Canada 2009 (Canada) |
| 4 of 72 samples | >0.1% | Health Canada 2007 (Canada) |
Currently, Canada (like the United States and the European Union) has regulations in place limiting the amount of certain phthalates (including DBP) in toys and childcare articles (Phthalates Regulations under the Canada Consumer Product Safety Act [Canada 2016]). In Europe, results from the 2016 enforcement project (ECHA 2018) indicated that phthalates had one of the highest non-compliant rates, with 20% of toys in violation of REACH Annex XV11 entry 51 (DEHP, DBP, BBP; ECHA 2018). The US CPSC recently stated that less than 10% of exposures to DBP for infants and children would result from mouthing of toys and childcare articles (US CPSC CHAP 2014).
Given the regulations in place for DBP in toys and childcare articles in Canada and the lack of detection of DBP in toys and childcare articles reported in Canadian monitoring studies from 2014 onwards, exposure is expected to be negligible and oral intakes from mouthing toys and/or childcare articles were not estimated.
Personal care products
On the basis of notifications submitted under the Cosmetic Regulations, DBP is likely to be present in cosmetics in Canada, specifically nail polishes (personal communication from the CPSD, HC, to ESRAB, HC, July 2015; unreferenced).
Koniecki et al. (2011) reported DBP in cosmetics purchased in Canada, including hair sprays, mousses, nail polishes, skin cleansers and baby shampoos. Internationally, DBP has been detected in various types of personal care products (Guo and Kannan 2013; Guo et al. 2013; Liang et al. 2013). A summary of recent studies measuring concentrations of DBP in personal care products reported in North America is outlined in Table 9-5.
| Detection frequency and product typesa | Concentration (µg/g) | Reference (country) |
|---|---|---|
| 8% of 85 fragrance, haircare and deodorant products | ND-36 | Koniecki et al. 2011 (Canada) |
| 7% of 69 nail polish, lotion and skin cleanser products | ND-24304 | Koniecki et al. 2011 (Canada) |
| 2% of 98 baby products | ND-1.8 | Koniecki et al. 2011 (Canada) |
| 17% of 41 rinse-off products | ND-0.69 | Guo and Kannan 2013 (United States) |
| 39% of 109 leave-on products (including nail polishes) | ND-27400 | Guo and Kannan 2013 (United States) |
| 20% of 20 baby products | ND-0.22 | Guo and Kannan 2013 (United States) |
a Limits of detection: Koniecki et al. 2011 (0.1 µg/g), Guo and Kannan 2013 (0.01 µg/g)
Given that the North American studies report that detection frequencies are low (2% to 8% in Canada, 17 to 39% in US) and the majority of the concentrations in all three studies are in the sub-ppm range, exposure from personal care products are not considered significant. The exception is nail polishes, as both North American studies showed high concentrations of DBP in nail polishes (Koniecki et al. 2011 and Guo and Kannan 2013). In addition, the US CPSC CHAP (2014) indicated that nail polish as a product type would likely contribute to >10% of exposure to DBP, and NICNAS (AGDH 2013a) reported that this type of product was most likely to contain the highest amount of DBP. Therefore, estimates of dermal exposure from nail polishes as a worst-case representative scenario are presented in Table 9-6.
| Product type | Concentration (µg/g) | Intake (µg/kg bw/day) |
|---|---|---|
| Nail polish | Mean: 5280; Max: 27400b | Mean:0.16; Max: 0.83 |
a Applied a 10% dermal absorption factor. See Appendix H in Environment Canada, Health Canada 2015b for approach to characterizing dermal absorption to medium-chain phthalates.
b Guo and Kannan 2013
Estimates of exposure to DBP from nail polishes were 0.16 and 0.83 µg/kg bw/day for mean and maximum concentrations, respectively.
Other products available to consumers
Globally, DBP may be found in paint products (AGDH 2013a). This use has also been reported in Canada (Environment Canada 2014). In addition, DBP may have applications in the production of articles that may come in contact with skin (ECHA 2012; AGDH 2013a; Environment Canada 2014). DBP was reported in 23 of 35 samples (<3.0-120 mg/kg) of children’s clothing (Brigden et al. 2013). It was also reported to be present in jeans and to subsequently rub-off to legs (as measured via dermal wipes) in adults in China (Gong et al. 2016) and to be present in cotton and polyester fabrics (>90% detection) purchased in the United States (Saini et al. 2016). DBP is also found as a non-medicinal ingredient in 1 topical licensed natural health product in Canada (LNHPD modified 2018). It has also been reported in traditional medicines in China and Western medicines in the United States (Jia et al. 2017). The US CPSC CHAP (2014) did not evaluate dermal exposure to items containing DBP.
Exposure to DBP from these uses is considered to be captured by the available Canadian biomonitoring data, therefore estimates of exposure were not calculated.
DEHP
Biomonitoring
Several metabolites of DEHPFootnote 11 were monitored in the CHMS Cycle 1 (2007–2009, 6-49 years, n = 3235, MEHP MEOHP, MEHHP) and Cycle 2 (2009-2011, 3-79 years, n = 2498, MEHP, n = 2562, MEOHP, n = 2561, MEHHP) with >99% detection in all samples (Health Canada 2011b, 2013). Additionally, these metabolites were measured as part of the First Nations Biomonitoring Initiative (n=492 for on-reserve and Crown-land populations aged 20 years and over). Urine concentrations for MEHP, MEHHP and MEOHP (geometric means) were all reported to be statistically lower in FNBI samples than those reported in CHMS Cycle 1 for population aged 20 years and older (AFN 2013).
Metabolites of DEHP were also monitored by Health Canada in three cohort studies: P4 study (monitored 5 metabolites of DEHPFootnote 12 ; Arbuckle et al. 2016, Table S3), MIREC study (monitored 3 metabolites of DEHPFootnote 13 ; Arbuckle et al. 2014) and the MIREC-CD Plus study (monitored 5 metabolites of DEHPFootnote 14 ; personal communication from EHSRD, HC, to ESRAB, HC, October 2013, 2014, unreferenced). All three surveys reported high detection frequencies (> 90%) of all metabolites.
Using the CHMS (Cycle 2), P4, MIREC and MIREC-CD Plus datasets, reverse dosimetry intake estimates were generated as previously described. Biomonitoring intakes are presented in Table 9-7 below (see Appendix C for further information on the methodology).
| Age group | Study | Male/ female | n | Arithmetic mean | 50th | 75th | 95th |
|---|---|---|---|---|---|---|---|
| 1–4 months | P4 | males and females | 48 | 0.81 | 0.42 | 0.69 | 1.4 |
| 2–3 years | MIREC-CD Plus | males and females | 198 | 3.4 | 2.6 | 4.0 | 8.9 |
| 3–5 years | CHMS | males and females | 509 | 5.3 | 4 | 6 | 12b |
| 6–11 years | CHMS | males | 256 | 4.3 | 3 | 4.8 | 12 |
| 6–11 years | CHMS | females | 250 | 3.2 | 2.3 | 3.2 | 8.1b |
| 12–19 years | CHMS | males | 249 | 2.1 | 1.4 | 2.4 | 5.6b |
| 12–19 years | CHMS | females | 250 | 2 | 1.2 | 1.8 | 4 |
| 18+ years | MIREC | females (pregnant) | 1713 | 3.4 | 1.6 | 2.7 | 8.4 |
| 19+ years | P4 | females (pregnant) | 31c | 2.2 | 1.6 | 2.3 | 5.2 |
| 20–49 years | CHMS | males | 284 | 1.6 | 1 | 1.8 | 4.9b |
| 20–49 years | CHMS | females | 274 | 1.4 | 1.0 | 1.5 | 2.7 |
| 50–79 years | CHMS | males | 205 | 1.3 | 0.88 | 1.3 | - |
| 50–79 years | CHMS | females | 209 | 1.2 | 0.94 | 1.3 | 2.6 |
- = No data
a Data for males and females from: P4 and MIREC pregnant women, P4 infants, MIREC-CD plus children (preliminary results), and CHMS (Cycle 2)
b Use data with caution
c n = 31 pregnant women, 542 individual spot samples, women provided multiple urine samples over two visits.
The highest exposed group based on biomonitoring data (all sources, CHMS) is children aged 3 to 5 years, with median and 95th percentile intakes of 4.0 and 12 µg/kg bw/day, respectively. For older populations (19 years and over), the highest exposed group (all sources, MIREC) is pregnant females aged 18 years and over, with median and 95th percentile intakes of 1.6 and 8.4 µg/kg bw/day, respectively. However, the higher exposure estimates for pregnant women relative to non-pregnant women could be a result of multiple factors (different populations sampled, different sample sizes, etc.) as the results were obtained from different studies. Therefore a correlation between pregnancy and higher DEHP levels cannot be made.
Environmental media and food
The subpopulation with the highest exposure to DEHP from environmental media and food consisted of children (aged 0.5 to 4 years), with total daily intakes of 10.45 and 27.57 µg/kg bw/day estimated on the basis of central tendency and upper-bounding concentrations, respectively (Appendix D, Table D-3a).
Indoor air and dust
DEHP was measured in indoor air in Canadian homes in Ottawa and Toronto (detected in 100% of 51 homes, range: 5.55-1409 ng/m3, median: 30.4 ng/m3, mean: 148 ng/m3; Health Canada 2017). Another study measured DEHP in indoor air in 75 Canadian homes (median: 88 ng/m3, range: 8.8-2100 ng/m3; Zhu et al. 2007). DEHP has also been measured in indoor air in homes in the United States and internationally (Blanchard et al. 2014; Lin et al. 2014; Takeuchi et al. 2014; Tran and Kannan 2015; Bu et al. 2016; Luongo et al. 2016; Tran et al. 2017; Wei et al. 2017; Martinez et al. 2018; Giovanoulis et al. 2018). The higher Canadian indoor air concentrations from Zhu et al. (2007) (median: 88 ng/m3 and maximum: 2100 ng/m3) were conservatively used to estimate the general population daily intake of DEHP from indoor air in Canada (Appendix D, Table D-3a).
DEHP was surveyed in the CHDS and was detected in 100% of 126 homes sampled across Canada (range: 35.9 –3836 µg/g, median: 462 µg/g, 95th percentile: 1880 µg/g) (Kubwabo et al. 2013). In addition, DEHP was measured in dust sampled from Canadian homes in Ottawa and Toronto, ON, Canada (detected in 100% of 51 homes, range: 69-2070 µg/g, median: 218 µg/g, mean: 282 µg/g; Health Canada. 2017). Internationally, DEHP has also been reported to be present in house dust (Dodson et al. 2015; Luongo and Östman 2015; Bu et al. 2016; He et al. 2016; Luongo et al. 2016; Tran et al. 2016; Subedi et al. 2017).
The CHDS (Kubwabo et al. 2013) was identified as the key study for exposure characterization, since it was representative of homes across Canada. The median (462 µg/g) and 95th percentile (1880 µg/g) concentrations were used to estimate the Canadian general population daily intake of DEHP from dust in Canada (Appendix D, Table D-3a).
DEHP has applications as a plasticizer in the manufacturing of automobiles and automobile parts (AGDH 2010; ECHA 2012; Environment Canada 2014a). For the general population, indirect exposure (e.g., off-gassing) is considered a relevant source. Tran et al (2007) and Chi et al (2017) reported DEHP as being present in air in vehicles in Vietnam (range: 81 to 670 ng/m3, median 241 ng/m3, mean: 313 ng/m3) and China (mean: 5289 ng/m3), respectively. Albar et al. (2017) reported DEHP in dust (range: 62-2446 µg/g) from vehicles. However, no Canadian data on this exposure source has been identified, which is currently an uncertainty in the screening assessment.
Food, infant formula and breast milk
In Canada, DEHP presence in food was measured in samples from the 2013 Canadian TDS (Cao et al. 2015). DEHP was detected in 111 of 159 food composite samples (average MDL=39.0 ng/g) with a range of concentrations from 14.4 to 714 ng/g (Cao et al. 2015). Milk, fruits and vegetables are the major sources of intake for all population groups over 1 year of age. Infant formula is the major source of intake for infants under the age of 1 year.
Regarding fruits and vegetables, detectable levels of DEHP (i.e., concentrations above the LOD) were found in most of the composite samples (Cao et al. 2015). The source of DEHP in fruit and vegetable samples is unclear, but could be linked to their packaging. For example, some fruits or vegetables may have been packaged in plastic. Furthermore, certain composite samples included canned or jarred products where coatings and gaskets on jar lids may be potential sources of DEHP in foods. Environmental contamination and agricultural practices are other possible contributors to DEHP residues in fruits and vegetables. Nonetheless, the DEHP results for composite fruit and vegetable samples from the 2013 TDS are considered unusual and unlikely to represent the frequency and magnitude of DEHP concentrations that are typically found in these types of foods (personal communication from FD, HC, to ESRAB, HC, April 2016; unreferenced). Health Canada’s FD also analyzed composite fruit and vegetable samples from the 2014 TDS in order to further understand the distribution of DEHP concentrations in fruits and vegetables sold in Canada.Footnote 15 Relative to the 2013 TDS data, the 2014 TDS results detected DEHP approximately twofold less frequently in fruit and vegetable composite samples (68% in 2013 versus 30% in 2014). In addition, the mean concentrations in positive samples from 2014 are more than 5 times lower than those from the 2013 TDS samples (61 µg/kg in the 2014 versus 331 µg/kg in 2013). Therefore, the dietary exposures estimates presented herein, which are based only on the 2013 TDS results, are expected to overestimate actual dietary exposure to DEHP (personal communication from FD, HC, to ESRAB, HC, April 2016; unreferenced).
DEHP presence in food was also monitored as part of the CFIA 2013-2014 and 2014-2015 FSAP surveys (personal communication from FD, HC, to ESRAB, HC, April 2014; unreferenced). DEHP was detected in 8% of 1518 (LOD: 0.05 µg/g) packaged and processed food samples. DEHP concentrations ranged from 0.27 to 76.2 µg/g, with a mean of the samples of 2.09 µg/g. Internationally, DEHP has been detected in food and beverages (Sajid et al. 2016; Li et al. 2016; Yang et al. 2017; Giovanoulis et al. 2018).
Breast milk was monitored as part of the MIREC study. DEHP was detected in 23 samples (n=305, mean of positives=0.0977 µg/g, range= <MDL-0.236 µg/g, average MDL=0.0668 µg/g; personal communication from FD, HC, to ESRAB, HC, October 2014; unreferenced). Internationally, DEHP has been detected in breast milk in Sweden (Högberg et al. 2008) and Germany (Fromme et al. 2011), but was not detected in Italy (Guerranti et al. 2013). However, DEHP readily metabolizes to multiple metabolites in the human body (Koch and Calafat 2009) and would therefore not be expected to be found in breast milk in high quantities.
Three metabolites of DEHPFootnote 16 were measured in breast milk as part of the P4 study (n = 56 breast milk samples collected from study participants). MEHP, MEHHP and MEOHP were detected in 100, 16 and 8% of breast milk samples, respectively (Arbuckle et al. 2016, Table S3). LODs were reported to be 0.1, 0.019 and 0.017 µg/L, respectively. The median and maximum reported levels of MEHP were 1.26 and 17.05 µg/L, respectively (Arbuckle et al. 2016, Table S3). Internationally, MEHP has also been detected in breast milk in Europe (Mortensen et al. 2005; Högberg et al. 2008; Fromme et al. 2011; Guerranti et al. 2013).
Recently, an analysis of 23 infant formula samples in the P4 study showed 90% detection of MEHP (LOD: 0.1 µg/L) and 8% detection of MEHHP (LOD: 0.019 µg/L). Median and maximum values of MEHP were reported as 0.469 and 2.154 µg/L, respectively. MEOHP was not detected (LOD: 0.017 µg/L) (Arbuckle et al. 2016, Table S3). However, measurement of these metabolites in infant formula was affected by high field blank levels (possible contamination; Arbuckle et al. 2016, Table S2) and therefore was not used to quantify intakes. The CFIA surveillance data did detect DEHP in 1 sample of infant cereal (n=7). It was not detected in any samples of infant formula (n=32) or infant foods (n=20) (personal communication from FD, HC, to ESRAB, HC, April 2014; unreferenced). Internationally, DEHP has been reported to be present in various baby foods in Italy (Russo et al. 2016) and in infant formulas in Italy, the UK and Europe (Sørensen 2006; Bradley et al. 2013a; Cirillo et al. 2015).
Using TDS data, probabilistic estimates of dietary intakes for DEHP were derived for the Canadian general population. The results are outlined in Appendix D, Table D-3b and the methodology for estimating probabilistic intakes is provided in Appendix E. Median (1.26 µg/L) and maximum (17.05 µg/L) values of MEHP (metabolite of DEHP) in breast milk measured in the P4 study were used for exposure characterization (Appendix D, Table D-3a). Note that exposure estimates based on food intake are significantly higher than those based on biomonitoring results (see Table 9-7 and Table D-3b). This is expected to be due to detection of frequent and elevated concentrations of DEHP in highly consumed foods from the 2013 TDS, such as certain fruits and vegetables, as previously discussed.
Ambient air, drinking water and soil
No Canadian data were identified for DEHP in ambient air. Internationally, DEHP has been reported in outdoor air (Li and Wang 2015). Rudel et al. (2010) measured outdoor air outside homes in the United States (detected in 14% of 43 samples [MRL= 40 ng/m3], median: not reported, maximum: 230 ng/m3). Rudel et al. (2010) was identified as the relevant study for exposure characterization (sampling from North America), and half the MRL (40 ng/m3) and maximum (230 ng/m3) concentrations were used to estimate potential exposures to DEHP via ambient air (Appendix D, Table D-3a).
No Canadian data were identified for DEHP in drinking water. In Canada, Cao et al. (2008) surveyed phthalates in bottled carbonated and non-carbonated water and detected and quantified DEHP in all 11 samples (range: 0.052 to 0.338 µg/L). Internationally, DEHP was also detected and quantified in bottled water (Jeddi et al. 2015; Pourzamani et al. 2017; Zaki et al. 2018), mineral and soda water (Yang et al.2017), drinking water (Liu et al. 2015), and surface waters (Li et al. 2015; Net et al. 2015; Selvaraj et al. 2015; Martins et al. 2016; Li et al. 2017). In the absence of Canadian and North American data on levels of DEHP in tap water, mean (0.102µg/L) and maximum (0.338 µg/L) DEHP concentrations in bottled non‑carbonated water were used to estimate the general population daily intake from drinking water (Cao et al. 2008) in Canada (Appendix D, Table D-3a).
Khosravi and Price (2015) reported various phthalates in agricultural soils in both control and biosolid amended soils collected in Nova Scotia, Canada. DEHP was reported at 0.06 ng/g (control soil) and 4.3 ng/g (biosolid amended) (Khosravi and Price 2015). DEHP has also been detected in soils internationally (Cheng et al. 2015; Tran et al. 2015; Wang et al. 2015a; Skrbic et al. 2016; Li et al. 2016; Zhang et al. 2016; Wang et al. 2018). The reported concentration of DEHP in control agricultural soils (0.06 ng/g; Khosravi and Price 2015) was used to estimate potential exposures to DEHP via soil in Canada (Appendix D, Table D-3a).
Products available to consumers
Globally, DEHP may be present in a wide variety of manufactured items, including childcare articles, children’s toys, DIY products, electronics, textiles, household residual waste plastic and gloves (HPD 1993- ; Stringer et al. 2000; AGDH 2010; US CPSC 2010; ECHA 2012; Chao et al. 2013; Korfali et al. 2013; Pvinenko et al. 2016). In Canada, DEHP has also been reported as a plasticizer used in various types of manufactured items (NRC 2012; See table 2-2; Environment Canada 2014).
DEHP may be found in paint products (AGDH 2010). The use has also been reported in Canada (Environment Canada 2014).
Globally, DEHP may have applications in the production of articles that may come in contact with skin (HPD 1993- ; AGDH 2010; ECHA 2012; NRC 2012; Chao et al. 2013; US CPSC CHAP 2014). The US CPSC CHAP (2014) reported that dermal exposure to items containing DEHP (i.e., play pen, change pad) would contribute to >10% of exposure to DEHP for infants and children. It was also reported in jeans and to subsequently rub-off to legs in adults (as measured via dermal wipes) in China (Gong et al. 2016) and in cotton and polyester fabrics (>90% detection) purchased in the United States (Saini et al. 2016).
Exposure to DEHP from these uses is considered to be captured by the available Canadian biomonitoring data, therefore estimates of exposure were not calculated.
Toys and childcare articles
Numerous studies have examined the concentrations of DEHP in childcare articles and toys (Stringer et al. 2000; Biedermann-Brem et al. 2008; Johnson et al. 2011; Korfali et al. 2013; Ashworth et al.2018; Makkliang et al. 2017). A summary of DEHP reported in toys and childcare articles available in Canada is presented in Table 9-8.
| Detection frequency | Percent content | Reference |
|---|---|---|
| 8 of 27 samples | 0.006-36%a | Health Canada 2018a (Canada) |
| 1 of 117 samples | 6.9% | Health Canada 2014 (Canada) |
| 6 of 62 samples | >0.1-37% | Health Canada 2012 (Canada) |
| 15 of 38 samples | >0.1-54% | Health Canada 2009 (Canada) |
| 33 of 72 samples | >0.1-22.8% | Health Canada 2007 (Canada) |
a Among the eight samples where DEHP was detected, five samples were below the regulatory limit (0.1%) with concentrations of 0.006-0.03% and three samples were above with concentrations of 1.5-36%. For the three samples above the regulatory limit, the Consumer Product Safety Directorate of Health Canada has taken enforcement action to remove those products from the Canadian marketplace.
Currently, Canada (like the United States and the European Union) has regulations in place limiting the amount of certain phthalates (including DEHP) in toys and childcare articles (Phthalates Regulations under the Canada Consumer Product Safety Act [Canada 2016]). In Europe, results from the 2016 enforcement project (ECHA 2018) indicated that phthalates had one of the highest non-compliant rates, with 20% of toys in violation of REACH Annex XV11 entry 51 (DEHP, DBP, BBP; ECHA 2018). The US CPSC recently stated that less than 10% of exposures to DEHP for infants and children would result from mouthing of toys and childcare articles (US CPSC CHAP 2014).
Given the regulations already in place for DEHP in toys and childcare articles in Canada, exposure was not quantified and oral intakes from mouthing toys and/or childcare articles were not estimated.
Personal care products
On the basis of notifications submitted under the Cosmetic Regulations, DEHP is not expected to be present in cosmetics in Canada (personal communication from the CPSD, HC, to ESRAB, HC, July 2015; unreferenced). However, DEHP has been detected in various types of and personal care products in Canada (Koniecki et al. 2011) and internationally (Guo and Kannan 2013; Guo et al. 2013). Liang et al. (2013) did not detect DEHP in cosmetics in China. DEHP has also been reported in some fragrance products (0-46ppm; Not too Pretty 2015). This presence may be due to potential migration from packaging. A summary of recent studies measuring concentrations of DEHP personal care products reported in North America is outlined in Table 9-9.
| Detection frequency and product typesa | Concentration (µg/g) | Reference (country) |
|---|---|---|
| 5% of 85 fragrance, haircare and deodorant products | ND–521 | Koniecki et al. 2011 (Canada) |
| 4% of 69 nail polish, lotion and skin cleanser products | ND–1045 | Koniecki et al. 2011 (Canada) |
| 1% of 98 baby products | ND–15 | Koniecki et al. 2011 (Canada) |
| 76% of 41 rinse-off products | ND–6.15 | Guo and Kannan 2013 (United States) |
| 66% of 109 leave-on products | ND–135 | Guo and Kannan 2013 (United States) |
| 40% of 20 baby products | ND–8.22 | Guo and Kannan 2013 (United States) |
a Limits of detection: Koniecki et al. 2011 (0.1 µg/g), Guo and Kannan 2013 (0.01 µg/g)
DEHP is on the List of Prohibited and Restricted Cosmetic Ingredients in Canada (Health Canada 2011a) and was not reported as used in Canada (July 2015 email from the CPSD to ESRAB, Health Canada). Additionally, the Canadian study reported that detection frequencies are low (1% to 5%) and a majority of the concentrations in all studies are in the sub-ppm range. Consequently, exposure to DEHP from personal care products and cosmetics is not considered to be significant. Exposure estimates from this source were not generated.
Adult toys
No Canadian use of DEHP in adult toys was reported under the CEPA section 71 industry survey (Environment Canada 2014). Global use patterns suggest that there is potential for use of DEHP in adult toys. DEHP was reported in 8 of 15 adult toys sampled in the EU, with concentrations ranging from 0.73 to 702 mg/g (Bavarian State Ministry of the Environment and Public Health 2012). The Danish Environmental Protection Agency published a report assessing exposure to DEHP from these products and derived intakes of 1.7 and 47 µg/kg bw/day, for normal-case and worst-case exposures, respectively (Nilsson et al. 2006).
Medical devices
Globally, DEHP is reported to be used in medical applications (ECHA 2012). Medical devices may therefore be a potential source of DEHP exposure. Currently, Canada has guidance in place for DEHP in medical devices. However, given the lack of data and uncertainty in quantifying estimates of exposure from medical devices, this exposure source was not quantified and is currently an uncertainty in this screening assessment.
DnHP
No Canadian data were identified for DnHP in air or water. Internationally, DnHP was detected in indoor air in homes in Vietnam (range: nd-1.53 ng/m3; Tran et al. 2017). It was detected in drinking water in Bogota, Colombia (0.01-37 µg/L; Bedoya-Rios et al. 2018).
DnHP was surveyed in the CHDS and was detected in 98% of homes (range: ND–264 µg/g, median: 3.8 µg/g, 95th percentile: 62 µg/g) (Kubwabo et al. 2013). DnHP has also been reported in house dust in the United States (Dodson et al. 2015). The Canadian survey (Kubwabo et al. 2013) was identified as the key study for exposure characterization, and median (3.8 µg/g) and 95th percentile (62 µg/g) concentrations were used to estimate the Canadian general population daily intake of DnHP from dust (Appendix D, Table D-4a). DnHP was also reported to be present in dust in Vietnam (Tran et al. 2016).
No Canadian or North American data were identified for DnHP in soil. DnHP has been detected in 100% of urban (n=17; median=0.018 µg/g, maximum=0.019 µg/g), suburban (n=28; median=0.016 µg/g, maximum=1.227 µg/g) and rural (n=37; median=0.016 µg/g, maximum=0.1 µg/g) soils in China (Hongjun et al. 2014) and elsewhere in China (Li et al. 2016; Zhang et al. 2016). Given the limited data available on DnHP in soil, exposure intakes from this source were not estimated.
No Canadian data for DnHP in foods were found. One US study looked at many phthalates, including DnHP, in a variety of food items (Schecter et al. 2013). Data from this US study were employed to generate dietary exposure estimates using a probabilistic approach (Appendix D, Table D-4b). Internationally, DnHP has been reported to be present in foods in China (Li et al. 2016). However, it was not detected in milk in Saudi Arabia (Sajid et al. 2016).
The subpopulation with the highest exposure from dust and food consisted of infants (0 to 6 months old), with total daily intakes of 0.019 and 0.31 µg/kg bw/day estimated on the basis of central tendency and upper-bounding concentrations, respectively (Appendix D, Table D-4a).
Given the absence of reporting to the CEPA section 71 industry survey (Environment Canada 2014), and the absence of information as to DnHP presence in product databases, general population exposure to DnHP from products available to consumers is expected to be negligible.
DIOP
No data were identified for DIOP in air, water, soil or food; therefore, intakes from these sources were not estimated.
DIOP was surveyed in the CHDS and was detected in 87% of homes (range: ND–1165 µg/g, median: 6.6 µg/g, 95th percentile: 28.6 µg/g) (personal communication from EHSRD, Health Canada, to ESRAB, Health Canada, August 2014; unreferenced). These data were identified as the key study for exposure characterization, and median (6.6 µg/g) and 95th percentile (28.6 µg/g) concentrations were used to estimate the Canadian general population daily intake of DIOP from dust (Appendix D, Table D-5).
In Canada, DIOP has also been reported as a plasticizer used in various types of manufactured items (See Table 5-1; Environment Canada 2014). However, given the low volume of DIOP reported in Canada (See table 4-2), exposure estimates from products available to consumers were not estimated.
The subpopulation with the highest exposure from dust consisted of infants (0 to 6 months old), with total daily intakes of 0.033 and 0.14 µg/kg bw/day estimated on the basis of central tendency and upper-bounding concentrations, respectively (Appendix D, Table D-5).
9.1.3 Long-chain phthalates
For detailed information on long-chain phthalates included in this section, please refer to the SOS report on long-chain phthalates esters (Environment Canada, Health Canada 2015d).
DIDP
Exposure estimates were calculated using biomonitoring results as well as data on DIDP occurrence in dust, food and plastic items. They are presented in the LCP SOS report (Environment Canada, Health Canada 2015d) and summarized below. Recently, DIDP has been reported internationally in soils (Tran et al. 2015), indoor air (Takeuchi et al. 2014; Giovanoulis et al. 2018), dust (Luongo and Östman 2015; Luongo et al. 2016; Giovanoulis et al. 2018), and tap water (Yang et al. 2014). DIDP was also measured in toys and childcare articles above the regulated limit in 10% of toys tested in Europe (ECHA 2018). However, these reported values did not change the exposure estimates presented previously (Environment Canada, Health Canada 2015d).
The highest exposed group according to biomonitoring data (all sources, NHANES) is male children aged 6 to 11 years, with median and 95th percentile intakes of 1.4 and 4.4 µg/kg bw/day respectively. For older populations, the highest exposed group (all sources, NHANES) is adults over 20 years of age, with median and 95th percentile intakes of 0.76 and 4.4 µg/kg bw/day, respectively, for males, and 0.65 and 4.9 µg/kg bw/day, respectively, for females.
The subpopulation with the highest exposure from dust and food consisted of infants (6 months to 4 years old), with total daily intakes of 0.514 and 2.87 µg/kg bw/day estimated on the basis of central tendency and upper-bounding concentrations, respectively. For populations aged 12 years and over, the highest exposed group is adolescents (aged 12 to 19 years), with total daily intakes of 0.075 and 0.726 μg/kg bw/day estimated on the basis of central tendency and upper-bounding concentrations, respectively.
Estimated daily intakes for infants from dermal exposure to DIDP from plastic items, based on lower-end and upper-bounding exposure scenarios, were 0.27 and 2.16 µg/kg bw/day, respectively. For adults exposed to plastic items (females aged 20 years and over), estimated daily intakes, based on lower-end and upper-bounding exposure scenarios, were 0.27 and 0.85 µg/kg bw/day, respectively.
DUP
Exposure estimates were calculated using data on DUP occurrence in dust and plastic items. Since the publication of the LCP SOS report, DUP has been analyzed in foods included in the 2013 Canadian Total Diet Study and was not quantified above the method detection limit (average MDL= 6.97 ng/g; Cao et al. 2015). Exposure estimates for DUP are presented in the LCP SOS report (Environment Canada, Health Canada 2015d) and summarized below.
The subpopulation with the highest exposure from dust consisted of infants (0 to 6 months old), with total daily intakes of 0.0198 and 0.349 µg/kg bw/day estimated on the basis of central tendency and upper-bounding concentrations, respectively. For populations aged 12 years and over, the highest exposed group is adolescents (aged 12 to 19 years), with total daily intakes of <0.001 and 0.004 μg/kg bw/day estimated on the basis of central tendency and upper-bounding concentrations, respectively.
Estimated daily intakes for infants from dermal exposure to DUP from plastic items, derived on the basis of lower-end and upper-bounding exposure scenarios, were 2.7 and 21.6 µg/kg bw/day, respectively. For adults exposed to plastic items (females aged 20 years and over), estimated daily intakes, based on lower-end and upper-bounding exposure scenarios, were 2.7 and 8.5 µg/kg/day, respectively.
9.2 Health effects assessment
As described in detail in the SOS reports (Environment Canada, Health Canada 2015a,b,c,d), critical effects of phthalates (i.e., medium-chain phthalates) consist of adverse effects on the development of the male reproductive system following exposure. The spectrum of effects on male reproductive development has been described as the “rat phthalate syndrome” (RPS) and although primarily studied in rats, it has also been demonstrated in other species. The effects include alterations of feminization parameters (decreased anogenital distance [AGD] in pups and nipple retention [NR] in juveniles), reproductive tract malformations (cryptorchidism [CRY], hypospadias [HYP], testicular pathological changes [TP]) and effects on fertility (sperm counts, motility and quality at adulthood). Similar to the SOS reports, the hazard assessment is structured to present information at three different life stages (gestational exposure [GD0-21], (pre)pubertal-pubertal [PND1-55] and adult [PND55+], with particular focus on the male gender because of the varying degrees of sensitivity at different life stages. When there was limited information or absence of data for a particular phthalate at a specific life stage or exposure period (as it is the case for DMP, DIBP, DMCHP, DBzP, B84P, B79P, CHIBP, BCHP, BIOP, and DUP), read-across was applied based on health effects of the closest analogue(s) (Health Canada 2015). In addition, potential effects of phthalates on humans were evaluated following the same approach as previously described in the SOS reports (Environment Canada, Health Canada 2015a,b,c,d).
9.2.1 Short-chain phthalates
DMP
The SCP SOS (Environment Canada, Health Canada 2015a) summarizes the health effects literature related to DMP and its analogue DEP. No new animal hazard data were identified after the literature cut-off date of the SCP SOS.
Tables 9-10, 9-11 and 9-12 provide critical endpoints and corresponding no-observed-effects level (NOEL) and/or lowest-observed effects level (LOEL) values for DMP, as previously described in SCP SOS (Environment Canada, Health Canada 2015a) that will be used for risk characterization.
| Life stage | Species | Effect (mg/kg-bw/day) | LOEL (mg/kg-bw/day) | NOEL (mg/kg-bw/day) | Reference |
|---|---|---|---|---|---|
| In utero | Rat | No developmental effects observed. No effects on RPS parameters (GD14-PND3) | NA | 750 | Gray et al. (2000); Furr et al. (2014) |
| (Pre)pubertal | Rat (7 d) | A significant decrease in serum and testicular testosterone*, dihydrotestosterone concentrations and ↑ absolute, relative liver weight | 1862 (LOAEL) | N/A | Oishi and Hiraga (1980a) |
| Adult | Rat DEP (F0, 8 wk) | ↓ serum testosterone, transient increases in abnormal and tailless sperm at the mid dose, (not high), ↓ in absolute epididymis, adrenal weights | 1016 | 197 | Fujii et al. (2005) |
*These results are of uncertain adversity since no other effects in testes were noted (no changes in testes weights, no inhibition of spermatogenesis, and no testicular atrophy).
N/A = Not applicable
| Life stage | Species | Effect (mg/kg-bw/day) | LOEL (mg/kg-bw/day) | NOEL (mg/kg-bw/day) | Reference |
|---|---|---|---|---|---|
| In utero | Rat (GD1-20) | LOEL (Maternal) = 2380 (slight ↓body weight). No effects on pups | N/A | 2380 | Hansen and Meyer (1989) |
| (Pre)pubertal | Rat DEP (4 wk) | Systemic LOEL = 1332 ↑relative kidney and liver (2278) weights, no testicular pathology observed | N/A | 2278 | NTP (1995) |
| Adult | Rat DEP (2 yr) | Systemic LOAEL = 743 ↓absolute brain weight, no testicular pathology observed | N/A | 743 | NTP (1995) |
N/A = Not applicable
| Endpoint | Species | Effect | LOAEL (mg/kg-bw/day) | NOAEL (mg/kg-bw/day) | Reference |
|---|---|---|---|---|---|
| Subchronic | Rat (90 days) | Changes in nervous system and renal function in males | 1250 | 200 | Timofieyskaya (1976) |
| Chronic | Rats DEP (2 years) | Small but significant decrease in absolute brain weight in males | 743 | 230 | NTP (1995) |
| Chronic | Mice DEP (2 years) | Decrease in mean body weight in females | 834 | 415 | NTP (1995) |
Evidence in humans
A literature update was also conducted to identify any recent human data for short-chain phthalates. The updated search was focused on reproductive and developmental endpoints in males because these endpoints were identified as critical health endpoints in the SOS reports. Studies were further evaluated and scored for quality using a consistent evaluation metric (Downs and Black 1998). For the health outcomes evaluated (i.e., sex hormone levels, anogenital distance, birth measures, male infant genitalia, preterm birth and gestational age, altered male puberty, gynecomastia, changes in semen parameters, pregnancy loss, and altered time to pregnancy), there was inadequate evidence or no evidence of associations between DMP and the reported outcomes (Table 9-13). More detail is provided in Health Canada (2018c; 2018d) available upon request.
| Outcome | DMP (MMP) |
|---|---|
| Sex hormone levels | IA (10) |
| Anogenital distance | NA (1) |
| Birth measures | NA (4) |
| Male infant genitalia | NA (1) |
| Preterm birth and gestational age | NA (2) |
| Altered male puberty | IA (3) |
| Gynecomastia | NM |
| Changes in semen parameters | IA (7) |
| Pregnancy loss | NA (2) |
| Altered time to pregnancy | IA (1) |
1 The levels of evidence for associations between phthalates of interest and health outcomes are defined as follows (Health Canada 2018c, 2018d):
IA = Inadequate: The available studies are of insufficient quality, consistency or statistical power to permit a conclusion regarding the presence or absence of an association;
NA = No evidence of association: The available studies are mutually consistent in not showing an association between the phthalate of interest and the health outcome measured.
NM = Not measured in studies of quartile 2 and above (See Health Canada [2018c; 2018d] for more details).
() = Number of studies
MMP = Monomethyl phthalate.
9.2.2 Medium-chain phthalates and additional phthalates
9.2.2.1 Medium-chain phthalates
DIBP
The MCP SOS (Environment Canada, Health Canada 2015b) summarizes the health effects literature related to DIBP. While two new animal hazard studies were identified for this phthalate after the literature cut-off date of the MCP SOS (Pan et al. 2017; Wang et al. 2017), neither of these studies would impact the risk characterization as animals in both studies were only exposed to one dose level of 450 mg DIBP/kg-bw/day, which is higher than the no-observed-adverse-effects level (NOAEL) values previously identified for DIBP in the MCP SOS.
Table 9-14 provides critical endpoints and corresponding NOAEL and/or lowest-observed-adverse-effects level (LOAEL) values for DIBP, as previously described in MCP SOS (Environment Canada, Health Canada 2015b), that will be used for risk characterization. DIBP has low systemic toxicity as described in MCP SOS (Environment Canada, Health Canada 2015b); hence, no systemic critical effects were established.
| Life stage during which exposure occurred | Species | Effects | LOAEL (mg/kg-bw/day) | NOAEL (mg/kg-bw/day) | Reference |
|---|---|---|---|---|---|
| In utero (GD12–21) | Rat | ↓AGD, ↓NR, effects on fertility and other RPS effects; decreased testicular testosterone production | 250 | 125 | Saillenfait et al. 2008; Furr et al. 2014 |
| (Pre) pubertal | Rat | ↑apoptotic spermatogenic cells, ↓ testes weight and vimentin filament disorganization in Sertoli cells | 500 | 300 | Zhu et al. 2010 |
| Adult | Rat (DBP) | Testicular pathology, effects on sperm count and motility, and decreased ROW | 500 | 250 | Srivastava et al. 1990a; Zhou et al. 2011c |
DCHP
The MCP SOS (Environment Canada, Health Canada 2015b) summarizes the health effects literature related to DCHP. A literature update identified new developmental and genotoxicity studies, which are summarized in Tables 9-15 and 9-16. In Li et al. (2016), rats were exposed to 0, 10, 100 or 500 mg/kg-bw/day DCHP from GD12-21. The body weight of male pups was significantly reduced in treated animals. DCHP dose-dependently increased abnormal fetal cell aggregation and decreased fetal Leydig cell size, cytoplasmic size and nuclear size at all doses tested. Decreases in AGD and increased incidences of MNGs were noted at 100 mg/kg-bw/day and above. In another study, the authors also examined the effects of in utero DCHP exposure on offspring development (Ahbab and Barlas 2015). Rats were exposed to 0, 20, 100 or 500 mg/kg-bw/day DCHP from GD6-19. Maternal effects were not observed. An increase in resorption was observed in all treated groups. A decrease in AGD and testicular pathological changes were observed starting from 20 mg/kg-bw/day. The LOAELs of these studies are lower than the lowest NOAEL previously identified in the MCP SOS for DCHP (Environment Canada, Health Canada 2015b). As described in the MCP SOS for DCHP, a decrease in AGD was observed at higher doses in both F1 (at 511 mg/kg-bw/day) and F2 (from 107 mg/kg-bw/day) generations in a two-generation study with a NOAEL of 21 mg/kg-bw/day (Hoshino et al. 2005), suggesting transgenerational effects induced by DCHP. The dose level of 16 to 21 mg/kg-bw/day from this two-generation study was also identified as the NOAEL for developmental effects by the Australian National Industrial Chemicals Notification and Assessment Scheme (NICNAS) (AGDH 2008) and the US CPSC CHAP (2014). Different stains of rats were used by Ahbab and Barlas (2015) than by Hoshino et al. (2005) and Li et al. (2016) (Wistar vs Sprague Dawley, respectively). The lowest LOAELs identified for developmental toxicity were 10 to 20 mg/kg-bw/day estimated on the basis of testicular pathological changes from 10 mg/kg-bw/day, reduced AGD, and increased resorption from 20 mg/kg-bw/day (Ahbab and Barlas 2015; Li et al. 2016).
| Strain and species; dose (mg/kg-bw/day); route; duration (reference) CAS RN |
Testosterone levelsa (T, S) | Feminization parametersb | Reproductive tract malformations and/or fertilityc | Other developmental parametersd | Maternal effects |
|---|---|---|---|---|---|
DCHP Sprague Dawley rats; 0, 10, 100, 500; gavage; GD12-21 (Li et al. 2016) |
100 (T) NM (S) | 100 (AGD) NM (NR) NM (PPS) |
NM (CRY) NM (HYP) 10e (TP- ↑ abnormal fetal leydig cell aggregation, ↓ fetal Leydig cell size, cytoplasmic size and nuclear size, ↑ MNGs at 100) NM (FER) |
10e (↓ BW) NM (ROW) NE (FV) NM (EMB) NM (ESV) |
NE |
DCHP Wistar albino rats; 0, 20, 100, 500; gavage; GD6-19 (Ahbab and Barlas 2015) |
NM (T) 100 (S) | 20e, f (AGD) NM (NR) NM (PPS) |
NM (CRY) NM (HYP) 20e (TP- ↑ atrophic and small seminiferous tubules, ↓ no. of germ cells in tubules, cells detach from tubule wall, ↑ Leydig cell clusters) NM (FER) |
20e (↑ BW @ 20, 100) NM (ROW) NE (FV) 20e, f (EMB-resorption) NM (ESV) |
NE |
a Testosterone levels measured (can include quantity/production) at varying days post-birth. T=Testicular testosterone; S=Serum testosterone.
bFeminization parameters can include anogenital distance (AGD), nipple retention (NR), preputial separation (PPS).
cMalformations include: cryptorchidism (CRY), hypospadias (HYP), testicular pathology (TP), including multinucleated gonocytes (MNG), and/or reproductive effects such as fertility (FER) in offspring (sperm number, motility) or reproductive success at adult stage after in utero exposure.
dOther developmental effects include: decreases in overall fetal body weight (BW), decreases in reproductive organ weight (ROW), fetal viability (FV), embryotoxicity (EMB), or on the incidence of external, skeletal or visceral malformations (ESV).
e Lowest dose measured in the study.
f Absolute AGD, AGD relative to BW and AGD relative to cube food of BW at birth were reported in the study and reached statistically significant different from control animals at 20 mg/kg-bw/day (Ahbab and Barlas 2015).
NM = not measured.
NE = no effect observed at the dose range tested. When NE is presented alone in the first four columns of effects, all parameters in the footnote description were measured and no statistically significant effects were observed in the endpoints at the dose range administered.
| Endpoint | Study details | Results | Reference |
|---|---|---|---|
| Genotoxicity (in vivo) | TUNEL assay Species/strain: female Wistar albino rat Route: oral (gavage) Dose and duration: 0, 20, 100 or 500 mg/kg-bw/day during GD6-19 (10/dose) Testicular samples were collected from different life stages (prepubertal PD20, pubertal PD21, adult PD90) of the pups (n=8–10/group). |
Dose-response increase in apoptotic cells was observed in prepubertal and pubertal life stages, but not in the adult life stage | Ahbab et al. 2014 |
| Genotoxicity (in vivo) | Comet assay Species/strain: female Wistar albino rat Route: oral (gavage) Dose and duration: 0, 20, 100 or 500 mg/kg-bw/day during GD6-19 (10/dose) Testicular and blood samples were collected at the adult life stage (PD90) of the pups (n=7–10/group) |
Increase in DNA breakage was only observed in the low doses with no clear dose-response pattern | Ahbab et al. 2014 |
As described in the MCP SOS for DCHP (Environment Canada, Health Canada 2015b), only one limited repeat-dose oral exposure study with DCHP was identified in sexually immature animals. That study was determined to be limited and was not used to characterize risk of DCHP for this life stage. Therefore, results from the two-generation study (Hoshino et al. 2005) described in the MCP SOS were used, particularly observations reported in the F1 males exposed in utero to DCHP through lactation and via diet from PND21 for at least 10 weeks until necropsy. The NOAEL for the reproductive toxicity of DCHP at the prepubertal-pubertal life stage was 18 mg/kg-bw/day in F1 males, based on observed decreases in spermatid head counts and testicular atrophy starting from 90 mg/kg-bw/day. Reduced body weight gain and reduced food consumption were observed in F1 males at 90 mg/kg-bw/day and above. It is recognized that this effect level is conservative as animals had been exposed during early development before the prepubertal-pubertal life stage.
Tables 9-17 and 9-18 provide the critical endpoints and corresponding NOAEL and/or LOAEL values for DCHP that will be used for risk characterization.
| Life stage | Species | Effects | LOAEL (mg/kg-bw/day) | NOAEL (mg/kg-bw/day) | Reference |
|---|---|---|---|---|---|
| In utero | Rat | Testicular pathological changes, decreased AGD and increased resorption | 10–20 | N/A | Ahbab and Barlas 2015; Li et al. 2016 |
| (Pre)pubertal | Rat | Decrease in spermatid head counts, testicular atrophy, reduced body weight gain and reduced food consumption in F1 males | 90 | 18 | Hoshino et al. 2005 |
| Adult | Rat | Slight focal seminiferous tubule atrophy in 1 male at highest dose, with decreased body weight gain | 402 (6000 ppm LOEL) | 80 (1200 ppm) | Hoshino et al. 2005 |
N/A = Not applicable
| Endpoint | Species | Effect | LOAEL (mg/kg-bw/day) | NOAEL (mg/kg-bw/day) | Reference |
|---|---|---|---|---|---|
| Subchronic | Rat (90 days) | Increase in liver weight (females) | 75 | 25 | de Ryke and Willems 1977 |
DMCHP
As described in the MCP SOS (Environment Canada, Health Canada 2015b), DCHP was used as an analogue as no studies examining the potential health effects of DMCHP were identified for any species or gender. No new literature on DMCHP was identified after the literature cut-off date of the MCP SOS. See the above section for a summary of the critical health effects used for this phthalate.
DBzP
The MCP SOS (Environment Canada, Health Canada 2015b) summarizes the health effects literature related to DBzP and its analogue MBzP. No new literature was identified after the literature cut-off date of the MCP SOS. Table 9-19 provides the critical endpoints and corresponding NOAEL and/or LOAEL values for DBzP, as previously described in MCP SOS (Environment Canada, Health Canada 2015b), that will be used for risk characterization.
| Life stage | Species | Effects | LOAEL (mg/kg-bw/day) | NOAEL (mg/kg-bw/day) | Reference |
|---|---|---|---|---|---|
| In utero | Rat (MBzP) | ↓ AGD and ↑cryptorchidism | 250 | 167* (systemic toxicity LOAEL based on ↓food consumption, ↓BW) | Ema et al. 2003 |
| (Pre)pubertal/adult | Rat (MBzP) | ↓ sperm count (20%) | 250 (LOEL) | N/A | Kwack et al. 2009 |
* Maternal toxicity at this dose, but considered not a factor in selection of adverse effects in male offspring.
N/A = Not applicable.
B84P
The MCP SOS (Environment Canada, Health Canada 2015b) summarizes the health effects literature related to B84P and its analogues. No new literature was identified for B84P after the literature cut-off date of the MCP SOS. Tables 9-20 and 9-21 provide the critical endpoints and corresponding NOAEL and/or LOAEL values for B84P, as previously described in MCP SOS (Environment Canada, Health Canada 2015b) that will be used for risk characterization.
| Life stage | Species | Effects | LOAEL (mg/kg-bw/day) | NOAEL (mg/kg-bw/day) | Reference |
|---|---|---|---|---|---|
| In utero | Rat (BBP) | Decreased body weight (F1/F2 males and females) and ↓AGD at birth in F2 males a; ↓ testicular testosterone | 100 | 50 | Aso et al. 2005; Nagao et al. 2000; Tyl et al. 2004; Furr et al. 2014 |
| (Pre) pubertal | Rat (MBzP) | ↓ sperm counts and sperm motility | 250 (LOEL) | N/A | Kwack et al. 2009 |
| (Pre) pubertal | Rat (BBP) | ↓ sperm counts and sperm motility | 500 (LOEL) | N/A | Kwack et al. 2009 |
| Adult | Rat (BBP) | reduced absolute epididymal weight, hyperplasia of the Leydig cells in the testes and decreased spermatozoa in the lumina of the epididymis | 400 | 200 | Aso et al. 2005 |
a A statistically significant increase of AGD in F1 and decreased pup weight on PND0 in F2 female offspring at 100 mg/kg-bw/day and above was also reported.
N/A = Not applicable.
| Endpoint | Species | Effect | LOAEL (mg/kg-bw/day) | NOAEL (mg/kg-bw/day) | Reference |
|---|---|---|---|---|---|
| Subchronic | Rat (3 months) (BBP) | Histopathological changes in the pancreas, gross pathological alterations in the liver and a significant increase in relative kidney weight in male rats | 381 | 151 | Hammond et al. 1987 |
DIHepP
The MCP SOS (Environment Canada, Health Canada 2015b) summarizes the health effects literature related to DIHepP. No new literature was identified after the literature cut-off date of the MCP SOS. Tables 9-22 and 9-23 provide the critical endpoints and corresponding NO(A)EL and/or LO(A)EL values for DIHepP, as previously described in MCP SOS (Environment Canada, Health Canada 2015b), that will be used for risk characterization.
| Life stage | Species | Effects | LOAEL (mg/kg-bw/day) | NOAEL (mg/kg-bw/day) | Reference |
|---|---|---|---|---|---|
| In utero | Rat | Significant reduction in AGD in male F2 pups | 309–750 | 64–168 | McKee et al. 2006 |
| (Pre) pubertal | Rat | Significant reduction in AGD; delayed preputial separation, nipple retention, hypospadias and cryptorchidism in F1 pups | 419–764 | 227–416 | McKee et al. 2006 |
| Adult | Rat | No adverse effects up to the highest dose level tested | N/A | 404–623 | McKee et al. 2006 |
N/A = Not applicable
| Endpoint | Species | Effect | LOAEL (mg/kg-bw/day) | NOAEL (mg/kg-bw/day) | Reference |
|---|---|---|---|---|---|
| Subchronic | Rat | Increased liver and kidney weights with histopathological findings in F0 | 222–716 | 50-162 | McKee et al. 2006 |
| Chronic | Rat | Increased liver and kidney weights associated with centriobular hypertrophy in males and females in F1 | 227–750 | 50-168 | McKee et al. 2006 |
B79P
The MCP SOS (Environment Canada, Health Canada 2015b) summarizes the health effects literature related to B79P and its analogues. New key studies were identified after the literature cut-off date of the MCP SOS, which are described in the following sections and will be used for risk characterization.
Early development: In utero exposure to B79P
Three oral rat studies were found focusing on effects of B79P during development, including one study that was previously described in the MCP SOS. These studies all examined the effects of B79P when administered during gestation in pregnant rats during the fetal masculinization programming window GD15-17. Summaries of the studies are described in Table 9-24 below.
In an industry submitted developmental study, Tyl et al. (2012) exposed Sprague-Dawley rats to B79P via the diet from GD6-20, at target concentrations of 0, 250, 750 or 3750 ppm (reported intakes: 0, 19, 58 and 288 mg/kg-bw/day). There were no effects on maternal body weight, although food consumption was significantly increased in a dose-related manner in the two highest dose groups for the exposure. At necropsy, both absolute and relative liver weights were significantly increased at the highest dose; no adverse effects were observed at histological examination. There was no effect on the mean number of live fetuses per litter or fetal body weight. There were no differences among groups in the incidence (fetal or litter) of either external malformations/variations or of skeletal malformations. Similarly, there were no differences in the total number of malformations (external, visceral, skeletal). The authors concluded that there had been maternal toxicity at the highest dose only, with increased absolute and relative liver weights and “no adverse findings in the prenatal offspring at any dose.” Parameters specific to RPS (AGD, NR, PPS, etc) were not reported.
In a second industry submitted study, Tyl et al. (2013) also conducted a two-generation reproductive toxicity study with Sprague-Dawley rats exposed to B79P at 0, 250, 750, 2500 and 5000 ppm (estimated doses: 0, 19, 56, 188 and 375 for males and 0, 17, 50, 167 and 333 mg/kg-bw/day for females). F0 and F1 male and female rats were exposed for 10 weeks premating and 2 weeks mating. Female rats were also exposed throughout gestation (approximately 3 weeks) and lactation (3 weeks). There were no differences in maternal or offspring lactational parameters or in F1 litter parameters on PND 0-4. No effects were observed in AGD across groups. No differences were observed in acquisition of PPS in F1 males. There was no evidence of effects on mating, production of litters, or litter size. Other parameters specific to RPS, specifically NR, HYP and CRY, were not reported.
In the F2 generation, there were no differences in total litter size, live litter size, live birth ratio, survival ratio, AGD, pup body weight or gross pathology. Relative liver weight was increased in both F2 males. The authors concluded that B79P was “clearly not a reproductive toxicant in either sex” at exposures up to 333–375 mg/kg-bw/day. However, a NOAEL of 50–56 mg/kg-bw/day was assigned for systemic toxicity on the basis of reduced body weights and altered organ weights and organ/body weight ratios, affecting the liver and kidney, which were free from gross and histopathologic changes (Tyl et al. 2013).
| Strain and species; dose (mg/kg-bw/day); route; duration (reference) CAS RN | Testosterone levelsa (T, S) | Feminization parametersb | Reproductive tract malformations and/or fertilityc | Other developmental parametersd | Maternal effects |
|---|---|---|---|---|---|
| B79P SD Rats: 0, 750, 3750, 7500 ppm; est. 0, 50, 250, 500 (diet) GD6 – PND 21 Cited in REACH Dossier; ECHA 2013a | NM | 50e (at PND1 both sexes) (AGD) 250 (at PND21 for males) 500f (NR) NR (PPS) |
50e, f (CRY) 250f (HYP, epispadias) 500 (TP) NM (FER) |
50e (BW @ lactation) NM (ROW) NE (FV) NE (EMB) NR (ESV) |
250 (↑ liver and kidney weights, ↓ body wt) |
| SD Rats: 0, 250, 750, 2500, 5000 ppm; F0 Female intake during gestation est. 0, 17, 50, 167, 333 (diet) 2-gen Tyl et al. (2013) | NM | NE (AGD @PND0) NEg (NR) NE (PPS) |
NM (CRY) NM (HYP) NE (TP-adult) NE (FER) |
167 (BW 11.6%@PND7-14) NE (ROW) NE (FV) NE (EMB) NE (ESV) 177 (OW -↑ rel liver wt) 336 (↓abs brain, spleen, thymus weight) |
17 (↓ body wt gain at this dose only during gestation) 167 (↑relative liver and kidney weights, no histopathological findings) 333 (small ↑ bilateral cortical vacuolation of adrenal glands) |
| SD Rats: 0, 250, 750, 2500, 5000 ppm; F1 Female intake during gestation est. 0, 17, 50, 167, 333 (diet) 2-gen Tyl et al. (2013) | NM | NE (AGD) NM (NR) NM (PPS) |
NM (CRY) NM (HYP) NE (TP) NE (FER) |
NE (BW) NE (ROW) NE (FV) NE (EMB) NE (ESV) 333 (OW - ↑ relative liver weight) |
NE (BW) 167 (↑relative and absolute liver weights, no histopathological findings) 333 (small ↑ bilateral cortical vacuolation of adrenal glands in 2 females) |
| B79P SD Rats: 0, 250, 750, 3750 ppm; est. 0, 16.7, 50, 250 (diet) GD6–20 Tyl et al. (2012) | NM | NM (AGD) NM (NR) NM (PPS) |
NM (CRY) NM (HYP) NM (TP) NM (FER) |
NE (BW) NM (ROW) NE (FV) NE (EMB) NE (ESV) |
50 (↑ food cons) 250 (↑ absolute and relative liver weights (7.6%, no histopathological findings) |
a Testosterone levels measured (can include quantity/production) at varying days post-birth. T=Testicular testosterone; S=Serum testosterone.
b Feminization parameters can include anogenital distance (AGD), nipple retention (NR), preputial separation (PPS).
c Malformations include: cryptorchidism (CRY), hypospadias (HYP), testicular pathology (TP), and/or reproductive effects such as fertility (FER) in offspring (sperm number, motility) or reproductive success at adult stage after in utero exposure.
d Other developmental effects include: decreases in overall fetal body weight at PND 1 (BW), decreases in reproductive organ weight (ROW), fetal viability (FV), embryotoxicity (EMB), or on the incidence of external, skeletal or visceral malformations (ESV). Other organ weights (OW).
e Lowest dose tested in the study.
f CYP, HYP and NR effects were observed on PND21, but not on PND75 where these animals were exposed until PND21 (ECHA 2013b).
g NR result was based the executive summary of the study saying there were no effects in both F1 and F2. No additional info on NR was found in the rest of the report (Tyl et al. 2013).
NM = Not measured.
NE = No effect observed at the dose range tested. When NE is presented alone in the first 4 columns of effects, all parameters in the footnote description were measured and no statistically significant effects were observed in the endpoints at the dose range administered.
Overall, the highest NOAEL identified for developmental toxicity of B79P after gestational exposure was 50 mg/kg-bw/day based on decreased AGD in male pups and increased incidence of epispadias on PND21 observed at the next dose level of 250 mg/kg-bw/day (REACH dossier; ECHA 2013b). A decrease in AGD on PND1 and a slight increase in the incidence of CRY were also observed at 50 mg/kg-bw/day and evidence of retained nipples was observed at 500 mg/kg-bw/day on PND21. It should be noted that there is uncertainty regarding this critical NOAEL as no AGD effect was observed on PND 1 in both F1 and F2 in a recent two-generation reproductive toxicity study up to 333 mg/kg-bw/day (Tyl et al. 2013). Both studies (REACH dossier; ECHA 2013b; Tyl et al. 2013) were conducted using the same strain of rat. No information was provided by Tyl et al. (2013) to explain this discrepancy. The NOAEL for maternal systemic toxicity was considered to be 50 mg/kg-bw/day based on decrease body weight gain during gestation and liver and kidney effects at 250 mg/kg-bw/day (Tyl et al. 2013).
Exposure to B79P at prepubertal-pubertal life stage
In the MCP SOS, the critical effect level for the reproductive toxicity of B79P was based on read across from closest analogues as no studies were identified for this life stage. Since the publication of the MCP SOS report, an unpublished two-generation reproductive toxicity study was submitted by industry as described above; therefore, results from the two-generation study were considered, particularly observations reported in the F1 males that were exposed in utero, through lactation to B79P and via diet until necropsy at PND126 (Tyl et al. 2013).
There were transient reductions on male body weight gain at 2500 ppm (188 mg/kg-bw/day) on PND56-63, but no effects on terminal body weights or body weight gains at the end of treatment (PND126). No effects on reproductive organ weights were observed at any dose, nor were there any histopathological findings reported. No effect on sperm counts or motility; however, a small, statistically significant increase in abnormal sperm was noted at all dose groups (19 mg/kg-bw/day and above), but there were no effects on reproductive performance of F1 males with the exception of a significantly longer precoital interval (p<0.05) at the highest dose (375 mg/kg-bw/day). Changes in abnormal sperm were 1.45, 1.72, 1.96, 1.91, and 2.31% in 0, 19, 56, 188, and 375 mg/kg-bw/day, respectively, which reflect a 16% to 37% increase compared to control. The authors noted these percent abnormal sperm values were within the laboratory’s historical control values for this rat strain and supplier. In addition, these values, although showing a dose-responsive nature, are also within typical ranges for untreated males of this strain in other laboratories (Kato et al. 2006; Matsumoto et al. 2008).
Systemic effects were limited to statistically significant increases in relative liver weights at 56 mg/kg-bw/day and 375 mg/kg-bw/day, but not at 188 mg/kg-bw/day with no histopathological findings. There were no changes in absolute or relative adrenal glands, but observations of small, increased incidences of bilateral cortical vacuolation at the highest dose tested (375 mg/kg-bw/day; 9 males).
There were no differences in offspring lactational parameters. There were no differences in F1 litter parameters on PND 0-4. No differences were observed in AGD across groups. No differences were observed in acquisition of PPS in F1 males.
Overall, the NOEAL for the reproductive toxicity of B79P at the prepubertal-pubertal life stage was 375 mg/kg-bw/day since no adverse health effects were observed at the highest dose level tested in F1 males in the two-generation study by Tyl et al. (2013). The lowest LOEL for systemic effects was 375 mg/kg-bw/day based on small, increased incidences of bilateral cortical vacuolation in adrenal glands in the same above cohort.
Oral exposure to B79P at the mature male adult stage
In the MCP SOS, the critical effect level for the reproductive toxicity of B79P was based on read-across from closest analogues as no studies were identified for this life stage. One industry-submitted two-generation study was available after the literature cut-off date of the MCP SOS.
Reproductive effects from a 14-week exposure of adult F0 males to B79P in diet from the two-generation study described in the section above showed no adverse effects in fertility or reproductive organs (Tyl et al. 2013). A small, statistically significant increase in abnormal sperm was noted at 56 mg/kg-bw/day and above, but there were no effects on sperm count, sperm motility or reproductive performance of F0 males (Table 9-25). Changes in abnormal sperm were 1.35, 1.59, 1.73, 1.95, and 2.16% in 0, 19, 56, 188, and 375 mg/kg, respectively, which reflect a 22% to 38% increase compared to control. The authors noted these percent abnormal sperm values were within the laboratory’s historical control values for this rat strain and supplier. In addition, these values, although showing a dose-responsive nature, are within typical ranges for untreated males of this strain in other laboratories (Kato et al. 2006; Matsumoto et al. 2008). One male in the highest dose group (375 mg/kg-bw/day) developed a misshapen bilateral testes. There was no evidence of effects on mating, production of litters, or litter size.
| Strain and species; dose (mg/kg-bw/day); route; duration (reference) CAS RN | Life stage at the start of dosing (age) | Hormone levelsa (T, S, LH) | Fertilityb | Reproductive tract pathologyc | Other effectsd |
|---|---|---|---|---|---|
| SD male Rats: 0, 250, 750, 2500, 5000 ppm; F0 est. 0, 19, 56, 188, 375 (diet) 14 wks Tyl et al. (2013) | 6-7 weeks | NM | 56 (↑ % abnormal sperm, but no effect on reproduction) | 375 (1 male with bilateral misshapen testes) no histopathological findings | 1) NE (BW) 2) NE (ROW) 3) 188 (ST- ↑ absolute and relative liver weight, relative kidney weight, no histopathological findings) |
a Hormone level can include quantity/production of testicular testosterone (T),serum testosterone (S), or leutinizing hormone (LH).
b Fertility parameters include: sperm number, motility, morphology, viability, stages of spermatogenesis, or reproductive success at adult stage after in utero exposure.
c Reproductive tract pathology includes: any observations based on histopathological examination of the testes such as, but not limited to, multinucleated gonocytes (MNGs), necrosis, hyperplasia, clustering of small Leydig cells, vacuolisation of Sertoli cells, decrease in Leydig cell number, an increase in Leydig cell size, focal dysgenesis, and/or seminiferous tubule atrophy.
d Other effects include: Decreased overall body weight (BW), decreased reproductive organ weight (ROW) and systemic toxicity (ST).
NM = Not measured.
NE = No effect observed at the dose range tested. When NE is presented alone, all parameters in the footnote description were measured and no statistically significant effects were observed in the endpoints at the dose range administered.
Overall, the NOAEL for reproductive toxicity identified for B79P at the adult life stage was 375 mg/kg-bw/day since no adverse health effects were observed at the highest dose level tested in F0 adult male rats in a two generation diet study after 14-week exposure to B79P (Tyl et al. 2013).
Reproductive developmental effects: Oral exposure to B79P in females
In a previously described two-generation study by Tyl et al. (2013), F0 females exhibited a significant increase in absolute and relative liver weights at both 167 and 333 mg/kg-bw/day. There were no differences in maternal or offspring lactational parameters and no differences in F1 litter parameters on PND 0-4. For F1 females, there were no differences in body weight at acquisition of vaginal patency; reproductive performance, fertility and fecundity were equivalent across all groups. There was no evidence of effects upon evidence of mating, production of litters of litter size for the production of F2 offspring. At weaning and termination of the F2 pups on PND 21, F1 females had equivalent vaginal cytology parameters and body weights. Absolute and relative liver weights were increased at 167 and 333 mg/kg-bw/day.
Table 9-26 provides a summary of critical effects for the reproductive and/or developmental effects of B79P which will be used for risk characterization.
| Life stage during which exposure occurred | Species | Effects | LOAEL (mg/kg-bw/day) | NOAEL (mg/kg-bw/day) | Reference |
|---|---|---|---|---|---|
| In utero (GD6–21) | Rat | ↓AGD, ↑ epispadis | 250 | 50 | ECHA 2013a |
| (Pre)pubertal | Rat | No adverse effects at the highest dose level tested | N/A | 375 | Tyl et al. 2013 |
| Adult | Rat | No adverse effects at the highest dose level tested | N/A | 375 | Tyl et al. 2013 |
N/A = Not applicable
For systemic effects, critical effect levels were based on its analogue DINP, as previously described in MCP SOS (Environment Canada, Health Canada 2015b) (Table 9-27).
| Endpoint | Species | Effect | LOAEL (mg/kg-bw/day) | NOAEL (mg/kg-bw/day) | Reference |
|---|---|---|---|---|---|
| Chronic | Rat (DINP) | Increase in absolute and relative liver and kidney weight with increase in histopathological changes in both organs in both male and females | 152-184 | 15-18 | Lington et al. 1997 |
DINP
The DINP SOS (Environment Canada, Health Canada 2015c) summarizes the health effects literature related to DINP. Since the publication of the DINP SOS report, a recent developmental study was identified (Table 9-28). Li et al. (2015b) examined the effects of in utero DINP exposure on offspring development. Rats were exposed to 0, 10, 100, 500 or 1000 mg/kg-bw/day DINP during GD12-21. No maternal toxicity was observed except in one dam at the highest dose level, which died on GD21.5.
Testicular pathological changes in Leydig cells (clusters) were first observed at 10 mg/kg-bw/day and MNGs were observed starting from 100 mg/kg-bw/day. The LOEL of 10 mg/kg-bw/day of this study is lower than the lowest NOAEL (50 mg/kg-bw/day) and LOAEL (159-395 mg/kg-bw/day) (Waterman et al. 2000; Clewell 2011 cited in ECHA 2013; Clewell et al. 2013) identified in the DINP SOS (Environment Canada, Health Canada 2015c). The NOAEL of 50 mg/kg-bw/day was also established by multiple agencies on the basis of the same studies (AGDH 2012; ECHA 2013b; US CPSC CHAP 2014). It should be noted that similar MNGs and Leydig cell clusters effects were observed in Clewell (2011a, 2013) at 250 mg/kg-bw/day and above. At higher dose levels, other RPS-related parameters include decreased serum testosterone levels, decreased AGD, NR, effects in sperm and other histopathological effects in the testes were observed.
Overall, the lowest LOEL identified for developmental toxicity was 10 mg/kg-bw/day based on testicular pathological changes (i.e., MNGs and Leydig cell clusters) observed at the next dose level of 100 mg/kg-bw/day (Li et al. 2015b).
| Strain and species; dose (mg/kg-bw/day); route; duration (reference) CAS RN | Testosterone levelsa (T, S) | Feminization parametersb | Reproductive tract malformations and/or fertilityc | Other developmental parametersd | Maternal effects |
|---|---|---|---|---|---|
| DINP SD rats; 0, 10, 100, 500, 1000; gavage; GD12-21 (Li et al. 2015b) | 1000 (T) NM (S) |
NEf (AGD) (NR) (PPS) |
NM (CRY) NM (HYP) 100f (TP-focal testis dysgenesis, MNGs, ↑ clusters of Leydig cells @ 10) NM (FER) |
10e, NDR (BW) (ROW) NE (FV) NM (EMB) NM (ESV) |
NE (except 1/6 dam @ 1000 died at GD21.5 with all fetuses alive obtained through surgery) |
a Testosterone levels measured (can include quantity/production) at varying days post-birth. T=Testicular testosterone; S=Serum testosterone.
b Feminization parameters can include anogenital distance (AGD), nipple retention (NR), preputial separation (PPS).
c Malformations include: cryptorchidism (CRY), hypospadias (HYP), testicular pathology (TP), including multinucleated gonocytes (MNG), and/or reproductive effects such as fertility (FER) in offspring (sperm number, motility) or reproductive success at adult stage after in utero exposure.
d Other developmental effects include: decreases in overall fetal body weight (BW), decreases in reproductive organ weight (ROW), fetal viability (FV), embryotoxicity (EMB), or on the incidence of external, skeletal or visceral malformations (ESV).
e Lowest dose measured in the study.
f Absolute AGD and AGD adjusted with cube root of pup weight were reported. Frequency of large cell clusters (i.e., >16 cells per cluster) was significantly increased from control (0.16%) to 6%, 11%, 14% and 14% in the 10, 100, 500 and 1000 mg/ kg bw/day groups, respectively (Li et al. 2015b).
NM = Not measured.
NE = No effect observed at the dose range tested. When NE is presented alone, all parameters in the footnote description were measured and no statistically significant effects were observed in the endpoints at the dose range administered.
Table 9-29 provides critical endpoints and corresponding NOAEL and/or LOAEL values for DINP which will be used for risk characterization for reproductive and developmental endpoint.
| Life stage | Species | Effects | LOAEL (mg/kg-bw/day) | NOAEL (mg/kg-bw/day) | Reference |
|---|---|---|---|---|---|
| In utero | Rat | ↑ MNGs, ↑ Leydig cell clusters/aggreation | 100 | 10 (LOEL) | Li et al. 2015b |
| (Pre)pubertal | Rat (castrated) | Decreased absolute seminal vesicle and LABC weights | 500 (LOEL) | 100 (NOEL) | Lee and Koo 2007 |
| Adult | Rat | Reduced relative and absolute reproductive organ weights | 742 (LOEL) | 276 | Moore 1998 |
For other health effects, two neurotoxicity studies were identified (Table 9-30). Table 9-31 provide critical endpoints and corresponding NOAEL and/or LOAEL value for DINP which will be used for risk characterization for systemic effects.
| Endpoint | Study details | Results | Reference |
|---|---|---|---|
| Neurotoxicity | Species/strain: male Kumming mouse Route: oral Dose and duration: 0, 1.5, 15 or 150 mg/kg-bw/day |
LOAEL = 150 mg/kg bw/ day based on reduced body weight gain, impaired cognitive ability in Morris water maze (MWM) test, histological alterations in pyramidal cells in the hippocampus | Peng 2015 |
| Neurotoxicity | Species/strain: male Kumming mouse Route: oral Dose and duration: 0, 0.2, 2, 200 or 200 mg/kg-bw/day |
LOAEL = 20 mg/kg bw/ day based on histopathological alterations in pyramidal cells in the hippocampus, oxidative stress and inflammation in the brain. Impaired cognitive ability was observed in MWM test and anxiety in Open field test at the 200 mg/kg-bw/day. | Ma et al. 2015 |
| Endpoint | Species | Effect | LOAEL (mg/kg-bw/day) |
NOAEL (mg/kg- bw/day) | Reference |
|---|---|---|---|---|---|
| Chronic | Rat (2 years) | Increase in liver and kidney weights, increased peroxisomal enzyme levels and histological changes in both organs | 152-184 | 15-18 | Lington et al. 1997 |
CHIBP, BCHP and BIOP
As described in the MCP SOS (Environment Canada, Health Canada 2015b), no studies examining the potential reproductive/developmental health effects of CHIBP, BCHP and BIOP were identified. An updated literature search conducted after the literature cut-off date of the MCP SOS did not identify any new studies. As described in the exposure assessment, general population exposure to CHIBP, BCHP and BIOP from environmental media and products available to consumers is expected to be negligible. Therefore, risk to human health for this substance is not expected.
Evidence in humans
A literature update was conducted to identify any recent human data for medium-chain phthalates since the publication of the MCP SOS report. The search was focused on reproductive and developmental endpoints in males as these endpoints were identified as critical health endpoints in the SOS reports. Studies were further evaluated and scored for quality using a consistent evaluation metric (Downs and Black 1998). For the health outcomes evaluated (i.e., sex hormone levels, AGD, birth measures, male infant genitalia, preterm birth and gestational age, altered male puberty, gynecomastia, changes in semen parameters, pregnancy loss, and altered time to pregnancy), there was limited evidence of association between DINP and sex hormone levels (Main et al. 2006; Joensen et al. 2012; Mouritsen et al. 2013; Meeker and Ferguson 2014; Specht et al. 2014; Axelsson et al. 2015a; Jensen et al. 2015; Lenters et al. 2015a; Pan et al. 2015) or semen parameters (Joensen et al. 2012; Jurewicz et al. 2013; Specht et al. 2014; Axelsson et al. 2015a; Lenters et al. 2015a; Pan et al. 2015). There was inadequate evidence or no evidence of association for the other medium-chain phthalates in the Phthalate Substance Grouping and the outcomes (Table 9-32). More detail is provided in Health Canada (2018c; 2018d).
| Outcome | DIBP (MIBP) | DCHP (MCHP) | DINP (MINP/MCOP, etc.) |
|---|---|---|---|
| Sex hormone levels | IA (6) | NA (1) | LA (9) |
| Anogenital distance | IA (4) | NM | IA (2) |
| Birth measures | NA (3) | NM | NA (2) |
| Male infant genitalia | NM | NM | NA (2) |
| Preterm birth and gestational age | NA (2) | NM | NA (1) |
| Altered male puberty | IA (1) | NM | NM |
| Gynecomastia | NA (1) | NM | NA (1) |
| Changes in semen parameters | IA (5) | NM | LA (6) |
| Pregnancy loss | IA (3) | NM | NA (1) |
| Altered time to pregnancy | NA (1) | NA (1) | NA (1) |
a The levels of evidence for associations between phthalates of interest and health outcomes are defined as follows (Health Canada 2018c, 2018d):
LA = Limited: Evidence is suggestive of an association between exposure to a phthalate or its metabolite and a health outcome; however, chance, bias or confounding could not be ruled out with reasonable confidence
IA = Inadequate: The available studies are of insufficient quality, consistency or statistical power to permit a conclusion regarding the presence or absence of an association;
NA = No evidence of association: The available studies are mutually consistent in not showing an association between the phthalate of interest and the health outcome measured.
NM = Not measured in studies of quartile 2 and above (See Health Canada [2018c; 2018d] for more details).
() = Number of studies
MIBP = mono-iso-butyl phthalate
MINP = monoisononyl phthalate
9.2.2.2 Additional phthalates
As previously discussed in the CRA approach document (Environment Canada, Health Canada 2015e), additional phthalates identified to have common adverse effects within the RPS as a result of alterations will be considered to be included into the CRA. After both the exposure (see section 6.1) and hazard filters were considered, BBP, DBP, DEHP, DnHP and DIOP were included in the CRA. Reproductive and development effects in males (i.e., RPS-related parameters) of these five additional phthalates were evaluated and summarized in the following sections. The RPS-related parameters were previously described in detail in the MCP SOS (Environment Canada, Health Canada 2015b).
BBP
The MCP SOS (Environment Canada, Health Canada 2015b) summarizes the reproductive and development effects of BBP in section 9.2.8.1, as BBP was identified as an analogue to B84P. Since the literature cut-off date of the MCP SOS, a recent developmental study was identified. Ahmad et al. (2014) examined the effects of in utero BBP exposure on offspring development (Table 9-33). Significant decrease in fetal body weight was observed at 4 to 20 mg/kg-bw/day during development from PND1 to 75. However, the percentage decrease in body weight was 2.5% to 5% compared to untreated control animals. Maternal effects were observed at 4 to 20 mg/kg-bw/day with decrease in maternal body weight and increase in gestation length. RPS effects were observed at 100 mg/kg-bw/day with decrease in serum testosterone level, sperm effects and decrease in reproductive organ weights.
| Strain and species; dose (mg/kg-bw/day); route; duration (reference) | Testosterone levelsa (T, S) | Feminization parametersb | Reproductive tract malformations and/or fertilityc | Other developmental parametersd | Maternal effects |
|---|---|---|---|---|---|
| Albino rats; 0 (untreated), 4, 20, 100; oral; GD14-parturition (up to GD23.5) (Ahmad et al. 2014f) | NM (T) 100 (S) |
NE (AGD) NM (NR) NM (PPS) |
NE (CRY) NM (HYP) NM (TP) 100 (FER-↓ sperm count, ↓ sperm motility, ↑ abnormal sperm) |
4e, f (BW on PND1 and PND21, 20 on PND75) 100(ROW-others- epididymis, prostate) NE (FV) NM (EMB) NM (ESV) |
20f (BW) 4e (↑ gestation length) |
a Testosterone levels measured (can include quantity/production) at varying days post-birth. T=Testicular testosterone; S=Serum testosterone.
b Feminization parameters can include anogenital distance (AGD), nipple retention (NR), preputial separation (PPS).
c Malformations include: cryptorchidism (CRY), hypospadias (HYP), testicular pathology (TP), including multinucleated gonocytes (MNG), and/or reproductive effects such as fertility (FER) in offspring (sperm number, motility) or reproductive success at adult stage after in utero exposure.
d Other developmental effects include: decreases in overall fetal body weight (BW), decreases in reproductive organ weight (ROW), fetal viability (FV), embryotoxicity (EMB), or on the incidence of external, skeletal or visceral malformations (ESV).
e Lowest dose measured in the study.
f Results were based on statistical analysis compared with untreated control. The study also presented data of vehicle control and positive control. Maternal effects were only presented in graphical format in the study (Ahmad et al. 2014).
NE = No effect observed at the dose range tested.
NM = Not measured.
Table 9-34 summarizes the critical endpoints and corresponding NOAEL and/or LOAEL values for BBP which will be used for risk characterization.
| Life stage | Species | Effects | LOAEL (mg/kg-bw/day) | NOAEL (mg/kg-bw/day) | Reference |
|---|---|---|---|---|---|
| In utero | Rat | Decreased body weight (F1/F2 males and females) and ↓AGD at birth in F2 males a; ↓ testicular testosterone | 100 | 50 | Aso et al. 2005; Nagao et al. 2000; Furr et al. 2014 |
| (Pre) pubertal | Rat | ↓ sperm counts (20%) and sperm motility | 500 (LOEL) | N/A | Kwack et al. 2009 |
| Adult | Rat | reduced absolute epididymal weight, hyperplasia of the Leydig cells in the testes and decreased spermatozoa in the lumina of the epididymis | 400 | 200 | Aso et al. 2005; NTP 1997 |
a A statistically significant increase of AGD in F1 and decreased pup weight on PND0 in F2 female offspring at 100 mg/kg-bw/day and above was also reported
N/A = Not applicable
DBP
Early development: in utero exposure
The European Commission classified DBP as a Category 1B reproductive toxicant (presumed human reproductive toxicant) as defined in the EU regulation on classification, labelling and packaging of substances and mixtures (ECHA 2015a).
A literature search identified many studies examining the toxicity of DBP during gestation in rodents. For the purposes of characterizing effects during early male development, only studies in which effects of DBP were observed at doses below 250 mg/kg-bw/day in rats and 500 mg/kg-bw/day in mice following in utero exposure during the masculinization programming window are reported here. Summaries of the studies are described below and in Table 9-35.
Overall, adverse effects in the parameters used to describe RPS in male rat offspring after in utero exposure to DBP include decreased testicular testosterone levels, delayed PPS, decreased AGD, NR, CRY, gross and testicular malformations, and effects on fertility.
A search of the available literature revealed nine studies examining the effects of gestational exposure of DBP during the masculinization programming window in mice. The majority did not examine the parameters used to describe RPS, with only two reporting any testicular pathology and one examining testicular testosterone levels (Marsman 1995; Gaido et al. 2007, Saffarini et al. 2012).
The reproductive-developmental effects of DBP do not appear to be restricted to rodents, as one study was identified in rabbits exhibiting testicular pathological changes and sperm effects (Higuchi et al. 2003). A full summary of the health effects associated with gestational exposure to DBP is summarized in Health Canada 2018b. Table 9-35 presents a list of key studies with effects from gestational exposure to DBP in male offspring.
| Strain and species; dose (mg/kg-bw/day); route; duration (reference) | Testosterone levelsa (T, S) | Feminization parametersb | Reproductive tract malformations and/or fertilityc | Other developmental parametersd | Maternal effects |
|---|---|---|---|---|---|
| Albino rats; 0 (untreated), 2, 10, 50 DBP; oral; GD14-parturition (up to GD23.5) (Ahmad et al. 2014e) | NM (T) NE (S) |
NE (AGD) NM (NR) NM (PPS) |
NE (CRY) NM (HYP) NM (TP) 50 (FER- ↓ sperm count, ↓ sperm motility, ↑ abnormal sperm) |
10 (BW-sig. but <5%) 50 (ROW) NE (FV) NM (EMB) NM (ESV) |
2e (↓BW, ↑ gestational length) |
| SD rats; 0, 0.1, 1, 10, 50, 100 DBP; gavage; GD12-19 (Lehmann et al. 2004) | 50 (T) NM (S) |
NM | NM | NR (BW) NM (ROW) NM (FV) NM (EMB) NM (ESV) |
NR |
| CD(SD)IGS rats; 0, 20, 200, 2000, 10000 ppm, est. 0, 1.5-3, 14-29, 148-291, 712-1372 based on AGDH (2008) DBP; diet; GD15-21 (Lee et al. 2004) | NM | 712-1372 (AGD) 712-1372f (NR) NE (PPS) | NM (CRY) NM (HYP) 148-291 (TP TP- loss of germ cell development, aggregated foci of Leydig cells) 1.5-29 (FER-sig. ↑incidence; 148-291 sig.↑ severity of reduced spermatocyte development) |
712-1372NS (BW) 712-1372 (ROW) NE (FV) NM (EMB) NM (ESV) |
LOEL= 712-1372 (↓ BW) |
| SD rats; 0.1, 1, 10, 30, 50, 100, 500 DBP; gavage; GD12-21 (Boekelheide et al. 2009) | NM | NM | NM (CRY) NM (HYP) 50, 30 (TP) |
NM | NM |
| SD rats; 0, 0.1, 0.5, 1%, est. F1 [Task 4] 0, 52, 256, 509 DBP; diet; “second generation fertility” (F2 pup results) (Wine et al. 1997) | NM | NM | NM | 256 (BW) 509 (ROW) 509 (FV) 509 (EMB) NM (ESV) |
LOEL= 509 (↓ body weight at wk 17) |
| Dutch-belted rabbits; 0, 400 DBP; gavage; GD15-29 (Higuchi et al. 2003) | NM (T) 400g (↓S at 6 weeks only) |
NM | 400g, NS (CRY- 1/17 rabbits) 400g , NS (HYP- 1/17 rabbits) 400g (TP- germinal epithelium loss, semini. epithelium with desquamation or focal vacuolation) 400f (FER- sperm concentration and morphology) |
NE (BW) 400 (ROW- at 12 weeks) NM (FV) NM (EMB) NM (ESV) |
NM |
a Testosterone levels measured (can include quantity/production) at varying days post-birth. T=Testicular testosterone; S=Serum testosterone.
b Feminization parameters can include anogenital distance (AGD), nipple retention (NR), preputial separation (PPS).
c Malformations include: cryptorchidism (CRY), hypospadias (HYP), testicular pathology (TP), and/or reproductive effects such as fertility (FER) in offspring (sperm number, motility) or reproductive success at adult stage after in utero exposure.
dOther developmental effects include: decreases in overall fetal body weight at PND 1 (BW), decreases in reproductive organ weight (ROW), embryotoxicity (EMB), fetal viability (FV), or on the incidence of external, skeletal or visceral malformations (ESV).
e Results were based on statistical analysis compared with untreated control. The study also presented data of vehicle control and positive control. Maternal effects were only presented in graphical format in the study (Ahmad et al. 2014).
f Nipple retention was observed as follows: Number of animals identified (%) were 0, 4, 13, 15, and 100 in controls, 20, 200, 2000, and 10,000 ppm groups (Lee et al. 2004).
g Lowest dose measured in the study.
NE = No effect observed at the dose range tested. When NE is presented alone in the first 4 columns of effects, all parameters in the footnote description were measured and no statistically significant effects were observed in the endpoints at the dose range administered.
NM = Not measured.
NR = Results not recorded (but measurement was stated in the methods and materials).
NS = Not statistically significant.
Overall, the highest NOAEL identified for developmental toxicity of DBP after gestational exposure was 10 mg/kg-bw/day based on effects on fertility (decreased sperm count and motility and increase levels of abnormal sperm) (Ahmad et al. 2014) and a decrease in male offspring testicular testosterone levels at birth at the next dose of 50 mg/kg-bw/day (Lehmann et al. 2004). This NOAEL is supported by evidence from other studies observing decreases in both the tubular and interstitial cell populations and altered seminiferous tubule morphometry along with other mild effects on spermatocyte development at similar dose levels (Lee et al. 2004; Boekelheide et al. 2009). At lower doses, there was a slight reduction in spermatocyte development (1.5-3 mg/kg-bw/day dose range); however, the severity of this effect at this dose was minimal to slight and only minimal at the second higher dose of 14-19 mg/kg-bw/day (Lee et al. 2004). The lowest LOEL for maternal toxicity of DBP was 509 mg/kg-bw/day based on reductions in body weight gain (less than 10%) in exposed dams (Wine et al. 1997). One study in rabbits indicates that DBP has also effects in other species, but it is unknown if these effects would occur at lower doses (Higuchi et al. 2003).
Exposure at prepubertal/pubertal life stages
A literature search identified many studies examining the reproductive toxicity of DBP in young rodents. For the purposes of brevity, only studies where effects of DBP were observed at doses below 500 mg/kg-bw/day in rodents were evaluated in this screening assessment.
Overall, adverse effects in reproductive parameters observed in (pre)pubertal males after short-term exposure to DBP include changes in serum and testicular testosterone levels, histopathological effects in the testes, and potential effects in fertility (spermatogenesis, sperm motility, and number). The majority of studies available used the rat as a model for evaluation, but only within a relatively high dose range (250 to 1000 mg/kg-bw/day) which limits the interpretation of the potential reproductive toxicity of DBP in this species. One study conducted in mice examined effects at lower dose levels and reported RPS effects at dose levels lower than those in rats (Moody et al. 2013). One study was conducted in rabbits reporting evidence of testicular pathology (Higuchi et al. 2003). A full summary of the health effects associated with propubertal/pubertal exposure to DBP is summarized in Health Canada (2018b). Table 9-36 presents a list of key studies with effects from prepubertal/pubertal exposure to DBP in males.
| Strain and species; dose (mg/kg-bw/day); route; duration (reference) | Life stage at the start of study (age) | Hormone levelsa (T, S, LH) | Fertilityb | Reproductive tract pathologyc | Other effectsd |
|---|---|---|---|---|---|
| C57BL/6 mice; 0, 1, 10, 50, 100, 250, 500 DBP; gavage; PND 4-14, 10 days (Moody et al. 2013) |
Prepubertal (PND 4) | NM (T) 500 (S) NM (LH) 500 (FSH) |
10 (delayed spermatogenesis) | 100 (↑ immature Sertoli cell and disorganization) 1e, f (AGD relative to trunk length; 50NDR abs AGD; 500 AGD relative to BW @ PND14) |
NE (BW) 50 (ROW) NP (ST) |
| Wistar rats; 0, 250, 500, 1000 DBP; gavage; 15 days (Srivastava et al. 1990a) | Prepubertal (PND 35) |
NM | 250 e,g (defective spermatogenesis) | 250 e,g (shrunken tubules) | 500 (BW) 500 (ROW) NM (ST) |
| SD rats; 0, 250, 500, 1000, 2000 DBP; gavage; 30 days (Xiao-feng et al. 2009) | Prepubertal (PND 35) |
NM (T) 500 (S) 1000 (↑GC) |
250 (↓ spermatogenic cells, b/c of ↓LC no) | 250 (↓LC number); 500 (histopathological changes in the testes) | NP (BW) 500 (ROW) NM (ST) |
| C57BL/6 mice; 0, 1, 10, 50, 100, 250, 500 DBP; gavage; PND4-8, 3 days (Moody et al. 2013) |
Prepubertal (PND 4) |
NM | NM | 100 (↑ immature Sertoli cell and disorganization) | NE (BW) 500 (ROW) 500 (ST- ↑ heart weight) |
| Dutch-belted rabbits; 0, 400 DBP; gavage; 15 days (Higuchi et al. 2003) | Prepubertal (PND 28) | NM (T) NE (S) NM (LH) |
400e (sperm morphology defects, NE on mating behaviour) | 400 e (TP- germinal epithelium loss, semini. epithelium with desquamation or focal vacuolation, 1/11 (CRY) NP (HYP) | NE (BW) 400 e (ROW- ↓ sex accessory organ at 12 weeks only) 400 e (ST - ↑thyroid weight) |
a Hormone levels can include quantity/production of testicular testosterone (T), serum testosterone (S), leutinizing hormone (LH), glucocorticoid hormone (GC), or follicle stimulating hormone (FSH).
b Fertility parameters include sperm number, motility, morphology, viability, stages of spermatogenesis, or reproductive success at adult stage after in utero exposure.
c Reproductive tract pathology includes: testicular pathology (TP): any observations based on histopathological examination of the testes such as, but not limited to, multinucleated gonocytes/germ cells (MNGs), necrosis, hyperplasia, clustering of small Leydig cells (LC), vacuolisation of Sertoli cells, decrease in Leydig cell number, an increase in Leydig cell size, focal dysgenesis, and/or seminiferous tubule atrophy. Anogenital distance (AGD), cryptorchidism (CRY), hypospadias (HYP).
d Other effects include: Decreased overall body weight (BW), decreased reproductive organ weight (ROW) and systemic toxicity (ST).
e Lowest dose tested.
f AGD results were presented in graphical format only (Moody et al. 2013).
g Testis of rats after 250 mg/kg DBP treatment showed approximately 5% shrunken tubules with spongy appearance and defective spermatogenesis (Srivastava et al. 1990a).
NM = Not measured.
NE = No effect observed at the dose range tested. When NE is presented alone, all parameters in the footnote description were measured and no statistically significant effects were observed in the endpoints at the dose range administered.
NDR = No dose relationship.
TPr = Testosterone propionate
NP = Not reported
Overall, the lowest LOEL identified for reproductive toxicity of DBP at the prepubertal-pubertal life stage was 10-50 mg/kg-bw/day based on delayed spermatogenesis in male mice exposed to DBP for 10 days at this dose and above (Moody et al. 2013). At the next dose level of 50 mg/kg-bw/day, significant reduction in absolute AGD was observed on PND14 mice, but the effect was not significant when AGD was measured relative to body weight. An increase in immature Sertoli cell and disorganization was observed at 100 mg/kg-bw/day. No comparison can be made for rats as there were no studies available at similar dose ranges. The lowest dose tested in rats was 250 mg/kg-bw/day with observations of defective spermatogenesis, shrunken tubules, decrease in spermatogenic cells and Leydig cell numbers (Srivastava et al. 1990a; Xiao-feng et al. 2009). The lowest LOEL for systemic toxicity for mice was 500 mg/kg-bw/day based on increased relative heart weight after 3 days of DBP treatment. This effect was lost by 14 days (Moody et al. 2013). One study in rabbits indicates that DBP also effects other species, but it is unknown if these effects would occur at lower doses (Higuchi et al. 2003).
Exposure at the mature male adult stage
The MCP SOS (Environment Canada, Health Canada 2015b) summarizes the health effects of DBP in sexually mature adult rats (PND55+) as DBP was identified as an analogue to DIBP. Since the literature cut-off date of the MCP SOS (Environment Canada, Health Canada 2015b), new literature was identified (Table 9-37). DBP (0, 200, 400 or 600 mg/kg-bw/day) was administered to rats by oral gavage for 15 days (Aly et al. 2015). At the lowest dose level of 200 mg/kg-bw/day, decrease in serum testosterone level, decrease in sperm count, and decrease in sperm motility were observed. In addition, histopathological examination of the testes indicated degeneration with absence of spermatogenic series in the lumen of some seminiferous tubules starting from 200 mg/kg-bw/day. However, the results from this study are limited as systemic effect and clinical signs of the animals were not measured. In another study, adverse effects (testicular pathological changes and effects on sperm) were observed starting from 500 mg/kg bw/day (Nair 2015).
| Strain and species; dose (mg/kg-bw/day); route; duration (reference) | Life stage at the start of dosing (age) | Hormone levelsa (T, S, LH) | Fertilityb | Reproductive tract pathologyc | Other effectsd |
|---|---|---|---|---|---|
| Wistar rat; 0, 200, 400, 600; gavage; 15 days (Aly et al. 2015) | ~13 weeks | NM (T) 200e (↓S) NM (LH) | 200e (↓ sperm count, ↓ sperm motility) | 200e (degeneration with absence of spermatogenic series in the lumen of some seminiferous tubules) | NM (BW) 200e (ROW) NM (ST) |
| Wistar rats; 0, 500, 1000, 1500 DBP; oral; 7 days (Nair 2015) | Adult (age not reported, 120-122 g) | NM | 500e (FER- ↓ sperm density, karyorrhexis in spermatocytes,) | 500e(TP- atrophy of Leydig cells) | NM (BW) NM (ST) NE (ROW) |
a Hormone level can include quantity/production of testicular testosterone (T), serum testosterone (S), or leutinizing hormone (LH).
b Fertility parameters include: sperm number, motility, morphology, viability, stages of spermatogenesis, or reproductive success after mating.
c Reproductive tract pathology includes: any observations based on histopathological examination of the testes such as, but not limited to, multinucleated gonocytes (MNGs), necrosis, hyperplasia, clustering of small Leydig cells, vacuolisation of Sertoli cells, decrease in Leydig cell number, an increase in Leydig cell size, focal dysgenesis, and/or seminiferous tubule atrophy.
d Other effects include: Decreased overall body weight (BW), decreased reproductive organ weight (ROW) and systemic toxicity (ST).
e Lowest dose measured in the study.
NM = Not measured.
NE = No effect observed at the dose range tested. When NE is presented alone, all parameters in the footnote description were measured and no statistically significant effects were observed in the endpoints at the dose range administered.
Table 9-38 provides critical endpoint and corresponding NOAEL and/or LOAEL value for DBP reproductive and/or developmental effects in mature adult male rats.
| Life stage | Species | Effects | LOAEL (mg/kg-bw/day) | NOAEL (mg/kg-bw/day) | Reference |
|---|---|---|---|---|---|
| Adult | Rat | Testicular pathology, effects on sperm count, density, and motility, and decreased ROW | 500 | 250 | Srivastava et al. 1990b; Zhou et al. 2011c; Nair 2015 |
DEHP
Early development: in utero exposure
The European Commission classified DEHP as a Category 1B reproductive toxicant (presumed human reproductive toxicant) as defined in the EU regulation on classification, labelling and packaging of substances and mixtures (ECHA 2015b).
A literature search identified many studies examining the toxicity of DEHP during gestation in rodents. For the purposes of the CRA, only studies covering the masculinization programming window where effects of DEHP were observed at doses at and below 50 mg/kg-bw/day in rats and 100 mg/kg bw/day in mice were evaluated in this screening assessment.
Overall, adverse effects in the parameters used to describe RPS in male rat offspring after in utero exposure to DEHP include decreased serum and testicular testosterone levels, delayed PPS, AGD, increase incidences of NR and CRY, gross testicular malformations, and effects in fertility. A full summary of the health effects associated with gestational exposure to DEHP is summarized in Health Canada (2018b). Table 9-39 presents a list of key studies with effects from gestational exposure to DEHP in male offspring.
| Strain and species; dose (mg/kg-bw/day); route; duration (reference) | Testosterone levelsa (T, S) | Feminization parametersb | Reproductive tract malformations and/or fertilityc | Other developmental parametersd | Maternal effects |
|---|---|---|---|---|---|
| Crl:CD BR SD rats; 1.5 (Con), 10, 30, 100, 300, 1000, 7500, 10000 ppm (est. F0 : 0.12, 0.78, 2.4, 7.9, 23, 77, 592, 775); diet; 6 weeks prior to mating – PND35 of last of three litters (Wolfe and Layton 2003) | NM | 592 (AGD) NE (NR) 592 (PPS) |
592 (CRYe) NP (HYP) 23 (TP- low incidence of small and/or aplastic epididymis and testes, small seminal vesicle, minimal seminiferous tubule atrophy; small prostate @ 77) 592 (FER- ↓ sperm measured); 775 (FER- ↓ epididymal sperm density) | 775 (BW) 592 (ROW- in adults) 592 (FV) NM (EMB) NM (ESV) |
LOEL= 592 (↑ absolute and relative liver weights, relative kidney weight, ↑ food consumption during gestation, ↓ food consumption during lactation) |
| Crl:CD BR SD rats; 1.5 (Con), 10, 30, 100, 300, 1000, 7500, 10000 ppm (est. F1 : 0.09, 0.48, 1.4, 4.9, 14, 48, 391, 543); diet; 6 weeks premating – PND35 of last of three litters (Wolfe and Layton 2003) | NM | 391 (AGD) NE (NR) 0.48 (PPS) |
1.4 (CRYe) NP (HYP) 14 (TP- low incidence of small and/or aplastic epididymis and testes; seminiferous tubule atrophy at 391) 4.9NDR (FER- abnormal sperm morphology); 391 (FER- ↓ sperm, ↓ motile percentage, ↓ epididymal sperm density) | 391 (BW) 391 (ROW- in adults) 543 (FV- no offspring) 543 (EMBe) NM (ESV) |
LOEL= 391 (↑ absolute and relative liver weights and ↑ food consumption) |
| Crl:CD BR SD rats; 1.5 (Con), 10, 30, 100, 300, 1000, 7500 ppm (est. F2: 0.1, 0.47, 1.4, 4.8, 14, 46, 359); diet; 6 weeks premating – PND35 of last of three litters (Wolfe and Layton 2003) | NM | 359 (AGD) 359 (NR) 359 (PPS) |
359 (CRYe) NP (HYP) NP (TP) 359 (FER- ↓ sperm, ↓ epididymal sperm density) | NE (BW) 359 (ROW- in adults) NP (FV) 359 (EMBe) NM (ESV) |
LOEL= 359 (↑ absolute and relative liver weights, ↑ food consumption) |
| Wistar rats; 0, 3, 10, 30, 100, 300, 600, 900; gavage; GD7-PND16 (Christiansen et al. 2010) | NM | 10 (AGDf) 10 (NRf) NM (PPS) |
NM (CRY) NM (HYP) 300 (TP- immature testes, delayed seminiferous epithelium development, focal Leydig cell hyperplasia, ↓ seminiferous tubule diameter, ↓ germ cells) NM (FER) | 300 (BW) 10 (ROWf) 10NDR (FV) NM (EMB) NM (ESV) |
NE |
| Wistar rats; 0, 0.015-1.215; 5, 15, 45, 135, 405; gavage; GD6-PND21 (Andrade et al. 2006a, b) | NE (T- PND1) 0.045NDR (↑ S) |
0.015e (↑), 405 (↓) (AGD- PND22) 405 (NR) 15 (PPS) |
5g (CRY) NE (HYP) 135 (TP- MNG, ↓ germ cell layers); 405 (TP- ↓ germ cell differentiation in seminiferous tubules, ↓ tubule diameter, ↓ lumen) 15g (FER- ↓ sperm pro, 25%); 0.045 (FER- ↑ abnormalitiesNDR) | 0.045NDR (↑ BW, PND1) 5 (↑ ROWg transient) NE (FV) NE (EMB) NM (ESV) |
NE |
aTestosterone levels measured (can include quantity/production) at varying days post-birth. T=Testicular testosterone; S=Serum testosterone.
bFeminization parameters can include anogenital distance (AGD), nipple retention (NR), preputial separation (PPS).
cMalformations include: cryptorchidism (CRY), hypospadias (HYP), testicular pathology (TP), including multinucleated gonocytes (MNG), and/or reproductive effects such as fertility (FER) in offspring (sperm number, motility) or reproductive success at adult stage after in utero exposure. TTM = transabdominal testicular migration
dOther developmental effects include: decreases in overall fetal body weight (BW), decreases in reproductive organ weight (ROW), fetal viability (FV), embryotoxicity (EMB), or on the incidence of external, skeletal or visceral malformations (ESV).
e CRY was based on significant delay in testes descent. EMB was based on an additional crossover mating trial conducted using the 7500 and 10000 ppm males and females (Wolfe and Layton 2003).
f the effect levels for AGD and NR were based on 1 set out of 2 sets of experiments. Similar effects were observed at higher dose level in the other set of experiment. The effect level for ROW was based on combining the results of the 2 sets of experiments (Christiansen et al. 2010).
g CRY was based on undescended (ectopic) testes observed in three animals, exposed to either 5, 135 and 405 mg/kg-bw/day (one case in each dose). In all three cases, undescended testes were unilateral (right side) and located in the superficial inguinal pouch. The ROW effect level reported by author was adjusted for body weight by covariance analysis (Andrade et al. 2006a,b).
NDR =No dose response relationship.
NP = Not reported.
NM = Not measured.
NE = No effect observed at the dose range tested. When NE is presented alone in the first 4 columns of effects, all parameters in the footnote description were measured and no statistically significant effects were observed in the endpoints at the dose range administered.
Overall, the highest NOAEL identified for developmental toxicity of DEHP after gestational exposure was 4.8 mg/kg-bw/day based on small and/or aplastic epididymis, testicular pathology and other RPS effects observed in F1 and F2 at the next dose level of 14 mg/kg-bw/day in a multigenerational reproductive toxicity study (Wolfe and Layton 2003; Blystone et al. 2010). This effect level was also established by other jurisdictions (European Commission 2008; Danish EPA 2012; US CPSC CHAP 2014; EFSA 2005). At similar dose levels of 10-15 mg/kg-bw/day, decreases in AGD, increased NR, decreased reproductive organ weights, and delayed PPS were observed in rat offspring in other studies (Andrade et al. 2006a,b; Christiansen et al. 2010). The lowest NOEL for maternal toxicity of DEHP was 359 mg/kg-bw/day based on increase in liver weight and food consumption.
Exposure at prepubertal/pubertal life stages
A literature search identified many studies examining the reproductive toxicity of DEHP in young rodents. Results from repeated-dose oral exposure studies in sexually immature rats (PND1–55) have shown that administration of DEHP can cause reproductive effects in male rats.
Overall, adverse effects observed in (pre)pubertal males after short-term exposure to DEHP include changes in serum and testicular testosterone levels, histopathological effects in the testes, and potential effects in fertility (spermatogenesis, sperm motility, and number). Reproductive effects observed in prepubertal or pubertal mice after exposure to DEHP occurred at higher doses than rats. Other species were also found to be less sensitive than rats to DEHP. No significant effects were observed in Cynomolgus monkeys, marmosets and Syrian hamsters treated with DEHP. A summary of the health effects associated with prepubertal/pubertal exposure to DEHP is summarized in Health Canada (2018b). Table 9-40 presents key studies with effects from prepubertal/pubertal exposure to DEHP in males.
| Strain and species; dose (mg/kg-bw/day); route; duration (reference) | Life stage at the start of dosing (age) | Hormone levelsa (T, S, LH) | Fertilityb | Reproductive tract pathologyc | Other effectsd |
|---|---|---|---|---|---|
| SD rats; 0, 10, 100, 1000, 2000 (fatal); gavage; 5 days (Dostal et al. 1988) | Prepubertal (PND21) | NM (T) NM (S) NM (LH) |
NM | 1000 (loss of spermatocytes in Sertoli cell cytoplasm, degenerating spermatocytes) | 1000 (BW-sig. @ 10, NS @ 100) 100 (ROW) NM (ST) |
| SD rats; 0, 200, 500, 1000; gavage; 5 days (fertility group mated at 8-15 wks (mated to F344)) (Dostal et al. 1988) | Postnatal (PND6) | NM | 200e (↓ spermatid heads at 13 weeks of age; @ 1000 at 19 weeks of age) | 500 (↓ Sertoli cell number 24h after last dose) | 1000(BW-24h after last dose) 500 (ROW-24h after last dose) NM (ST) |
| SD rats; 0, 300, 600; gavage; 21 days (Cammack et al. 2003) | Postnatal (PND3-5) | NM | NE (PND90) | 300 (PND25; testicular changes, such as partial depletion of the germinal epithelium and/or decreased diameter of the seminiferous tubules) Less severe @PND 90 | 600 (BW) 300 (ROW- PND25, PND 90) 300 (ST-↑ rel. liver weight) |
| Wistar rats; 0, 1, 3, 10, 30, 100, 300; gavage; 40 days (Tonk et al. 2012)f | Prepubertal (PND10) | NM (T) 3.9(↓S –BMDL5) 14 (↑LH- BMDL5) |
9.5 (sperm count) (BMDL5) | 300f (TP- lesions; sertoli cell vacuolization) | NE (BW) 84 (ROW – BMDL5) 4.4 (ST-↑ rel. liver weight – BMDL5) |
| Wistar rats; 0, 1, 3, 10, 30, 100, 300; gavage; 40 days (Tonk et al. 2012)f | Pubertal-adult (PND50) | NM (T) 3.9 (S-BMDL5) 62 (LH- BMDL5) |
55 (BMDL5, sperm count) | 300f (TP- lesions; sertoli cell vacuolization) | NE (BW) 517 (ROW BMDL5) 4.4 (ST-↑ rel. liver weight – BMDL5) (ST) |
a Hormone levels can include quantity/production of testicular testosterone (T), serum testosterone (S), leutinizing hormone (LH), glucocorticoid hormone (GC), or follicle stimulating hormone (FSH).
b Fertility parameters include sperm number, motility, morphology, viability, stages of spermatogenesis, or reproductive success at adult stage after in utero exposure.
c Reproductive tract pathology includes: testicular pathology (TP): any observations based on histopathological examination of the testes such as, but not limited to, multinucleated gonocytes/germ cells (MNGs), necrosis, hyperplasia, clustering of small Leydig cells (LC), vacuolisation of Sertoli cells, decrease in Leydig cell number, an increase in Leydig cell size, focal dysgenesis, and/or seminiferous tubule atrophy.
d Other effects include: Decreased overall body weight (BW), decreased reproductive organ weight (ROW) and systemic toxicity (ST).
e Lowest dose measured in the study.
f Data were represented as 5% lower confidence bound of benchmark dose (BMDL5). In juvenile males, preputial separation was delayed at the 300 mg/kg bw dose group. Testicular pathological changes were only examined at the 300 mg/kg-bw/day dose group (Tonk et al. 2012).
NM = Not measured.
NE = No effect observed at the dose range tested. When NE is presented alone, all parameters in the footnote description were measured and no statistically significant effects were observed in the endpoints at the dose range administered.
Overall, the highest NOAEL identified for reproductive toxicity of DEHP at the prepubertal-pubertal life stage was 10 mg/kg-bw/day based on a significant decrease in absolute testis weight at the next dose level of 100 mg/kg-bw/day in rats exposed to DEHP for 5 days from PND21 (Dostal et al. 1988). At 200 mg/kg-bw/day, a decrease in spermatid heads was observed at 13 weeks of age in rats exposed for 5 days from PND6 (Dostal et al. 1988). Testicular pathological changes were observed at 300 mg/kg-bw/day and higher in rats exposed to DEHP for 21 days from PND3-5 (Cammack et al. 2003) and rats exposed for 40 days from PND10 or PND50 (Tonk et al. 2012).
Exposure at the mature male adult stage
Studies examining the potential reproductive toxicity of DEHP at the adult male life stage (PND55+) were identified in rats, mice, marmosets and ferrets.
In rats, chronic exposure to DEHP (104 weeks to 2 years) resulted in inhibition of spermatogenesis starting from 10-29 mg/kg-bw/day (Ganning 1991; David et al. 2000a). In animals treated for less than a chronic duration (2-13 weeks), inhibition of spermatogenesis, decreased sperm count and decrease in sperm motility was observed at 300-900 mg/kg-bw/day (Poon et al. 1997; Wolfe and Layton 2003; Kwack et al. 2009; Tonk et al. 2012; Abd-Ellah et al. 2016). Decrease in testis weight and testicular pathological changes were generally observed at 300 mg/kg-bw/day and above.
Adult mice, ferrets, and marmosets were found to be less sensitive than rats to DEHP. Systemic effects in mice such as a decrease in relative kidney weight and an increase in absolute liver weight were observed at 99 mg/kg-bw/day whereas effects on sperm and testicular pathological changes were observed at 292 mg/kg-bw/day in a chronic study (David et al. 2000b). In ferrets, testicular pathological changes, decreases in body weight and increases in liver weight were observed at a much higher dose level of 1200 mg/kg-bw/day (Lake et al. 1976). In marmoset, only peroxisome proliferator-activated receptor (PPAR) effects in liver were observed at 500 mg/kg-bw/day (Kurata et al. 1998). A summary of the health effects associated with adult life stage exposure to DEHP is summarized in Health Canada (2018b). Table 9-41 presents key study with effects from adult life stage exposure to DEHP in males.
| Strain and species; dose (mg/kg-bw/day); route; duration (reference) | Life stage at the start of dosing (age) | Hormone levelsa (T, S, LH) | Fertilityb | Reproductive tract pathologyc | Other effectsd |
|---|---|---|---|---|---|
| Fischer 344 rats; 0, 100, 500, 2500, 12500 ppm (est. 0, 5.8, 28.9, 146.6, 789); diet; 104 weeks (David et al. 2000a) | 6 weeks | NM (T) NM (S) NM (LH) |
28.9 (↓spermatogenesis) | ↓interstitial cell tumors of testes at 789 | 789 (BW- ↓ from wk 1) 789 (ROW) 146.6 (ST- ↑ rel/abs. kidney, liver weight, ↑ rel. lung weight; 789 – liver and kidneye histopath effects, pancreas,↑pituitary castration cells) ↑spongiosis hepatis at 146.6 and 789) |
a Hormone level can include quantity/production of testicular testosterone (T), serum testosterone (S), or leutinizing hormone (LH).
b Fertility parameters include: sperm number, motility, morphology, viability, stages of spermatogenesis, or reproductive success after mating.
c Reproductive tract pathology includes: any observations based on histopathological examination of the testes such as, but not limited to, multinucleated gonocytes (MNGs), necrosis, hyperplasia, clustering of small Leydig cells, vacuolisation of Sertoli cells, decrease in Leydig cell number, an increase in Leydig cell size, focal dysgenesis, and/or seminiferous tubule atrophy.
d Other effects include: Decreased overall body weight (BW), decreased reproductive organ weight (ROW) and systemic toxicity (ST).
e Other systemic effects include: chronic progressive nephropathy observed in all male groups with increased severity at 789 mg/kg-bw/day. Significant ↑ of hyperplasia and adenomas of pancreas in males only at 789 mg/kg-bw/day (David et al. 2000a).
NM = Not measured.
Overall, the highest NOAEL identified for reproductive toxicity of DEHP at the adult life stage was 5.8 mg/kg-bw/day based on a decrease in spermatogenesis at the next dose level of 29 mg/kg-bw/day in male adult rats exposed chronically to DEHP for 104 weeks (David et al. 2000a).
DnHP
Early development: in utero exposure
The European Commission classified DnHP as a Category 1B reproductive toxicant (presumed human reproductive toxicant) as defined in the EU regulation on classification, labelling and packaging of substances and mixtures (ECHA 2015c).
A literature search identified a number of recent studies examining the toxicity of DnHP during gestation in rodents. For the purposes of the CRA, only studies covering the masculinization programming window in males were evaluated in this screening assessment.
Overall, adverse effects in the parameters used to describe RPS in male rat offspring after in utero exposure to DnHP include decreased serum and testicular testosterone levels, delayed PPS, AGD, retention of nipple/areolae (NR), increase incidences of CRY and hypospadias, gross testicular malformations, and effects in fertility. Two studies were conducted in mice where embryotoxicity and effects on fetal viability were observed. A summary of the health effects associated with gestational exposure to DnHP is summarized in Health Canada (2018b). Table 9-42 presents a list of key studies with effects from gestational exposure to DnHP in male offspring.
| Strain and species; dose (mg/kg-bw/day); route; duration (reference) | Testosterone levelsa (T, S) | Feminization parametersb | Reproductive tract malformations and/or fertilityc | Other developmental parametersd | Maternal effects |
|---|---|---|---|---|---|
| SD rats; 0, 5, 20, 50, 100, 125, 250, 500, 625; gavage; GD12-19 (Saillenfait et al. 2013a) | 20 (T- ↓ by 17% on GD19; ED50= 67.4 mg/kg) NM (S) |
NM (AGD) NM (NR) NM (PPS) |
NM (CRY) NM (HYP) 500e (TP- abnormal distribution of Leydig cells on GD19, ↓ number of Leydig cell clusters, ↑ size of Leydig cell clusters, other effects) NM (FER) |
NM (BW) NM (ROW) NM (FV) NM (EMB) NM (ESV) |
NP |
| Wistar rats; 0, 20, 100, 500; oral gavage; GD6-19 (Ahbab and Barlas 2015) | 20f (↓T:450 pg/ml testosterone compared to control, p < 0.05) | 20f (↓AGD/cube root of body weight ratio, control at approx. 2.4 mm/g1/3 and 20 mg/kg/day at approx. 2.0 mm/g1/3, p < 0.05) | NM (CRY) NM (HYP) 20f (TP – atrophic and small seminiferous tubules, decreased germ cells in tubules, detached cells from tubular wall) NM (FER) |
20f (↓15.9% BW; at 100, ↓20.5% BW; at 500, ↑ 13.6% BW) NM (ROW) NE (FV) 20f (EMB-resorption based on number of offspring, not by percentage) NM (ESV) |
NE |
a Testosterone levels measured (can include quantity/production) at varying days post-birth. T=Testicular testosterone; S=Serum testosterone.
b Feminization parameters can include anogenital distance (AGD), nipple retention (NR), preputial separation (PPS).
c Malformations include: cryptorchidism (CRY), hypospadias (HYP), testicular pathology (TP), including multinucleated gonocytes (MNG), and/or reproductive effects such as fertility (FER) in offspring (sperm number, motility) or reproductive success at adult stage after in utero exposure. TTM = transabdominal testicular migration
d Other developmental effects include: decreases in overall fetal body weight (BW), decreases in reproductive organ weight (ROW), fetal viability (FV), embryotoxicity (EMB), or on the incidence of external, skeletal or visceral malformations (ESV).
e TP was only examined in the control and 500 mg/kg-bw/day dose groups (Saillenfait et al. 2013).
f Lowest dose measured in the study.
NP = Results not recorded (but measurement was stated in the methods and materials).
NM = Not measured.
NE = No effect observed at the dose range tested. When NE is presented alone in the first 4 columns of effects, all parameters in the footnote description were measured and no statistically significant effects were observed in the endpoints at the dose range administered.
Overall, the highest NOAEL identified for developmental toxicity of DnHP after gestational exposure was 5 mg/kg-bw/day based on decreased serum or testicular testosterone levels, decreased AGD at birth in males and testicular pathological changes observed at 20 mg/kg-bw/day or higher in rats (Ahbab and Barlas 2015; Saillenfait et al. 2013a).
Exposure at prepubertal/pubertal life stages
A literature search identified four studies examining the reproductive toxicity of DnHP in young sexually immature rats (PND1–55). These studies were generally tested at high dose levels and did not describe RPS-related parameters other than one study that was tested at lower dose levels using castrated male rats. A summary of the health effects associated with prepubertal/pubertal exposure to DnHP is summarized in Health Canada (2018b). Since available studies were limited, DEHP was identified, using the same chemical categories and read-across approach as that used for other phthalates, as the “closest analogue” phthalate, taking into consideration the similarities in monoester metabolism as well as the length and nature of the ester chains (Health Canada 2015).
As described earlier in the DEHP section, the highest NOAEL identified for reproductive toxicity of DEHP at the prepubertal-pubertal life stage was 10 mg/kg-bw/day based on significant decreases in absolute testis weight at the next dose level of 100 mg/kg-bw/day in rats exposed to DEHP for 5 days from PND21 (Dostal et al. 1988). Therefore, the critical effect level of 10 mg/kg-bw/day will be used to characterize the risk of developmental toxicity of DnHP for this life stage.
Exposure at the mature male adult stage
Two studies examining the potential reproductive toxicity of DnHP at the adult male life stage (PND55+) were identified in rodents. One study was conducted in rats where RPS-related parameters were not measured. Another study was conducted in mice where fertility effects and testicular pathology were examined. A summary of the health effects associated with adult stage exposure to DnHP is summarized in Health Canada (2018b). Table 9-43 presents the key study with effects from exposure to DnHP in adult males.
| Strain and species; dose (mg/kg-bw/day); route; duration (reference) | Age at the start of dosing | Hormone levelsa (T, S, LH) | Fertilityb | Reproductive tract pathologyc | Other effectsd |
|---|---|---|---|---|---|
| COBS Crl : CD-1, (IRC)BR outbred albino mice; 0, 0.3, 0.6, 1.2%; est. 0, 390, 780, 1560 (based on dose conversion by HC 1994); (crossover mating trial and necropsy of highest dose only); oral diet; 7 days premating and 98 days cohabitation (total 105 days exposure) (Lamb et al. 1987) | PND 42 | NM | 390e (↓fertility at mating, litters/pair, live pups/litter, proportion of pups born alive, live pup weight; 780, produced 1 litter; 1560, infertile) 1560f (sperm parameters, ↓ % motile sperm, sperm concentration, % abnormal sperm) |
1560f (extensive atrophy of seminiferous tubules, tubules were lined mostly by Sertoli cells, no normal spermatogenesis observed, in 3 of 18 mice, observed microscopic changes in seminal vesicles | 1560f (↓10.27% BW in F0 male, calculated from 36.19g at 1560 dose compared to 40.33 for control) 1560f (↓ ROW, i.e. left testis and epididymis, right testis, right epididymis, prostate, seminal vesicles) 1560 (ST-↓ liver, kidney and adrenal weight) |
a Hormone levels can include quantity/production of testicular testosterone (T), serum testosterone (S), or leutinizing hormone (LH).
b Fertility parameters include sperm number, motility, morphology, viability, stages of spermatogenesis, or reproductive success after mating.
c Reproductive tract pathology includes: any observations based on histopathological examination of the testes such as, but not limited to, multinucleated gonocytes (MNGs), necrosis, hyperplasia, clustering of small Leydig cells, vacuolisation of Sertoli cells, decrease in Leydig cell number, an increase in Leydig cell size, focal dysgenesis, and/or seminiferous tubule atrophy.
d Other effects include: Decreased overall body weight (BW), decreased reproductive organ weight (ROW) and systemic toxicity (ST).
e Lowest dose tested.
f Reproductive tract pathology, BW and ROW parameters were only examined in the control and the 1560 mg/kg-bw/day dose groups (Lamb et al. 1987).
NM = Not measured.
Overall, no NOAEL was identified and the lowest LOAEL identified for reproductive toxicity of DnHP was 390 mg/kg-bw/day in mice based on adverse effects in fertility (decreases in fertility, the number of litters per pair, the number of live pups per litter and the proportion of pups born alive) treated with DnHP for 105 days during the adult male life stage (Lamb et al. 1987).
DIOP
Early development: in utero exposure
The European Commission classified DIOP as a Category 1B reproductive toxicant (presumed human reproductive toxicant) as defined in the EU regulation on classification, labelling and packaging of substances and mixtures (ECHA 2015d).
Three studies were identified that were all conducted by Saillenfait et al. (2013b) during the masculinization programming window. Adverse effects in the parameters used to describe RPS in male rat offspring after in utero exposure to DIOP included decreased testicular testosterone levels, decreased AGD, increased incidence of NR and CRY, gross testicular malformations, and effects in fertility. A summary of the health effects associated with gestational exposure to DIOP is summarized in Health Canada (2018b). Table 9-44 presents the key study with effects from gestational exposure to DnHP in male offspring.
| Strain and species; dose (mg/kg-bw/day); route; duration (reference) | Testosterone levelsa (T, S) | Feminization parametersb | Reproductive tract malformations and/or fertilityc | Other developmental parametersd | Maternal effects |
|---|---|---|---|---|---|
| DIOP SD Rats; 0, 100, 500, 1000; gavage; GD12-21 (Saillenfait et al. 2013b) | NM | NM (AGD) 1000 (NR @ PND 68-84) NM (PPS) |
1000 (CRY @ PND 68-84) 1000 (HYP @ PND 68-84) 500 (TP-one incidence each of unilaterally enlarged testis, abnormal epididymis, underdeveloped seminal vesicles and prostate) 500 (FER-hypospermatogenesis) | NE (BW) 500 (ROW) 1000 (FV @PND21) NE (EMB) NM (ESV) |
1000 (BW) |
a Testosterone levels measured (can include quantity/production) at varying days post-birth. T=Testicular testosterone; S=Serum testosterone.
b Feminization parameters can include anogenital distance (AGD), nipple retention (NR), preputial separation (PPS).
c Malformations can include cryptorchidism (CRY), hypospadias (HYP), testicular pathology (TP), and/or reproductive effects such as fertility (FER) in offspring (sperm number, motility) or reproductive success at adult stage after in utero exposure. TTM = transabdominal testicular migration.
d Other developmental effects include decreases in overall fetal body weight at PND 1 (BW), decreases in reproductive organ weight (ROW), embryo/fetal viability (FV), average litter size (ALS), or on the incidence of external, skeletal or visceral malformations (ESV).
NM = Not measured.
NE = No effect observed at the dose range tested. When NE is presented alone in the first 4 columns, all parameters in the footnote description were measured and no statistically significant effects were observed in the endpoints at the dose range administered.
Overall, the highest NOAEL identified for developmental toxicity of DIOP after gestational exposure was 100 mg/kg-bw/day based on testicular pathological changes, effects on fertility and decreased testis weight at the next dose level of 500 mg/kg-bw/day. Maternal decrease in body weight was observed at 1000 mg/kg-bw/day (Saillenfait et al. 2013b).
Exposure at prepubertal/pubertal life stages
There were no repeated-dose oral exposure studies in sexually immature animals (PND1-55) with DIOP. DIHepP was identified as the appropriate analogue to use for read across. The MCP SOS (Environment Canada, Health Canada 2015b) summarizes the health effects literature related to DIHepP. Table 9-45 provides the critical endpoints and corresponding NOAEL and/or LOAEL values for DIOP.
| Life stage | Species | Effects | LOAEL (mg/kg-bw/day) | NOAEL (mg/kg-bw/day) | Reference |
|---|---|---|---|---|---|
| (pre)pubertal | Rat (DIHepP) | Significant reduction in AGD; delayed preputial separation, nipple retention, hypospadias and cryptorchidism in F1 pups | 419–764 | 227–416 | McKee et al. 2006 |
| adult | Rat (DIHepP) | No adverse effects observed up to the highest dose level tested | NA | 404–623 | McKee et al. 2006 |
NA = Not applicable
Oral exposure at the mature male adult stage
There were no repeated-dose oral exposure studies in adult animals with DIOP. DIHepP was identified as the appropriate analogue to use for read across. The MCP SOS (Environment Canada, Health Canada 2015b) summarizes the health effects literature related to DIHepP. Table 9-45, described in the above section, provides the critical endpoints and corresponding NOAEL and/or LOAEL values for DIOP.
Evidence in humans
A literature search was conducted to identify any human data for additional phthalates. The search was focused on reproductive and developmental endpoints in males as these endpoints were identified as critical health endpoints in the SOS reports. Studies were further evaluated and scored for quality using a consistent evaluation metric (Downs and Black 1998).
For the health outcomes evaluated (i.e., sex hormone levels, anogenital distance, birth measures, male infant genitalia, preterm birth and gestational age, altered male puberty, gynecomastia, changes in semen parameters, pregnancy loss, and altered time to pregnancy), there was limited evidence of association between DEHP and sex hormone levels (Pan et al. 2006; Meeker et al. 2009; Li et al. 2011; Mendiola et al. 2011, 2012; Joensen et al. 2012; Araki et al. 2014; Ferguson et al. 2014a; Pant et al. 2014; Su et al. 2014; Chang et al. 2015; Fong et al. 2015; Jensen et al. 2015; Pan et al. 2015; Wang et al. 2016), birth measures (Zhang et al. 2009; Philippat et al. 2012; de Cock et al. 2014; Zhao et al. 2014; Lenters et al. 2015b; Xie et al. 2015; Zhao et al. 2015; Casas et al. 2016; Arbuckle et al. 2018Footnote 17 ), or semen parameters (Zhang et al. 2006; Pant et al. 2008; Jurewicz et al. 2013; Huang et al. 2014; Pant et al. 2014; Specht et al. 2014; Axelsson et al. 2015a; Axelsson et al. 2015b; Lenters et al. 2015a; Pan et al. 2015; Wang et al. 2015b; Thurston et al. 2016; Chang et al. 2017; Chen et al. 2017). There was inadequate evidence or no evidence of association between the remaining phthalates and the outcomes (Table 9-46). More detail is provided in Health Canada (2018c; 2018d).
| Outcome |
BBP (MBP, MBzP) | DBP | DEHP (MEHP, MEOHP, MEHHP, MECPP, MCMHP) | DnHP (MnHP) | DIOP |
|---|---|---|---|---|---|
| Sex hormone levels | IA (14) | NA (1) | LA (17) | NM | NM |
| Anogenital distance | NA (5); LA (1) | NM | IA (8) | NM | NM |
| Birth measures | IA (4) | IA (2) | LA (11) | NM | NM |
| Male infant genitalia | NA (1) | NM | IA (3) | NM | NM |
| Preterm birth and gestational age | IA (4) | NM | IA (6) | NM | NM |
| Altered male puberty | NA (2) | NM | IA (4) | NM | NM |
| Gynecomastia | NA (1) | NM | NA (2) | NM | NM |
| Changes in semen parameters | IA (10) | IA (2) | LA (13) | NM | NM |
| Pregnancy loss | NA (3) | NM | IA (4) | NM | NM |
| Altered time to pregnancy | IA (2) | NA (1) | NA (2) | NM | NM |
aThe levels of evidence for associations between phthalates of interest and health outcomes are defined as follows (Health Canada 2018c, 2018d):
LA = Limited: Evidence is suggestive of an association between exposure to a phthalate or its metabolite and a health outcome; however, chance, bias or confounding could not be ruled out with reasonable confidence
IA = Inadequate: The available studies are of insufficient quality, consistency or statistical power to permit a conclusion regarding the presence or absence of an association;
NA = No evidence of association: The available studies are mutually consistent in not showing an association between the phthalate of interest and the health outcome measured.
NM = Not measured in studies of quartile 2 and above (See Health Canada [2018c; 2018d] for more details).
() = Number of studies.
MBP = Monobutyl phthalate.
MBzP = Monobenzyl phthalate.
MCMHP = Mono[2-(carboxymethyl)hexyl] phthalate.
MEHP = Mono(2-ethyl hexyl)phthalate.
MEOHP = Mono(2-ethyl-5-oxohexyl) phthalate.
MEHHP = Mono(2-ethyl-5-hydroxyhexyl) phthalate.
MECPP = Mono(2-ethyl-5-carboxypentyl) phthalate.
MnHP = Mono-h-hexyl phthalate.
9.2.3 Long-chain phthalates
DIDP
The LCP SOS (Environment Canada, Health Canada 2015d) summarizes the health effects literature related to DIDP. No new animal hazard studies were identified after the literature cut-off date of the LCP SOS.
Table 9-47 provides critical endpoints and corresponding NOAEL and/or LOAEL values for DIDP, as previously described in LCP SOS (Environment Canada, Health Canada 2015d).
| Endpoint | Species | Effect | LOAEL (mg/kg-bw/day) | NOAEL (mg/kg-bw/day) | Reference |
|---|---|---|---|---|---|
| Short term | Rat | Increase in liver weight in males accompanied with histological changes at the highest dose | 300 | 300 (females) | BIBRA 1986 |
| Subchronic | Dog | Increase in liver weight accompanied with histological changes. | 75 | 15 | Hazleton Laboratories 1968b |
| Chronic | Rat | Histopathological changes in the liver in males. | 22 | N/A | Cho et al. 2008 |
N/A = Not applicable
DUP
The LCP SOS (Environment Canada, Health Canada 2015d) summarizes the health effects literature related to DUP. No new literature was identified after the literature cut-off date of the LCP SOS. Table 9-48 provides critical endpoints and corresponding NOAEL and/or LOAEL values for DUP, as previously described in LCP SOS (Environment Canada, Health Canada 2015d).
| Endpoint | Species | Effect | LOAEL (mg/kg-bw/day) | NOAEL (mg/kg-bw/day) | Reference |
|---|---|---|---|---|---|
| Short term | Rat | Decreased body weight gain and increased liver and kidney weights accompanied with liver lesions | 1145 | 282 | Barber et al. 1987 |
| Subchronic | Rat (DnOP) | Increases in liver enzyme activities and histological effects in the liver and thyroid | ≤ 350-403 | 37 | Poon et al. 1997 |
Evidence in humans
A literature update was also conducted to identify any recent human data for long-chain phthalates. The search was focused on reproductive and developmental endpoints in males as these endpoints were identified as critical health endpoints in the SOS reports. No information is currently available on the potential reproductive-developmental effects of DUP in humans. Studies identified for DIDP were further evaluated and scored for quality using a consistent evaluation metric (Downs and Black 1998).
For the health outcomes evaluated (i.e., sex hormone levels, anogenital distance, birth measures, male infant genitalia, preterm birth and gestational age, altered male puberty, gynecomastia, changes in semen parameters, pregnancy loss, and altered time to pregnancy), there was no evidence of association between any of the long-chain phthalates evaluated and the outcomes (Table 9-49). More detail is provided in Health Canada (2018c; 2018d).
| Outcome | DIDP (MIDP/MCINP) |
|---|---|
| Sex hormone levels | NA (2) |
| Anogenital distance | NA (1) |
| Birth measures | NA (1) |
| Male infant genitalia | NM |
| Preterm birth and gestational age | NA (1) |
| Altered male puberty | NM |
| Gynecomastia | NM |
| Changes in semen parameteres | NM |
| Pregnancy loss | NA (1) |
| Altered time to pregnancy | NM |
a The levels of evidence for associations between phthalates of interest and health outcomes are defined as follows (Health Canada 2018c, 2018d):
NA = No evidence of association: The available studies are mutually consistent in not showing an association between the phthalate of interest and the health outcome measured.
NM = Not measured in studies of quartile 2 and above (See Health Canada [2018c; 2018d] for more details).
() = Number of studies.
MIDP = Monoisodecyl phthalate.
MCINP = Mono(carboxyisononyl) phthalate.
9.3 Characterization of risk to human health
9.3.1 Short-chain phthalates
DMP
Table 9-50 provides all relevant exposure and hazard values for DMP, as well as resultant margins of exposure (MOEs), for determination of risk, which were previously described in the SCP SOS (Environment Canada, Health Canada 2015a). Overall, the MOEs for DMP are considered to be adequate to account for uncertainties in the exposure and health effect databases.
| Age group and exposure scenario | Central tendency (upper bounding) estimate of exposure (µg/kg bw/day) | Level and basis for NOAEL (mg/kg-bw/day) | MOEd |
|---|---|---|---|
| Children (males) 2–3 years: biomonitoring, MIREC CD Plus | 0.19 (0.66) | NOAEL = 230 (chronic dermal, DEP) Decrease in absolute brain weight in males (NTP 1995) | > 1 million (340 000) |
| Infants 0–6 months, breast milk fed: environmental media and food, oral and inhalation | 0.019 (0.26) | LOAEL = 1862 (pubertal, 7 days oral, DMP) ↓ serum and testicular testosterone, dihydrotestosterone concentrations and ↑ absolute, relative liver weight (Oishi and Hiraga 1980) (no NOAEL) | > 1 million |
| Infants 0–6 months: diaper cream, dermal | 2.7a (8.2)a | NOAEL = 200 (subchronic dermal, DMP) Changes in nervous system and renal function in males (Timofieyskaya 1976) | 74 000 (24 000) |
| Adults (females) 20+ years: biomonitoring, NHANES | 0.027 (0.26) | NOAEL = 415 (chronic dermal, DEP) Decrease in BW of 8% in females (NTP 1995) | > 1 million |
| Adolescents (males) 12–19 years: biomonitoring, NHANES | 0.042 (0.29) | NOAEL = 230 (chronic dermal, DEP) Decrease in absolute brain weight in males (NTP 1995) | > 1 million (790 000) |
| Adolescents 12–19 years: environmental media and food, oral and inhalation | 0.0085 (0.091) | NOAEL = 750 (in utero oral DMP) Highest dose tested for potential RPS effects (Gray et al. 2000; Furr et al. 2014) | > 1 millionb |
| Adults 20+ years: hairspray, dermal | 66ac (200)a | NOEL = 230 (chronic dermal, DEP) Decrease in absolute brain weight in males (NTP 1995) | 3500 (1150) |
| Adults 20+ years: hair dye, dermal | 1400ac (4200)a | NOAEL = 2380 (short term dermal, DMP) slight ↓body weight in dams (Hansen and Meyer 1989) | 1700 (570) |
a External dermal exposure estimates
b This margin is also protective for potential effects of DMP (based on effects observed with DEP) on males of this age group which occur at higher doses.
c Lower-bound estimate: based on minimum concentration
d Margin of exposure: central tendancy and (upper bounding)
9.3.2 Medium-chain phthalates, additional phthalates and CRA
The critical effects of concern of medium-chain phthalates consisted of adverse effects on the development of the male reproductive system following gestational exposure, with a particular focus on RPS-related parameters that were identified in the rat, the most sensitive species. These parameters are considered adverse and relevant for characterizing risk of exposure of the general Canadian population to this subgrouping of phthalates. Please see MCP SOS (Environment Canada, Health Canada 2015b) for a general summary and rationale.
In cases where limited rat studies were available, effect levels in other species (i.e., mice) that were lower than in rats were used for risk characterization. Evidence in humans, based on the Downs and Black scoring system (Downs and Black 1998), indicated limited evidence of association between DINP and sex hormone levels or semen parameters and between DEHP and sex hormone levels, birth measures or semen parameters. This supports the selection of the mode of action for risk characterization.
In the following sections, human health risk from exposure to medium-chain phthalates within the Phthalate Grouping is characterized on an individual basis, followed by a CRA to address the potential risk of concurrent exposure to medium-chain phthalates exhibiting a similar mode of action.
9.3.2.1 Individual risk characterization of the original medium-chain subgroup
DIBP
Table 9-51 provides all relevant exposure and hazard values for DIBP, as well as resultant MOEs, for determination of risk, which were previously described in the MCP SOS (Environment Canada, Health Canada 2015b). Overall, the MOEs for DIBP are considered to be adequate to account for uncertainties in the exposure and health effect databases. From the information available, there is evidence that DIBP elicits effects on the developing male reproductive system, indicative of RPS, which suggests that DIBP has a common mode of action with other phthalates in this grouping.
| Age group and exposure scenario | Central tendency (upper bounding) estimate of exposure (µg/kg bw/day) | Level and basis for oral NOAEL (mg/kg-bw/day) | MOEc |
|---|---|---|---|
| Children (males and females) 6–11 years: biomonitoring, CHMS | 1.5 (5.3) | NOAEL = 300 Testicular pathology at 500 mg/kg-bw/day (7 d) (Zhu et al. 2010) |
200 000 (60 000) |
| Infants 0–6 months (breastfed): environmental media and food | 1.6 (5.9) | NOAEL = 300 Testicular pathology at 500 mg/kg-bw/day (7 d) (Zhu et al. 2010) |
200 000 (50 000) |
| Infants/children (0–18 months) a: contact plastic articles, dermal | 30.7b (245.3) | NOAEL = 300 Testicular pathology at 500 mg/kg-bw/day (7 d) (Zhu et al. 2010) |
10 000 (1200) |
| Infants (0–18 months): mouthing toys, oral | 62.8b (251.0) | NOAEL = 300 Testicular pathology at 500 mg/kg-bw/day (7 d) (Zhu et al. 2010) |
5000 (1200) |
| Adults (females) 20–49 years: biomonitoring, CHMS | 0.56 (1.4) | NOAEL = 125 Reduced AGD, NR, effects on fertility and other TDS effects at the next highest dose (250 mg/kg-bw/day) (Saillenfait et al. 2008; Furr et al. 2014) | 220 000 (89 000) |
| Adults 20–59 yearsa: chronic body lotion, dermal | 0.030 | NOAEL = 125 Reduced AGD, NR, effects on fertility and other TDS effects at the next highest dose (250 mg/kg-bw/day) (Saillenfait et al. 2008; Furr et al. 2014) | > 1 million |
| Adults (20+): contact plastic articles, dermal | 30.8b (96.3) | NOAEL = 125 Reduced AGD, NR, effects on fertility and other TDS effects at the next highest dose (250 mg/kg-bw/day) (Saillenfait et al. 2008; Furr et al. 2014) | 4060 (1300) |
a Estimate adjusted on the basis of 10% dermal absorption of DBP.
b Estimated lower-end exposure.
c Margin of exposure: central tendancy and (upper bounding)
TDS = human testicular dysgenesis syndrome
DCHP
Table 9-52 provides all relevant exposure and hazard values for DCHP, as well as resultant MOEs, for determination of risk, which were previously described in the MCP SOS (Environment Canada, Health Canada 2015b). Overall, the MOEs for DCHP are considered to be adequate to account for uncertainties in the exposure and health effect databases. From the information available, there is evidence that DCHP has effects on the developing male reproductive system, indicative of RPS, which suggests that DCHP has a common mode of action with other phthalates in the grouping.
| Age group and exposure scenario | Central tendency (upper bounding) estimate of exposure (µg/kg bw/day) | Level and basis for oral NOAEL (mg/kg-bw/day) | MOEb |
|---|---|---|---|
| Children 6 months to 4 years: indoor air and dust, dermal and inhalation | 0.0018 (0.15) | NOAEL = 25 Increased relative liver weight (females), accompanied by histological changes in the liver and kidneys in both sexes at the two highest doses tested (subchronic) (de Ryke and Willems 1977) | > 1 million (170 000) |
| Adolescents 12–19a years: indoor air and dust, dermal and inhalation | < 0.001 (0.065) | LOAEL = 10-20 Testicular pathological changes after in utero exposure during GD12-21 (Li et al. 2016). Reduced AGD, testicular pathology and increased resorption after in utero exposure during GD6-19 (Ahbab and Barlas 2015). Antiandrogenic effects (decreased AGD and retained nipples, decreased testosterone production) in F1 and F2 males at higher dose levels in a two-generation study in rats (Hoshino et al. 2005) | > 1 million (155 000–310 000) |
a MOEs were calculated for non-pregnant individuals (male and female) and pregnant females for this age group.
b Margin of exposure: central tendancy and (upper bounding)
DMCHP
Table 9-53 provides all relevant exposure and hazard values for DMCHP, as well as resultant MOEs, for determination of risk, which were previously described in the MCP SOS (Environment Canada, Health Canada 2015b). Overall, the MOEs for DMCHP are considered to be adequate to account for uncertainties in the exposure and health effect databases. From the information available, there is evidence that DMCHP has effects on the developing male reproductive system, indicative of RPS, which suggests that DMCHP has a common mode of action with other phthalates in the grouping.
| Age group and exposure scenario | Central tendency (upper bounding) estimate of exposure (µg/kg bw/day) | Level and basis for oral NOAEL (mg/kg-bw/day) | MOEb |
|---|---|---|---|
| Infants 0–6 months: dust ingestion, oral | 0.0027 (0.054) | NOAELDCHP = 25 Increased relative liver weight (females), accompanied by histological changes in the liver and kidneys in both sexes at the two highest doses tested (subchronic) (de Ryke and Willems 1977) | > 1 million (460 000) |
| Adolescents 12–19a years: dust ingestion, oral | < 0.001 | LOAELDCHP = 10-20 Testicular pathological changes after in utero exposure during GD12-21 (Li et al. 2016). Reduced AGD, testicular pathology and increased resorption after in utero exposure during GD6-19 (Ahbab and Barlas 2015). Antiandrogenic effects (decreased AGD and retained nipples, decreased testosterone production) in F1 and F2 males at higher dose levels in a two-generation study in rats (Hoshino et al. 2005) | > 1 million |
| Adults 20+ a years: dust ingestion, oral | < 0.001 | LOAELDCHP = 10-20 Testicular pathological changes after in utero exposure during GD12-21 (Li et al. 2016). Reduced AGD, testicular pathology and increased resorption after in utero exposure during GD6-19 (Ahbab and Barlas 2015). Antiandrogenic effects (decreased AGD and retained nipples, decreased testosterone production) in F1 and F2 males at higher dose levels in a two-generation study in rats (Hoshino et al. 2005) | > 1 million |
a MOEs were calculated for non-pregnant individuals (male and female) and pregnant females for this age group.
b Margin of exposure: central tendancy and (upper bounding)
DBzP
Table 9-54 provides all relevant exposure and hazard values for DBzP, as well as resultant MOEs, for determination of risk, which were previously described in the MCP SOS (Environment Canada, Health Canada 2015b). Overall, the MOEs for DBzP are considered to be adequate to account for uncertainties in the exposure and health effect databases. From the information available, there is evidence that DBzP has effects on the developing male reproductive system, indicative of RPS, which suggests that DBzP has a common mode of action with other phthalates in the grouping.
| Age group and exposure scenario | Central tendency (upper bounding) estimate of exposure (µg/kg bw/day) | Level and basis for oral NOAEL (mg/kg-bw/day) | MOEb |
|---|---|---|---|
| Infants 0–6 months: dust ingestion, oral | 0.016 (0.097) | LOAELMBzP = 167 decrease in body weight gain and food consumption (Ema et al. 2003) | > 1 million |
| Adolescents 12–19a years: dust ingestion, oral | < 0.001 (0.0011) | NOAELMBzP = 167 anti-androgenic effects in utero LOAELMBzP = 167 decrease in body weight gain and food consumption (Ema et al. 2003) | > 1 million |
a MOEs were calculated for non-pregnant individuals (male and female) and pregnant females for this age group.
b Margin of exposure: central tendancy and (upper bounding)
B84P
Table 9-55 provides all relevant exposure and hazard values for B84P, as well as resultant MOEs, for determination of risk, which were previously described in the MCP SOS (Environment Canada, Health Canada 2015b). Overall, the MOEs for B84P are considered to be adequate to account for uncertainties in the exposure and health effect databases. From the information available, there is evidence that B84P has effects on the developing male reproductive system, indicative of RPS, which suggests that B84P has a common mode of action with other phthalates in the grouping.
| Age group and exposure scenario | Central tendency (upper bounding) estimate of exposure (µg/kg bw/day) | Levels and basis for oral NOAEL (mg/kg-bw/day) | MOEd |
|---|---|---|---|
| Infants (0–18 months): exposure to plastic articles, dermal | 2.7c (21.6) | NOAEL (BBP)= 151b Histopathological changes in the pancreas, gross pathological alterations in the liver and significant increase in relative kidney weight in male rats at next highest dose of 381 mg/kg-bw/day (subchronic) (NTP 1997) | 56 000 (6990) |
| Infants 0–6 months: dust ingestion, oral | 0.0063 (0.047) | NOAEL (BBP)= 151b Histopathological changes in the pancreas, gross pathological alterations in the liver and significant increase in relative kidney weight in male rats at next highest dose of 381 mg/kg-bw/day (subchronic) (NTP 1997) | > 1 million |
| Adults (20+): exposure to plastic articles, dermal | 2.7c (8.5) | NOAEL (BBP) = 50 Decreased pup body weight (male and female) and ↓AGD at birth in F2 males at next highest dose of 100 mg/kg-bw/day; decreased fetal testosterone (Aso et al. 2005; Nagao et al. 2000; Tyl et al. 2004; Furr et al. 2014) | 19 000 (5900) |
a MOEs were calculated for non-pregnant individuals (male and female) and pregnant females for these age groups.
b NOAEL (BBP prepubertal) = 300 (testicular pathology at 500 mg/kg-bw/day [7d]) is at higher doses than the systemic effects.
c Estimated lower-end exposure, adjusted for dermal absorption (10%).
d Margin of exposure: central tendancy and (upper bounding)
DIHepP
Table 9-56 provides all relevant exposure and hazard values for DIHepP, as well as resultant MOEs, for determination of risk, which were previously described in the MCP SOS (Environment Canada, Health Canada 2015b). Overall, the MOEs for DIHepP are considered to be adequate to account for uncertainties in the exposure and health effect databases. From the information available, there is evidence that DIHepP has effects on the developing male reproductive system, indicative of RPS, which suggests that DIHepP has a common mode of action with other phthalates in the grouping.
| Age group and exposure scenario | Central tendency (upper bounding) estimate of exposure (µg/kg bw/day) | Level and basis for oral NOAEL (mg/kg-bw/day) | MOEb |
|---|---|---|---|
| Infants 0–6 months: dust ingestion, oral | 0.096 (1.1) | NOAEL = 50-162 Increased liver and kidney weights with histopathological findings at 222–716 mg/kg-bw/day (McKee et al. 2006) | 520 000–> 1 million (45 000–150 000) |
| Adolescents 12–19a years: dust ingestion, oral | 0.0011 (0.013) | NOAEL = 50–168 Significant reduction in AGD and body weight in male F2 pups after in utero exposure to DIHepP at the next highest dose tested in rats (309–750 mg/kg-bw/day) and liver and kidney effects at the next highest dose (227–750 mg/kg-bw/day) in F1 rats (McKee et al. 2006) | > 1 million |
a MOEs were calculated for non-pregnant individuals (male and female) and pregnant females for this age group.
b Margin of exposure: central tendancy and (upper bounding)
B79P
Table 9-57 provides all relevant exposure and hazard values for B79P, as well as resultant MOEs, for determination of risk. Overall, the MOEs for B79P are considered to be adequate to account for uncertainties in the exposure and health effect databases. From the information available, there is evidence that B79P has effects on the developing male reproductive system, indicative of RPS, which suggests that B79P has a common mode of action with other phthalates in the grouping.
| Age group and exposure scenario | Central tendency (upper bounding) estimate of exposure (µg/kg bw/day) | MOEb based on an oral NOAELDINP of 15 mg/kg-bw/day from Lington et al. 1997 |
|---|---|---|
| Infants (0–18 months): exposure to plastic articles, dermal | 2.7a (21.6) | 5600 (690) |
| Adults (20+): contact with plastic articles, dermal | 2.7a (8.5) | 5600 (1800) |
| Infants 0–6 months: dust ingestion, oral | 0.0063 (0.047) | > 1 million (319 149) |
| Adolescents 12–19a years: dust ingestion, oral | < 0.001 | > 1 million |
a Estimated lower-end exposure, adjusted for dermal absorption (10%).
b Margin of exposure: central tendancy and (upper bounding)
DINP
Table 9-58 provides all relevant exposure and hazard values for DINP, as well as resultant MOEs, for determination of risk. Overall, the MOEs for DINP are considered to be adequate to account for uncertainties in the exposure and health effect databases. From the information available, there is evidence that DINP has effects on the developing male reproductive system, indicative of RPS, which suggests that DINP has a common mode of action with other phthalates in the grouping.
| Age group and exposure scenario | Central tendency (upper bounding) estimate of exposure (µg/kg bw/day) | Level and basis for oral NOAEL (mg/kg-bw/day) | MOEd |
|---|---|---|---|
| Children (males) 6–11 years: biomonitoring, 95th percentile, NHANESb | 4.6 (25) | NOAEL = 15 Increase in liver and kidney weights, increased peroxisomal enzyme levels and histological changes in both organs at 152-184 (Lington et al. 1997) | 3200 (580) |
| Infants/children 6 months to 4 years: food, air and dust, oral | 1.8 (20.8) | NOAEL = 15 Increase in liver and kidney weights, increased peroxisomal enzyme levels and histological changes in both organs at 152-184 (Lington et al. 1997) | 8300 (720) |
| Infants (0 to 18 months): mouthing plastic toys and articles, oral | 30c (120) | NOAEL = 15 Increase in liver and kidney weights, increased peroxisomal enzyme levels and histological changes in both organs at 152-184 (Lington et al. 1997) | 500 (125)e |
| Infants (0 to 18 months): exposure to plastic articles, dermal | 1.1c (8.6) | NOAEL = 15 Increase in liver and kidney weights, increased peroxisomal enzyme levels and histological changes in both organs at 152-184 (Lington et al. 1997) | 14 000 (1700) |
| Adults (females) 20+ years: biomonitoring: 95th percentile, NHANESb | 2.3 (23) | LOEL/NOAEL = 10–15 ↑ MNGs, ↑ Leydig cell clusters/aggregation starting from 100 mg/kg-bw/day after in utero exposure in GD12-21 (Li et al. 2015b), increase in liver and kidney weights, increased peroxisomal enzyme levels and histological changes in both organs at 152–184 (Lington et al. 1997) | 4300 to 6500 (430 to 650) |
| Adults (males) 20+a years: biomonitoring, 95th percentile, NHANESb | 2.8 (24) | NOAEL = 15 Increase in liver and kidney weights, increased peroxisomal enzyme levels and histological changes in both organs at 152–184 (Lington et al. 1997) | 5400 (630) |
| Adolescents 12 to 19 years: food, air and dust, oral | 1.0 (11.9) | LOEL/NOAEL = 10–15 ↑ MNGs, ↑ Leydig cell clusters/aggregation starting from 100 mg/kg-bw/day after in utero exposure in GD12-21 (Li et al. 2015b), increase in liver and kidney weights, increased peroxisomal enzyme levels and histological changes in both organs at 152–184 (Lington et al. 1997) | 10 000–15 000 (840–1300) |
| Adults (females) 20+a years: exposure to plastic articles, dermal | 1.1c (3.4) | LOEL/NOAEL = 10–15 ↑ MNGs, ↑ Leydig cell clusters/aggregation starting from 100 mg/kg-bw/day after in utero exposure in GD12-21 (Li et al. 2015b), increase in liver and kidney weights, increased peroxisomal enzyme levels and histological changes in both organs at 152–184 (Lington et al. 1997) | 9100–14 000 (2900–4400) |
a MOEs were calculated for non-pregnant individuals (male and female) and pregnant females for this age group.
b The highest intakes at the 95th percentile (33 μg/kg bw/day:12-to-19-year-old males and 27 ug/kg/day: 12-to-19-year old females) were not brought forward to risk characterization because the relative standard error of the data was greater than 30%. For children aged 6 to 11 years, 26 μg/kg bw/d (RSE > 30%) was carried forward to risk characterization in order to be protective of this age group and because of the absence of low variability data, at the upper percentiles, for another comparable age group. For more details, see Environment Canada, Health Canada 2015c.
c Estimated lower end exposure, adjusted for dermal absorption (4%).
d Margin of exposure: central tendancy and (upper bounding)
e Migration rates used to estimate exposure were based on concentrations in toys (12.9 - 77%) that are higher than concentrations observed in recent Health Canada surveys (see Table 9-3, Environment Canada, Health Canada 2015c). Currently, Canada (like the United States and the European Union) have regulations (0.1%) in place limiting the amount of certain phthalates (including DINP) in toys and childcare articles.
CHIBP, BCHP and BIOP
An examination of the potential developmental and reproductive toxicity of CHIBP, BCHP and BIOP using appropriate analogues for read-across revealed that these medium-chain phthalates have the potential to have significant effects on the developing male, in addition to systemic effects (liver, kidney).
On the basis of the information available, it can be concluded that CHIBP, BCHP and BIOP meet the criteria for inclusion in the evaluation of the potential cumulative risk of phthalates on the developing male reproductive system given the evidence of the effects of their analogues; however, there is no exposure at this time. Consequently, the risk to human health for these substances is not expected.
Although the above MOEs for the medium-chain phthalates in the Phthalate Substance Grouping described in this section are considered adequate on an individual basis, this does not address the potential risk of concurrent exposure to these substances and other phthalates exhibiting a similar mode of action. Hence, all 10 medium-chain phthalates in the Phthalate Substance Grouping will be included for risk characterization in a cumulative context.
9.3.2.2 Cumulative risk assessment
The human health approach for a CRA for this Grouping has been described in detail in the “Proposed approach for cumulative risk assessment of certain phthalates under the Chemicals Management Plan” document (Environment Canada, Health Canada 2015e).
Human health-focused approaches for quantifying the cumulative risk of phthalates have been conducted by several national organizations including the Australian Department of Health (AGDH 2012, 2013, 2014a,b), the Danish Environmental Protection Agency (Danish EPA 2011), and the recently completed assessment by the United States Chronic Health Advisory Panel (US CPSC CHAP 2014). This screening assessment uses a tiered approach, following the schematic of the World Health Organization (WHO) and the International Program on Chemical Safety (IPCS) Framework for Risk Assessment of Combined Exposures to Multiple Chemicals (WHO 2009; Meek et al. 2011). This framework exercises the default assumption that the substances being assessed act by dose addition and the evaluation of cumulative risk involves multiple tiers where each higher level is increasingly dependent on additional data. The lower tier begins with simple assumptions and/or surrogate data for both hazard and exposure and refinement to a higher tier occurs if required and as the data allows.
For exposure characterization, if there is sufficient evidence of co-occurrence, then a CRA can be considered. The exposure approach is described in the CRA approach document (Environment Canada, Health Canada 2015e).
In summary, the pivotal information that determined substances for inclusion into the CRA were industry data collected under section 71 of CEPA (Environment Canada 2014), detection in North American biomonitoring surveys (CHMS, MIREC, MIREC-CD Plus, P4, NHANES; Health Canada 2011b; Health Canada 2013; Arbuckle et al. 2014; personal communication from EHSRD, HC, to ESRAB, HC, October 2013, 2014, unreferenced; Arbuckle et al. 2016; CDC 2014), and detection in household dust (CHDS; Kubwabo et al. 2013). For phthalate parent compounds (i.e., DEHP, DIBP, DBP, BBP, and DINP), with close to a 100% detection in various biomonitoring surveys, there was sufficient evidence for co-exposure; these substances were therefore assessed for cumulative risk.
A significant number of phthalates within the medium-chain phthalates subgroup have not been monitored in biomonitoring samples, but are found in commerce in Canada. These substances (i.e., DIHepP, B79P, B84P, DCHP, and DIOP) were included in the assessment of cumulative risk on the basis of their in-commerce status coupled with close to 100% detection in dust samples from Canadian homes.
Finally, given reporting limits and difficulties in determining import activity of substances, the CEPA section 71 survey may not have captured all in-commerce activity. As a result, substances that fit the profile of non-reporting to section 71 and close to 100% detection in house dust samples were also assessed for cumulative risk (i.e., DMCHP, DBzP, and DnHP).
There were three populations of interest for which exposure estimates were considered for cumulative risk: pregnant women and women of childbearing age (characterized as women aged twelve and up), infants (covered by age groups 0 to 6 months, 6 months to 4 years and 3 to 5 yearsFootnote 18 ), and children (covered by age groups 6 months to 4 years and 5 to 11 years). Adolescents and adult males were covered by this approach as they had generally lower estimates of phthalate exposure and are considered less sensitive to the reproductive effects of medium-chain phthalates compared to younger males (i.e. children) (NAS 2008).
In terms of exposure estimates considered for cumulative risk, biomonitoring data, which generally captures all potential exposure sources and routes (environmental media, food and products available to consumers) was considered a primary source of exposure information and estimated monitoring data (chronic exposures resulting from environmental media and food) was considered as a supporting source of exposure information. The US CPSC CHAP (2014) also used biomonitoring data as the primary source of exposure information in their CRA. Regardless of route of exposure, phthalates, in general, are not considered acute toxicants, with LD50 levels from dermal exposure being at minimum two- to five-fold higher than oral values, which in turn are also high (Draize et al. 1948; David et al. 2001; Monsanto Company 1970 cited in US EPA 2006, 2010). Since phthalates are metabolized relatively quickly showing no accumulation, and excretion is rapid, within hours to days (Phokha et al. 2002; Clewell et al. 2009), acute exposures were not considered relevant for a CRA. It should also be noted that no other jurisdictions have addressed phthalate exposures and risk from acute, one-time, exposures (AGDH 2011; ECHA 2013b; US CPSC CHAP 2014).
Upper-bound exposure estimates were used to estimate individual phthalate levels in the CRA to account for the uncertainties associated with the exposure data. The upper-bound exposure estimates used to characterize the cumulative risk for relevant populations of the 16 medium-chain phthalates are summarized in Appendix F (Tables F-1, F-2, F-3 and F-4).
On the basis of the available information on the common adverse effects (RPS) and the observed differences in potencies within the medium-chain phthalates, a lower-tiered hazard characterization using the hazard index (HI) was considered to be the most appropriate approach. The HI method was selected because it offers the benefit of being simple and flexible and allows for an indication of which substance or substances in the CRA, or which source and route, may be the predominant contributor(s) to the overall risk. Identification of the substances or sources and routes that are drivers of the CRA is beneficial for informing risk management.
An HI is the summation of the individual hazard quotients (HQs) for each individual substance to determine the overall cumulative risk of the substance group of interest. The HQ of each substance is the ratio of exposure to a reference value (RfV) which is calculated by dividing the critical effect level identified in the hazard database by a defined uncertainty factor [UF]). The HI equation is as follows: HI = ∑HQ = ∑ (exposure/RfV). HI values of the medium-chain phthalates are calculated for the three subpopulations that represented the highest exposure groups.
Critical effect levels have been established at three life stages (i.e., in utero, prepubertal/pubertal, and adult) because of different sensitivity to the adverse effects of phthalates on development and reproduction at different life stages. The critical effect levels identified for the in utero life stage were used to calculate the HI value for pregnant woman and for infants. The critical effect levels identified for the prepubertal/pubertal life stage were used to calculate the HI value for children. The critical effect levels of the in utero and prepubertal/pubertal life stages for the medium-chain phthalates as well as the calculated RfVs are summarized in Appendix F (Table F-5 and F-6).
Given that medium-chain phthalates have similar physical-chemical properties, have similar toxicological effects, and show an overall similarity in strength of their health effect databases (especially in regards to in utero exposure), the same default UF was used to calculate HQ values for all phthalates, for a given subpopulation. A similar approach was adopted by another jurisdiction (US CPSC CHAP 2014). For the calculation of the total HI for pregnant women/women of childbearing age and infants, an UF of 100 (10 for intraspecies and 10 for interspecies differences) was used to calculate the RfV for the critical effect levels identified at the in utero life stage. For children, a default UF of 300 was used to calculate the RfV for the critical effects levels identified for the prepubertal-pubertal life stage. An additional UF of 3 was applied in this case on the basis of the limitations of the health effects database for the prepubertal life stage (quality and quantity of the studies currently available), and taking into consideration the variability in exposure duration in the different studies as well as the possibility that animals might also have been exposed to medium-chain phthalates in utero. The HI values for pregnant women/women of childbearing age, infants, and children are presented in Table 9-59 (also see Appendix F; tables F-7, F-8 and F-9).
| Population of interest | Calculated HI with exposure estimates based on biomonitoring (upper bound) | Calculated HI with exposure estimates based on environmental media and food (upper bound) |
|---|---|---|
| Pregnant women and women of childbearing age | 0.34 | 0.49 |
| Infants | 0.37 | 0.83 |
| Children | 0.54 | 0.60 |
Individual phthalates that had the highest contribution to the cumulative risk were identified. Tables F-7, F-8 and F-9 (in Appendix F) show that the same three phthalate compounds (DINP, DBP, DEHP) were the main contributors to the cumulative risk, regardless of the age group or source of exposure data (biomonitoring or environmental media and food). Biomonitoring exposure estimates were generally considered more representative of potential overall exposure, including exposure from products available to consumers (regardless of source, route or duration). As a result, the HI values calculated using biomonitoring data were considered more realistic but still conservative, because they were calculated using upper-bound exposure estimates.
Children and infants had higher HI values compared to pregnant women and women of childbearing age (aged 12 years and over). HI values calculated using biomonitoring data were lower than those calculated using environmental and dietary monitoring data for infants and children. In the case of DEHP, the high exposure from food was in part due to the unexpected presence of DEHP in fruits and vegetables which would have overestimated actual dietary exposure to DEHP. Nonetheless, this conservative, lower-tiered HI approach indicated no concern for human health from potential cumulative exposure to medium-chain phthalates for the general Canadian population, specifically the more sensitive subpopulations (pregnant women/women of childbearing age, infants, and children), at current levels of exposure.
An HI value greater than 1 would indicate the need for further investigation or refinement. The HI values for the three subpopulations with the highest exposures were all below 1. Therefore, further refinement to a higher-tiered assessment is not necessary at this time. While the potential cumulative risk is low at current levels of exposure to medium-chain phthalates (Phthalate Substance Grouping: DIBP, CHIBP, BCHP, DCHP, DBzP, B79P, DMCHP, DIHepP, BIOP, B84P, DINP; Additional phthalates: DPrP, DBP, BBP, DnHP, 79P, DIOP, DEHP), an increase in exposure levels could represent a potential risk to human health.
9.3.3 Long-chain phthalates
DIDP
Table 9-60 provides all relevant exposure and hazard values for DIDP, as well as resultant MOEs, for determination of risk, which were previously described in the LCP SOS (Environment Canada, Health Canada 2015d). Overall, the MOEs for DIDP are considered to be adequate to account for uncertainties in the exposure and health effect databases.
| Age group and exposure scenario | Central tendency (upper bounding) estimate of exposure (µg/kg bw/day) | MOEc based on an oral LOAEL of 22 mg/kg-bw/day from Cho et al. 2008 |
|---|---|---|
| Children (males) 6–11 years: biomonitoring, mean (95th percentile), NHANES | 1.4 (4.4) | 16 000 (5000) |
| Infants (0–18 months)a: Exposure to plastic articles, dermal | 0.27b (2.16) | 81 000 (10 000) |
| Children 6 months to 4 years: food and dust, oral | 0.514 (2.87) | 43 000 (7700) |
| Adolescents 12–19 years: food and dust, oral | 0.075 (0.726) | 290 000 (30 000) |
| Adults (males) 20+ years: biomonitoring, mean (95th percentile), NHANES | 0.76 (4.4) | 29 000 (5000) |
| Adults (females) 20+ years: biomonitoring, mean (95th percentile), NHANES | 0.65 (4.9) | 34 000 (4500) |
| Adults 20–59 years: food and dust, oral | 0.068 (0.715) | 320 000 (31 000) |
| Adults 20+a years: exposure to plastic articles, dermal | 0.27b (0.85) | 81 000 (26 000) |
a Estimate adjusted on the basis of 1% dermal absorption of DIDP.
b Estimated lower end exposure.
c Margin of exposure: central tendancy and (upper bounding)
DUP
Table 9-61 provides all relevant exposure and hazard values for DUP, as well as resultant MOEs, for determination of risk, which were previously described in the LCP SOS (Environment Canada, Health Canada 2015d). Overall, the MOEs for DUP are considered to be adequate to account for uncertainties in the exposure and health effect databases.
| Age group and exposure scenario | Central tendency (upper bounding) estimate of exposure (µg/kg bw/day) | MOE c based on an oral NOAEL of 37 mg/kg-bw/day from Poon et al. 1997 (DnOP) |
|---|---|---|
| Infants 0–6 months: dust, oral | 0.0198 (0.349) | > 1 million (110 000) |
| Infants (0–18 months)a: exposure to plastic articles, dermal | 2.7b (21.6) | 14 000 (1700) |
| Adolescents/Adults 12–19 years: dust, oral | < 0.001 (0.004) | > 1 million |
| Adults 20+a years: exposure to plastic articles, dermal | 2.7b (8.5) | 14 000 (4400) |
a Estimate adjusted on the basis of 10% dermal absorption as default.
b Estimated lower end exposure.
c Margin of exposure: central tendancy and (upper bounding)
9.4 Uncertainties in Evaluation of Cumulative Risk to Human Health
Uncertainties specific to short-chain, medium-chain, long-chain phthalates and DINP are summarized in the SOS reports (Environment Canada, Health Canada 2015b-e).
The key sources of uncertainty related to the CRA are presented in the table below.
| Key source of uncertainty | Impact |
|---|---|
| Data availability (multiple species, both sexes, sensitive exposure periods) and data quality for certain phthalates. | +/- |
| The unknown relevance of the available human epidemiological data studies implicating the potential hazard that certain phthalates pose to humans. | + |
| The inherent limitations in the use of biomonitoring data for risk characterization related to methods, the chemical-specific variability in levels and metabolites as well as lack of availability of data for certain phthalates. | +/- |
| The exclusion of estimates of exposure for products available to consumers in the CRA of phthalates, even if biomonitoring estimates would likely capture all exposure sources/routes, including exposure from products available to consumers. | - |
| The potential toxicokinetic or toxicodynamic differences between species and between the individual chemicals. | +/- |
| The application of default uncertainty factors for a specific life stage even if some databases are more robust than others as well as the use of life-stage specific studies to determine HIs for children exposed after birth (prepubertal database less robust). | + |
| The overall cumulative risk of phthalates based on other adverse effects observed after exposure to this grouping as a whole regardless of chain length. | - |
+ = uncertainty with potential to cause over-estimation of exposure/risk, - = uncertainty with potential to cause under-estimation of exposure risk, +/- = unknown potential to cause over or under estimation of risk.
Considering the above sources of uncertainty, it is anticipated that the cumulative risk characterization of this grouping would not be sensitive to refinement at this time if additional data were provided, as the lower-tiered HI approach with several conservative assumptions indicated no concern for human health.
10. Conclusion
Considering all available lines of evidence presented in this screening assessment, there is low risk of harm to the environment from the 14 phthalates in the Phthalate Substance Grouping (DMP, DIBP, CHIBP, BCHP, DCHP, DBzP, B79P, DMCHP, DIHepP, BIOP, B84P, DINP, DIDP and DUP). However, there is risk of harm to the environment from 1 additional phthalate, DEHP. DEHP was previously assessed by Environment Canada and Health Canada in 1994 under the Priority Substances Assessment Program. The assessment concluded that DEHP posed a risk to human health in Canada. However, a conclusion for the environment could not be determined because of insufficient information.
It is concluded that the 14 substances in the Phthalate Substance Grouping do not meet the criteria under paragraphs 64(a) or (b) of CEPA as they are not entering the environment in a quantity or concentration or under conditions that have or may have an immediate or long-term harmful effect on the environment or its biological diversity or that constitute or may constitute a danger to the environment on which life depends. It is concluded that DEHP meets the criteria under paragraph 64(a) of CEPA as it is entering or may enter the environment in a quantity or concentration or under conditions that have or may have an immediate or long-term harmful effect on the environment or its biological diversity. However, it is concluded that DEHP does not meet the criteria under paragraph 64(b) of CEPA as it is not entering the environment in a quantity or concentration or under conditions that constitute or may constitute a danger to the environment on which life depends.
On the basis of the information presented in this screening assessment, it is concluded that the 14 phthalates in the Phthalate Substance Grouping do not meet the criteria under paragraph 64(c) of CEPA as they are not entering the environment in a quantity or concentration or under conditions that constitute or may constitute a danger in Canada to human life or health.
Therefore, it is concluded that DEHP meets one or more of the criteria set out in section 64 of CEPA. DEHP has been determined to not meet the persistence or bioaccumulation criteria as set out in the Persistence and Bioaccumulation Regulations of CEPA.
References
Abd-Ellah MF, Aly HA, Mokhlis HA, Abdel-Aziz AH. 2016. Quercetin attenuates di-(2-ethylhexyl) phthalate-induced testicular toxicity in adult rats. Hum Exp Toxicol. 35(3):232-243.
Abraham MH, Chadha HS, Whiting GS, Mitchell RC. 1994. Hydrogen bonding. 32. An analysis of water-octanol and water-alkane partitioning and the Δlog P parameter of seiler. J Pharm Sci. 83(8):1085-1100.
[ACC] American Chemistry Council. 2006. High Production Volume (HPV) Chemical Challenge Program: Test Plan for the Phthalate Ester Category [Internet]. Phthalate Esters Panel. (HPV Testing Group). Report No.: 201-16554A.
ACD/Percepta [prediction module]. 2012. Toronto (ON): Advanced Chemistry Development.
Adams WJ, Biddinger GR, Robillard KA, Gorsuch JW. 1995. A summary of the acute toxicity of 14 phthalate esters to representative aquatic organisms. Environ Toxicol Chem. 14(9):1569-1574.
[AFN] The Assembly of First Nations. 2013. First Nations Biomonitoring Initiative. National Results (2011). June 2013. [accessed 2014 Feb 26].
[AGDH] Australian Government Department of Health. 2008. Phthalates Hazard Compendium. A summary of physiochemical and human health hazard data for 24 ortho-phthalate chemicals [DOC]. Sydney (AU): Department of Health, National Industrial Chemicals Notification and Assessment Scheme (NICNAS).
[AGDH] Australian Government Department of Health. 2008a. Dimethyl phthalate. Sydney (AU): Department of Health, National Industrial Chemicals Notification and Assessment Scheme (NICNAS). Existing Chemical Hazard Assessment Report. Search result for DMP.
[AGDH] Australian Government Department of Health. 2008b. Butylbenzyl Phthalate. Sydney (AU): Department of Health, National Industrial Chemicals Notification and Assessment Scheme (NICNAS). Existing Chemical Hazard Assessment Report. Search result for BBP.
[AGDH] Australian Government Department of Health. 2008c. Diisononyl phthalate. Sydney (AU): Department of Health, National Industrial Chemicals Notification and Assessment Scheme (NICNAS). Existing Chemical Hazard Assessment Report. Search result for DINP.
[AGDH] Australian Government Department of Health. 2008d. Diisoheptyl Phthalate. Sydney (AU): Department of Health, National Industrial Chemicals Notification and Assessment Scheme (NICNAS). Existing Chemical Hazard Assessment Report. Search result for DiHepP.
[AGDH] Australian Government Department of Health. 2008e. Diisobutyl Phthalate. Sydney (AU): Department of Health, National Industrial Chemicals Notification and Assessment Scheme (NICNAS). Existing Chemical Hazard Assessment Report. Search result for DIBP.
[AGDH] Australian Government Department of Health. 2008f. Diisodecyl phthalate. Sydney (AU): Department of Health, National Industrial Chemicals Notification and Assessment Scheme (NICNAS). Existing Chemical Hazard Assessment Report. Search result for DIDP.
[AGDH] Australian Government Department of Health. 2010. Diethylhexyl Phthalate. Sydney (AU): Department of Health, National Industrial Chemicals Notification and Assessment Scheme (NICNAS). Priority Existing Chemical (PEC) Assessment Report No.32. Search result for DEHP.
[AGDH] Australian Government Department of Health. 2012. Diisononyl Phthalate. Sydney (AU): Department of Health, National Industrial Chemicals Notification and Assessment Scheme (NICNAS). Priority Existing Chemical (PEC) Assessment Report No. 35. Search result for DINP.
[AGDH] Australian Government Department of Health. 2013a. Dibutyl Phthalate. Sydney (AU): Department of Health, National Industrial Chemicals Notification and Assessment Scheme (NICNAS). Priority Existing Chemical (PEC) Assessment Report. Search result for DBP.
[AGDH] Australian Government Department of Health. 2013b. Butyl Benzyl Phthalate. Sydney (AU): Department of Health, National Industrial Chemicals Notification and Assessment Scheme (NICNAS). Priority Existing Chemical (PEC) Assessment Report No. 40. Search result for BBP.
[AGDH] Australian Government Department of Health. 2014a. Dimethyl Phthalate. Sydney (AU): Department of Health, National Industrial Chemicals Notification and Assessment Scheme (NICNAS). Priority Existing Chemical (PEC) Assessment Report No. 37. Search result for DMP.
[AGDH] Australian Government Department of Health. 2014b. Di(methoxyethyl) Phthalate. Sydney (AU): Department of Health, National Industrial Chemicals Notification and Assessment Scheme (NICNAS). Priority Existing Chemical (PEC) Assessment Report No. 38. Search result for DMEP.
Ahbab MA, Barlas N. 2013. Developmental effects of prenatal di-n-hexyl phthalate and dicyclohexyl phthalate exposure on reproductive tract of male rats: Postnatal outcomes. Toxicol Lett. 51:123-136.
Ahbab MA, Undeger U, Barlas N, Basaran N. 2014. In utero exposure to dicyclohexyl and di-n-hexyl phthalate possess genotoxic effects on testicular cells of male rats after birth in the comet and TUNEL assays. Hum Exp Toxicol. 33(3):230-239.
Ahbab MA, Barlas N. 2015. Influence of in utero di-n-hexyl phthalate and dicyclohexyl phthalate on fetal testicular development in rats. Toxicol Lett. 233:125-137.
Ahmad R, Gautam AK, Verma Y, Sedha S, Kumar S. 2014. Effects of in utero di-butyl phthalate and butyl benzyl phthalate exposure on offspring development and male reproduction of rat. Environ Sci Pollut Res Int. 21(4):3156-3165.
Albar HMSA, Ali N, Shahzad K, Ismail IMI, Rashid MI, Wang W, Ali LN, Eqani SAMAS. 2017. Phthalate esters in settled dust of different indoor microenvironments; source of non-dietary human exposure. Microchem J. 132:227-232
Aly HA, Hassan MH, El-Beshbishy HA, Alahdal AM, Osman AM. 2015. Dibutyl phthalate induces oxidative stress and impairs spermatogenesis in adult rat. Toxicol Ind Health. 32(8).
Andrade AJM, Grande SW, Talsness CE, Gericke C, Grote K, Golombiewsky A, Sterner-Kock A, Chahoud I. 2006a. A dose response study following in utero and lactational exposure to di-(2-ethylhexyl) phthalate (DEHP): Reproductive effects on adult male offspring rats. Toxicology. 228:85-97.
Andrade AJM, Grande SW, Talsness CE, Grote K, Golombiewsky A, Sterner-Kock A, Chahoud I. 2006b. A dose-response study following in utero and lactational exposure to di-(2-ethylhexyl) phthalate (DEHP): effects on androgenic status, developmental landmarks and testicular histology in male offspring rats. Toxicology. 225(1):64-74.
Aoki KA. 2010. A study of the anti-androgenic effects of the phthalate ester, din-butyl phthalate, on two freshwater fish species, the fathead minnow and the three-spined stickleback. PhD thesis. Brunel University, Institute for the Environment. London (UK): Brunel University.
Aoki KAA, Harris CA, Katsiadaki I, Sumpter JP. 2011. Evidence suggesting that di-N-butyl phthalate has antiandrogenic effects in fish. Environ Toxicol Chem. 30(6):1338-1345.
Araki A, Mitsui T, Miyashita C, Nakajima T, Naito H, Ito S, Sasaki S, Cho K, Ikeno T, Nonomura K, Kishi R. 2014. Association between maternal exposure to di(2-ethylhexyl) phthalate and reproductive hormone levels in fetal blood: The Hokkaido Study on Environment and Children’s Health. PLOS ONE. 9(10):1-10.
Arbuckle TE, Agarwal A, MacPherson SH, Fraser WD, Sathyanarayana S, Ramsay T, Dodds L, Muckle G, Fisher M, Foster W, Walker M, Monnier P. 2018. Prenatal exposure to phthalates and phenols and infant endocrine-sensitive outcomes: The MIREC study. Environ Int. 2018 Sep 5;120:572-583.
Arbuckle TE, Davis K, Marro L, Fisher M, Legrand M, LeBlanc A, Gaudreau E, Foster WG, Choeurng V, Fraser WD, the MIREC Study Group. 2014. Phthalate and bisphenol A exposure among pregnant women in Canada – results from the MIREC study. Environ Int. 68:55-65.
Arbuckle TE, Fisher M, MacPherson S, Lang C, Provencher G, LeBlanc A, Hauser R, Feeley M, Ayotte P, Neisa A, Ramsay T, Tawagi G. 2016. Maternal and early life exposure to phthalates: The Plastics and Personal-care Products use in Pregnancy (P4) study. Sci Total Environ.
Ashworth MJ, Chappell A, Ashmore E, Fowles J. 2018. Analysis and assessment of exposure to selected phthalates found in children’s toys in Christchurch, New Zealand. Int J Environ Res Public Health. 15:200
Aso S, Ehara H, Miyata K, Hosyuyama S, Shiraishi K, Umano T, Minobe Y. 2005. A two-generation reproductive toxicity study of butyl benzyl phthalate in rats. J Toxicol Sci. 30:39-58.
Ateşşahin A, urk GT, Karahan I, Yilmaz S, Ceribasi AO, Bulmus O. 2006. Lycopene prevents adriamycin-induced testicular toxicity in rats. Fertil Steril. 85(1):1216-1222.
Axelsson J, Rylander L, Rignell-Hydbom A, Lindh CH, Jönsson BAG, Giwercman A. 2015a. Prenatal phthalate exposure and reproductive function in young men. Environ Res. 138:264-270.
Axelsson J, Rylander L, Rignell-Hydbom A, Jönsson BAG, Lindh CH, Giwercman A. 2015b. Phthalate exposure and reproductive parameters in young men from the general Swedish population. Environ Int. 185:54-60.
Bao J, Wang M, Ning X, Zhou Y, He Y, Yang J, Gao X, Li S, Ding Z, Chen B. 2015. Phthalate concentrations in personal care products and the cumulative exposure to female adults and infants in Shanghai. J Toxicol Environ Health A. 78:325-341.
Barber ED, Astill BD, Moran EJ, Schneider BF, Gray TJ, Lake BG, Evans JG. 1987. Peroxisome induction studies on seven phthalate esters. Toxicol Ind. Health. 3(2):7-24.
Bavarian State Ministry of the Environment and Public Health. 2012. Submission of information via the public consultation on ECHA’s draft review report by the Bavarian State Ministry of the Environment and Public Health (Bayerisches Staatsministerium für Umwelt und Gesundheit) [PDF]. Comment reference number 19.
[BCFBAF] Bioaccumulation Program for Microsoft Windows [estimation model]. 2010. Ver. 3.01. Washington (DC): US Environmental Protection Agency, Office of Pollution Prevention and Toxics; Syracuse (NY): Syracuse Research Corporation.
Bedoya-Rios DF, Lara-Borrero JA, Duque-Pardo V, Madera-Parra CA, Jiminez EM, Toro AF. 2018. Study of the occurrence and ecosystem danger of selected endocrine disruptors in the urban water cycle of the city of Bogota, Colombia. Environ Sci Health. 53(4):317-325
Bergh C, Torgrip R, Emenius G, Östman C. 2011a. Organophosphate and phthalate esters in air and settled dust – a multi-location indoor study. Indoor Air. 21:67-76.
Bergh C, Aberg K, Svartengren M, Emenius G, Östman C. 2011b. Organophosphate and phthalate esters in indoor air: a comparison between multi-storey buildings with high and low prevalence of sick building symptoms. J Environ Monit. 13:2001-2009.
Bergh C, Luongo G, Wise S, Östman C. 2012. Organophosphate and phthalate esters in standard reference material 2585 organic contaminants in house dust. Anal Bioanal Chem. 402:51-59.
[BIBRA] British Industrial Biological Research Association. 1986. A 21 Day Feeding Study of Di-isodecyl Phthalate to Rats: Effects on the Liver and Liver Lipids. Report No. 0495/5/85 [cited in European Commission 2003].
Biedermann-Brem S, Biedermann M, Pfenninger S, Bauer M, Altkofer W, Rieger K, Hauri U, Droz C, Grob K. 2008. Plasticizers in PVC toys and childcare products: What succeeds the phthalates? Market survey 2007. Chromatographia. 68:227-234.
Blanchard O, Glorennec P, Mercier F, Bonvallot N, Chevrier C, Ramalho O, Mandin C, Le Bot B. 2014. Semivolatile organic compounds in indoor air and settled dust in 30 French dwellings. Environ Sci Technol. 48:3959-3969.
Blystone CR, Kissling GE, Bishop JB, Chapin RE, Wolfe GW, Foster PMD. 2010. Determination of the di-(2-ethylhexyl) phthalate NOAEL for reproductive development in the rat: importance of the retention of extra animals to adulthood. Toxicol Sci. 116(2):640-646.
Boekelheide K, Kleymenova E, Liu K, Swanson C, Gaido KW. 2009. Dose-dependent effects on cell proliferation, seminiferous tubules, and male germ cells in the fetal rat testis following exposure to di(n-butyl) phthalate. Microsc Res Tech. 72(8):629-638.
Bono-Blay F, Guart A, de la Fuente B, Pedemonte M, Pastor MC, Borrell A, Lacorte S. 2012. Survey of phthalates, alkylphenols, bisphenol A and herbicides in Spanish source waters intended for bottling. Environ Sci Pollut Res Int. 19(8):3339-3349.
Bornehag CG, Lundgren B, Weschler CH, Sigsgaard T, Hagerhed-Engman L, Sundell J. 2005. Phthalates in indoor dust and their association with building characteristics. Environ Health Perspect. 113:1399-1404.
Bradlee CA, Thomas P. 2003. The Handbook of Environmental Chemistry: Phthalate Esters. Staples CA, editor. Berlin (DE): Springer-Verlag Berlin Heidelberg. Volume 3. Part Q. Aquatic toxicity of phthalate esters. pp. 263-298.
Bradley EL, Burden RA, Leon I, Mortimer DN, Speck DR, Castle L. 2013a. Determination of phthalate diesters in foods. Food Addit Contam Part A Chem Anal Control Expo Risk Assess. 30(4):722-734.
Bradley EL, Burden RA, Bentayeb K, Driffield M, Harmer N, Mortimer DN, Speck DR, Ticha J, Castle L. 2013b. Exposure to phthalic acid, phthalate diesters and phthalate monoesters from foodstuffs: UK total diet study results. Food Addit Contam Part A Chem Anal Control Expo Risk Assess. 30(4):735-742.
Brigden K, Hetherington S, Wang M, Santillo D, Johnston P. 2013. Hazardous chemicals in branded textile products on sale in 25 countries/regions during 2013. Greenpeace Research Laboratories Technical Report 06/2013.
Brown D, Thompson RS, Stewart KM, Croudace CP, Gillings E. 1996. The effect of phthalate ester plasticisers on the emergence of the midge (Chironomus riparius) from treated sediments. Chemosphere. 32(11):2177-2187.
Bu Z, Zhang Y, Mmereki D, Yu W, Li B. 2016. Indoor phthalate concentration in residential apartments in Chongqing, China : implications for preschool children’s exposure and risk assessment. Atmos Environ. 127:34-35
Buccafusco RJ, Ells SJ, LeBlanc GA. 1981. Acute toxicity of priority pollutants to bluegill (Lepomis macrochirus). Bull Environ Contam Toxicol. 26:446-452.
Call DJ, Markee TP, Geiger DL, Brooke LT, VandeVenter FA, Cox DA, Genisot KI, Robillard KA, Gorsuch JW, Parkerton TF, Reiley MC, Ankley GT, Mount DR. 2001a. An assessment of the toxicity of phthalate esters to freshwater benthos. 1. Aqueous exposures. Environ Toxicol Chem. 20(8):1798-1804.
Call DJ, Cox DA, Geiger DL, Genisot KI, Markee TP, Brooke LT, Polkinghorne CN, VandeVenter FA, Gorusuch JW, Robillard KA, Parkerton TF, Reiley MC, Ankley GT, Mount DDR. 2001b. An assessment of the toxicity of phthalate esters to freshwater benthos. 2. Sediment exposures. Environ Toxicol Chem. 20(8):1805-1815.
Cammack JN, White RD, Gordon D, Gass J, Hecker L, Conine D, Bruen US, Friedman M, Echols C, Yeh TY, Wilson DM. 2003. Evaluation of reproductive development following intravenous and oral exposure to DEHP in male neonatal rats. Int J Toxicol. 22:159-174.
Canada. 1999. Canadian Environmental Protection Act, 1999. S.C. 1999, c. 33. Canada Gazette, Part III, vol. 22, no. 3.
Canada. 2016. Phthalates Regulations. SOR/2016-188.
Canada. Department of the Environment. 2013. Canadian Environmental Protection Act, 1999: Notice with respect to certain phthalate substances. Canada Gazette, Part I, vol. 147, no. 28, p. 1801-1821.
Cao X. 2008. Determination of phthalates and adipate in bottled water by headspace solid-phase microextraction and gas chromatography/mass spectrometry. J Chromatogr A. 1178(1):231-238.
Cao X, Zhao W, Churchill R, Hilts C. 2014. Occurrence of di-(2-ethylhexyl) adipate and phthalate plasticizers in samples of meat, fish, and cheese and their packaging films. J Food Prot. 77(4):610-620.
Cao X, Zhao W, Dabeka R. 2015. Di-(2-ethylhexyl) adipate and 20 phthalates in composite food samples from the 2013 Canadian Total Diet Study. Food Addit Contam Part A Chem Anal Control Expo Risk Assess. 32(11):1893-1901.
Carnevali O, Tosti L, Speciale C, Peng C, Zhu Y, Maradonna F. 2010. DEHP impairs zebrafish reproduction by affecting critical factors in oogenesis. PLOS ONE. 5(4):1-5.
Casas M, Valvi D, Ballesteros-Gomez A, Gascon M, Fernández MF, Garcia-Esteban R, Iñiguez C, Martínez D, Murcia M, Monfort N, Luque N, Rubio S, Ventura R, Sunyer J, Vrijheid M. 2016. Exposure to bisphenol A and phthalates during pregnancy and ultrasound measures of fetal growth in the INMA-Sabadell cohort. Environ Health Perspect. 124(4):521-528.
[CDC] Centers for Disease Control and Prevention (US). National Center for Health Statistics (NCHS). 2013. National Health and Nutrition Examination Survey Data 1999-2010. Hyattsville, MD: U.S. Department of Health and Human Services, Centers for Disease Control and Prevention.
[CDC] Centers for Disease Control and Prevention (US). National Center for Health Statistics (NCHS). 2014. National Health and Nutrition Examination Survey Data 1999-2012. Hyattsville, MD: U.S. Department of Health and Human Services, Centers for Disease Control and Prevention.
Chang BV, Yang CM, Cheng CH, Yuan SY. 2004. Biodegradation of phthalate esters by two bacteria strains. Chemosphere. 55(4):533-538.
Chang BV, Liao GS, Yuan SY. 2005. Anaerobic degradation of diethyl phthalate, di‑n‑butyl phthalate, and di-(2-ethylhexyl) phthalate from river sediment in Taiwan. Chemosphere. 58(11):1601-1607.
Chang JW, Yan BR, Chang MH, Tseng SH, Kao YM, Chen JC, Lee CC. 2014. Cumulative risk assessment for plasticizer-contaminated food using the hazard index approach. Environ Pollut. 189:77-84.
Chang W-H, Li S-S, Wu M-H, Pan H-A, Lee C-C. 2015. Phthalates might interfere with testicular function by reducing testosterone and insulin-like factor 3 levels. Human Reprod. 30(11):2658-2670.
Chang WH, Wu MH, Pan HA, Guo PL and Lee CC. 2017. Semen quality and insulin-like factor 3: Associations with urinary and seminal levels of phthalate metabolites in adult males. Chemosphere 173:594-602.
Chao KP, Huang CS, Huang ML. 2013. Direct Extraction of phthalate esters from polymeric gloves materials. Adv Mater Res. 804:114-117.
Chen X, Xu S, Tan T, Lee ST, Cheng SH, Lee FWF, Xu SJL, Ho KC. 2014. Toxicity and estrogenic endocrine disrupting activity of phthalates and their mixtures. Int J Environ Res Public Health. 11(3):3156-3168.
Chen Q, Yang H, Zhou N, Sun L, Bao H, Tan L. 2017. Phthalate exposure, even below US EPA reference doses, was associated with semen quality and reproductive hormones: Prospective MARHCS study in general population. Environ Int. 104:58-68.
Cheng X, Ma L, Xu D, Cheng H, Yang G, Luo M. 2015. Mapping of phthalate esters in suburban surface and deep soils around a metropolis-Beijing, China. J Geochem Explor. 155:56-61.
Chi C, Xia M, Zhou C, Wang X, Weng M, Shen X. 2017. Determination of 15 phthalate esters in air by gas-phase and particle-phase simultaneous sampling. Journal of Environ Sci. 55:137-145
[CHMS] 2010. Canadian Health Measures Survey (CHMS) Data User Guide: Cycle 1. [accessed 2014].
[CHMS] 2012. Canadian Health Measures Survey (CHMS) Data User Guide: Cycle 2. [accessed 2014].
Cho WS, Han BS, Ahn B, Nam KT, Choi M, Oh SY, Kim SH, Jeong J, Jang DD. 2008. Peroxisome proliferator di-isodecyl phthalate has no carcinogenic potential in Fischer 344 rats. Toxicol Lett. 178:110-116.
Christensen KLY, Makris SL, Lorber M. 2014. Generation of hazard indices for cumulative exposure to phthalates for use in cumulative risk assessment. Regul Toxicol Pharmacol. 69(3):380-389.
Christiansen S, Boberg J, Axelstad M, Dalgaard M, Vinggaard AM, Metzdorff SB, Hass U. 2010. Low-dose perinatal exposure to di(2-ethylhexyl) phthalate induces anti-androgenic effects in male rats. Reprod Toxicol. 30:313-321.
Christiansen LB, Pedersen KL, Pedersen SN, Korsgaard B, Bierregaard P. 2000. In vivo comparison of xenoestrogens using rainbow trout vitellogenin induction as a screening system. Environ Toxicol Chem. 19(7):1867-1874.
Cirillo T, Latini G, Castaldi MA, Dipaola L, Fasano E, Esposito F, Scognamiglio G, Di Francesco F, Cobellis L. 2015. Exposure to di-2-ethylhexyl phthalate, di-N-butyl phthalate and bisphenol A through infant formulas. J Agric Food Chem. 63:3303-3310.
Clara M, Windhofer G, Hartl W, Braun K, Simon M, Gans O, Scheffknecht C, Chovanec A. 2010. Occurrence of phthalates in surface runoff, untreated and treated wastewater and fate during wastewater treatment. Chemosphere. 78:1078-1084.
Clewell RA, Kremer JJ, Williams CC, Campbell JL, Sochaski MA, Andersen ME, Borghoff SJ. 2009. Kinetics of selected di-n-butyl phthalate metabolites and fetal testosterone following repeated and single administration in pregnant rats. Toxicology. 255(1-2):80-90.
Clewell RA. 2011. Pharmacokinetics and foetal testes effects after diisononyl phthalate administration in rat gestation. The Hamner Protocol #09016 Final Report, DINP Phase I study. Research Triangle Park (NC): The Hamner Institutes for Life Sciences. p. 27709-2137. Sponsored by ExxonMobil Biomedical Sciences Inc. [as cited in ECHA 2013].
Clewell RA, Sochaski M, Edwards K, Creasy DM, Willson G, Anderson ME. 2013. Disposition of diiosononyl phthalate and its effects on sexual development of the male fetus following repeated dosing in pregnant rats. Reprod Toxicol. 35:56-69.
[CMA] Chemical Manufacturers Association. 1984. Acute toxicity of thirteen phthalate esters to fathead minnow (Pimephales promelas) under flowthrough conditions. Springborn Bionomics Inc. report. Washington (DC): Chemical Manufacturers Association [cited in European Commission 2004].
Cocci P, Capriotti M, Mosconi G, Palermo FA. 2017. Effects of endocrine disrupting chemicals on estrogen receptor alpha and heat shock protein 60 gene expression in primary cultures of loggerhead sea turtle (Caretta caretta) erythrocytes. Environ Res 158:616-624.
Cole JG, Mackay D. 2000. Correlating environmental partitioning properties of organic compounds: The three solubility approach. Environ Toxicol Chem 19(2):265-270.
Corradetti B, Stronati A, Tosti L, Manicardi G, Carnevali O, Bizzaro D. 2013. Bis-(2-ethylhexyl) phthalate impairs spermatogenesis in zebrafish (Danio rerio). Reprod Biol. 13(3):195-202.
Cousins IT, Mackay D, Parkerton TF. 2003. The handbook of environmental chemistry. Hutzinger O, editor. Berlin (DE): Springer-Verlag. Volume 3. Anthropogenic compounds. Part Q. Physical-chemical properties and evaluative fate modelling of phthalate esters. p. 263-298.
[Danish EPA] Danish Environmental Protection Agency. 2011. Annex XV: Restriction Report Proposal for a restriction [PDF]. Copenhagen (DK): Danish EPA. Version 2.
David RM. 2000. Exposure to phthalate esters. Environ Health Perspect. 108:A440.
David RM, Moore MR, Finney DC, Guest D. 2000a. Chronic toxicity of di(2-ethylhexyl) phthalate in rats. Toxicol Sci. 55:433-443.
David RM, Moore MR, Finney DC, Guest D. 2000b. Chronic toxicity of di(2-ethylhexyl) phthalate in mice. Toxicol Sci. 58:377-385.
David RM, McKee RH, Butala JH, Barter RA, Kayser M. 2001. Patty’s Toxicology. John Wiley & Sons. Esters of aromatic mono-, di-, and tricarboxylic acids, aromatic diacids and di-, tri-, or polyalcohols. p. 80.
De Cock M, de Boer MR, Lamoree M, Legler J, van de Bor M. 2014. First year growth in relation to prenatal exposure to endocrine disruptors – a Dutch prospective cohort study. Int J Environ Res Public Health. 11(7):7001-7021.
de Ryke D, Willems MI. 1977. Sub-chronic (90 day) toxicity study with dicyclohexyl phthalate in Albino rats. TNO Report R5228 (confidential) [as cited in MAFF 1987].
De Solla SR, Langlois VS. 2014. Toxicity and endocrine disruption of phthalates in fish and amphibians. SRAD Progress Report 2013–2014. 19 p.
Ding K, Lu L, Wang J, Wang J, Zhou M, Zheng C, Liu J, Zhang C, Zhuang S. 2017. In vitro and in silico investigations of the binary-mixture toxicity of phthalate esters and cadmium (II) to Vibrio qinghaiensis sp.-Q67. Sci Total Environ 580:1078-1084.
Dodson RE, Camann DE, Morello-Frosch R, Brody JG, Rudel RA. 2015. Semivolatile organic compounds in homes: strategies for efficient and systematic exposure measurement based on empirical and theoretical factors. Environ Sci Technol. 49(1):113-122.
Dominguez-Morueco N, Gonzalex-Alonso S, Valcarcel Y. 2014. Phthalate occurrence in rivers and tap water from central Spain. Sci Total Environ. 500-501:139-146.
Dostal LA, Chapin RE, Stefansky SA, Harris MW, Schewetz BA. 1988. Testicular toxicity and reduced Sertoli cell numbers in neonatal rats by di(2-ethylhexyl) phthalate and the recovery of fertility as adults. Toxicol Appl Pharmacol. 95:104-121.
Downs SH, Black N. 1998. The feasibility of creating a checklist for the assessment of the methodological quality both of randomised and non-randomised studies of health care interventions. J Epidemiol Community Health. 52:377-84.
[DPD] Drug Product Database [database]. [modified 2014]. Ottawa (ON): Health Canada. [accessed 2014 Sep 9]
Draize J, Alvarez E, Whitesell M, Woodard G, Hagan E, Nelson A. 1948. Toxicological investigations of compounds proposed for use as insect repellents: A. local and systemic effects following topical skin application; B. acute oral toxicity C. pathological examination. J Pharmacol Exp Ther. 93(1):26-39.
[EC] European Commission. 2009. Addendum to Risk Assessment from 2007: Benzyl butyl phthalate: EC No: 201-662-7: CAS: 85-68-7. Rapporteur Member State Norway. 28 p.
[ECCC] Environment and Climate Change Canada. 2018. Supporting documentation: Phthalate Substance Grouping. Information in support of the screening assessment for the Phthalate Substance Grouping. Ottawa (ON): ECCC. Available on request from: substances@ec.gc.ca
[ECCC, HC] Environment and Climate Change Canada, Health Canada. [modified 2007 April 20]. Categorization of chemical substances. Ottawa (ON): Government of Canada. [accessed 2014 Jun 10].
[ECHA] European Chemicals Agency. c2007-2014a. Registered substances database; search for CAS RN 84-69-5 [DIBP]. Helsinki (FI): ECHA. [accessed 2014 Sep].
[ECHA] European Chemicals Agency. c2007-2014b. Registered substances database; search for CAS RN 84-61-7 [DCHP]. Helsinki (FI): ECHA. [accessed 2014 Sep].
[ECHA] European Chemicals Agency. c2007-2015. Registered substances database; search for CAS RN 85-68-7 [BBP]. Helsinki (FI): ECHA. [updated 2016 Mar 24; accessed 2016 Apr 4].
[ECHA] European Chemicals Agency. c2007-2018. Registered substances database; search results for CAS RN 68515-40-2. Helsinki (FI): ECHA. [updated 2018 Jan 9; accessed 2018 Jun 26].
[ECHA] European Chemicals Agency. 2012a. Registration information on identified uses related to article categories. Search result of CASRN [84-74-2].
[ECHA] European Chemicals Agency. 2012b. Registration information on identified uses related to article categories. Search result of CASRN [117-81-7].
[ECHA] European Chemicals Agency. 2012c. Registration information on identified uses related to article categories. Search result of CASRN [84-75-3].
[ECHA] European Chemicals Agency. 2012d. Registration information on identified uses related to article categories. Search result of CASRN [27554-26-3].
[ECHA] European Chemicals Agency. 2013. Evaluation of new scientific evidence concerning DINP and DIDP. Final Review Report [PDF].
[ECHA] ECHA European Chemicals Agency. 2015a. Substance name: Di-butyl phthalate. EC number: 201-557-4. CAS RN 84-74-2. Summary of Classification and Labelling. European Chemicals Agency. Search result for DBP.
[ECHA] ECHA European Chemicals Agency. 2015b. Substance name: Di-ethylhexyl phthalate. EC number: 204-211-0. CAS RN 117-81-7. Summary of Classification and Labelling. European Chemicals Agency. Search result for DEHP.
[ECHA] ECHA European Chemicals Agency. 2015c. Substance name: Dihexyl phthalate. EC number: 201-559-5. CAS RN 84-75-3. Summary of Classification and Labelling. European Chemicals Agency. Search result for DnHP.
[ECHA] ECHA European Chemicals Agency. 2015d. Substance name: Diisooctyl phthalate. EC number: 248-523-5. CAS RN 27554-26-3. Summary of Classification and Labelling. European Chemicals Agency. Search result for DIOP
[ECHA] ECHA European Chemicals Agency. 2018. Ref-4 Project Report. Harmonized Enforcement Project on Restrictions [PDF].
[ECOSAR] ECOlogical Structure Activity Relationships Class Program [estimation model]. 2009. Ver. 1.00. Washington (DC): US Environmental Protection Agency, Office of Pollution Prevention and Toxics; Syracuse (NY): Syracuse Research Corporation.
[EFSA] European Food Safety Authority. 2005. Opinion of the scientific panel on food additives, flavourings, processing aids, and materials in contact with food (AFC) related to bis(2-ethylhexyl)phthalate (DEHP) for use in food contact materials. EFSA Journal 3(9):243, 20 pp.
Ema M, Miyawaki E, Hirose A, Kamata E. 2003. Decreased anogenital distance and increased incidence of undescended testes in fetuses of rats given monobenzyl phthalate, a major metabolite of butyl benzyl phthalate. Reprod Toxicol. 17:407-412.
Engelhardt G, Tillmanns G, Wallnofer PR, Hutzinger O. 1977. Biodegradation of di-iso-butyl phthalate and related dialkyl phthalates by Penicillium lilacinum. Chemosphere. 6:347-354.
Environment Canada. 2014. Data for phthalate substances collected under the Canadian Environmental Protection Act, 1999, section 71: Notice with respect to certain phthalate substances. Data prepared by: Environment Canada, Existing Substances Program.
Environment Canada and Health Canada. 1993. Priority Substances List assessment report: di-n-octyl phthalate. Ottawa (ON): Environment Canada, Health Canada.
Environment Canada and Health Canada. 1994a. Priority Substances List assessment report: bis(2-ethylhexyl) phthalate. Ottawa (ON): Environment Canada, Health Canada.
Environment Canada and Health Canada. 1994b. Priority Substances List assessment report: dibutyl phthalate. Ottawa (ON): Environment Canada, Health Canada.
Environment Canada and Health Canada. 2000. Priority Substances List assessment report: butylbenzylphthalate. Ottawa (ON): Environment Canada, Health Canada.
Environment Canada, Health Canada. 2015a. State of the Science Report: the Phthalate Substance Grouping: Short-Chain Phthalate Ester: 1,2-Benzenedicarboxylic acid, dimethyl ester (DMP). Chemical Abstracts Service Registry Number: 131-11-3. Gatineau (QC): Environment Canada, Health Canada: Existing Substances Program.
Environment Canada, Health Canada. 2015b. State of the Science Report: the Phthalate Substance Grouping: Medium-Chain Phthalate Esters. Chemical Abstracts Service Registry Numbers: 84-61-7; 84-64-0; 84-69-5; 523-31-9; 5334-09-8;16883-83-3; 27215-22-1; 27987-25-3; 68515-40-2; 71888-89-6. Gatineau (QC): Environment Canada, Health Canada: Existing Substances Program.
Environment Canada, Health Canada. 2015c. State of the Science Report: the Phthalate Substance Grouping: 1,2-Benzenedicarboxylic acid, diisononyl ester; 1,2-Benzenedicarboxylic acid, di-C8-10-branched alkyl esters, C9-rich (DINP). Chemical Abstracts Service Registry Numbers: 28553-12-0, 68515-48-0. Gatineau (QC): Environment Canada, Health Canada: Existing Substances Program.
Environment Canada, Health Canada. 2015d. State of the Science Report: the Phthalate Substance Grouping: Long-Chain Phthalate Esters. 1,2-Benzenedicarboxylic acid, diisodecyl ester (diisodecyl phthalate; DIDP) and 1,2-Benzenedicarboxylic acid, diundecyl ester (diundecyl phthalate; DUP). Chemical Abstracts Service Registry Numbers: 26761-40-0, 68515-49-1; 3648-20-2. Gatineau (QC): Environment Canada, Health Canada: Existing Substances Program.
Environment Canada, Health Canada. 2015e. Proposed approach for cumulative risk assessment of certain phthalates under the Chemicals Management Plan [PDF]. August 2015. Gatineau (QC): Health Canada, Environment Canada.
[EPI Suite] Estimation Programs Interface Suite for Microsoft Windows [estimation model]. 2010. Ver. 4.10. Washington (DC): US Environmental Protection Agency, Office of Pollution Prevention and Toxics; Syracuse (NY): Syracuse Research Corporation.
European Commission. 2000. IUCLID Dataset. Ispra (IT): European Commission, Joint Research Centre, Institute for Health and Consumer Protection, European Chemicals Bureau.
European Commission. 2003. European Union risk assessment report: 1,2-benzenedicarboxylic acid, di-C9-11-branched alkyl esters, C10-rich and di-“isodecyl” phthalate (DIDP): CAS: 68515-49-1, 26761-40-0. Luxembourg: Publications Office of the European Union. Report No.: EUR 20785 EN.
European Commission. 2004. European Union risk assessment report: dibutyl phthalate. Addendum to the Environmental Section – 2004. CAS No: 84-74-2. Luxembourg: Publications Office of the European Union. Report No.: EUR 18999 EN.
European Commission. 2008. European Union risk assessment report: bis(2-ethylhexyl) phthalate (DEHP): CAS No: 117-81-7. Luxembourg: Publications Office of the European Union. Report No.: EUR 23384 EN.
Fatoki OS, Bomman M, Ravandhalala L, Chimuka L, Genthe B, Adeniyi A. 2010. Phthalate ester plasticizers in freshwater systems of Venda, South Africa and potential health effects. Water SA. 36(1):117.
Fankhauser-Noti A, Grob K. 2006. Migration of plasticizers from PVC gaskets of lids for glass jars into oily foods: amount of gasket material in food contact, proportion of plasticizer migrating into food and compliance testing by simulation. Trends Food Sci Technol. 17:105-12.
Ferguson KK, McElrath TF, Meeker JD. 2014. Environmental phthalate exposure and preterm birth. JAMA Pediatr 168(1):61-7.
Ferreira ID, Morita DM. 2012. Ex-situ bioremediation of Brazilian soil contaminated with plasticizers process wastes. Braz J Chem Eng. 29:77-86.
Fong J-P, Lee F-J, Lu I-S, Uang S-N, Lee C-C. 2015. Relationship between urinary concentrations of di(2-ethylhexyl) phthalate (DEHP) metabolites and reproductive hormones in polyvinyl chloride production workers. Occup Environ Med. 72:346-353.
Frederiksen H, Aksglaede L, Sorensen K, Skakkebaek NE, Juul A, Andersson AM. 2011. Urinary excretion of phthalate metabolites in 129 healthy Danish children and adolescents: estimation of daily phthalate intake. Environ Res. 111:656-663.
Frederiksen H, Nielsen JKS, Morck TA, Hansen PW, Jensen JF, Nielsen O, Andersson AM, Knudsen LE. 2013. Urinary excretion of phthalate metabolites, phenols and parabens in rural and urban Danish mother-child pairs. Int J Hyg Environ Health. 216(6):772-783.
Fromme H, Lahrz T, Piloty M, Gebhart H, Oddoy A, Rüden H. 2004. Occurrence of phthalates and musk fragrances in indoor air and dust from apartments and kindergartens in Berlin (Germany). Indoor Air. 14(3):188-195.
Fromme H, Gruber L, Schlummer M, Wolz G, Böhmer S, Angerer J, Mayer R, Liebl B, Bolte G. 2007. Intake of phthalates and di (2-ethylhexyl) adipate: results of the integrated exposure assessment survey based on duplicate diet samples and biomonitoring data. Environ Int. 33(8):1012-1020.
Fromme H, Gruber L, Seckin E, Raab U, Zimmermann S, Kiranoglu M, Völkel W. 2011. Phthalates and their metabolites in breast milk - results from the Bavarian Monitoring of Breast Milk (BAMBI). Environ Int. 37(4):715-722.
Fromme H, Gruber L, Schuster R, Schlummer M, Kiranoglu M, Bolte G, Völkel W. 2013. Phthalate and di-(2-ethylhexyl) adipate (DEHA) intake by German infants based on the results of a duplicate diet study and biomonitoring data (INES 2). Food Chem Toxicol. 53:272-280.
Fujii S, Yabe K, Furukawa M, Hirata M, Kiguchi M, Ikka T. 2005. A two-generation reproductive toxicity study of diethyl phthalate (DEP) in rats. J Toxicol Sci 30:97-116.
Furr J, Lambright C, Wilson V, Foster P, Gray L.2014. A short-term in vivo screen using fetal testosterone production, a key event in the phthalate adverse outcome pathway, to predict disruption of sexual differentiation. Toxicol Sci. 140(2):403-432.
Furtmann K. 1994. Phthalates in surface water – a method for routine trace level analysis. Fresenius J Anal Chem. 348:291-296.
Gaido KW, Janran BH, Liu D, Wallace DG, Borghoff S, Johnson KJ, Hall SJ, Boekelheide K. 2007. Fetal mouse phthalate exposure shows that gonocyte multinucleation is not associated with decreased testicular testosterone. Toxicol Sci. 97(2):491-503.
Ganji S, Karigar C, Pujar B.1995. Metabolism of dimethyl terephthalate by Aspergillus niger. Biodegradation. 6:61-66.
Ganning AE, Olsson MJ, Brunk U, Dallner G. 1991. Effects of prolonged treatment with phthalate ester on rat liver. Pharmacol Toxicol. 68:392-401.
Gardner ST, Wood AT, Lester R, Onkst PE, Burnham N, Perygin DH, Rayburn J. 2016. Assessing differences in toxicity and teratogenicity of three phthalates, diethyl phthalate, di-n-propyl phthalate, and di-n-butyl phthalate, using Xenopus laevis embryos. J Toxicol Environ Health Part A 79(2):71-82.
Geiger DL, Brooke LT, Call DJ. 1985. Acute toxicities of organic chemicals to fathead minnows (Pimephales promelas) Vol 2. Superior (WI): Center for Lake Superior Environmental Studies, Univ. of Wisconsin-Superior. 326 pp.
Gevao B, Al-Ghadban AN, Bahloul M, Uddin S, Zafar J. 2013. Phthalates in indoor dust in Kuwait: implication for non-dietary human exposure. Indoor Air. 23(2):126-133.
Giovanoulis G, Bui T, Xu F, Papadopoulou E, Padilla-Sanchex JA, Covaci A, Haug LS, Cousins AP, Magner J, Cousins IT, de Wit CA. 2018. Multi-pathway human exposure assessment of phthalate esters and DINCH. Environ Int 112:115-126.
Gong M, Weschler CJ, Zhang Y. 2016. Impact of clothing on dermal exposure to phthalates: Observations and insights from sampling both skin and clothing. Environ Sci Technol. 50(8):4350-4357.
Gray LE, Ostby J, Furr J, Price M, Veermachaneni DNR, Parks L. 2000. Perinatal exposure to the phthalates DEHP, BBP, and DINP, but not DEP, DMP, or DOTP, alters sexual differentiation of the male rat. Toxicol Sci. 58:350-365.
Guart A, Bono-Blay F, Borrell A, Lacorte S. 2014. Effect of bottling and storage on the migration of plastic constituents in Spanish bottled waters. Food Chem. 156:73-80.
Guerranti C, Sbordoni I, Fanello EL, Borghini F, Corsi I, Focardi SE. 2013. Levels of phthalates in human milk samples from central Italy. Microchem J. 107:178-181.
Guo Y, Kannan K. 2011. Comparative assessment of human exposure to phthalate esters from house dust in China and the United States. Environ Sci Technol. 45:3788-3794.
Guo Y, Zhang Z, Liu L, Li Y, Ren N, Kannan K. 2012. Occurrence and profiles of phthalates in foodstuffs from China and their implications for human exposure. J Agric Food Chem. 60:6913-6919.
Guo Y, Kannan K. 2013. A survey of phthalates and parabens in personal care products from the United States and its implications for human exposure. Environ Sci Technol. 47:14442-14449.
Guo Y, Wang L, Kannan K. 2013. Phthalates and parabens in personal care products from China: concentrations and human exposure. Arch Environ Contam Toxicol. 66(1):113-119.
Hammond BG, Levinskas GJ, Robinson EC, Johannsen FR. 1987. A review of the subchronic toxicity of butyl benzyl phthalate. Toxicol Ind Health. 3:79-98 [as cited in AGDH 2008b, US CPSC 2010a].
Hansen E, Meyer O. 1989. No embryotoxic or teratogenic effect of dimethyl phthalate in rats after epicutaneous application. Pharmacol Toxicol. 64:237-238.
Harries JE, Runnalls T, Hill E, Harris CA, Maddix S, Sumpter JP, Tyler CR. 2000. Development of a reproductive performance test for endocrine disrupting chemicals using pair-breeding fathead minnows (Pimephales promelas). Environ Sci Technol. 34:3003-3011.
Hashizume K, Nanya J, Toda C, Yasui T, Nagano H, Kojima N. 2002. Phthalate esters detected in various water samples and biodegradation of the phthalates by microbes isolated from river water. Biol Pharm Bull. 25(2):209-214.
Haynes WM, Lide DR, editors. 2010. CRC handbook of chemistry and physics. 90th ed.[Internet version 2010]. Physical constants of organic compounds [Internet]. Section 3: 238. [accessed 2009 Dec]. [restricted access].
Hazleton Laboratories. 1968b. 13-week dietary administration - dogs plasticiser (DIDP) [cited in European Commission 2003; AGDH 2008f; US CPSC 2010a].
He R, Li Y, Xiang P, Li C, Zhou C, Zhang S, Cui X, Ma LQ. 2016. Organophosphorus flame retardants and phthalate esters in indoor dust from different microenvironments: Bioaccessibility and risk assessment. Chemosphere. 150:528-535.
Health Canada. 1998. Exposure factors for assessing total daily intake of priority substances by the general population of Canada. Unpublished report. Ottawa (ON): Government of Canada.
Health Canada. 2007. Market Evaluation: Analysis of phthalate content in children’s toys. Consumer Product Safety Bureau. Project #850950.
Health Canada. 2009. Survey-determination of phthalate in various children's toys. Consumer Product Safety Bureau. Project #2008-1090.
Health Canada. [modified 2011a]. Cosmetic ingredient hotlist: list of ingredients that are prohibited for use in cosmetic products. Ottawa (ON): Health Canada, Consumer Product Safety Directorate. [accessed 2015 Jul 13].
Health Canada. 2011b. Report on Human Biomonitoring of Environmental Chemicals in Canada. Results of the Canadian Health Measures Survey Cycle 1 (2007-09). ISBN: 978-1-100-15618-7. [accessed 2014].
Health Canada. 2012. Phthalates in toys: cyclical enforcement 2011-2012. Consumer Product Safety Bureau. Project #2011-1387.
Health Canada. 2013. Second Report on Human Biomonitoring of Environmental Chemicals in Canada. Results of the Canadian Health Measures Survey Cycle 2 (2009-2011). ISBN: 978-1-100-22140-3. [accessed 2014].
Health Canada. 2014. Survey 2014–15: Determination of a Series of 34 Phthalates in Plastic Consumer Products. Consumer Product Safety Bureau. Project #2014-2047.
Health Canada. 2015. Stakeholder Technical Workshop Document: Approach for using chemical categories and read-across to address data gaps for effects on the developing male reproductive system: Phthalate Substance Grouping. August 2015. Ottawa (ON): Health Canada.
Health Canada. 2017. Project Report: Semivolatile Organic Compounds in Canadian Homes; A Comprehensive Household Exposure Study. Ottawa (ON): University of Toronto, Cancer Care Ontario and Environment and Climate Change Canada. MOA 450030497 [unpublished data].
Health Canada. 2018a. 2017–2018 Supplementary Survey on Phthalates in Support of Review of Regulations. Consumer Product Safety Bureau. Project # P2017-00056 A1
Health Canada. 2018b. Supporting Documentation: A Summary of the Health Effects Associated with Exposure to Additional Phthalates. Ottawa (ON): Health Canada. Available on request from: substances@ec.gc.ca.
Health Canada. 2018c. Supporting Documentation:Evaluation of Epidemiologic Studies on Phthalate Compounds and Their Metabolites for Hormonal Effects, Growth and Development and Reproductive Parameters. Ottawa (ON): Health Canada. Available on request from: substances@ec.gc.ca.
Health Canada. 2018d. Supporting Documentation: Evaluation of Epidemiologic Studies on Phthalate Compounds and Their Metabolites for Effects on Behaviour and Neurodevelopment, Allergies, Cardiovascular Function, Oxidative Stress, Breast Cancer, Obesity, and Metabolic Disorders. Ottawa (ON): Health Canada. Available on request from: substances@ec.gc.ca.
Health Canada. 2019. Fifth report on Human Biomonitoring of Environmental Chemicals in Canada. Results of the Canadian Health Measures Survey Cycle 5 (2016-17). ISBN: 2562-9360. [accessed Nov 13 2019].
[HENRYWIN] Henry’s Law Constant Program for Microsoft Windows [estimation model]. 2008. Ver. 3.20. Washington (DC): US Environmental Protection Agency, Office of Pollution Prevention and Toxics; Syracuse (NY): Syracuse Research Corporation.
Herrero Ó, Planelló R, Morcillo G. 2016. The ribosome biogenesis pathway as an early target of benzyl butyl phthalate (BBP) toxicity in Chironomus riparius larvae. Chemosphere 144:1874-1884.
Higuchi TT, Palmer JS, Gray LE Jr., Veeramachaneni DNR. 2003. Effects of dibutyl phthalate in male rabbits following in utero, adolescent, or postpubertal exposure. Toxicol Sci. 72(2):301-313.
Högberg J, Hanberg A, Berglund M, Skerfving S, Remberger M, Calafat AM, Appelgren M. 2008. Phthalate diesters and their metabolites in human breast milk, blood or serum, and urine as biomarkers of exposure in vulnerable populations. Environ Health Perspect. 116(3):3343-3339.
Hongjun Y, Wenjun X, Qing L, Jingtao L, Hongwen Y, Zhaohua L. 2014. Distribution of phthalate esters in topsoil: a case study in the Yellow River Delta, China. Environ Monit Assess. 185:8489-8500.
Hornung MW, Tapper MA, Denny JS, Kolanczyk RC, Sheedy BR, Hartig PC, Aladjov H, Henry TR, Schmieder PK. 2014. Effects-based chemical category approach for prioritization of low affinity estrogenic chemicals. SAR QSAR Environ Res. 25(4):289-323.
Hoshino N, Iwai M, Okazaki Y. 2005. A two-generation reproductive toxicity study of dicyclohexyl phthalate in rats. J Toxicol Sci. 30:79-96.
[HPD] Household Products Database [database]. 1993- . Bethesda (MD): US National Library of Medecine. [archived website; accessed 2014 Jul 3].
Hsu NY, Lee CC, Wang JY, Li YC, Chang HW, Chen CY, Bornehag CG, Wu PC, Sundell J, Su HJ. 2012. Predicted risk of childhood allergy, asthma, and reported symptoms using measured phthalate expsure exposure in dust and urine. Indoor Air. 22:186-199.
[HSDB] Hazardous Substances Data Bank [database recently incorporated into PubChem]. 1983- . Bethesda (MD): National Library of Medicine (US). [accessed 2013 Dec]. Search results for each substance
Huang L-P, Lee C-C, Fan J-P, Kuo P-H, Shih-T-S, Hsu P-C. 2014. Urinary metabolites of di(2-ethylhexyl) phthalate relation to sperm motility, reactive oxygen species generation, and apoptosis in polyvinyl chloride workers. Int Arch Occup Environ Health. 87:635-646.
Hudson RA, Austerberry CF, Bagshaw JC. 1981. Phthalate ester hydrolases and phthalate ester toxicity in synchronously developing larvae of the brine shrimp (Artemia). Life Sci. 29(18):1865-1872.
Jeddi MZ, Rastkari N, Ahmadkhaniha R, Yunesian M. (2015) Concentrations of phthalates in bottled water under common storage conditions: Do they pose a health risk to children? Food Res Int. 69:256-265.
Jensen MS, Anand-Ivell R, Nørgaard-Pedersen B, Jönsson BAG, Bonde JP, Hougaard DM, Cohen A, Lindh CH, Ivell R, Toft G. 2015. Amniotic fluid phthalate levels and male fetal gonad function. Epidemiology. 26(1):91-99.
Ji M, Li S, Zhang J, Di H, Li F, Feng T. 2018. The human health assessment to phthalate acid esters (PAEs) and potential probability prediction by chromophoric dissolved organic matter EEM-FRI fluorescence in Erlong Lake. Int J Environ Res Public Health. 15:1109.
Jia L, Lou X, Guo Y, Sze-Yin Leung K, Zeng, EY. Occurrence of phthalate esters in over-the-counter medicines from China and its implications for human exposure. Environ Int. 98:137-142.
Joensen UN, Frederiksen H, Blomberg Jensen M, Lauritsen MP, Olesen IA, Lassen TH, Andersson AM, Jørgensen N. 2012. Phthalate excretion pattern and testicular function: a study of 881 healthy Danish men. Environ Health Perspect. 120(10):1397-1403.
Johnson S, Saikia N, Sahu R. 2011. Phthalates in toys available in Indian market. Bull Environ Contam Toxicol. 86:621-626.
Jurewicz J, Radwan M, Sobala W, Ligocka D, Radwan P, Bochenek M, Hawuła W, Jakubowski L, Hanke W. 2013. Human urinary phthalate metabolites level and main semen parameters, sperm chromatin structure, sperm aneuploidy and reproductive hormones. Reprod Toxicol. 42:232-241.
Kang Y, Man YB, Cheung KC, Wong MH. 2012. Risk assessment of human exposure to bioaccessible phthalate ethers via indoor dust around the Pear River Delta. Environ Sci Technol. 46:8422-8430.
Kato H, Furuhashi T, Tanaka M, Katsu Y, Watanabe H, Ohta Y, Iguchi T. 2006. Effects of bisphenol A given neonatally on reproductive functions of male rats. Reprod Toxicol. 22(1):20-29.
Khosravi K, Price GW. 2015. Determination of phthalates in soils and biosolids using accelerated solvent extraction coupled with SPE cleanup and GC-MS quantification. Microchem J. 121:205-212.
Kickham P, Otton SV, Moore MM, Ikonomou MG, Gobas FAPC. 2012. Relationship between biodegradation and sorption of phthalate esters and their metabolites in natural sediments. Environ Toxicol Chem. 31(8):1730-1737.
Kim YH, Lee JW, Ahn JY, Gu MB, Moon SH. 2002a. Enhanced degradation of an endocrine-disrupting chemical, butyl benzyl phthalate, by Fusarium oxysporum f. sp. pisi cutinase. Appl Environ Microbiol. 68:4684-4688.
Kim EJ, Kim JW, Lee SK. 2002b. Inhibition of oocyte development in Japanese medaka (Oryzias latipes) exposed to di-2-ethylhexyl phthalate. Environ Int. 28:359-365.
Kim YH, Lee J, Moon SH. 2003. Degradation of an endocrine disrupting chemical, DEHP [di-(2-ethylhexyl)-phthalate], by Fusarium oxysporum f. sp. pisi cutinase. Appl Microbiol Biotechnol. 63:75-80.
Kim YH, Lee J. 2005. Enzymatic degradation of dibutyl phthalate and toxicity of its degradation products. Biotechnol Lett. 27:635-639.
Kim YH, Seo HS, Min J, Kim YC, Ban YH, Han KY, Park JS, Bae KD, Gu MB, Lee J. 2007. Enhanced degradation and toxicity reduction of dihexyl phthalate by Fusarium oxysporum f. sp. pisi cutinase. J Appl Microbiol. 102:221-228.
Kim DS, Um H-J, Lim E-S, Min J, Kim YH. 2008. Degradation of diphenyl phthalate by Sphingomonas chungbukensis. Biotechnol Lett. 30:93-96.
Kinch CD, Kurrasch DM, Habibi HR. 2016. Adverse morphological development in embryonic zebrafish exposed to environmental concentrations of contaminants individually and in mixture. Aquat Toxicol 175:286-298.
[KOAWIN] Octanol-Air Partition Coefficient Program for Microsoft Windows [estimation model]. 2010. Ver. 1.10. Washington (DC): US Environmental Protection Agency, Office of Pollution Prevention and Toxics; Syracuse (NY): Syracuse Research Corporation.
Koch HM, Becker K, Wittassek M, Seiwert M, Angerer J, Kolossa-Gehring M. 2007 Di-n-butylphthalate and butylbenzylphthalate—urinary metabolite levels and estimated daily intakes: pilot study for the German Environmental Survey on children. J Expo Sci Environ Epidemiol. 17:378-387.
Koch HM, Calafat AM. 2009. Human body burdens of chemicals used in plastic manufacture. PhilosTrans R Soc Lond B Biol Sci. 364(1526):2063-2078.
Koch HM, Haller A, Weiss T, Käfferlein HU, Stork J, Brüning T. 2012. Phthalate exposure during cold plastisol application—a human biomonitoring study. Toxicol Lett. 213(1):100-106.
[KOCWIN] Organic Carbon Partition Coefficient Program for Microsoft Windows [estimation model]. 2010. Ver. 2.00. Washington (DC): US Environmental Protection Agency, Office of Pollution Prevention and Toxics; Syracuse (NY): Syracuse Research Corporation.
Kolarik B, Bornehag C-G, Naydenov K, Sundell J, Nielsen OF. 2008. The concentrations of phthalates in settled dust in Bulgarian homes in relation to building characteristic and cleaning habits in the family. Atmos Environ. 42:8553-8559.
Koniecki D, Wang R, Moody RP, Zhu J. 2011. Phthalates in cosmetic and personal care products: Concentrations and possible dermal exposure. Environ Res. 111:329-336.
Korfali SI, Sabra R, Jurdi M, Taleb RI. 2013. Assessment of toxic metals and phthalates in children’s toys and clays. Arch Envrion Contam Toxicol. 65(3):368-381.
[KOWWIN] Octanol-Water Partition Coefficient Program for Microsoft Windows [estimation model]. 2010. Ver. 1.68. Washington (DC): US Environmental Protection Agency, Office of Pollution Prevention and Toxics; Syracuse (NY): Syracuse Research Corporation.
Kubwabo C, Rasmussen P, Fan X, Kosarac I, Wu F, Zidek A, Kuchta S. 2013. Analysis of selected phthalates in Canadian indoor dust collected using household vacuum and standardized sampling techniques. Indoor Air. 23:506-514.
Kurata Y, Kidachi F, Yokoyama M, Toyota N, Tsuchitani M, Katoh M. 1998. Subchronic toxicity of di(2-ethylhexyl)phthalate in common marmosets: lack of hepatic peroxisome proliferation, testicular atrophy, or pancreatic acinar cell hyperplasia. Toxicol Sci. 42(1):49-56.
Kwack SJ, Kim KB, Kim HS, Lee BM. 2009. Comparative toxicological evaluation of phthalate diesters and metabolites in Sprague-Dawley male rats for risk assessment. J Toxicol Environ Health. 72:1446-1454.
Lake BG, Brantom PG, Gangolli SD, Butterworth KR, Grasso P. 1976. Studies on the effects of orally administered Di-(2-ethylhexyl) phthalate in the ferret. Toxicology. 6(3):341-356.
Lake BG, Foster JR, Collins MA, Stubberfield CR, Gangolli SD, Srivastava SP. 1982. Studies on the effects of orally administered dicyclohexyl phthalate in the rat. Acta Pharmacol Toxicol. 51:217-226.
Lamb JC, Chapin RE, Teague J, Lawton AD, Reel JR. 1987. Reproductive effects of four phthalic acid esters in the mouse. Toxicol Appl Pharmacol. 88:255-269.
Langer S, Weschler CJ, Fischer A, Beko G, Toftum J, Clausen G. 2010. Phthalate and PAH concentrations in dust collected from Danish homes and daycare centers. Atmos. Environ. 44:2294-2301.
Latini G, Wittassek M, Del Vecchio A, Presta G, De Felice C, Angerer J. 2009. Lactational exposure to phthalates in southern Italy. Environ Int. 35(2):236-239.
Lee KY, Shibutani M, Takagi H, Kato N, Takigami S, Uneyama C, Hirose M. 2004. Diverse developmental toxicity of di-n-butyl phthalate in both sexes of rat offspring after maternal exposure during the period from late gestation through lactation. Toxicology. 203:221-238.
Lee BM, Koo HJ. 2007. Hershberger assay for antiandrogenic effects of phthalates. J Toxicol Environ Health. 70:1365-1370.
Lee SM, Lee JW, Koo BW, Kim MK, Choi DH, Choi IG. 2007. Dibutyl phthalate biodegradation by the white rot fungus, Polyporus brumalis. Biotechnol Bioeng. 97:1516-1522.
Lehmann KP, Phillips S, Sar M, Foster PMD, Gaido KW. 2004. Dose-dependent alterations in gene expression and testosterone synthesis in the fetal testes of male rats exposed to di (n-butyl) phthalate. Toxicol Sci. 81:60-68.
Lenters V, Portengen L, Smit LAM, Jönsson BAG, Giwercman A, Rylander L, Lindh CH, Spanò M, Pedersen HS, Ludwicki JK, Chumak L, Piersma AH, Toft G, Bonde JP, Heederik D, Vermeulen R. 2015a. Phthalates, perfluoroalkyl acids, metals and organochlorines and reproductive function: a multipollutant assessment in Greenlandic, Polish and Ukrainian men. Occup Environ Med. 72:385-393.
Lenters V, Portengen L, Rignell-Hydbom A, Jönsson BAG, Lindh CH, Piersma AH, Toft G, Bonde JP, Heederik D, Rylander L, Vermeulen R. 2015b. Prenatal phthalate, perfluoroalkyl acid, and organochlorines exposures and term birth weight in three birth cohorts: multi-pollutant models based on elastic net regression. Environ Health Perspect. 124(3):365-372.
Lertsirisopon R, Soda S, Sei K, Ike M, Fujita M. 2006. Biodegradability of four phthalic acid esters under anaerobic condition assessed using natural sediment. J Environ Sci (China). 18(4):793-796.
Letinski DJ, Connelly MJ, Peterson DR, Parkerton TF. 2002. Slow-stir water solubility measurements of selected alcohols and diesters. Chemosphere. 48(3):257-265.
Li B, Chi J, Wu WX, Wang ZK. 2007. Effect of nutrients and light on biodegradation of dibutyl phthalate and di-2-ethylhexyl phthalate in Haihe Estuary. Bull Environ Contam Toxicol. 79:80-83.
Li B, Hu X, Liu R, Zeng P, Song Y. 2015a. Occurrence and distribution of phthalic acid esters and phenols in Hun River Watersheds. Environ Earth Sci. 73:5095-5106.
Li J, Wang G. 2015. Airborne particulate endocrine disrupting compounds in China: Compositions, size distributions and seasonal variations of phthalate esters and bisphenol A. Atmos Res. 154:138-145.
Li K, Ma D, Wu J, Chai C, Shi Y. 2016. Distribution of phthalate esters in agricultural soil with plastic film mulching in Shandong Peninsula, East China. Chemosphere. 164:314-321.
Li LX, Bu T, Su HN, Chen ZC, Liang YY, Zhang GL, Zhu DY, Shan YY, Xu RA, Hu YY, Li JW, Hu GX, Lian QQ, Ge RS. 2015b. In utero exposure to diisononyl phthalate caused testicular dysgenesis of rat fetal testis. Toxicol Lett. 232:466-474.
Li R, Liang J, Gong Z, Zhang N, Duan H. 2017. Occurrence, spatial distribution, historical trend and ecological risk of phthalate esters in the Jiulong River, Southeast China. Sci Total Environ. 580:388-397.
Li X, Chen X, Hu G, Li L, Su H, Wang Y, Chen D, Zhu Q, Li C, Li J, Wang M, Lian Q, Ge RS. 2016. Effects of in utero exposure to dicyclohexyl phthalate on rat fetal Leydig cells. Int J Environ Res Public Health. 13(3):246.
Liang D-W, Zhang T, Fang HHP, He J. 2008. Phthalates biodegradation in the environment. Appl Microbiol Biotechnol. 80:183-98.
Liang Z, Luo Q, Fan H, Lv S, Zeng Y. 2013. Determination of phthalate esters in the children’s products using ultrasonic extraction and gas chromatography. Adv Mater Res. 807-809:124-129.
Lin X, Wang X, Shen T. 2014. Human exposure to phthalate esters from indoor air and dust in China. WIT Trans Eng Sci. 84:1139-1144.
Lington AW, Bird MG, Plutnick RT, Stubblefield WA, Scala RA. 1997. Chronic toxicity and carcinogenic evaluation of diisononyl phthalate in rats. Fundam Appl Toxicol. 36:79-89.
Liu Y, Guan YT, Yang ZH, Cai ZH, Mizuno T, Tsuno H, Zhu WP, Zhang XH. 2009. Toxicity of seven phthalate esters to embryonic development of the abalone Haliotis diversicolor supertexta. Ecotoxicology. 18(3):293-303.
Liu P, Tian T, Barreto J, Chou J. 2013. Assessment and analysis of phthalate esters, in Lake Pontchartrain, by SPME combining with GC-MS. Environ Technol. 34:453-462.
Liu X, Shi J, Bo T, Li H, Crittenden JC. 2015. Occurrence and risk assessment of selected phthalates in drinking water from waterworks in China. Environ Sci Pollut Res Int. 22(14):10690-10698.
Liu N, Wen F, Li F, Zheng X, Liang Z, Zheng H. 2016a. Inhibitory mechanism of phthalate esters on Karenia brevis. Chemosphere 155:498-508.
Liu N, Wang Y, Yang Q, Lv Y, Jin X, Giesy JP, Johnson AC. 2016b. Probabilistic assessment of risks of diethylhexyl phthalate (DEHP) in surface waters of China on reproduction of fish. Environ Pollut. 213:482-488.
[LNHPD] Licensed Natural Health Products Database [database]. [modified 2018 ]. Ottawa (ON): Health Canada. [accessed 2014 Sep 9]
Luongo G, Östman C. 2015. Organophosphate and phthalate esters in settled dust from apartment buildings in Stockholm. Indoor Air. 26(3):414-425.
Luongo G, Ostman C. 2016. Organophosphate and phthalate esters in settled dust from apartment buildings in Stockholm. Indoor Air. 26:414-425.
Lv Y-K, Zhang W, Guo M-M, Zhao F-F, Du X-X. 2015. Centrifugal microextraction tube-cloud point extraction coupled with gas chromatography for simultaneous determination of six phthalate esters in mineral water. Anal Methods. 7:560-565.
Ma J, Chen LL, Guo Y, Wu Q, Yang M, Wu MH, Kannan K. 2014. Phthalate diesters in airborne PM2.5 and PM10 in a suburban area of Shanghai: seasonal distribution and risk assessment. Sci Total Environ. 497-498:467-474.
Ma P, Liu X, Wu J, Yan B, Zhang Y, Lu Y, Wu Y, Liu C, Guo J, Nanberg E, Bornehag CG, Yang X. 2015. Cognitive deficits and anxiety induced by diisononyl phthalate in mice and the neuroprotective effects of melatonin. Sci Rep. 5:14676.
Madsen PL, Thyme JB, Henrikenk K, Moldrup P, Roslev P. 1999. Kinetics of di-(2-ethylhexyl)phthalate mineralization in sludge-amended soil. Environ Sci Technol. 33:2601-2606.
Main K, Mortensen G, Kaleva M, Boisen K, Damgaard I, Chellakooty M, Schmidt I, Suomi A, Virtanen H, Petersen J, Andersson A, Toppari J, Skakkebaek N. 2006. Human breast milk contamination with phthalates and alterations of endogenous reproductive hormones in infants three months of age. Environ. Health Perspect. 114(2):270-276.
Makkliang F, Kanatharana P, Thavarungkul P, Thammakhet-Buranachai C. 2017. A polypyrrole-chitosan cryogel stir-bead micro-solid phase extractor for the determination of phthalate esters in contact lenses storage solutions and in artificial saliva in contact with baby teethers. Analytica Chimica Acta. 985:69-78.
Mankidy R, Wiseman S, Ma H, Giesy JP. 2013. Biological impact of phthalates. Toxicol Lett. 217:50-58.
Marsman D. 1995. NTP technical report on the toxicity studies of dibutyl phthalate (CAS No. 84-74-2) administered in feed to F344/N rats and B6C3F1 mice. Toxic Rep Ser. 30:1-G5.
Martinez MA, Rovira J, Sharma RP, Nadal M, Schuhmacher M, Kumar V. 2018. Comparing dietary and non-dietary source contribution of BPA and DEHP to prenatal exposure: A Catalonia (Spain) case study. Environ Res. 166:25-34.
Martins K, Hagedorn B, Ali S, Kennish J, Applegate B, Leu M, Epp L, Pallister C, Zwollo P. 2016. Tissue phthalate levels correlate with changes in immune gene expression in a population of juvenile wild salmon. Arch Environ Contam Toxicol. 71:35-47.Mathieu-Denoncourt J, Martyniuk CJ, Loughery JR, Yargeau V, de Solla S, Langlois VS. 2016. Lethal and sublethal effects of phthalate diesters in Silurana tropicalis larvae. Environ Toxicol Chem. 35(10):2511-2522.
Matsumoto M, Furuhashi T, Poncipe C, Ema M. 2008. Combined repeated dose and reproductive/developmental toxicity screening test of the nitrophenolic herbicide dinoseb, 2-sec-butyl-4,6-dinitrophenol, in rats. Environ Toxicol. 23(2):169-183.
Mayer FL, Ellersieck MR. 1986. Manual of acute toxicity: interpretation and data base for 410 chemicals and 66 species of freshwater animals. U.S. Fish and Wildlife Service Res. Pub. 160. Washington (DC): United States Department of the Interior, Fish and Wildlife Service [cited in European Commission 2004].
Mayer P, Reichenberg F. 2006. Can highly hydrophobic organic substances cause aquatic baseline toxicity and can they contribute to mixture toxicity? Environ Toxicol Chem. 25(10):2639-2644.
McCarthy JF, Whitmore DK. 1985. Chronic toxicity of di-n-butyl and di-n-octyl phthalate to Daphnia magna and the fathead minnow. Environ Toxicol Chem. 4:167-179.
McCarty LS, Mackay D. 1993. Enhancing ecotoxicological modeling and assessment: body residues and modes of toxic action. Environ Sci Technol. 27(9):1719-1728.
McConnell ML. 2007. Distribution of phthalate monoesters in an aquatic food web. School of Resource and Environmental Management. Master of Resource Management Thesis Project Report No. 426. Spring 2007. Burnaby (BC): Simon Fraser University. pp. 78.
McGoldrick D, Barresi E, Atkinson B. 2016. Unpublished CMP2 biota monitoring data submitted to Ecological Assessment Division of Environment and Climate Change Canada, Gatineau (QC).
McKee RH, Pavkov KL, Trimmer GW, Keller LH, Stump DG. 2006. An assessment of the potential developmental and reproductive toxicity of diisoheptyl phthalate in rodents. Reprod Toxicol. 21:241-252.
Meek M, Boobis A, Crofton K, Heinemeyer G, VanRaaij M, Vickers C. 2011. Risk assessment of combined exposure to multiple chemicals: A WHO/IPCS framework. Regul Toxicol Pharmacol. 60:S1-S14.
Meeker JD, Hu H, Cantonwine DE, Lamadrid-Figueroa H, Calafat AM, Ettinger AS, Hernandez-Avila M, Loch-Caruso R, Téllez-Rojo MM. 2009. Urinary phthalate metabolites in relation to preterm birth in Mexico City. Environ Health Perspect. 117(10):1587-1592.
Meeker JD, Ferguson KK. 2014. Urinary phthalate metabolites are associated with decreased serum testosterone in men, women, and children from NHANES 2011-2012. J Clin Endocrinol Metab. 99(11):4346-4352.
Mendiola J, Jørgensen N, Andersson A-M, Calafat AM, Silva MJ, Redmon JB, Sparks A, Drobnis EZ, Wang C, Liu F, Swan SH. 2011. Associations between urinary metabolites of di(2-ethylhexyl) phthalate and reproductive hormones in fertile men. Int J Androl. 34(4):369-378.
Mendiola J, Meeker JD, Jørgensen N, Andersson AM, Liu F, Calafat AM, Redmon JB, Drobnis EZ, Sparks AE, Wang C, Hauser R, Swan SH. 2012. Urinary concentrations of di(2-ethylhexyl) phthalate metabolites and serum reproductive hormones: pooled analysis of fertile and infertile men. J Androl. 33(3):488-498.
Mlynarčíková A, Ficková M, Scsuková S. 2007. The effects of selected phenol and phthalate derivatives on steroid hormone production by cultured porcine granulosa cells. ATLA 35:71-77.
Moody S, Goh H, Bielanowiicz A, Rippon P, Loveland KL, Itman C. 2013. Prepubertal mouse testis growth and maturation and androgen production are acutely sensitive to di-n butyl phthalate. Endocrinology. 154:3460-3475.
Moore MR. 1998. Oncogenicity study in mice with di(isononyl) phthalate including ancillary hepatocellular proliferation and biochemical analyses. Vienna (VA): Covance Laboratories, Inc.22182. For Aristech Chemical Corporation, Pittsburgh, PA 15230. Covance 2598-105 [as cited in AGDH 2008c; US CPSC 2010b].
Morin A. 2003. Distribution of phthalate esters in marine mammal food chain from Canada’s Eastern Arctic. Masters Thesis. Burnaby (BC): Simon Fraser University. Report No. 338, p. 1-89.
Mortensen GK, Main KM, Andersson AM, Leffers H, Skakkebaek NE. 2005. Determination of phthalate monoesters in human milk, consumer milk, and infant formula by tandem mass spectrometry (LC-MS-MS). Anal Bioanal Chem. 382:1084-1092.
Mouritsen A, Frederiksen H, Sørensen K, Aksglaede L, Hagen C, Skakkebaek NE, Main KM, Andersson AM, Juul A. 2013. Urinary phthalates from 168 girls and boys measured twice a year during a 5-year period: associations with adrenal androgen levels and puberty. J Clin Endocrinol Metab. 98(9):3755-64.
Mousa A, Basheer C, Al-Arfaj AR. 2013. Determination of phthalate esters in bottled water using dispersive liquid-liquid microextraction coupled with GC-MS. J Sep Sci. 36(12):2003-2009.
[MPBPWIN] Melting Point Boiling Point Program for Microsoft Windows [estimation model]. 2008. Ver. 1.43. Washington (DC): US Environmental Protection Agency, Office of Pollution Prevention and Toxics; Syracuse (NY): Syracuse Research Corporation.
Muenhor D, Moon HB, Lee S, Goosey E. 2018. Organophosphorus flame retardants (PFRs) and phthalates in floor and road dust from a manual e-waste dismantling facility and adjacent communities in Thailand. Envir Science and Health, Part A. 53(1):79-90.
Nagao T, Ohta R, Marumo H, Shindo T, Yoshimura S, Ono H. 2000. Effect of butyl benzyl phthalate in Sprague-Dawley rats after gavage administration: a two-generation reproductive study. Reprod Toxicol. 14:513-532.
Nair N. 2015. Dose-dependent short-term study of di-n-butyl phthalate on the testicular antioxidant system of Wistar rats. Environ Sci Pollut Res Int. 22(3):2196-2204.
[NAS] National Academies of Science. 2008. Phthalates and Cumulative Risk Assessment: The Task Ahead. Committee on the Health Risks of Phthalates, National Research Council. ISBN: 0-309-12842-0.
Negev M, Berman T, Reicher S, Sadeh M, Ardi R, Shammai Y. 2018. Concentrations of trace metals, phthalates, bisphenol A and flame-retardants in toys and other children's products in Israel. Chemosphere. 192:217-224.
Net S, Rabodonirina S, Sghaier RB, Dumoulin D, Chbib C, Tlili I, Ouddane B. 2015. Distribution of phthalates, pesticides and drug residues in the dissolved, particulate and sedimentary phases from transboundary rivers (France-Belgium). Sci Total Environ. 521-522:152-159.
[New EQC] New Equilibrium Criterion Model. 2011. Ver. 1.00 (Beta). Peterborough (ON): Trent University, Canadian Centre for Environmental Modelling and Chemistry.
[NHPID] Natural Health Products Ingredients Database [database]. [modified 2018]. Ottawa (ON): Health Canada. [accessed 2014 Sep 9].
Niu L, Xu Y, Xu C, Yun L, Liu W. 2014. Status of phthalate esters contamination in agricultural soils across China and associated health risks. Environ Pollut. 195:16-23.
Niu S, Zhang C. 2018. Endocrine disrupting compounds from the source water of the Huai River (Huainan City), China. Arch Environ Contam Toxicol. 74:471-483.
Nilsson NH, Malmgren-Hansen B, Bernth N, Pedersen E and Pommer K. 2006. Survey and health assessment of chemicals substances in sex toys. Survey of Chemical Substances in Consumer Products, No. 77. Danish Environmental Protection Agency, Copenhagen.
Norman A, Börjeson H, David F, Tienpont B, Norrgren L. 2007. Studies of uptake, elimination, and late effects in Atlantic salmon (Salmo salar) dietary exposed to Di-2-ethylhexyl phthalate (DEHP) during early life. Arch Environ Contam Toxicol. 52:235-242.
[NPRI] National Pollutant Release Inventory [database]. 2010-2014. Search results for CAS RNs 131-11-3, 84-66-2, 84-74-2, 85-68-7, 117-81-7 and 117-84-0. Ottawa (ON): Government of Canada. [updated 2016 Jan 4; accessed 2016 Apr 6].
[NRC] National Research Council. 2012. Material Emissions Testing for Phthalates. Unpublished report.
[NTP] National Toxicology Program (US). 1995. Toxicology and carcinogenesis studies of diethylphthalate (CAS no. 84-66-2) in F344/N rats and B6C3F1 mice (dermal studies) with dermal initiation/promotion study of diethylphthalate and dimethylphthalate (CAS no. 131-11-3) in male Swiss (CD-1) mice. Technical Report Series No. 429:1-286.
[NTP] National Toxicology Program (US). 1997. Toxicology and Carcinogenesis Studies of Butyl Benzyl Phthalate (CAS No. 85-68-7) in F344/N Rats (Feed Studies). Report No. NTP TR 458. NIH Publication No. 97-3374: US Department of Health and Human Services, Public Health Service, National Institute of Health [as cited in AGDH 2008b].
Oehlmann J, Schulte-Oehlmann U, Kloas W, Jagnytsch O, Lutz I, Kusk KO, Wollenberger L, Santos EM, Paull GC, Van Look KJW, Tyler CR. 2009. A critical analysis of the biological impacts of plasticizers on wildlife. Philos Trans R Soc Lond B Biol Sci. 364(1526):2047-2062.
Oishi S, Hiraga K. 1980a. Testicular atrophy induced by phthalic acid esters: effect on testosterone and zinc concentrations. Toxicol Appl Pharmacol. 53:35-41.
Oishi S, Hiraga K. 1980b. Effect of phthalic acid esters on mouse testes. Toxicol Lett. 5:413-416.
Orecchio S, Indelicato R, Barreca S. 2013. The distribution of phthalate esters in indoor dust of Palermo (Italy). Environ Geochem Health. 35:613-624.
Ortiz-Zarragoitia M, Trant JM, Cajaraville MP. 2006. Effects of dibutylphthalate and ethynylestradiol on liver peroxisomes, reproduction, and development of zebrafish (Danio rerio). Environ Toxicol Chem. 25(9):2394-2404.
Otton SV, Sura S, Blair J, Ikonomou MG, Gobas FAPC. 2008. Biodegradation of mono-alkyl phthalate esters in natural sediments. Chemosphere. 71:2011-2016.
Page BD, Lacroix GM. 1992. Studies into the transfer and migration of phthalate esters from aluminium foil‐paper laminates to butter and margarine. Food Addit Contam. 9(3):197-212.
Page BD, Lacroix GM. 1995. The occurrence of phthalate ester and di‐2‐ethylhexyl adipate plasticizers in Canadian packaging and food sampled in 1985-1989: a survey. Food Addit Contam. 12(1):129-151.
Pan G, Hanaoka T, Yoshimura M, Zhang S, Wang P, Tsukino H, Inoue K, Nakazawa H, Tsugane S, Takahashi K. 2006. Decreased serum free testosterone in workers exposed to high levels of Di-n-butyl phthalate (DBP) and di-2-ethylhexyl phthalate (DEHP): a cross-sectional study in China. Environ Health Perspect. 114(11):1643-1648.
Pan Y, Jing J, Dong F, Yao Q, Zhang W, Zhang H, Yao B, Dai J. 2015. Association between phthalate metabolites and biomarkers of reproductive function in 1066 Chinese men of reproductive age. J Hazard Mater. 300:729-736.
Pan Y, Wang X, Yeung LWY, Sheng N, Cui Q, Cui R, Zhang H, Dai J. 2017. Dietary exposure to di-isobutyl phthalate increases urinary 5-methyl-2’-deoxycytidine level and affects reproductive function in adult male mice. J Environ Sci. 61:14-23.
Pant N, Shukla M, Kumar Patel D, Shukla Y, Mathur N, Kumar Gupta Y, Saxena DK. 2008. Correlation of phthalate exposures with semen quality. Toxicol Appl Pharmacol. 23(1):112-116.
Pant N, Kumar G, Upadhyay AD, Patel DK, Gupta YK, Chaturvedi PK. 2014. Reproductive toxicity of lead, cadmium, and phthalate exposure in men. Environ Sci Pollut Res Int. 21(18):11066-11074.
Papadopoulos A, Vlachogiannis D, Maggos T, Sfetsos A, Karayiannis MI. 2013. A semi-quantitative approach for analysing low-volatile organic compounds in house dust using an SFE method: Significant common features and particular differences of the extracts. J Supercrit Fluids. 82:268-281.
Patyna PJ, Brown RP, Davi RA, Letinski DJ, Thomas PE, Cooper KR, Parkerton TF. 2006. Hazard evaluation of diisononyl phthalate and diisodecyl phthalate in a Japanese medaka multigenerational assay. Ecotoxicol Environ Saf. 65(1):36-47.
Pei XQ, Song M, Guo M, Mo FF, Shen XY. 2013. Concentration and risk assessment of phthalates present in indoor air from newly decorated apartments. Atmos Environ. 68:17-23.
Pelletier M, Moore S, Rondeau M. 2016. Unpublished CMP2 sediment monitoring data submitted to Ecological Assessment Division of Environment and Climate Change Canada, Gatineau (QC).
Peng L. 2015. Mice brain tissue injury induced by diisononyl phthalate exposure and the protective application of vitamin E. J Biochem Mol Toxicol. 29(7):311-20.
Peterson DR, Staples CA. 2003. Handbook of Environmental Chemistry. Staples CA, editor. V.3, Phthalate esters. Part Q, Degradation of phthalate esters in the environment. Springer-Verlag, Berlin-Heidelberg-New York-Hong Kong- London-Milan- Paris-Tokyo, pp. 85-124.
Philippat C, Mortamais M, Chevrier C, Petit C, Calafat AM, Ye X, Silva MJ, Brambilla C, Pin I, Charles MA, Cordier S, Slama R. 2012. Exposure to phthalates and phenols during pregnancy and offspring size at birth. Environ Health Perspect. 120(3):464-470.
Phokha W, Kessler W, Csanady GA, Filser JG. 2002. Toxicokinetics of di(2-ethylhexyl) phthalate and mono(2-ethylhexyl) phthalate in non-pregnant and pregnant rats. Naunyn Schmiedebergs Arch Pharmacol. 365(Suppl 1):R497, p. 128. [Abstract].
Poon R, Lecavalier P, Mueller R, Valli VE, Procter BG, Chu I. 1997. Subchronic oral toxicity of di-n-octyl phthalate and di(2-ethylhexyl) phthalate in the rat. Food Chem Toxicol. 35:225-239.
Pourzamani H, Falahati M, Rastegari F, Ebrahim K. 2017. Freeze–melting process significantly decreases phthalate ester plasticizer levels in drinking water stored in polyethylene terephthalate (PET) bottles. Water Science and Technology: Water Supply. 17.3:745-751.
[RAPEX] Rapid Alert System for non-food dangerous products, ‘RAPid EXchange’. 2015. Weekly Notification reports.
Remberger M, Kaj L, Hansson K, Andersson H, Brorström-Lundén E, Lunder H, Schlabach M. 2013. Selected plasticisers and additional sweeteners in the Nordic Environment. Copenhagen (DK): Nordic Council of Ministers.
Renberg LO, Sundström SG, Rosen-Olofsson AC. 1985. The determination of partition coefficients of organic compounds in technical products and waste waters for the estimation of their bioaccumulation potential using reverse-phase thin layer chromatography. Toxicol Environ Chem. 10:333-349.
Roslev P, Madsen PL, Thyme JB, Henriksen K. 1998. Degradation of phthalate and di-(2-ethylhexyl) phthalate by indigenous and inoculated microorganisms in sludge-amended soil. Appl Environ Microbiol. 64:4711-4719.
Rüdel H, Schmidt S, Kordel W, Klein W. 1993. Degradation of pesticides in soil: comparison of laboratory experiments in a biometer system and outdoor lysimeter experiments. Sci Total Environ. 132:181-200.
Rudel RA, Dodson RE, Perovich LJ, Morello-Frosch R, Camann DE, Zuniga MM, Yau AY, Just AC, Green Brody J. 2010. Semivolatile endocrine-disrupting compounds in paired indoor and outdoor air in two northern California communities. Environ Sci Technol. 44(17):6583-6590.
Russo MV, Avino P, Notardonato I. 2016. Fast analysis of phthalates in freeze-dried baby foods by ultrasound-vortex-assisted liquid-liquid microextraction coupled with gas chromatography-ion trap/mass spectrometry. J Chromatog A. 1474:1-7.
Ruzicková J, Raclavskáa H, Raclavsky K, Juchelková V. 2016. Phthalates in PM2.5 airborne particles in the Moravian-Silesian Region, Czech Republic. Perspect Sci. 7:178-183.
Saffarini CM, Heger NE, Yamasaki H, Liu T, Hall SJ, Boekelheidi K. 2012. Induction and persistence of abnormal testicular germ cells following gestational exposure to di-(n-butyl) phthalate in p53-null mice. J Androl. 33(3):505-513.
Saillenfait AM, Sabaté JP, Gallissot F. 2008. Diisobutyl phthalate impairs the androgen-dependent reproductive development of the male rat. Reprod Toxicol. 26(2):107-115.
Saillenfait AM, Sabate JP, Robert A, Rouiller-Fabre V, Roudot AC, Moison D, Denis F. 2013a. Dose-dependent alterations in gene expression and testosterone production in fetal rat testis after exposure to di-n-hexyl phthalate. J Appl Toxicol. 33(9):1027-1035.
Saillenfait AM, Sabate JP, Robert A, Cossec B, Roudot AC, Denis Flavien D, Burgart M. 2013b. Adverse effects of diisooctyl phthalate on the male rat reproductive development following prenatal exposure. Reprod Toxicol. 42:192-202.
Saini A, Thaysen C, Jantunen L, McQueen RH, Diamond ML. 2016. From clothing to laundry water: Investigating the fate of phthalates, brominated flame retardants, and organophosphate esters. Environ Sci and Technol. 50:9289-9297.
Sajid M, Basheer C, Alsharaa A, Narasimhan K, Buhmeida A, Al Qahtani M, Al-Ahwal MS. 2016. Development of natural sorbent based micro-solid-phase extraction for determination of phthalate esters in milk samples. Analytica Chimica Acta. 924:35-44.
[SCCNFP] Scientific Committee on Cosmetic Products and Non-food Products Intended for Consumers (scientific advisory body to the European Commission). 2002. Opinion of the scientific committee on cosmetic products and non-food products intended for consumers concerning diethyl phthalate (SCCNFP/0411/01). Adopted by the SCCNFP during the 20th Plenary meeting of 4 June 2002.
Schecter A, Lorber M, Guo Y, Wu Q, Yun SH, Kannan K, Birnbaum LS. 2013. Phthalate concentrations and dietary exposure from food purchased in New York State. Environ Health Perspect. 121(4):473-494.
Schenker U, MacLeod M, Scheringer M, Hungerbühler K. 2005. Improving data quality for environmental fate models: A least-squares adjustment procedure for harmonizing physicochemical properties of organic compounds. Environ Sci Technol 39(21):8434-8441.
Scheunert I, Vockel D, Schmitzer J, Korte F. 1987. Biomineralization rates of 14C-labelled organic chemicals in aerobic and anaerobic suspended soil. Chemosphere. 16(5):1031-1041.
Schmieder P, Kolanczyk RC, Hornung MW, Tapper MA, Denny JS, Sheedy BR, Aladjov H. 2014. A rule-based expert system for chemical prioritization using effects-based chemical categories. SAR QSAR Environ Res. 25(4):253-287.
Selvaraj KK, Sundaramoorthy G, Ravichandran PK, Girijan GK, Sampath S, Ramaswamy BR. 2015. Phthalate esters in water and sediments of the Kaveri River, India: environmental levels and ecotoxicological evaluations. Environ Geochem Health 37:83-96.
Shanker R, Ramakrishna C, Seth PK. 1985. Degradation of some phthalic acid esters in soil. Environ Pollut. 39:1-7.
Sivamurthy K, Swamy BM, Pujar BG. 1991. Transformation of dimethyl-terephthalate by the fungus Sclerotium rolfsii. FEMS Microbiol Lett. 79:37-40.
Skrbic BD, Ji Y, Durisic-Mladenovic N, Zhao J. 2016. Occurence of the phthalate esters in soil and street dust samples from the Novi Sad city area, Serbia, and the influence on the children’s and adults’ exposure. J Hazard Mater. 312:272-279.
Sørensen LK. 2006. Determination of phthalates in milk and milk products by liquid chromatography/tandem mass spectrometry. Rapid Commun Mass Spectrom. 20(7):1135-1143.
Specht IO, Toft G, Houggard KS, Lindh CH, Lenters V, Jönsson BAG, Heederik D, Giwercman A, Bonde JPE. 2014. Associations between serum phthalates and biomarkers of reproductive function in 589 adult men. Environ Int. 66:146-156.
Srivastava SP, Srivastava S, Saxena DK, Chandra SV, Seth PK. 1990a. Testicular effects of di-n-butyl phthalate (DBP): biochemical and histopathological alterations. Arch Toxicol. 64:148-152.
Srivastava S, Singh GB, Srivastava SP, Seth PK. 1990b. Testicular toxicity of di-n-butyl phthalate in adult rats: Effect on marker enzymes of spermatogenesis. Indian J Exp Biol. 28:67-70.
Statistics Canada. 2004. Canadian Community Health Survey – Nutrition (CCHS). Detailed information for 2004 (Cycle 2.2). Ottawa (ON): Statistics Canada.
Statistics Canada, 2011.. Canadian Health Measures Survey (CHMS) Data User Guide: Cycle 1. [accessed 2014].
Statistics Canada 2012. Canadian Health Measures Survey (CHMS) Data User Guide: Cycle 2. [accessed 2014].
Stringer R, Labunska I, Santillo D, Johnston P, Siddorn J, Stephenson A. 2000. Concentrations of phthalate esters and identification of other additives in PVC children’s toys. Environ Sci Pollut Res Int. 7(1):27-36.
Study Submission. 2014b. Unpublished confidential study submitted to Environment Canada under the Chemicals Management Plan initiative. Gatineau (QC): Environment Canada, Program Development and Engagement Division. Internal reference: 1986 study_85-68-7_Other_2.
Study Submission. 2014d. Unpublished confidential study submitted to Environment Canada under the Chemicals Management Plan initiative. Gatineau (QC): Environment Canada, Program Development and Engagement Division. Internal reference: 2008 study_85-68-7_Other
Su P-H, Chen J-Y, Lin C-Y, Chen H-Y, Liao P-C, Ying T-H, Wang S-L. 2014. Sex steroid hormone levels and reproductive development of eight-year-old children following in utero and environmental exposure to phthalates. PLOS ONE. 9(9):e102788.
Subedi B, Sullivan KD, Dhungana B. 2017. Phthalate and non-phthalate plasticizers in indoor dust from childcare facilities, salons, and homes across the USA. Environ Pollut. 230:701-708.
Sun G, Liu K. 2017. Developmental toxicity and cardiac effects of butyl benzyl phthalate in zebrafish embryos. Aquatic Toxicol. 192:165-170.
Takeuchi S, Kojima H, Saito I, Jin K, Kobayashi S, Tanaka-Kagawa T, Jinno H. 2014. Detection of 34 plasticizers and 25 flame retardants in indoor air from houses in Sapporo, Japan. Sci Total Environ. 491-492:28-33.
[TEST] Toxicity Estimation Software Tool. 2016. Ver. 4.2. Washington (DC): US Environmental Protection Agency.
Thurston SW, Mendiola J,Bellamy AR, Levine H, Wang HC, Sparks A, Redmon JB, Drobnis EZ, Swan SH. 2016. Phthalate exposure and semen quality in fertile US men. Andrology 4:632-638.
[TIMES] TIssue MEtabolism Simulator [prediction module]. 2014. Ver. 2.27.15. Bourgas (BG): University “Prof. Dr. Assen Zlatarov”, Laboratory of Mathematical Chemistry.
Timofieyskaya LA. 1976. Major Problems of Remote After-Effects of Exposure to Occupational Poisons. Collected scientific works. Plyasunov AK, Pahkova GA, editors. p. 40-43 [as cited in IUCLID 2000].
Tonk ESM, Verhoef A, Gremmer ER, van Loveren H, Piersma AH. 2012. Relative sensitivity of developmental and immune parameters in juvenile versus adult male rats after exposure to di(2-ethylhexyl) phthalate. Toxicol Appl Pharmacol. 260:48-57.
Tran TM, Kannan K. 2015. Occurrence of phthalate diesters in particulate and vapor phases in indoor air and implications for human exposure in Albany, New York, USA. Arch Environ Contam Toxicol. 68:489-499.
Tran TM, Minh TB, Kumosani TA, Kannan K. 2016. Occurrence of phthalate diesters (phthalates), p-hydroxybenzoic acid esters (parabens), bisphenol A diglycidyl ether (BADGE) and their derivatives in indoor dust from Vietnam: Implications for exposure. Chemosphere. 144:1553-1559.
Tran TM, Le HT, Minh TB, Kannan K. 2017. Occurrence of phthalate diesters in indoor air from several Northern cities in Vietnam, and its implication for human exposure. Sci Total Environ. 601-602:1695-1701.
Tran BC, Teil M-J, Blanchard M, Alliott F, Chevreuil M. 2015. Fate of phthalates and BPA in agricultural and non-agricultural soils of the Paris area (France). Environ Sci Pollut Res Int. 22(14):11118-11126.
Türk G, Ateşşahin A, Sönmez M, Ceribaşi AO, Yüce A. 2008. Improvement of cisplatin-induced injuries to sperm quality, the oxidant-antioxidant system, and the histologic structure of the rat testis by ellagic acid. Fertil Steril. 89(5):1474-1481.
Tyl RW, Myers CB, Marr MC, Fail PA, Seely JC, Brine DR, Barter RA, Butala JH. 2004. Reproductive toxicity evaluation of dietary butyl benzyl phthalate (BBP) in rats. Reprod Toxicol. 18:241-264.
Tyl et al. 2012. Developmental toxicity evaluation of Santicizer® 261A (S-261A) administered in the diet to CD® (Sprague Dawley) rats. RTI Project Number 0212856.000.001. Unpublished information submitted to Environment Canada under the Chemicals Management Plan initiative. Gatineau (QC): Environment Canada, Program Development and Engagement Division. [restricted access].
Tyl et al. 2013. Two-generation reproductive toxicity evaluation of Santicizer® 261A (S-261A) administered in the diet to CD® (Sprague Dawley) rats. RTI Project Number 0212856.000.002. Unpublished information submitted to Environment Canada under the Chemicals Management Plan initiative. Gatineau (QC): Environment Canada, Program Development and Engagement Division. [restricted access].
[US CPSC] United States Consumer Product Safety Commission. 2010a. Toxicity Review of Benzyl-n-butyl Phthalate. Bethesda (MD).
[US CPSC] United States Consumer Product Safety Commission. 2010b. Toxicity review of diisononyl phthalate (DINP) [PDF]. Bethesda (MD).
[US CPSC CHAP] United States Consumer Product Safety Commission Chronic Hazard Advisory Panel. 2014. Chronic Hazard Advisory Panel on Phthalates and Phthalate Alternatives Final Report [PDF].
[US EPA] United States Environmental Protection Agency. 2010. Screening-level hazard characterization phthalate esters category. April 2010. [PDF]. Bethesda (MD): US CPSC.
[US EPA] United States Environmental Protection Agency. 2011. Exposure factors handbook: 2011 edition. Washington (DC): US EPA, National Center for Environmental Assessment, Office of Research and Development.
Van den Belt K, Verheyen R, Witters H. 2003. Comparison of vitellogenin responses in zebrafish and rainbow trout following exposure to environmental estrogens. Ecotoxicol Environ Saf. 56(2):271-281.
van den Driesche S, Walker M, McKinnell C, Scott HM, Eddie SL, Mitchell RT. 2012. Proposed role for coup-tfii in regulating fetal Leydig cell steroidogenesis, perturbation of which leads to masculinization disorders in rodents. PLOS ONE. 7(5):e37064.
[VCCLab] Virtual Computational Chemistry Laboratory. ALOGPS [non-Java interface]. 2005. Ver. 2.1 Munich (DE): VCCLab. [Tetko IV, Gasteiger J, Todeschini R, Mauri A, Livingstone D, Ertl P, Palyulin VA, Radchenko EV, Zefirov NS, Makarenko AS, et al. 2005. Virtual computational chemistry laboratory - design and description. J Comput Aid Mol Des. 19:453-463.].
Veith GD, Broderius SJ. 1987. QSAR in environmental toxicology-II. Kaiser KLE, editor. Dordrecht (NL): D. Reidel Publishing Company. Structure-toxicity relationships for industrial chemicals causing type (II) narcosis syndrome p. 385-391.
Veith G.D, Broderius SJ. 1990. Rules for distinguishing toxicants that cause type I and type II narcosis syndromes. Environ Health Perspect. 87:207-211.
Wang JL, Chen LJ, Shi HC, Qian Y. 2000. Microbial degradation of phthalic acid esters under anaerobic digestion of sludge. Chemosphere. 41(8):1245-1248.
Wang J, Bo L, Li L, Wang D, Chen G, Christie P, Teng Y. 2014. Occurrence of phthalate esters in river sediments in areas with different land use patterns. Sci Total Environ. 500-501:113-119.
Wang L, Liu M, Tao W, Zhang W, Wang L, Shi X, Lu X, Li X. 2018. Pollution characteristics and health risk assessment of phthalate esters in urban soil in the typical semi-arid city of Xi'an, Northwest China. Chemosphere. 191:467-476.
Wang X, Sheng N, Cui R, Zhang H, Wang J, Dai J. 2017. Gestational and lactational exposure to di-isobutyl phthalate via diet in maternal mice decreases testosterone levels in male offspring. Chemosphere. 172:260-267.
Wang YX, You L, Zeng Q, Sun Y, Huang YH, Wang C, Wang P, Cao WC, Yang P, Li YF, Lu WQ. 2015b. Phthalate exposure and human semen quality: results from an infertility clinic. Environ Res. 142:1-9.
Wang YX, Zeng Q, Sun Y, You L, Wang P, Li M, Yang P, Li J, Huang Z, Wang C, Li S, Dan Y, Li YF. 2016. Phthalate exposure in association with serum hormone levels, sperm DNA damage and spermatozoa apoptosis: a cross-sectional study in China. Environ Res. 150:557-565.
Waterman SJ, Keller LH, Trimmer GW, Freeman JJ, Nikiforov AI, Harris SB, Nicolich MJ, McKee RH. 2000. Two-generation reproduction study in rats given di-isononyl phthalate in the diet. Reprod Toxicol. 14:21-36.
[WATERNT] Water Solubility Program [estimation model]. 2010. Ver. 1.01. Washington (DC): US Environmental Protection Agency, Office of Pollution Prevention and Toxics; Syracuse (NY): Syracuse Research Corporation.
Wei W, Mandin C, Blanchard O, Mercier F, Pelletier M, Le Bot B, Glorennec P, Ramalho O. 2017. Predicting the gas-phase concentration of semi-volatile organic compounds from airborne particles: Application to a French nationwide survey. Sci Total Environ. 576: 319-325.
Wilson R, Jones-Otazo H, Petrovic S, Mitchell I, Bonvalot Y, Williams D, Richardson GM. 2013. Revisiting dust and soil ingestion rates based on hand-to-mouth transfer. Hum Ecol Risk Assess. 19(1):158-188.
Wine RN, Li LH, Barnes LH, Gulati DK, Chapin RE. 1997. Reproductive toxicity of di-n-butylphthalate in a continuous breeding protocol in Sprague-Dawley rats. Environ Health Perspect. 105(1):102-107.
Wolfe GW, Layton KA. 2003. Multigeneration reproduction toxicity study in rats: Di (2- ethylhexyl) Phthalate: multigenerational reproductive assessment by continuous breeding when administered to Sprague-Dawley rats in the diet. Unaudited draft. Gaithersburg (MD): TherImmune Research Corporation. TRC Study No 7244-200.
[WSKOWWIN] Water Solubility for Organic Compounds Program for Microsoft Windows [estimation model]. 2010. Ver. 1.42. Washington (DC): US Environmental Protection Agency, Office of Pollution Prevention and Toxics; Syracuse (NY): Syracuse Research Corporation.
Xiao-feng Z, Nai-qiang Q, Jing Z, Zi L, Yang Z. 2009. Di (n-butyl) phthalate inhibits testosterone synthesis through a glucocorticoid-mediated pathway in rats. Int J Toxicol. 28(5):448-456.
Xie Z, Ebinghaus R, Temme C, Lohmann R, Caba A, Ruck W. 2007. Occurrence and air-sea exchange of phthalates in the arctic. Environ. Sci. Technol. 41:4555-4560.
Xie C, Zhao Y, Gao L, Chen J, Cai D, Zhang Y. 2015. Elevated phthalates’ exposure in children with constitutional delay of growth and puberty. Mol Cell Endocrinol. 407:67-73.
Xu H, Shao X, Zhang Z, Zou Y, Wu X, Yang L. 2013. Oxidative stress and immune related gene expression following exposure to di-n-butyl phthalate and diethyl phthalate in zebrafish embryos. Ecotoxicol Environ Saf. 93:39-44.
Yan H, Ye CM, Yin CQ. 1995. Kinetics of phthalate ester biodegradation by Chlorella pyrenoidosa. Environ Toxicol Chem 14(6):931-938.
Yan H, Pan G, Liang PL. 2002. Effect and mechanism of inorganic carbon on the biodegradation of dimethyl phthalate by Chlorella pyrenoidosa. J Environ Sci Health Part A 37:553-562.
Yan H, Pan G. 2004. Increase in biodegradation of dimethyl phthalate by Closterium lunula using inorganic carbon. Chemosphere. 55:1281-1285.
Yang ZH, Zhang XJ, Cai ZH. 2009. Toxic effects of several phthalate esters on the embryos and larvae of abalone Haliotis diversicolor supertexta. Chin J Oceanol Limnol. 27(2):395-399.
Yang GC, Yen CH, Wang CL. 2014. Monitoring and removal of residual phthalate esters and pharmaceuticals in the drinking water of Kaohsiung City, Taiwan. J Hazard Mater. 277:53-61.
Yang J-F, Yang L-M, Zheng L-Y, Ying G-G, Liu C-B, Luo S-L. 2017. Phthalates in plastic bottled non-alcoholic beverages from China and estimated dietary exposure in adults. Food Additives and Contaminants. 10 (1):44-50.
Ye T, Kang M, Huang Q, Fang C, Chen Y, Shen H, Dong S. 2014. Exposure to DEHP and MEHP from hatching to adulthood causes reproductive dysfunction and endocrine disruption in marine medaka (Oryzias melastigma). Aquat Toxicol. 146:115-126.
Ye T, Kang M, Huang Q, Fang C, Chen Y, Liu L, Dong S. 2016. Accumulation of de(2-ethylhexyl) phthalate causes endocrine-disruptive effects in marine medaka (Oryzias melastigma) embryos. Environ Toxicol 31(1) :116-127.
Zaki G, Shoeib T. 2018. Concentrations of several phthalates contaminants in Egyptian bottled water: Effects of storage conditions and estimate of human exposure. Sci Total Environ. 618:142-150.
Zeng F, Cui K, Li X, Fu J, Sheng G. 2004. Biodegradation kinetics of phthalate esters by Pseudomonas fluorescens FS1. Process Biochem. 39:1125-1129.
Zhang Y, Lee H. 2013. Low-density solvent-based vortex-assisted surfactant-enhanced-emulsification liquid-liquid microextraction combined with gas chromatography-mass spectrometry for the fast determination of phthalate esters in bottled water. J Chromatogr A. 1274:28-35.
Zhang Z, Wan T, Peng X, He G, He G, Liu Y, Zeng L. 2016. Distribution and sources of oxygenated non-hydrocarbons in topsoil of Beijing, China. Environ Sci Pollut Res. 23:16524-16541.
Zhao LL, Xi YL, Huang L, Zha CW. 2009. Effects of three phthalate esters on the life-table demography of freshwater rotifer Brachionus calyciflorus Pallas. Aquat Ecol 43:395-402.
Zhao Y, Shi H-J, Xie C-M, Chen J, Laue H, Zhang Y-H. 2015. Prenatal phthalate exposure, infant growth, and global DNA methylation of human placenta. Environ Mol Mutagen. 56:286-292.
Zhao J, Ji Y, Zhu Z, Zhang W, Zhang L, Zhao J. 2018. PAEs occurrence and sources in road dust and soil in/around parks in May in Tianjin, China. Ecotox Environ Safety. 147:238-244.
Zhou J, Cai ZH, Xing KZ. 2011a. Potential mechanisms of phthalate ester embryotoxicity in the abalone Haliotis diversicolor supertexta. Environ Pollut. 159:1114-1122.
Zhou J, Zhu XS, Cai ZH. 2011b. Influences of DMP on the fertilization process and subsequent embryogenesis of abalone (Haliotis diversicolor supertexta) by gametes exposure. PLOS ONE. 6(10).
Zhou D, Wang H, Zhang J. 2011c. Di-n-butyl phthalate (DBP) exposure induces oxidative stress in epididymis of adult rats. Toxicol Ind Health. 27(1):65-71.
Zhu J, Phillips S, Feng Y, Yang X. 2006. Phthalate esters in human milk: concentration variations over a 6-month postpartum time. Environ Sci Technol. 40:5276-5281.
Zhu J, Harner H, Kubwabo C, White P, Shoeib M, Wilford BH, Feng Y-L. 2007. Semi-volatile organic pollutants in indoor air and indoor dust in Ottawa residences and their implication for human exposure. Proceedings of the 6th International Conference on Indoor Air Quality, Ventilation & Energy Conservation in Buildings, Sendai, Japan, October 28-31, 2007. Vol 2, 115-120.
Zhu XB, Tay TW, Andriana BB, Alam MS, Choi EK, Tsunekawa N, Kanai Y, Kurohmaru M. 2010. Effects of di-iso-butyl phthalate on testes of prepubertal rats and mice. Okajimas Folia Anat Jpn. 86(4):129-136.
Appendices
Appendix A. Substance identity and key physico-chemical properties
| Substance (CAS RN) | Representative structure | Molecular weight (g/mol) | Water solubility (mg/L) | Octanol-water partition coefficient (log Kow) |
|---|---|---|---|---|
| DMP (131-11-3) | 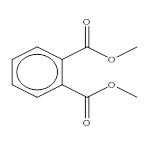 |
194.2 | 4000 (exp)a | 1.61 (exp)h |
| DEP (84-66-2) | 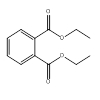 |
222 | 930 (exp)a | 2.47 (exp)b |
| DPrP (131-16-8) | 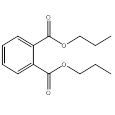 |
250 | 108 (exp)c | 3.27 (exp) c |
| DIBP (84-69-5) | 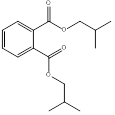 |
278.3 | 20.3 (exp)d | 2.91 (EpiSuite 2010; MCI estimate) 3.07 (EpiSuite 2010; log Kow estimate) |
| DBP (84-74-2) | 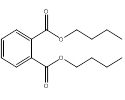 |
278.3 | 11.4 (exp)a | 4.46 (exp)a |
| CHIBP (5334-09-8) | 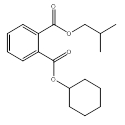 |
304.4 | 6.6 (EpiSuite 2010; WATERNT) 0.323 (EpiSuite 2010; WSKOW) 6.66 (ACD Percepta 2012) 3.04 (VCCLab 2005) | 5.33 (EpiSuite 2010) 4.92 (ACD Percepta 2012) 4.28 (VCCLab 2005) |
| BCHP (84-64-0) | 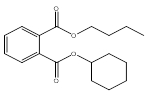 |
304.4 | 3.94 (EpiSuite 2010; WATERNT) 1.073 (EpiSuite 2010; WSKOW) 4.4 (ACD Percepta 2012) 3.4 (VCCLab 2005) | 5.41 (EpiSuite 2010) 5.02 (ACD Percepta 2012) 4.56 (VCCLab 2005) |
| BBP (85-68-7) | 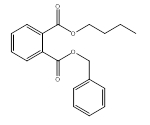 |
312.3 | 2.69 (exp)a | 4.91 (exp)a |
| DCHP (84-61-7) | 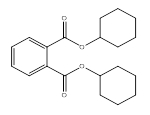 |
330.4 | 1.01 (exp)a | 4.82 (exp)a |
| DnHP (84-75-3) | 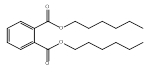 |
334 | 3.0x10⁻² (exp)b | 6.82 (exp)b |
| DBzP (523-31-9) | 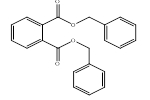 |
346.4 | 0.18 (EpiSuite 2010; WATERNT) 0.30 (EpiSuite 2010; WSKOW) 2.82 (ACD Percepta 2012) 0.72 (VCCLab 2005) | 5.08 (EpiSuite 2010) 5.09 (ACD Percepta 2012) 4.63 (VCCLab 2005) |
| B79P (68515-40-2) | 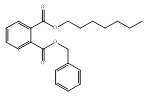 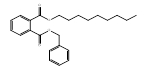 n-heptyl ester group and n-nonyl ester group |
382.5 | 0.0098 (calc)i 0.07 (WSKOWWIN 2010) 0.005 (WATERNT 2010) 0.25 (harmonized value) | 5.75 (calc)i 7.23 (KOWWIN 2010) 6.51 (harmonized value) |
| DMCHP (27987-25-3) | 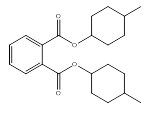 |
358.5 | 0.24 (EpiSuite 2010; WATERNT) 5.38 × 10⁻³ (EpiSuite 2010; WSKOW) 0.46 (ACD Percepta 2012) 0.31 (VCCLab 2005) | 7.04 (EpiSuite 2010) 6.46 (ACD Percepta 2012) 5.47 (VCCLab 2005) |
| DIHepP (71888-89-6) | 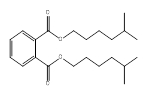 methyl hexyl ester groups (mixed isomers) (80%) 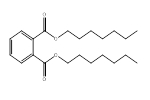 n-heptyl ester groups (20%) |
362.5 | 0.017 (exp)e | 80%: 7.41 (EpiSuite 2010) 6.42 (ACD Percepta 2012) 6.15 (VCCLab 2005) 20%: 7.56 (EpiSuite 2010) 7.92 (ACD Percepta 2012) 7.26 (VCCLab 2005) |
| 79P (111381-89-6) | methyl hexyl ester group n-heptyl ester group  n-nonyl ester group  |
362 – 418 | 1.7 x 10⁻⁵ – 2.5 x 10⁻³ (EpiSuite 2010) 0.02 – 0.40 (ACD/Percepta 2012) 2.8 x 10⁻² – 3.3 x 10⁻¹ (VCCLab 2005) | 7.41 – 9.52 (EpiSuite 2010) 6.41 – 10.23 (ACD/Percepta 2012) 6.15 – 8.46 (VCCLab 2005) |
| BIOP (27215-22-1) |  dimethyl hexyl ester groups (95%)  methyl heptyl ester groups (5%) |
368.5 | 9.8 x 10⁻³ (EpiSuite 2010; WSKOW) 0.0254 (EpiSuite 2010; WATERNT) 0.423 (VCCLab 2005) 1.50 (ACD Percepta 2012) | 6.66 (KOWWIN) 5.87 (VCCLab 2005) 5.81 (ACD Percpeta 2012) |
| DIOP (27554-26-3) |  dimethyl hexyl ester groups (mixed isomers) (75%)  methyl heptyl ester groups (mixed isomers) (25%) |
391 | 9.0 x 10⁻² (exp)b | 75%: 8.24 (EpiSuite 2010) 7.52 (ACD Percepta 2012) 6.62 (VCCLab 2005) 25%: 8.39 (EpiSuite 2010) 7.96 (ACD Percepta 2012) 7.02 (VCCLab 2005) |
| DEHP (117-81-7) |  |
390.6 | 3.0 x 10⁻³ (exp)a | 7.14 (exp)a |
| DINP (68515-48-0/ 28553-12-0) | methylethyl hexyl ester groups dimethyl heptyl ester groups  methyl octyl ester groups  isodecyl ester groups  n-nonyl ester groups  |
419 – 447 | 6.0 x 10⁻⁴ (exp)a | 8.8 – 9.7 (exp)a |
| B84P (16883-83-3) |  |
454.6 | 0.81 (exp)g | 7 (exp)a 7.00 (EpiSuite 2010) 6.52 (ACD Percepta 2012) 5.61 (VCCLab 2005) |
| 610P (68648-93-1) | n-hexyl ester groups n-octyl ester groups  n-decyl ester groups  |
334 – 446 | 3.0 x 10⁻² (exp)f | 8.17 (exp)f |
| DnOP (117-84-0) |  |
391 | 2.2 x 10⁻² (exp)a | 8.10 (exp)a |
| D911P (68515-43-5) | n-nonyl ester groups n-decyl ester groups  n-undecyl ester groups  |
418 – 475 | 1.6 x 10⁻⁷ – 1.7 x 10⁻⁵ (EpiSuite 2010) 1.9 x 10⁻³ – 2.3 x 10⁻² (ACD/Percepta 2012) 1.7 x 10⁻² – 2.8 x 10⁻² (VCCLab 2005) | 8.3 (exp)a |
| D911P-2 (111381-91-0) | n-nonyl ester groups n-decyl ester groups  n-undecyl ester groups  |
418 – 475 | 1.6 x 10⁻⁷–1.7 x 10⁻⁵ (WSKOWWIN) 1.9 x 10⁻³ – 2.3 x 10⁻² (ACD/Percepta 2012) 1.7 x 10⁻² – 2.8 x 10⁻² (VCCLab 2005) | 8.3 (exp)a |
| DIDP (26761-40-0/ 68515-49-1) | trimethyl heptyl ester groups dimethyl octyl ester groups  methyl nonyl ester groups  |
446 | 1.7 x 10⁻⁴ (exp)e | 10.06–10.36 (KOWWIN 2010) 8.31–8.62 (WSKOWWIN) 9.72–9.84 (ACD/Percepta 2012) |
| DIUP (85507-79-5) | dimethyl octyl ester groups dimethyl nonyl ester groups  dimethyl decyl ester groups  |
446 – 502 | 2.8 x 10⁻⁸– 2.9 x 10⁻⁷ (EpiSuite 2010) 8.9 x 10⁻⁴– 2.9 x 10⁻³ (ACD/Percepta 2012) 9.9 x 10⁻³– 1.2 x 10⁻² (VCCLab 2005) | 11.29 – 12.17 (EpiSuite 2010) 10.48 – 11.66 (ACD/Percepta 2012) 8.89 – 9.36 (VCCLab 2005) |
| DTDP (68515-47-9) | dimethyl nonyl ester groups dimethyl decyl ester groups  dimethyl undecyl ester groups  dimethyl dodecyl ester groups  |
474 – 502 | 2.5 x 10⁻¹⁰– 2.9 x 10⁻⁷ (WSKOWWIN 2010) 9.9 x 10⁻⁵ – 2.9 x 10⁻³ (ACD/Percepta 2012) 9.9 x 10⁻³– 1.2 x 10⁻² (VCCLab 2005) | 11.19 – 14.14 (KOWWIN 2010) 10.48 – 14.3 (ACD/Percepta 2012) 8.89 – 10.17 (VCCLab 2005) |
| DUP (3648-20-2) |  |
475 | 1.6 x 10⁻⁷ (EpiSuite 2010) 1.9 x 10⁻³ (ACD Percepta 2012) 1.7 x 10⁻² (VCCLab 2005) | 8.7 (exp)a |
Abbreviations: calc, calculated value; exp, experimental value.
Experimental data obtained from a ECHA c2007-2015; b HSDB 1983- ; c PhysProp 2006;d Haynes and Lide 2010; e Letinski et al. 2002; fACC 2006; g European Commission 2000; h Renberg et al. 1985; i ECHA c2007-2018.
| Property | Value | Reference(s) |
|---|---|---|
| Molecular weight (g/mol) | 382.5 | - |
| Boiling point (°C) | 438.47 | MPBPWIN 2008 |
| Water solubility (mg/L) | 0.250 | ACD/Percepta c1997-2012; WATERNT 2010; WSKOWWIN 2010; TEST 2016 |
| Vapour pressure (Pa) | 1.60×10⁻⁵ | ACD/Percepta c1997-2012; AEROWIN in EPI Suite c2000-2012; MPBPWIN 2008; TEST 2016 |
| Henry’s Law constant (Pa-m3/mol) | 1.76×10⁻² | HENRYWIN 2008 |
| Log Kow (unitless) | 6.51 | Abraham et al. 1994; ACD/Percepta c1997-2012; KOWWIN 2010 |
| Log Koc (unitless) | 1.21×10⁵ | ACD/Percepta c1997-2012; KOCWIN 2010 |
| Log Kaw (unitless) | -5.01 | HENRYWIN 2008 |
| Log Koa (unitless) | 11.51 | KOAWIN 2010 |
Abbreviations: -, not relevant; Kow, octanol-water partition coefficient; Koc, organic carbon-water partition coefficient; Kaw, air-water partition coefficient; Koa, octanol-air partition coefficient
Note: Models are based on fragment addition methods (i.e., they rely on the structure of the chemical) and typically accept only the neutral (i.e., non-ionized) form of a chemical as input (in SMILES form). Where more than one appropriate model was available for a given property, the mean value was taken as the key value for that parameter. The selected key values for water solubility, vapour pressure, log Kow, log Kaw and log Koa were derived using a least-squares adjustment procedure (Cole and Mackay 2000; Schenker et al. 2005) and represent internally consistent partitioning properties considering thermodynamic constraints.
Appendix B. Cumulative risk based on narcosis
| Substance (CAS RN) | Highest PECa (µg/L) | BAFb | Highest tissue residuec (mmol/kg BW) | Highest toxic unitd |
|---|---|---|---|---|
| DMP (131-11-3) | 0.3 | 66 | 1.10 x 10⁻⁴ | 0.003 |
| DEP (84-66-2) | 1.98 | 14 | 1.25 x 10⁻⁴ | 0.003 |
| DPrP (131-16-8) | 0.03 | 17 | 2.33 x 10⁻⁶ | 0.00006 |
| DIBP (84-69-5) | 0.54 | 78 | 1.51 x 10⁻⁴ | 0.004 |
| DBP (84-74-2) | 0.65 | 60 | 1.40 x 10⁻⁴ | 0.004 |
| CHIBP (5334-09-8) | NC | 103 | 0 | 0.000 |
| BCHP (84-64-0) | 0.03 | 117 | 1.01 x 10⁻⁵ | 0.0003 |
| BBP (85-68-7) | 1.95 | 631 | 3.95 x 10⁻³ | 0.099 |
| DCHP (84-61-7) | 2.0 | 92 | 5.58 x 10⁻⁴ | 0.014 |
| DnHP (84-75-3) | 0.007 | 262 | 5.58 x 10⁻⁶ | 0.0001 |
| DBzP (523-31-9) | 0.01 | 17 | 5.56 x 10⁻⁷ | 0.00001 |
| B79P (68515-40-2) | 0.41 | 44 | 4.67 x 10⁻⁵ | 0.001 |
| DMCHP (27987-25-3) | 0.01 | 2070 | 6.03 x 10⁻⁵ | 0.002 |
| DIHepP (71888-89-6) | 0.33 | 115 | 1.05 x 10⁻⁴ | 0.003 |
| 79P (111381-89-6) | 0.028 | 381 | 2.74 x 10⁻⁵ | 0.0007 |
| BIOP (27215-22-1) | 0.008 | 47 | 9.85 x 10⁻⁷ | 0.00003 |
| DIOP (27554-26-3) | 0.78 | 293 | 5.81x 10⁻⁴ | 0.015 |
| DEHP (117-81-7) | 1.41 | 41 | 1.47 x 10⁻⁴ | 0.004 |
| DINP (68515-48-0 / 28553-12-0) | 3.43 | 28 | 2.29 x 10⁻⁴ | 0.006 |
| B84P (16883-83-3) | 0.82 | 7 | 1.26 x 10⁻⁵ | 0.0003 |
| 610P (68648-93-1) | 0.057 | 372 | 5.47 x 10⁻⁵ | 0.001 |
| DnOP (117-84-0) | 0.33 | 32 | 2.68 x 10⁻⁵ | 0.0007 |
| D911P (68515-43-5) | 0.62 | 415 | 5.78 x 10⁻⁴ | 0.014 |
| D911P-2 (111381-91-0) | 0.002 | 263 | 1.12 x 10⁻⁶ | 0.00003 |
| DIDP (26761-40-0 / 68515-49-1) | 9.29 | 11 | 2.29 x 10⁻⁴ | 0.006 |
| DIUP (85507-79-5) | 0.044 | 10 | 9.18 x 10⁻⁷ | 0.00002 |
| DTDP (68515-47-9) | 0.004 | 1 | 8.20 x 10⁻⁹ | 0.0000 |
| DUP (3648-20-2) | 0.051 | 16 | 1.72 x 10⁻⁶ | 0.00004 |
| Sum of Internal Toxic Units | − | − | − | 0.2 |
Abbreviations: PEC, predicted environmental concentration; BAF, bioaccumulation factor; ITUs, internal toxic units; ITUmix, sum of internal toxic units for a mixture of substances; AF, assessment factor; NC, not calculated; −, not applicable
a PEC was calculated using a dilution factor based on 50th percentile flow, with no limit
b Experimental BAFs have been used where available. Where experimental values were not available, modelled mid-trophic level BAFs which include biotransformation were derived using BCFBAF v3.01 (BCFBAF 2010).
c The tissue residue is calculated by multiplying the PEC and BAF, and dividing by the molecular weight of the substance
d Toxic units for each substance are calculated by dividing the tissue residue by a critical body residue of 0.2 mmol/kgBW and multiplying by an assessment factor of 5.
| Substance (CAS RN) | Median PECa (µg/L) | BAFb | Median tissue residuec (mmol/kg BW) | Median toxic unitd |
|---|---|---|---|---|
| DMP (131-11-3) | 0.0043 | 66 | 1.46 x 10⁻⁶ | 0.00004 |
| DEP (84-66-2) | 0.0395 | 14 | 2.49 x 10⁻⁶ | 0.00006 |
| DPrP (131-16-8) | 0.0009 | 17 | 6.31 x 10⁻⁸ | 0.000002 |
| DIBP (84-69-5) | 0.0112 | 78 | 3.13 x 10⁻⁶ | 0.00008 |
| DBP (84-74-2) | 0.024 | 60 | 5.28 x 10⁻⁶ | 0.0001 |
| CHIBP (5334-09-8) | NC | 103 | 0 | 0.000 |
| BCHP (84-64-0) | 0.0001 | 117 | 2.42 x 10⁻⁸ | 0.0000006 |
| BBP (85-68-7) | 0.0146 | 631 | 2.95 x 10⁻⁵ | 0.0007 |
| DCHP (84-61-7) | 0.001 | 92 | 2.79 x 10⁻⁷ | 0.000007 |
| DnHP (84-75-3) | 0.0 | 262 | 1.21 x 10⁻⁸ | 0.0000003 |
| DBzP (523-31-9) | 0.0001 | 17 | 6.79 x 10⁻⁹ | 0.0000002 |
| B79P (68515-40-2) | 0.0239 | 44 | 2.72 x 10⁻⁶ | 0.00007 |
| DMCHP (27987-25-3) | 0.0 | 2070 | 2.79 x 10⁻⁷ | 0.000007 |
| DIHepP (71888-89-6) | 0.0004 | 115 | 1.37 x 10⁻⁷ | 0.000003 |
| 79P (111381-89-6) | 0.0 | 381 | 5.64 x 10⁻⁹ | 0.0000001 |
| BIOP (27215-22-1) | 0.0002 | 47 | 2.13 x 10⁻⁸ | 0.0000005 |
| DIOP (27554-26-3) | 0.0082 | 293 | 6.11 x 10⁻⁶ | 0.0002 |
| DEHP (117-81-7) | 0.0868 | 41 | 9.10 x 10⁻⁶ | 0.0002 |
| DINP (68515-48-0 / 28553-12-0) | 0.0070 | 28 | 4.69 x 10⁻⁷ | 0.00001 |
| B84P (16883-83-3) | 0.0013 | 7 | 2.02 x 10⁻⁸ | 0.0000005 |
| 610P (68648-93-1) | 0.0288 | 372 | 2.74 x 10⁻⁵ | 0.0007 |
| DnOP (117-84-0) | 0.0032 | 32 | 2.65 x 10⁻⁷ | 0.000007 |
| D911P (68515-43-5) | 0.1619 | 415 | 1.50 x 10⁻⁴ | 0.004 |
| D911P-2 (111381-91-0) | 0.0019 | 263 | 1.12 x 10⁻⁶ | 0.00003 |
| DIDP (26761-40-0 / 68515-49-1) | 0.0067 | 11 | 1.64 x 10⁻⁷ | 0.000004 |
| DIUP (85507-79-5) | 0.0002 | 10 | 3.71 x 10⁻⁹ | 0.0000001 |
| DTDP (68515-47-9) | 0.0 | 1 | 4.81 x 10⁻¹¹ | 0.000 |
| DUP (3648-20-2) | 0.0001 | 16 | 2.81 x 10⁻⁹ | 0.00000007 |
| Sum of Internal Toxic Units | − | − | − | 0.006 |
Abbreviations: PEC, predicted environmental concentration; BAF, bioaccumulation factor; ITUs, internal toxic units; ITUmix, sum of internal toxic units for a mixture of substances; AF, assessment factor; NC, not calculated; −, not applicable
a PEC was calculated using a dilution factor based on 50th percentile flow, with no limit
b Experimental BAFs have been used where available. Where experimental values were not available, modelled mid-trophic level BAFs which include biotransformation were derived using BCFBAF v3.01 (BCFBAF 2010).
c The tissue residue is calculated by multiplying the PEC and BAF, and dividing by the molecular weight of the substance
d Toxic units for each substance are calculated by dividing the tissue residue by a critical body residue of 0.2 mmol/kgBW and multiplying by an assessment factor of 5.
Appendix B2. Analysis of cumulative risk based on narcosis

Figure B-1. Phthalate contributions to total toxic units based on narcosis
This figure is a line graph showing the relative contribution of the various phthalates to the total toxic units. Each of the 28 phthalates is listed along the x‑axis, in decreasing order of their internal toxic units. The y-axis shows the internal toxic units and ranges from zero to 0.2 toxic units. The substance BBP is listed first as it accounts for the largest toxic unit, at 0.099. The next substance is DIOP, which accounts for 0.015 toxic units. Moving to the right, each phthalate accounts for successively smaller toxic units such that the curve appears to plateau at about 0.18 for the last half of the substances.
Eleven phthalates account for approximately 95% of cumulative risk based on narcosis. Total Internal Toxic Units were calculated as 0.18, or about 0.2.
Appendix C. Derivation of daily intakes for BBP, DBP and DEHP based on biomonitoring
MIREC, P4 and MIREC-CD Plus:
Estimating daily intake concentration using 1 metabolite concentration (BBP)
Equation 1:
Where = Sum of molar concentrations of metabolites,
CER: 24 hour creatinine excretion rate (estimated using the Mage Equation),
FUSSUM: Sum of fractional urinary excretion values of the metabolites = 0.73,
MW of BBP = 312
Step 1: Conversion of concentrations
Step 2: Identify relevant FUE
FUE for MBzP is 0.73
Step 3: Compute DI for BBP using Equation 1.
Estimating daily intake concentration using multiple metabolite concentrations (DBP and DEHP)
Equation 1:
Where = Sum of molar concentrations of metabolites,
CER : 24 hour creatinine excretion rate (estimated using the Mage Equation),
FUESUM : Sum of FUE of the metabolites = 0.91 (DBP), 0.71 (DEHP),
MW of phthalate = 278 (DBP), 391 (DEHP)
Step 1: Converting the urinary metabolite concentration from µg/g Cr to moles/g Cr
I. For DBP metabolites: MnBP and MHBPFootnote 19
C
Step 2: Sum the metabolite concentration (moles/g Cr) from Step 1Footnote 20
II. For DEHP metabolites: MEHP, MEOHP, MEHHP, MCMHP, MECPP
Step 2: Sum the metabolite concentration (moles/g Cr) from Step 1
I. For DBP metabolites in step 1
II. For DEHP metabolites in step 1
Step 3: Calculate the sum of FUEs.
I. DBP: FUEs for MnBP and MHBP are 0.84 and 0.069, respectively. Therefore, the sum would be 0.91 (P4 and MIREC-CD Plus) and the FUE for only MnBP is 0.84 (MIREC).
II. DEHP: FUEs are MEHP (0.073), MEOHP (0.15), MEHHP (294), MCMHP (0.038) and MECPP (0.21). Therefore, the sum of all 5 metabolites would be 0.71 (P4 and MIREC-CD Plus) and the sum of the first 3 would be 0.46 (MIREC).
Step 4: Compute the daily intake using Equation 1.
CHMS
Statistical analysis: The data were analyzed with SAS 9.2 (SAS Institute Inc., USA) and SUDAAN 10.0.1 software (RTI International, USA). Variance estimates were produced using bootstrap weights, taking into account the 11 degrees of freedom for cycle 1 and 13 degrees of freedom for cycle 2 as suggested in CHMS data user guide (Statistics Canada 2011, 2012). All analyses were weighted using the CHMS cycle 1 survey weights (phthalates sub-sample) and CHMS cycle 2 survey weights (environmental urine subsample) in order to be representative of the Canadian population. Phthalate concentrations that were below LOD were assigned a value of LOD/2.
Estimation of creatinine excretion rate (CER): For each study, participant creatinine excretion rate was calculated using the Mage equations (from (15)). The adiposity adjustment (discussed in the supplemental information (15)) was applied for all participants, and the body surface area adjustment was applied for children under the age of 18. Median BMIs by age for the adiposity adjustment were computed using the entire CHMS sample. The CHMS phthalate subsample dataset had 174 children who exceeded the height limits in the Mage equations (186 cm for males and 172 cm for females). The Mage equations were applied directly to the observed heights in order to extrapolate creatinine excretion rates for these participants. The predicted excretion rates for these individuals appeared to be reasonable despite the extrapolation.
Estimation of urinary excretion rate: For each selected phthalate, the urinary excretion rate was calculated using CER as follows
Equation 1
UER is the body-weight adjusted urinary excretion rate. The UCCr is the creatinine-adjusted urinary phthalate concentration, and BW refers to the body-weight. The UER for individual participants were computed and used in the regression model (see below) to derive least square geometric mean (LSGM) estimates of UER for the Canadian population.
Daily intake estimation: The daily intake of each phthalate was estimated for each participant using the following equations (David et al. 2000; Koch et al. 2007):
Equation 2
The fractional urinary excretion (FUE) is defined as the fraction of the diester exposure dose excreted as monoesters in urine, calculated on mole-basis. For the daily intake estimations, previous works used FUE values of 0.73, 0.44, and 0.69 for BBP, DEHP, and DBP respectively (19, 21, 25; Koch et al. 2012). MWD and MWM are the molecular weights of the diester (312.36, 390.56, and 278.34 g/mole for BBP, DEHP, and DBP respectively) and the monoester (256.22, 865.02, and 222.24 g/mole for BBP, MEHP+MEHHP+MEOHP, and MBP) respectively.
For each selected phthalate diester, the daily intake for each study participants was computed using equation 2. Arithmetic and geometric means and selected percentiles along with their 95% confidence intervals of daily intake were produced for the Canadian population by age groups, sex and fasting status. Descriptive statistics were computed using SUDAAN proc DESCRIPT and SAS proc SURVEYREG.
Appendix D. Intakes of BBP, DBP, DEHP, DnHP, DIOP and DINP from environmental media and food for the general population
| Route of exposure | 0–0.5 yeara Breast-fedb | 0–0.5 yeara Formula-fedc | 0–0.5 yeara Not formula-fed | 0.5–4 yearsd | 5–11 yearse | 12–19 yearsf | 20–59 yearsg | 60+ yearsh |
|---|---|---|---|---|---|---|---|---|
| Ambient airi | < 0.001 | < 0.001 | < 0.001 | < 0.001 | < 0.001 | < 0.001 | < 0.001 | < 0.001 |
| Indoor airj | < 0.001 (0.016) | < 0.001 (0.016) | < 0.001 (0.016) | 0.001 (0.035) | 0.001 (0.027) | < 0.001 (0.015) | < 0.001 (0.013) | < 0.001 (0.011) |
| Drinking waterk | N/A | 0.0045 | 0.0017 | 0.0019 | 0.0015 | < 0.001 | < 0.001 | < 0.001 |
| Food and beveragesl | < 0.001 (0.016) | < 0.001 | NA | 0.43 (1.16) | 0.25 (0.61) | 0.15 (0.45) | 0.069 (0.22) | 0.049 (0.17) |
| Soilm | < 0.001 | < 0.001 | < 0.001 | < 0.001 | < 0.001 | < 0.001 | < 0.001 | < 0.001 |
| Dustn | 0.21 (2.59) | 0.21 (2.59) | 0.21 (2.59) | 0.15 (1.82) | 0.071 (0.86) | 0.0026 (0.031) | 0.0025 (0.029) | 0.0024 (0.028) |
| Total oral intake | 0.21 (2.62) | 0.21 (2.61) | 0.21 (2.61) | 0.58 (3.01) | 0.33 (1.49) | 0.15 (0.50) | 0.072 (0.26) | 0.051 (0.21) |
Abbreviations: [NA, Not Available; N/A, Not Applicable]
a Assumed to weigh 7.5 kg, to breathe 2.1 m3 of air per day, to drink 0.2 L/day (not formula-fed) and to ingest 30 mg of soil per day. Consumption of food groups reported in Health Canada (1998). Median and 95th percentile dietary intake estimates (food) for the < 6 months age group, as presented in Table D-1b, were used to represent dietary intake for this age group (applicable to formula- and non-formula-fed group).
b Infants 0-6 months assumed to ingest 0.742 litre breast milk/day (USEPA 2011). MBzP the monoester metabolite of BBP was measured in breast milk in Canada as part of the Plastics and Personal Care Product Use in Pregnancy survey (P4, n = 31 women, 56 breast milk samples; personal communication from Environmental Health Science and Radiation Directorate [EHSRD] to ESRAB, October 2013; unreferenced). It was detected in 34% of samples, with half the limit of detection (LOD) (LOD=0.018 µg/L) and maximum (0.16 µg/L) used for exposure characterization.
c Probabilistic intakes (median and 90th) were incorporated into the dietary intake table. Formula concentrations obtained from P4 study – BBP was not detected in any infant formula samples: one half the limit of detection (LOD=0.018 µg/L) was used for exposure characterization.
d Assumed to weigh 15.5 kg, to breathe 9.3 m3 of air per day, to drink 0.7 L of water per day and to ingest 100 mg of soil per day. Consumption of food groups reported in Health Canada (1998). Median and 95th percentile dietary intake estimates (food) for the 1–3-year age group, as presented in Table D-1b, were used to represent dietary intake for this age group.
e Assumed to weigh 31.0 kg, to breathe 14.5 m3 of air per day, to drink 1.1 L of water per day and to ingest 65 mg of soil per day. Consumption of food groups reported in Health Canada (1998). Median and 95th percentile dietary intake estimates (food) for the 4–8-year age group, as presented in Table D-1b, were used to represent dietary intake for this age group.
f Assumed to weigh 59.4 kg, to breathe 15.8 m3 of air per day, to drink 1.2 L of water per day and to ingest 30 mg of soil per day. Consumption of food groups reported in Health Canada (1998). Highest median and 95th percentile dietary intake estimates (food) for the 9–13-year age group, as presented in Table D-1b, were used to represent dietary intake for this age group.
g Assumed to weigh 70.9 kg, to breathe 16.2 m3 of air per day, to drink 1.5 L of water per day and to ingest 30 mg of soil per day. Consumption of food groups reported in Health Canada (1998). Highest median and 95th percentile dietary intake estimates (food) for the 19–30-year age group, as presented in Table D-1b, were used to represent dietary intake for this age group.
h Assumed to weigh 72.0 kg, to breathe 14.3 m3 of air per day, to drink 1.6 L of water per day and to ingest 30 mg of soil per day. Consumption of food groups reported in Health Canada (1998). Highest median and 95th percentile dietary intake estimates (food) for the 71-year-old and over age group, as presented in Table D-1b, were used to represent dietary intake for this age group.
i No Canadian data measuring BBP in ambient air were identified. Rudel et al. 2010 measured BBP in outdoor samples (40 homes) in N. California. Concentrations used in exposure characterization –half the method reporting limit (MRL=0.006 µg/m3), maximum: 0.0085 µg/m3.
j Health Canada (2017) measured BBP in 51 homes inToronto and Ottawa, ON, Canada. Median (0.00284 µg/m3) and maximum (0.0659 µg/m3) concentrations were used in exposure characterization.
k No data were identified regarding BBP concentrations in drinking water. BBP was not detected in any samples in a Canadian bottled water survey (Cao 2008). Half the method detection limit (MDL=0.085 µg/L) was used for semi-quantitative exposure characterization.
l Probabilistic intakes (median and 95th) were incorporated into the dietary intake table. Intakes and methodology are outlined in Appendix E (see Table D-1b). Note gender and age groups do not fully match; therefore, the highest intake from within an age group was input into the table: e.g., male intakes (51–70 years) were input into the 60+ (unisex) column because this age group had the highest intake of all the groups in the 51–71-year range. NA, notates significant variation; therefore, estimates not presented.
m The reported concentration of BBP in control agricultural soils (0.13 ng/g; Khosravi and Price 2015) was used to estimate potential exposures to BBP via soil.
n The ingestion of indoor dust is considered a significant source of indoor exposure to phthalates, including BBP, and the amount of indoor dust ingested each day is based on Wilson et al. (2013). The median (42.3 µg/g) and 95th percentile (512 µg/g) of BBP in indoor dust from the CHDS, was used for exposure characterization (Kubwabo et al. 2013).
| DRI group | Median | 95th percentile |
|---|---|---|
| < 6 months | NA | NA |
| 0.5–1 year | NA | 1.27 |
| 1–3 years | 0.43 | 1.16 |
| 4–8 years | 0.25 | 0.61 |
| M: 9–13 years | 0.15 | 0.45 |
| F: 9–13 years | 0.12 | 0.35 |
| M: 14–18 years | 0.11 | 0.32 |
| F: 14–18 years | 0.0798 | 0.27 |
| M: 19–30 years | 0.0692 | 0.22 |
| F: 19–30 years | 0.0646 | 0.22 |
| M: 31–50 years | 0.0509 | 0.17 |
| F: 31–50 years | 0.052 | 0.18 |
| M: 51–70 years | 0.0452 | 0.15 |
| F: 51–70 years | 0.0448 | 0.15 |
| M: > 71 years | 0.047 | NA |
| F: > 71 years | 0.049 | 0.17 |
NA; not available because of high cumulative variation
| Route of exposure | 0–0.5 yeara Breastfedb | 0–0.5 yeara Formula-fedc | 0–0.5 yeara Not formula-fed | 0.5–4 yearsd | 5–11 yearse | 12–19 yearsf | 20–59 yearsg | 60+ yearsh |
|---|---|---|---|---|---|---|---|---|
| Ambient airi | < 0.001 (0.0012) | < 0.001 (0.0012) | < 0.001 (0.0012) | < 0.001 (0.0024) | < 0.001 (0.0019) | < 0.001 (0.0011) | < 0.001 | < 0.001 |
| Indoor airj | 0.049 (0.27) | 0.049 (0.27) | 0.049 (0.27) | 0.11 (0.58) | 0.082 (0.45) | 0.046 (0.26) | 0.040 (0.22) | 0.035 (0.19) |
| Drinking waterk | N/A | 0.038 (0.18) | 0.014 (0.069) | 0.016 (0.078) | 0.013 (0.061) | 0.0072 (0.035) | 0.0075 (0.036) | 0.0079 (0.038) |
| Food and beveragesl | 0.065 (0.51) | NA | NA | 0.69 (1.96) | 0.47 (1.16) | 0.30 (0.93) | 0.14 (0.44) | 0.12 (0.38) |
| Soilm | < 0.001 | < 0.001 | < 0.001 | < 0.001 | < 0.001 | < 0.001 | < 0.001 | < 0.001 |
| Dustn | 0.085 (0.48) | 0.085 (0.48) | 0.085 (0.48) | 0.060 (0.34) | 0.028 (0.16) | 0.001 (0.006) | <0.001 (0.005) | <0.001 (0.005) |
| Total oral intake | 0.199 (1.53) | 0.18 (0.95) | 0.15 (0.82) | 0.88 (2.96) | 0.59 (1.83) | 0.35 (1.23) | 0.19 (0.70) | 0.16 (0.61) |
Abbreviations: [NA, Not Available; N/A, Not Applicable]
a Assumed to weigh 7.5 kg, to breathe 2.1 m3 of air per day, to drink 0.2 L/day (not formula-fed) and to ingest 30 mg of soil per day. Consumption of food groups reported in Health Canada (1998). Median and 95th percentile dietary intake estimates (food) for the < 6 months age group, as presented in Table D-2b, were used to represent dietary intake for this age group (applicable to formula- and non-formula-fed group).
b Infants 0-6 months assumed to ingest 0.742 litre breast milk/day (USEPA 2011). MBzP the monoester metabolite of DBP was measured in breast milk in Canada as part of the Plastics and Personal Care Product Use in Pregnancy survey (P4, n = 31 women, 56 breast milk samples; personal communication from Environmental Health Science and Radiation Directorate [EHSRD] to ESRAB, October 2013). It was detected in 100% of breast milk samples, with median (0.656 µg/L) and maximum (5.18 µg/L) values used for exposure characterization.
c Probabilistic intakes (median and 90th) were incorporated into the dietary intake table. Intakes and methodology are outlined in Appendix E (see Table D-2b). NA, notates significant variation; therefore, estimates not presented.
d Assumed to weigh 15.5 kg, to breathe 9.3 m3 of air per day, to drink 0.7 L of water per day and to ingest 100 mg of soil per day. Consumption of food groups reported in Health Canada (1998). Median and 95th percentile dietary intake estimates (food) for the 1–3-year age group, as presented in Table D-2b, were used to represent dietary intake for this age group.
e Assumed to weigh 31.0 kg, to breathe 14.5 m3 of air per day, to drink 1.1 L of water per day and to ingest 65 mg of soil per day. Consumption of food groups reported in Health Canada (1998). Median and 95th percentile dietary intake estimates (food) for the 4–8-year age group, as presented in Table D-2b, were used to represent dietary intake for this age group.
f Assumed to weigh 59.4 kg, to breathe 15.8 m3 of air per day, to drink 1.2 L of water per day and to ingest 30 mg of soil per day. Consumption of food groups reported in Health Canada (1998). Highest median and 90th percentile dietary intake estimates (food) for the 9–13-year age group, as presented in Table D-2b, were used to represent dietary intake for this age group.
g Assumed to weigh 70.9 kg, to breathe 16.2 m3 of air per day, to drink 1.5 L of water per day and to ingest 30 mg of soil per day. Consumption of food groups reported in Health Canada (1998). Highest median and 95th percentile dietary intake estimates (food) for the 19–30-year age group, as presented in Table D-2b, were used to represent dietary intake for this age group.
h Assumed to weigh 72.0 kg, to breathe 14.3 m3 of air per day, to drink 1.6 L of water per day and to ingest 30 mg of soil per day. Consumption of food groups reported in Health Canada (1998). Highest median and 95th percentile dietary intake estimates (food) for the 71-year-old and over age group, as presented in Table D-2b, were used to represent dietary intake for this age group.
i No Canadian data measuring DBP in ambient air were identified. Rudel et al. 2010 measured DBP in outdoor samples (40 homes) in N. California. Concentrations used in exposure characterization –half the method reporting limit (MRL=0.007 µg/m3), maximum: 0.032 µg/m3.
j Zhu et al. 2007 measured DBP in indoor air from samples collected in homes in Canada. Median (0.2 µg/m3) and maximum (1.1 µg/m3) concentrations were used in exposure characterization (Zhu et al. 2007).
k No data were identified regarding DBP concentrations in drinking water. In the absence of data on levels of DBP in tap water, mean (0.357 µg/L) and maximum (1.72 µg/L) concentrations of DBP in bottled non‑carbonated water were used for semi-quantitative exposure characterization (Cao et al. 2008).
l Probabilistic intakes (median and 95th) were incorporated into the dietary intake table. Intakes and methodology are outlined in Appendix E (see Table D-2b). Note gender and age groups do not fully match; therefore, the highest intake from within an age group was input into the table: e.g., male intakes (51–70 years) were input into the 60+ (unisex) column because this age group had the highest intake of all the groups in the 51–71-year range. NA, notates significant variation; therefore, estimates not presented.
m The reported concentration of DBP in control agricultural soils (0.14 ng/g; Khosravi and Price 2015) was used to estimate potential exposures to DBP via soil.
n The ingestion of indoor dust is considered a significant source of indoor exposure to phthalates, including DBP, and the amount of indoor dust ingested each day is based on Wilson et al. (2013). The median (16.8 µg/g) and 95th percentile (95.4 µg/g) of DBP in indoor dust from the CHDS, was used for exposure characterization (Kubwabo et al. 2013).
| DRI group | Median | 95th percentile |
|---|---|---|
| < 6 months | NA | NA |
| 0.5–1 year | NA | NA |
| 1–3 years | 0.69 | 1.96 |
| 4–8 years | 0.47 | 1.16 |
| M: 9–13 years | 0.30 | 0.93 |
| F: 9–13 years | 0.26 | 0.71 |
| M: 14–18 years | 0.21 | 0.65 |
| F: 14–18 years | 0.18 | 0.53 |
| M: 19–30 years | 0.14 | 0.44 |
| F: 19–30 years | 0.14 | 0.42 |
| M: 31–50 years | 0.13 | 0.37 |
| F: 31–50 years | 0.13 | 0.39 |
| M: 51–70 years | 0.12 | 0.35 |
| F: 51–70 years | 0.12 | 0.36 |
| M: > 71 years | 0.12 | 0.36 |
| F: > 71 years | 0.12 | 0.38 |
NA; not available because of high cumulative variation
| Route of exposure | 0–0.5 yeara Breastfedb | 0–0.5 yeara Formula-fedc | 0–0.5 yeara Not formula-fed | 0.5–4 yearsd | 5–11 yearse | 12–19 yearsf | 20–59 yearsg | 60+ yearsh |
|---|---|---|---|---|---|---|---|---|
| Ambient airi | < 0.001 | < 0.001 | < 0.001 | 0.0015 (0.0017) | 0.0012 (0.0013) | < 0.001 | < 0.001 | < 0.001 |
| Indoor airj | 0.022 (0.52) | 0.022 (0.52) | 0.022 (0.52) | 0.046 (1.10) | 0.036 (0.86) | 0.021 (0.49) | 0.018 (0.42) | 0.015 (0.37) |
| Drinking waterk | N/A | 0.011 (0.036) | 0.0041 (0.014) | 0.0046 (0.015) | 0.0036 (0.012) | 0.0021 (0.0068) | 0.0022 (0.0072) | 0.0023 (0.0075) |
| Food and beveragesl | 0.13 (1.69) | NA | 5.59 (17.24) | 8.76 (19.78) | 5.55 (13.58) | 3.45 (9.49) | 2.19 (6.14) | 2.19 (6.14) |
| Soilm | < 0.001 | < 0.001 | < 0.001 | < 0.001 | < 0.001 | < 0.001 | < 0.001 | < 0.001 |
| Dustn | 2.34 (9.53) | 2.34 (9.53) | 2.34 (9.53) | 1.64 (6.67) | 0.77 (3.15) | 0.028 (0.11) | 0.027 (0.11) | 0.026 (0.10) |
| Total oral intake | 2.49 (11.74) | 2.39 (10.31) | 7.96 (27.30) | 10.45 (27.57) | 6.36 (17.60) | 3.5 (10.10) | 2.24 (6.68) | 2.23 (6.62) |
Abbreviations: [NA, Not Available; N/A, Not Applicable]
a Assumed to weigh 7.5 kg, to breathe 2.1 m3 of air per day, to drink 0.2 L/day (not formula-fed) and to ingest 30 mg of soil per day. Consumption of food groups reported in Health Canada (1998). Median and 95th percentile dietary intake estimates (food) for the 0.5–1-year age group, as presented in Table D-3b, were used to represent dietary intake for this age group (applicable to formula- and non-formula-fed group).
b Infants 0-6 months assumed to ingest 0.742 litre breast milk/day (USEPA 2011). MEHP the monoester metabolite of DEHP was measured in breast milk in Canada as part of the Plastics and Personal Care Product Use in Pregnancy survey (P4, n = 31 women, 56 breast milk samples; personal communication from Environmental Health Science and Radiation Directorate [EHSRD] to ESRAB, October 2013). It was detected in 100% of samples, with median (1.26 µg/L) and maximum (17.05 µg/L) used for exposure characterization.
c Probabilistic intakes (median and 90th) were incorporated into the dietary intake table. Intakes and methodology are outlined in Appendix E (see Table D-3b). NA, notates significant variation; therefore, estimates not presented.
d Assumed to weigh 15.5 kg, to breathe 9.3 m3 of air per day, to drink 0.7 L of water per day and to ingest 100 mg of soil per day. Consumption of food groups reported in Health Canada (1998). Median and 95th percentile dietary intake estimates (food) for the 1–3-year age group, as presented in Table D-3b, were used to represent dietary intake for this age group.
e Assumed to weigh 31.0 kg, to breathe 14.5 m3 of air per day, to drink 1.1 L of water per day and to ingest 65 mg of soil per day. Consumption of food groups reported in Health Canada (1998). Median and 95th percentile dietary intake estimates (food) for the 4–8-year age group, as presented in Table D-3b, were used to represent dietary intake for this age group.
f Assumed to weigh 59.4 kg, to breathe 15.8 m3 of air per day, to drink 1.2 L of water per day and to ingest 30 mg of soil per day. Consumption of food groups reported in Health Canada (1998). Highest median and 95th percentile dietary intake estimates (food) for the 9–13-year age group, as presented in Table D-3b, were used to represent dietary intake for this age group.
g Assumed to weigh 70.9 kg, to breathe 16.2 m3 of air per day, to drink 1.5 L of water per day and to ingest 30 mg of soil per day. Consumption of food groups reported in Health Canada (1998). Highest median and 95th percentile dietary intake estimates (food) for the 51–70-year age group, as presented in Table D-3b, were used to represent dietary intake for this age group.
h Assumed to weigh 72.0 kg, to breathe 14.3 m3 of air per day, to drink 1.6 L of water per day and to ingest 30 mg of soil per day. Consumption of food groups reported in Health Canada (1998). Highest median and 95th percentile dietary intake estimates (food) for the 51–70-year age group, as presented in Table D-3b, were used to represent dietary intake for this age group.
i No Canadian data measuring DEHP in ambient air were identified. Rudel et al. 2010 measured DEHP in outdoor samples (40 homes) in N. California. Concentrations used in exposure characterization –half the method reporting limit (MRL=0.040 µg/m3), maximum: 0.023 µg/m3.
j Zhu et al. 2007 measured DEHP in indoor air from samples collected in homes in Canada. Median (0.088 µg/m3) and maximum (2.1 µg/m3) concentrations were used in exposure characterization (Zhu et al. 2007).
k No data were identified regarding DEHP concentrations in drinking water. In the absence of data on levels of DEHP in tap water, mean (0.102µg/L) and maximum (0.338 µg/L) concentrations of DEHP in bottled non‑carbonated water were were used for semi-quantitative exposure characterization (Cao et al. 2008).
l Probabilistic intakes (median and 95th) were incorporated into the dietary intake table. Intakes and methodology are outlined in Appendix E (see Table D-3b). Note gender and age groups do not fully match; therefore, the highest intake from within an age group was input into the table: e.g., male intakes (51–70 years) were input into the 60+ (unisex) column because this age group had the highest intake of all the groups in the 51–71-year range. NA, notates significant variation; therefore, estimates not presented.
m The reported concentration of DEHP in control agricultural soils (0.06 ng/g; Khosravi and Price 2015) was used to estimate potential exposures to DEHP via soil.
n The ingestion of indoor dust is considered a significant source of indoor exposure to phthalates, including DEHP, and the amount of indoor dust ingested each day is based on Wilson et al. (2013). The median (462 µg/g) and 95th percentile (1880 µg/g) of DEHP in indoor dust, was used for exposure characterization (Kubwabo et al. 2013).
| DRI group | Median | 95th percentile |
|---|---|---|
| < 6 months | NA | NA |
| 0.5–1 year | 5.59 | 17.24 |
| 1–3 years | 8.76 | 19.78 |
| 4–8 years | 5.55 | 13.58 |
| M: 9–13 years | 3.45 | 9.49 |
| F: 9–13 years | 3.23 | 9.19 |
| M: 14–18 years | 2.30 | 6.54 |
| F: 14–18 years | 2.12 | 6.20 |
| M: 19–30 years | 1.88 | 5.97 |
| F: 19–30 years | 2.12 | 6.06 |
| M: 31–50 years | 1.96 | 5.64 |
| F: 31–50 years | 2.18 | 6.03 |
| M: 51–70 years | 2.04 | 5.48 |
| F: 51–70 years | 2.19 | 6.14 |
| M: > 71 years | 2.02 | 5.30 |
| F: > 71 years | 2.17 | 5.05 |
NA; not available because of high cumulative variation
| Route of exposure | 0–0.5 yeara Breastfedb | 0–0.5 yeara Formula-fedc | 0–0.5 yeara Not formula-fed | 0.5–4 yearsd | 5–11 yearse | 12–19 yearsf | 20–59 yearsg | 60+ yearsh |
|---|---|---|---|---|---|---|---|---|
| Food and beveragesi | NA | NA | NA | 0.0015 (0.037) | 0.0016 (0.036) | 0.001 (0.027) | < 0.001 (0.015) | < 0.001 (0.012) |
| Dustj | 0.019 (0.31) | 0.019 (0.31) | 0.019 (0.31) | 0.013 (0.22) | 0.0064 (0.10) | < 0.001 (0.0038) | < 0.001 (0.0036) | < 0.001 (0.0034) |
| Total oral intake | 0.019 (0.31) | 0.019 (0.31) | 0.019 (0.31) | 0.015 (0.26) | 0.008 (0.136) | 0.001 (0.031) | < 0.001 (0.019) | < 0.001 (0.015) |
a Assumed to weigh 7.5 kg, to breathe 2.1 m3 of air per day, to drink 0.2 L/day (not formula-fed) and to ingest 30 mg of soil per day. Consumption of food groups reported in Health Canada (1998). Median and 90th percentile dietary intake estimates (food) for the < 6 months age group, as presented in Table D-4b, were used to represent dietary intake for this age group (applicable to formula- and non-formula-fed group).
b No data on the levels of DnHP in breast milk were identified in Canada or elsewhere.
c No data on the levels of DnHP in infant formula were identified in Canada or elsewhere. Probabilistic intakes (median and 90th) were incorporated into the dietary intake table. However, the daily intakes for the <1 year age groups were unreliable and were not reported.
d Assumed to weigh 15.5 kg, to breathe 9.3 m3 of air per day, to drink 0.7 L of water per day and to ingest 100 mg of soil per day. Consumption of food groups reported in Health Canada (1998). Median and 90th percentile dietary intake estimates (food) for the 1–3-year age group, as presented in Table D-4b, were used to represent dietary intake for this age group.
e Assumed to weigh 31.0 kg, to breathe 14.5 m3 of air per day, to drink 1.1 L of water per day and to ingest 65 mg of soil per day. Consumption of food groups reported in Health Canada (1998). Median and 90th percentile dietary intake estimates (food) for the 4–8-year age group, as presented in Table D-4b, were used to represent dietary intake for this age group.
f Assumed to weigh 59.4 kg, to breathe 15.8 m3 of air per day, to drink 1.2 L of water per day and to ingest 30 mg of soil per day. Consumption of food groups reported in Health Canada (1998). Highest median and 90th percentile dietary intake estimates (food) for the 9–13-year age group, as presented in Table D-4b, were used to represent dietary intake for this age group.
g Assumed to weigh 70.9 kg, to breathe 16.2 m3 of air per day, to drink 1.5 L of water per day and to ingest 30 mg of soil per day. Consumption of food groups reported in Health Canada (1998). Highest median and 90th percentile dietary intake estimates (food) for the 19–30-year age group, as presented in Table D-4b, were used to represent dietary intake for this age group.
h Assumed to weigh 72.0 kg, to breathe 14.3 m3 of air per day, to drink 1.6 L of water per day and to ingest 30 mg of soil per day. Consumption of food groups reported in Health Canada (1998). Highest median and 90th percentile dietary intake estimates (food) for the 51–70-year age group, as presented in Table D-4b, were used to represent dietary intake for this age group.
i Probabilistic intakes (median and 90th) were incorporated into the dietary intake table. Intakes and methodology are outlined in Appendix E (see Table D-4b). Note gender and age groups do not fully match; therefore, the highest intake from within an age group was input into the table: e.g., male intakes (51–70 years) were input into the 60+ (unisex) column because this age group had the highest intake of all the groups in the 51–71-year range. NA, notates significant variation; therefore, estimates not presented.
j The ingestion of indoor dust is considered a significant source of indoor exposure to phthalates, including DnHP, and the amount of indoor dust ingested each day is based on Wilson et al. (2013). The median (3.8 µg/g) and 95th percentile (62 µg/g) of DnHP in indoor dust from the CHDS, was used for exposure characterization (Kubwabo et al. 2013).
| DRI group | Median | 90th percentile |
|---|---|---|
| < 6 months | NA | NA |
| 0.5–1 year | NA | NA |
| 1–3 years | 0.0015 | 0.037 |
| 4–8 years | 0.0016 | 0.036 |
| M: 9–13 years | 0.001 | 0.027 |
| F: 9–13 years | 0.0009 | 0.023 |
| M: 14–18 years | 0.0008 | 0.020 |
| F: 14–18 years | 0.0005 | 0.013 |
| M: 19–30 years | 0.0007 | 0.015 |
| F: 19–30 years | 0.0004 | 0.010 |
| M: 31–50 years | 0.0006 | 0.012 |
| F: 31–50 years | 0.0004 | 0.0095 |
| M: 51–70 years | 0.0005 | 0.012 |
| F: 51–70 years | 0.0004 | 0.009 |
| M: > 71 years | 0.0005 | 0.011 |
| F: > 71 years | 0.0005 | 0.009 |
NA; not available because of high cumulative variation
| Route of exposure | 0–0.5 yeara | 0.5–4 yearsb | 5–11 yearsc | 12–19 yearsd | 20–59 yearse | 60+ yearsf |
|---|---|---|---|---|---|---|
| Dustg | 0.033 (0.14) | 0.023 (0.099) | 0.011 (0.047) | <0.001 (0.0017) | <0.001 (0.0016) | <0.001 (0.0015) |
a Assumed to weigh 7.5 kg, to breathe 2.1 m3 of air per day, to drink 0.2 L/day (not formula-fed) and to ingest 30 mg of soil per day.
b Assumed to weigh 15.5 kg, to breathe 9.3 m3 of air per day, to drink 0.7 L of water per day and to ingest 100 mg of soil per day.
c Assumed to weigh 31.0 kg, to breathe 14.5 m3 of air per day, to drink 1.1 L of water per day and to ingest 65 mg of soil per day.
d Assumed to weigh 59.4 kg, to breathe 15.8 m3 of air per day, to drink 1.2 L of water per day and to ingest 30 mg of soil per day.
e Assumed to weigh 70.9 kg, to breathe 16.2 m3 of air per day, to drink 1.5 L of water per day and to ingest 30 mg of soil per day.
f Assumed to weigh 72.0 kg, to breathe 14.3 m3 of air per day, to drink 1.6 L of water per day and to ingest 30 mg of soil per day.
g The ingestion of indoor dust is considered a significant source of indoor exposure to phthalates, including DIOP, and the amount of indoor dust ingested each day is based on Wilson et al. (2013). The median (6.6 µg/g) and 95th percentile (28.6 µg/g) of DIOP in indoor dust, was used for exposure characterization (personal communication from EHSRD, Health Canada, to ESRAB, Health Canada, August 2014).
| Route of exposure | 0 – 0.5 yeara; Breast milk fedb | 0 – 0.5 yeara;Formula fedc | 0 – 0.5 yeara;Not formula fed | 0.5 – 4 yearsd | 5 – 11 yearse | 12 – 19 yearsf | 20 – 59 yearsg | 60+ yearsh |
|---|---|---|---|---|---|---|---|---|
| Indoor airi | 0.003 (0.49) | 0.003 (0.49) | 0.003 (0.49) | 0.006 (1.05) | 0.005 (0.82) | 0.003 (0.46) | 0.002 (0.40) | 0.002 (0.35) |
| Food and beveragesj | N/A | N/A (9.2) | N/A (9.2) | 1.4 (17.8) | 1.3 (14.0) | 1.0 (11.4) | 0.69 (6.9) | 0.52 (8.6) |
| Dustk | 0.57 – (2.7) | 0.57 – (2.7) | 0.57 – (2.7) | 0.40 (1.9) | 0.19 (0.88) | 0.0068 (0.032) | 0.0065 (0.030) | 0.0062 (0.029) |
| Total Oral intake | 0.57 (3.2) | 0.57 (12.4) | 0.57 (12.4) | 1.8 (20.8) | 1.5 (15.7) | 1.0 (11.9) | 0.70 (7.3) | 0.53 (9.0) |
a Assumed to weigh 7.5 kg, to breathe 2.1 m3 of air per day, to drink 0.2 L/day (not formula fed) and to ingest 30 mg of soil per day. Consumption of food groups reported in Health Canada (1998). Median and 90th dietary intake estimates (food) for the < 6 months age group, as presented in Table 9-2, were used to represent dietary intake for this age group (applicable to the non-formula fed group). F notates that coefficients of variation associated with intake estimates were not sufficiently low to allow for reporting the intake value.
b Infants 0 – 6 months assumed to ingest 0.742 litre breast milk/day (USEPA, 2011). No data were identified on the levels of DINP in breast milk. The P4 study, also reported non detection of the monoester MINP.
c Formula-fed infants are assumed to have an intake rate of 0.75 kg of formula per day. DINP is present in 5 of 32 infant formula samples (range ND – 0.590 ppm, Personal communication FD, HC to ESRAB, HC, April 2014)
d Assumed to weigh 15.5 kg, to breathe 9.3 m3 of air per day, to drink 0.7 L of water per day and to ingest 100 mg of soil per day. Consumption of food groups reported in Health Canada (1998). Median and 90th dietary intake estimates (food) for the1 to 3 years age group, as presented in Table 9-2, were used to represent dietary intake for this age group.
e Assumed to weigh 31.0 kg, to breathe 14.5 m3 of air per day, to drink 1.1 L of water per day and to ingest 65 mg of soil per day. Consumption of food groups reported in Health Canada (1998). Median and 90th dietary intake estimates (food) for the 4 to 8 years age group, as presented in Table 9-2, were used to represent dietary intake for this age group.
f Assumed to weigh 59.4 kg, to breathe 15.8 m3 of air per day, to drink 1.2 L of water per day and to ingest 30 mg of soil per day. Consumption of food groups reported in Health Canada (1998). Highest median and 90th dietary intake estimates (food) for the 9 – 13 years age group, as presented in Table 9-2, were used to represent dietary intake for this age group
g Assumed to weigh 70.9 kg, to breathe 16.2 m3 of air per day, to drink 1.5 L of water per day and to ingest 30 mg of soil per day. Consumption of food groups reported in Health Canada (1998). Highest median and 90th dietary intake estimates (food) for the 19 to 30 years age group, as presented in Table 9-2, were used to represent dietary intake for this age group.
h Assumed to weigh 72.0 kg, to breathe 14.3 m3 of air per day, to drink 1.6 L of water per day and to ingest 30 mg of soil per day. Consumption of food groups reported in Health Canada (1998). Highest median and 90th dietary intake estimates (food) for the > 71 years age group, as presented in Table 9-2, were used to represent dietary intake for this age group.
i Health Canada (2017) measured DINP in 51 homes inToronto and Ottawa, ON, Canada. Median (0.012 µg/m3) and maximum (2.0 µg/m3) concentrations were used in exposure characterization.
j Probabilistic intakes (median and 90th) were incorporated into dietary intake table for comparison purposes. Intakes and methodology are outlined in Appendix D (see also Table 9-2). Note gender and age groups do not match fully; therefore the highest intake from within an age group was inputted into the table: e.g., Female intakes (>71 years) were inputted into the 60+ (unisex) column because this age group had the highest intake of all the groups in the 51 – 71 year range. N/A notates significant variation therefore estimates not presented
k The ingestion of indoor dust is considered a significant source of indoor exposure to Phthalates, including DINP, and the amount of indoor dust ingested each day is based on Wilson et al. (2013). The median (112 ug/g) and 95th (527 ug/g) percentile concentrations of DINP identified in indoor dust were used for exposure characterization (Kubwabo et al. 2013).
Appendix E. Derivation of dietary intakes
Occurrence Data – DINP, DIDP, DMP, DIBP, DCHP, BBP, DBP, DEHP and DnHP
Phthalate occurrence data from the 2013 Canadian Total Diet Study (TDS) were prioritized for estimating dietary exposures. This dataset was determined to be the most comprehensive Canadian survey on the occurrence of phthalates in foods, and results were available for DiBP, BBP, DBP, and DEHP. For other phthalates, occurrence data in food were first taken from the 2013-2014 and 2014-2015 Food Safety Action Plan (FSAP) surveys conducted by the Canadian Food Inspection Agency (CFIA) and/or from a Total Diet Study conducted in the United States (US; Schecter et al. 2013), considering the similarity between samples analyzed in these studies and products available on the Canadian market. Occurrence data in foods that were not covered by the CFIA or the U.S. TDS datasets were supplemented by data from a British Total Diet Study (Bradley et al. 2013b). Note that these data were only used to fill data gaps and that duplicate occurrence data from the British TDS for a given food or phthalate were not included if such data were already available from the CFIA or the U.S. TDS datasets.
Results for phthalates in food that were reported as less than the analytical limit of detection (LOD) were assigned values of ½LOD. However, a value of 0 (zero) was assigned to all samples within a broad food category when no phthalates were detected above the LOD in any sample in that category.
The following table indicates the source(s) of occurrence data used to derive dietary exposure estimates for each phthalate.
| Phthalate | Canadian TDS (2013) | CFIA – FSAP (2013-2015) | Schecter et al. 2013 (U.S. TDS) | Bradley et al. 2013b (British TDS) |
|---|---|---|---|---|
| DiNP | - | X | - | X |
| DiDP | - | X | - | X |
| DMP | - | - | X | X |
| DiBP | X | - | - | - |
| DCHP | - | - | X | X |
| BBP | X | - | - | - |
| DBP | X | - | - | - |
| DEHP | X | - | - | - |
| DnHP | - | - | X | - |
X = Source of occurrence data
- = No data
Note: DINP and DIDP intakes were unchanged from those presented in the SOS report. DIBP was monitored in Health Canada’s 2013 TDS (Cao et al. 2015) however, intakes using this new data showed no signicant changes. For DCHP and DMP, the 2013 TDS data showed low detection frequencies; therefore, previous intake estimates are still presented in this screening assessment.
Food consumption data and matching to occurrence data
The phthalate concentrations in individual foods were matched to consumption figures for these foods from the 2004 Canadian Community Health Survey (CCHS) on nutrition (Statistics Canada 2004) to generate distributions of phthalate exposure for various age-sex groups. The CCHS included 24-hour dietary recall information for over 35,000 respondents of all ages across Canada.
Body weight information
For the purpose of determining per kilogram body weight exposure estimates, infant (0 to 1 year old) body weights were set to the mean body weights as derived from the body weight data from the United States Department of Agriculture Continuing Survey of Food Intakes by Individuals (1994-96 and 1998). For all other age groups, body weights reported in the CCHS, whether measured or self-reported, were used and where missing were imputed using the median for the corresponding age-sex group and quintile of energy intake.
Probabilistic exposure assessment
For each food consumed by a respondent in the CCHS, phthalate concentrations were randomly selected from the matching list of assayed values. For each individual respondent, exposure estimates from each food were summed, generating a distribution of exposure for all respondents. This was repeated 500 times (500 iterations) to model the variability of the distribution of exposures because of the variability of the phthalates levels. For each age-sex group, the median and 90th percentile exposures were derived from the empirical distribution generated by the 500 iterations.
Appendix F. Cumulative risk assessment total hazard index calculation
| Phthalate | Age group (sex) | Intake (upper-bound; ug/kg bw/day) | Reference (i.e., CHMS, NHANES) |
|---|---|---|---|
| DIBP | 3–5 years (M+F) | 3.70 | CHMS Cycle 2 |
| DIBP | 6–11 years (M+F) | 5.30 | CHMS Cycle 2 |
| DIBP | 19+ years (pregnant F) | 1.20 | P4 |
| DCHP | 3–5 years (M+F) | 0 | CHMS Cycle 2 |
| DCHP | 6–11 years (M+F) | 0 | CHMS Cycle 2 |
| DCHP | 12–19 years (F) | 0 | CHMS Cycle 2 |
| DINP | 2–3 years | 5.2 | MIREC-CD Plus |
| DINP | 6–11 years (M) | 25.00 | NHANEs (09-10) |
| DINP | 12–19 years (F) | 27.00 | NHANEs (09-10) |
| Phthalate | Age group (sex) | Intake (upper-bound; ug/kg bw/day) | Reference (i.e., CHMS, NHANES) |
|---|---|---|---|
| BBP | 3–5 years (M+F) | 4.50 | CHMS Cycle 2 |
| BBP | 6–11 years (M) | 3.4 | CHMS Cycle 2 |
| BBP | 19+ years (pregnant F) | 3.01 | P4 |
| DBP | 3–5 years (M+F) | 5.3 | CHMS Cycle 2 |
| DBP | 6–11 years (F) | 5.3 | CHMS Cycle 2 |
| DBP | 19+ years (pregnant F) | 4.11 | P4 |
| DEHP | 3–5 years (M+F) | 12.00 | CHMS Cycle 2 |
| DEHP | 6–11 years (M) | 12.00 | CHMS Cycle 2 |
| DEHP | 18+ years (pregnant F) | 8.42 | MIREC |
| Phthalate | Age group (sex) | Intake (upper-bound; ug/kg bw/day) | Type of exposure (i.e., food, dust, indoor air) |
|---|---|---|---|
| DIBP | 0–6 months (M+F) | 5.90 | Food+dust+air+drinking water |
| DIBP | 5–11 years (M+F) | 0.78 | Food+dust+air+drinking water |
| DIBP | 12–19 years (M+F) | 0.43 | Food+dust+air+drinking water |
| DCHP | 0.5–4 years (M+F) | 0.15 | Food+dust |
| DCHP | 5–11 years (M+F) | 0.12 | Food+dust |
| DCHP | 12–19 years (M+F) | 0.07 | Food+dust |
| DMCHP* | 0–0.5 years (M+F) | 0.05 | Dust |
| DMCHP* | 5–11 years (M+F) | 0.02 | Dust |
| DMCHP* | 12–19 years (M+F) | 0.00 | Dust |
| DBzP* | 0–0.5 years (M+F) | 0.097 | Dust |
| DBzP* | 5–11 years (M+F) | 0.032 | Dust |
| DBzP* | 12–19 years (M+F) | 0.001 | Dust |
| B84P | 0–6 months (M+F) | 0.05 | Dust (B79P surrogate) |
| B84P | 5–11 years (M+F) | 0.02 | Dust (B79P surrogate) |
| B84P | 12–19 years (M+F) | 0.00 | Dust (B79P surrogate) |
| B79P | 0–6 months (M+F) | 0.05 | Dust |
| B79P | 5–11 years (M+F) | 0.02 | Dust |
| B79P | 12–19 years (M+F) | 0.00 | Dust |
| DIHepP | 0–6 months (M+F) | 1.1 | Dust |
| DIHepP | 5–11 years (M+F) | 0.37 | Dust |
| DIHepP | 12–19 years (M+F) | 0.013 | Dust |
| DINP | 6 months–4 years (M+F) | 20.8 | Food+dust+air |
| DINP | 5–11 years (M+F) | 15.7 | Food+dust+air |
| DINP | 12–19 years (M+F) | 11.9 | Food+dust+air |
| CHIBP | NIC | NIC | NIC |
| BCHP | NIC | NIC | NIC |
| BIOP | NIC | NIC | NIC |
NIC = Not in commerce
*NIC but detected in Canadian house dust
| Phthalate | Age group (sex) | Intake (upper-bound; ug/kg bw/day) | Type of exposure (i.e., food, dust, indoor air) |
|---|---|---|---|
| BBP | 6 months–4 years (M+F) | 3.01 | Food+dust+air+drinking water+soil |
| BBP | 5–11 years (M+F) | 1.49 | Food+dust+air+drinking water+soil |
| BBP | 12–19 years (M+F) | 0.50 | Food+dust+air+drinking water+soil |
| DBP | 6 months–4 years (M+F) | 2.96 | Food+dust+air+drinking water+soil |
| DBP | 5–11 years (M+F) | 1.83 | Food+dust+air+drinking water+soil |
| DBP | 12–19 years (M+F) | 1.23 | Food+dust+air+drinking water+soil |
| DEHP | 0.5–4 years (M+F) | 27.57 | Food+dust+air+drinking water+soil |
| DEHP | 5–11 years (M+F) | 17.60 | Food+dust+air+drinking water+soil |
| DEHP | 12–19 years (M+F) | 10.10 | Food+dust+air+drinking water+soil |
| DnHP* | 0–6 months (M+F) | 0.31 | Food+dust |
| DnHP | 5–11 years (M+F) | 0.136 | Food+dust |
| DnHP | 12–19 years (M+F) | 0.031 | Food+dust |
| DIOP | 0–6 months (M+F) | 0.14 | Dust |
| DIOP | 5–11 years (M+F) | 0.05 | Dust |
| DIOP | 12–19 years (M+F) | 0.002 | Dust |
*NIC but detected in Canadian house dust
| Phthalate | Life stage | NOAEL (mg/kg bw/day) | Effects (duration); (reference) | Default uncertainty factor | Calculated reference value |
|---|---|---|---|---|---|
| DIBP | In utero | 125 | Reduced AGD, NR, effects on fertility (GD12-21), ↓ testicular testosterone; (Saillenfait et al. 2008; Furr et al. 2014) | 100 | 1.25 |
| DIBP | (Pre)pubertal | 300 | Testicular pathology (PND21-28, 7 days); (Zhu et al. 2010) | 300 | 1 |
| DCHP/ DMCHP | In utero | 10–20 (LOAEL) | ↓ AGD, TP, increase resorption (GD6-19); (Ahbab and Barlas 2015; Li et al. 2016; Hoshino et al. 2005) | 100 | 0.1 |
| DCHP/ DMCHP | (Pre)pubertal | 18 | ↓ spermatid head counts, testicular atrophy, ↓ body weight gain, ↓ food consumption in F1 males; (Hoshino et al. 2005) | 300 | 0.06 |
| DBzP (MBzP) | In utero | 167 | Read across from MBzP ↓ AGD (~10%) and ↑cryptorchidism (GD15-17); (Ema et al. 2003) | 100 | 1.67 |
| DBzP (MBzP) | (Pre)pubertal | 250 (LOEL) | Read across from MBzP ↓ sperm count (20%) (4 weeks); (Kwack et al. 2009) | 300 | 0.833 |
| B84P (BBP) | In utero | 50 | Read across from BBP Decreased pup body weight, decreased ↓AGD at birth in F2 (based on two-generation studies) ↓ testicular testosterone levels (GD14-18); (Aso et al. 2005; Nagao et al. 2000; Tyl et al. 2004; Furr et al. 2014) | 100 | 0.5 |
| B84P (BBP) | (pre)pubertal | 250–500 (LOEL) | Read across from MBzP and BBP ↓ sperm count (20%) (4 weeks); (Kwack et al. 2009) | 300 | 0.833 |
| B79P | In utero | 50 | ↓ AGD and ↑epispadis (GD6-PND21) (REACH dossier; (ECHA 2013b); ECHA 2013b) | 100 | 0.5 |
| B79P | (Pre)pubertal | 375 | No adverse effects at the highest dose tested; Tyl et al. 2013 | 300 | 1.25 |
| DIHepP | In utero | 64–168 | significant reduction in AGD (13%) in male F2 pups (2 gen); (McKee et al. 2006) | 100 | 0.64 |
| DIHepP | (Pre)pubertal | 227–416 | Significant reduction in AGD. Delayed PPS, ↑ nipple retention, hypospadias and cryptorchidism in F1 pups (2 gen); (McKee et al. 2006) | 300 | 0.757 |
| DINP | In utero | 10 (LOEL) | MNGs, Leydig cell clusters/aggregation (GD12-21); (Li et al. 2015) | 100 | 0.1 |
| DINP | (Pre)pubertal | 500 (LOEL) | Decreased absolute seminal vesicle and LABC weights (10 days), castrated animals; (Lee and Koo 2007) | 300 | 1.67 |
| Additional phthalate | Life stage | NOAEL (mg/kg bw/d) | Effects (duration); (reference) | Reference | Default uncertainty factor | Calculated reference value |
|---|---|---|---|---|---|---|
| BBP | In utero | 50 | ↓AGD at birth in F2 (based on two two-generation studies); Aso et al. 2005; (Tyl et al. 2004; Nagao et al. 2000) | Aso et al. 2005; Tyl et al. 2004; Nagao et al. 2000 | 100 | 0.5 |
| BBP | (Pre)pubertal | 500 (LOEL) | ↓ sperm count (30%), ↓ sperm motility, ↓ body weight gain, ↑ rel. liver weight (4 weeks); (Kwack et al. 2009) | Kwack et al. 2009 | 300 | 1.667 |
| DBP | In utero | 10 | ↓ testicular testosterone (GD12-19), fertility effects (GD14-23.5), ↓ in tubular and interstitial cell populations, altered seminiferous tubule morphometry, other mild effects on spermatocyte development (GD12-21); (Lehmann et al. 2004; Ahmad et al. 2014; Boekelheide et al. 2009) | Lehmann et al. 2004; Ahmad et al. 2014; Boekelheide et al. 2009 | 100 | 0.1 |
| DBP | (Pre)pubertal | 10–50 (LOEL) | LOEL: delayed spermatogenesis, reduced absolute AGD (relative to BW at higher dose) in mice (PND 4-14); (Moody et al. 2013; Srivastava et al. 1990; Xioa-feng et al. 2009) | Moody et al. 2013; Srivastava et al. 1990; Xioa-feng et al. 2009 | 300 | 0.033 |
| DEHP | In utero | 4.8 | Small and/or aplastic epididymis, testicular pathology other RPS effects in F1 and F2 (2-gen study); (Blystone et al. 2010; Wolfe and Layton 2003; Andrade et al. 2006a,b; Christiansen et al. 2010) | Blystone et al. 2010; Wolfe and Layton 2003; Andrade et al. 2006a,b; Christiansen et al. 2010 | 100 | 0.048 |
| DEHP | (Pre)pubertal | 10 | ↓absolute and relative testis weight (>10%) (PND 6-10, 5 days exposure); (Dostal et al. 1988) | Dostal et al. 1988 | 300 | 0.033 |
| DnHP | In utero | 5 | ↓ serum/ testicular testosterone levels, ↓ AGD, testicular pathological changes (GD12-19, GD 6-19); (Ahbab and Barlas 2015; Saillenfait et al. 2013) | Ahbab and Barlas 2015; Saillenfait et al. 2013 | 100 | 0.05 |
| DnHP | (Pre)pubertal | 10 | Read across from DEHP ↓absolute and relative testis weight (>10%) (PND6-10, 5 days exposure); (Dostal et al. 1988) |
Dostal et al. 1988 | 300 | 0.033 |
| DIOP | In utero | 100 | testicular pathological changes, fertility effects and ↓ testis weight (GD12-19, GD12-21, GD6-19); (Saillenfait et al. 2013) | Saillenfait et al. 2013 | 100 | 1 |
| DIOP | (Pre)pubertal | 227–416 | Read across from DIHepP Significant reduction in AGD. Delayed PPS, ↑ nipple retention, hypospadias and cryptorchidism in F1 pups (2 gen study); (McKee et al. 2006) |
McKee et al. 2006 | 300 | 0.757 |
| Phthalate | Environmental media and food; hazard quotient (% of HI) | Biomonitoring; hazard quotient (% of HI) |
|---|---|---|
| DIBP | 0.0003 (0.1%) | 0.0010 (0.2%) |
| DCHP | 0.0007 (0.2%) | 0.0000 (0.0%) |
| DMCHP | 0.0000 (0.0%) | N/A |
| DBzP | 0.0000 (0.0%) | N/A |
| B84P | 0.0000 (0.0%) | N/A |
| B79P | 0.0000 (0.0%) | N/A |
| DIHepP | 0.0000 (0.0%) | N/A |
| DINP | 0.119 (34%) | 0.27 (55%) |
| CHIBP | 0.0000 (0.0%) | N/A |
| BCHP | 0.0000 (0.0%) | N/A |
| BIOP | 0.0000 (0.0%) | N/A |
| BBP | 0.0010 (0.3%) | 0.0060 (1.2%) |
| DBP | 0.0123 (3.6%) | 0.0411 (8.3%) |
| DEHP | 0.2104 (61%) | 0.1754 (36%) |
| DnHP | 0.0006 (0.2%) | N/A |
| DIOP | 0.0000 (0.0%) | N/A |
| HI for pregnant women | 0.34 | 0.49 |
N/A = Not applicable
| Phthalate | Environmental media and food; hazard quotient (% of HI) | Biomonitoring; hazard quotient (% of HI) |
|---|---|---|
| DIBP | 0.0047 (0.6%) | 0.0030 (0.8%) |
| DCHP | 0.0015 (0.2%) | 0.0000 (0.0%) |
| DMCHP | 0.0005 (0.06%) | N/A |
| DBzP | 0.0001 (0.0%) | N/A |
| B84P | 0.0001 (0.0%) | N/A |
| B79P | 0.0001 (0.0%) | N/A |
| DIHepP | 0.0017 (0.2%) | N/A |
| DINP | 0.2080 (25.0%) | 0.0520 (14.2%) |
| CHIBP | 0.0000 (0.0%) | N/A |
| BCHP | 0.0000 (0.0%) | N/A |
| BIOP | 0.0000 (0.0%) | N/A |
| BBP | 0.0060 (0.7%) | 0.0090 (2.5%) |
| DBP | 0.0296 (3.6%) | 0.0530 (14.4%) |
| DEHP | 0.5744 (69.0%) | 0.2500 (68.1%) |
| DnHP | 0.0062 (0.74%) | N/A |
| DIOP | 0.0001 (0.02%) | N/A |
| HI for infants | 0.83 | 0.37 |
N/A = Not applicable
| Phthalate | Environmental media and food; hazard quotient (% of HI) | Biomonitoring; hazard quotient (% of HI) |
|---|---|---|
| DIBP | 0.0008 (0.1%) | 0.0053 (1.0%) |
| DCHP | 0.0020 (0.3%) | 0.0000 (0.0%) |
| DMCHP | 0.0003 (0.1%) | N/A |
| DBzP | 0.0000 (0.0%) | N/A |
| B84P | 0.0000 (0.0%) | N/A |
| B79P | 0.0000 (0.0%) | N/A |
| DIHepP | 0.0005 (0.1%) | N/A |
| DINP | 0.0094 (1.6%) | 0.0150 (2.8%) |
| CHIBP | 0.0000 (0.0%) | N/A |
| BCHP | 0.0000 (0.0%) | N/A |
| BIOP | 0.0000 (0.0%) | N/A |
| BBP | 0.0009 (0.1%) | 0.0020 (0.4%) |
| DBP | 0.0549 (9.1%) | 0.1590 (29.4%) |
| DEHP | 0.5280 (87.9%) | 0.3600 (66.5%) |
| DnHP | 0.0041 (0.7%) | N/A |
| DIOP | 0.0001 (0.0%) | N/A |
| HI for children | 0.60 | 0.54 |
N/A = Not applicable