
State of the science report - Certain organic flame retardants substance grouping - Benzoic acid, 2,3,4,5-tetrabromo-, 2-ethylhexyl ester (TBB) and 1,2-benzenedicarboxylic acid, 3,4,5,6-tetrabromo-, bis(2-ethylhexyl) ester (TBPH)
Official title: State of the science report - Certain organic flame retardants substance grouping - Benzoic acid, 2,3,4,5-tetrabromo-, 2-ethylhexyl ester (TBB) and 1,2-Benzenedicarboxylic acid, 3,4,5,6-tetrabromo-, bis(2-ethylhexyl) ester (TBPH)
Chemical Abstracts Service Registry Number:
- 183658-27-7 (TBB)
- 26040-51-7 (TBPH)
Environment and Climate Change Canada
Health Canada
May 2019
Cat. No.: En14-368/2019E-PDF
ISBN 978-0-660-30004-7

Synopsis
Pursuant to section 68 of the Canadian Environmental Protection Act, 1999 (CEPA), the Minister of the Environment and the Minister of Health have prepared a state of the science (SOS) report for benzoic acid, 2,3,4,5-tetrabromo-, 2-ethylhexyl ester (TBB) and 1,2-benzenedicarboxylic acid, 3,4,5,6-tetrabromo-, bis(2-ethylhexyl) ester (TBPH).
The purpose of this report is to review the current science on TBB and TBPH and provide an updated analysis of the potential harm to the Canadian environment and human health.
Both substances are part of the Certain Organic Flame Retardants (OFR) Substance Grouping, which includes ten organic substances having a similar function: application to materials to slow the ignition and spread of fire. The two substances subject to this state of the science report were identified as priorities for action on the basis of potential ecological and human health concerns. Furthermore, TBPH has been in commerce in Canada since the transitional period between the establishment of the Domestic Substances List (DSL) and the coming into force of the New Substances Notification Regulations (Chemicals and Polymers) (between January 1, 1987 and July 1, 1994). Their Chemical Abstracts Service Registry Number (CAS RN), common name, acronym, and Non-Domestic Substances List (NDSL) or the U.S. Toxic Substances Control Act (TSCA) names are listed below.
| CAS RN | Common Name (Acronym) | NDSL or TSCA name |
|---|---|---|
| 183658-27-7 | 2-ethylhexyl-2,3,4,5 tetrabromobenzoate (TBB) | benzoic acid, 2,3,4,5-tetrabromo-, 2-ethylhexyl ester (TSCA name) |
| 26040-51-7 | bis(2-ethylhexyl) 3,4,5,6-tetrabromophthalate (TBPH) | 1,2-benzenedicarboxylic acid, 3,4,5,6-tetrabromo, bis(2-ethylhexyl) ester (NDSL name) |
TBB and TBPH do not occur naturally in the environment. These substances are used primarily as additive flame retardants in polyurethane foams and/or as plasticizers. TBPH can be used alone or in commercial mixtures with TBB (TBB/TBPH mixture). Commercial TBB/TBPH mixtures may contain only TBB and TBPH, or may include organophosphates. CAS RN 219632-53-8 represents the mixture containing only TBB and TPBH.
Based on aggregated data from a survey conducted under section 71 of CEPA and from the New Substances Program, TBB and TBPH imports into Canada ranged between 10 000 and 100 000 kg for each substance in 2011. TBPH production estimates in the United States between 1990 and 2012 were 450 to 4500 tonnes per year. No production estimates for TBB were available.
The TBB/TBPH mixture containing organophosphates is generally considered as an alternative for the commercial pentabromodiphenyl ether mixture (pentaBDE), which is subject to either regulatory action or reported voluntary phase-out in most jurisdictions. TBPH alone is also used as a plasticizer for polyvinyl chloride and neoprene. In Canada, mixtures containing only TBB and TBPH, or which also include organophosphates, are imported as additive flame retardants in manufactured items containing flexible polyurethane foam (mattresses, pillows, cushions, and any seating, furniture and furnishings), while TBPH alone is also imported as an additive flame retardant.
Although no studies could be found which attempted to measure TBB and TBPH in the soil compartment, these compounds have been measured and detected in all other environmental compartments in North American samples. Higher concentrations in biota have been associated with landfill sites, and both compounds have been detected in various Arctic organisms.
TBB and TBPH are characterized by very low water solubility, very low vapour pressure, and high to very high octanol-water partition coefficients. When released to the environment, TBB and TBPH are expected to predominantly reside in soil and/or sediment, depending on the compartment of release, with a small amount remaining in water.
Experimental and modelled data indicate that the aerobic biodegradation potential of TBB and TBPH is limited, and that these compounds are expected to persist in water, soil, and sediment. TBB and TBPH may persist in the air compartment via sorption to fine particulates and consequently be subject to long-range transport, as is further supported by the presence of TBB and TBPH in remote environments.
Empirical data suggest a limited potential for accumulation of TBB and TBPH in the tissues of biota. Metabolism products for TBB and TBPH were detected in both in vitro and in vivo bioaccumulation studies.
On the basis of the results of acute and chronic toxicity testing, TBB and TBPH have demonstrated toxicity to aquatic organisms at low concentrations. Toxicity data for soil and sediment organisms were not identified.
TBB and TBPH are expected to be released to the environment from industrial sources and manufactured items primarily through wastewater. Risk quotient analyses, integrating conservative estimates of exposure with toxicity information, were performed for scenarios involving industrial releases, and for residential releases from manufactured items. A low potential for risk in the aquatic compartment was calculated for TBPH and a TBB/TBPH mixture. A low potential for risk from TBB was also calculated for small mammals (e.g., shrew) following application of biosolids to soil. Critical body residue analysis for TBB demonstrated a low risk to fish from dietary exposure, and a low risk to mammals (e.g., mink and river otter) consuming those fish.
Considering all available lines of evidence presented in this SOS report, there is currently a low potential for harm to the environment from TBB and TBPH.
No classifications of the health effects of TBB or TBPH by national or international regulatory agencies were identified. On the basis of the available information on health effects of TBB or TBPH and the TBB/TBPH mixture, the critical effects for characterization of risk to human health were effects on the reproductive system. Available information did not indicate carcinogenicity or genotoxicity.
The main sources of exposure for the general population in Canada are expected to be from environmental media (air, dust, soil, and water), food, including breast milk, and from the use of products available to consumers such as foam-containing furniture.
A comparison of levels between estimates of intake from environmental media, food, breast milk, and from contact with products available to consumers and critical effect levels are considered adequate to account for uncertainties in the exposure and health effects databases. Therefore, the potential for harm to human health from TBB and TBPH is considered to be low.
Overall outcome
Although present estimated levels of exposure of TBB and TBPH are not indicative of harm to the environment or to human health, there may be concerns if import and use quantities were to increase in Canada
As TBB and TBPH are among commercial alternatives to high-volume legacy flame retardants, like the polybrominated diphenyl ethers (PBDEs), and noting that TBPH has high-production volume status in other jurisdictions, there is a probability that quantities could increase in Canada. Given that TBB and TBPH are not on the DSL, they will continue to be subject to the New Substances Notifications Regulations (Chemicals and Polymers) of CEPA. This will require pre-market notification of any new import or manufacture of these substances and will allow restrictions to be put in place, as needed. In addition, the current manner in which these substances are restricted (e.g. conditions on use, handling, disposal, and release) under the New Substances Notifications Regulations (Chemicals and Polymers) will remain in place, ensuring that industrial releases are minimized, and that record-keeping of substance use and quantity are maintained.
1. Introduction
Pursuant to sections 68 or 74 of the Canadian Environmental Protection Act, 1999 (CEPA) (Canada 1999), the Minister of the Environment and the Minister of Health conduct evaluations of substances to determine whether these substances present or may present a risk to the environment or to human health.
The Substance Groupings Initiative is a key element of the Government of Canada’s Chemicals Management Plan (CMP). The Certain Organic Flame Retardants Substance Grouping consists of ten substances identified as priorities for assessment, as they met the categorization criteria under section 73 (1) of CEPA, and/or were considered as a priority on the basis of ecological and/or human health concerns (Environment Canada, Health Canada 2007). All of these substances have a similar function: the application to materials to slow the ignition and spread of fire. These substances are also potential alternatives for other flame retardants which are presently subject to regulatory controls or phase-out in Canada and/or globally.
This state of the science (SOS) report provides a summary and evaluation of the current available science for two substances: benzoic acid, 2,3,4,5-tetrabromo-, 2-ethylhexyl ester (TBB) and 1,2-benzenedicarboxylic acid, 3,4,5,6-tetrabromo-, bis(2-ethylhexyl) ester (TBPH). As TBB and TBPH are not on the DSL, they are subject to the New Substances Notifications Regulations (Chemicals and Polymers) pursuant to CEPA (Canada 2005). Following New Substances ecological and human health risk assessments, conducted from 1997 to 2012, these substances were suspected of being “toxic” under subsections 64(a) and 64 (c) of CEPA. TBPH has been in commerce in Canada since the transitional period between the establishment of the Domestic Substances List and the coming into force of the New Substance Notification Regulations (between January 1, 1987 and July 1, 1994). Risk management measures (i.e., Ministerial Conditions) have been imposed on notifiers of higher schedule New Substance notifications to mitigate potential risks to human health and the environment. The purpose of the SOS is to review the currently available science on TBB and TBPH, to evaluate the current potential for harm to the Canadian environment and human health, and to determine whether the manner in which these substances are restricted remains appropriate.
This SOS report includes consideration of information on chemical properties, environmental fate, hazards, uses and exposure, including additional information submitted by stakeholders. Relevant data were identified up to December 2016 for both human health and ecological sections. Targeted literature searches were conducted up to July 2018 for human health components of this assessment. Empirical data from key studies as well as some results from models were used to reach the outcome. When available and relevant, information presented in assessments from other jurisdictions was considered.
This SOS report was prepared by staff in the CEPA Risk Assessment Program at Health Canada and Environment and Climate Change Canada and incorporates input from other programs within these departments. The ecological and human health portions of this report have undergone external written peer review and/or consultation. Comments on the technical portions relevant to the environment were received from: Dr. Jon Arnot, Arnot Research and Consulting; John Biesemeier, Chemtura Corporation; Dr. Adrian Covaci, University of Antwerp; Dr. Miriam Diamond, University of Toronto; and Dr. Heather Stapleton, Duke University. Comments on the technical portions relevant to human health were received from: Dr. Michael Jayjock, The LifeLine Group; Dr. Bernard Gadagbui, Toxicity Excellence for Risk Assessment; Dr. Patricia McGinnis, Independent Consultant and from Risk Assessment Division, Office of Pollution Prevention and Toxics, US Environmental Protection Agency (US EPA). Additionally, the draft of this SOS report was subject to a 60-day public comment period. Some human health portions of this assessment have undergone an additional targeted external written peer consultation. Comments were received from Richard Manderville, University of Guelph; Mohamed Abou-Elwafa Abdallah, University of Birmingham; and Kebede K. Kefeni, Tshwane University of Technology. While external comments were taken into consideration, the final content and outcome of the SOS report remain the responsibility of Health Canada and Environment and Climate Change Canada (ECCC).
This SOS report focuses on the critical studies and lines of evidence pertinent to the evaluation by examining scientific information and incorporating a weight of evidence approach and precautionFootnote 1 . This SOS report presents the critical information and considerations on which the evaluation is based.
2. Identity of substances
This SOS report focuses on benzoic acid, 2,3,4,5-tetrabromo-, 2-ethylhexyl ester and 1,2-benzenedicarboxylic acid, 3,4,5,6-tetrabromo-, bis(2-ethylhexyl) ester. These substances are additive brominated flame retardants within the Certain Organic Flame Retardants (OFRs) Substance Grouping under the Substance Groupings Initiative of the CMP. The structural identity of these substances is presented in Table 2‑1. These substances share clear similarities in their chemical structure. Both are tetrabrominated aryl ester compounds, and feature the same ester substitution. For this SOS report, benzoic acid, 2,3,4,5-tetrabromo-, 2-ethylhexyl ester and 1,2-benzenedicarboxylic acid, 3,4,5,6-tetrabromo-, bis(2-ethylhexyl) ester will be abbreviated as TBB and TBPH, respectively. These abbreviations are derived from the respective common names, 2-ethylhexyl 2,3,4,5-tetrabromobenzoate (TBB) and bis(2-ethylhexyl) 3,4,5,6-tetrabromophthalate (TBPH). Notably, abbreviations used in the open literature often also include the identity of the ester substituents. For example, these substances are also frequently abbreviated as EH-TBB and BEH-TBP, respectively. Other names for these substances are presented in Appendix A. TBB has only been identified commercially in a mixture with TBPH. The mixture of TBB and TBPH has a unique CAS RN: 219632-53-8 (1,3-Isobenzofurandione, 4,5,6,7-tetrabromo-, reaction products with 2-ethyl-1-hexanol).
| CAS RN | Chemical structure | Molecular weight (g/mol) | Chemical formula |
|---|---|---|---|
| 183658-27-7 (TBB) | 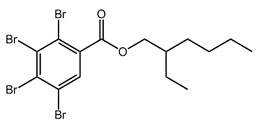 |
549.9 | C15H18Br4O2 |
| 26040-51-7 (TBPH) | 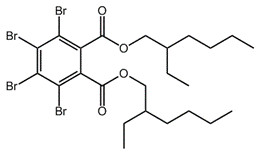 |
706.2 | C24H34Br4O4 |
2.1 Selection of analogues and use of (Q)SAR models
Guidance on the use of a read-across approach and quantitative structure-activity relationships or (Q)SAR models for filling data gaps has been prepared by various organizations such as the Organisation for Economic Co-operation and Development (OECD). These methods have been applied in various regulatory programs including the European Union’s (EU) Existing Substances Programme. In this report, a read-across approach using data from analogues and the results of (Q)SAR models, where appropriate, have been used to inform the ecological and human health evaluations. The applicability of (Q)SAR models was determined on a case-by-case basis. Details of the read-across data and (Q)SAR models chosen to inform the ecological and human health evaluations of TBB and TBPH are further discussed in the relevant sections of this report.
In the open literature, TBPH has been referred to as a “brominated analogue” of bis(2-ethylhexyl) phthalate (DEHP). While these substances share the same core phthalate structure, the addition of four bromine atoms to TBPH almost doubles the molecular weight and significantly modifies a number of physical chemical and hazard properties. Ultimately, as will be detailed in subsequent sections of this report, DEHP was not considered an appropriate analogue for experimental value adjustments or other read-across in the evaluation of TBB and TBPH. Substance identity information for DEHP, and its metabolite mono(2-ethylhexyl) phthalate (MEHP), is presented for completeness in Table 2‑2. No other suitable analogues for TBB or TBPH were identified
| CAS RN | Chemical structure | Molecular weight (g/mol) | Chemical formula |
|---|---|---|---|
| 117-81-7 (DEHP) | 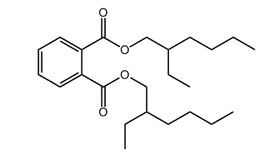 |
390.3 | C24H38O4 |
| 4376-20-9 (MEHP) | 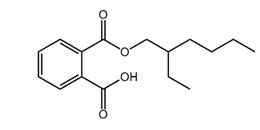 |
278.4 | C16H22O4 |
3. Physical and chemical properties
Physical and chemical properties determine the overall characteristics of a substance and are used to determine the suitability of different substances for different types of applications. Such properties also play a critical role in determining the environmental fate of substances (including their potential for long-range transport), as well as their toxicity to humans and non-human organisms. A summary of key modelled values for the physical chemical properties of TBB and TBPH that are relevant to their environmental fate and ecotoxicity is presented in Table 3‑1.
TBB and TBPH are considered amenable to model prediction of physical and chemical properties using quantitative structure-activity relationships (QSARs) as they are within the model domain of applicability (i.e., structural and/or property parameter domains are represented in the training set used for the models). Empirical data for physical-chemical properties submitted for a commercial mixture containing TBB and TBPH only, in unknown proportions, is summarized in Appendix B. Owing to significant uncertainty with the empirical data for the mixture, modelled results were considered more applicable to the individual substances and thus were carried forward in the report. Only the empirical melting point of the mixture was deemed suitable for read across to the individual substances. Empirical data for TBPH alone was identified from the European Chemicals Agency Registered Substances database (ECHA 2013), and was also included in the determination of values for key physical-chemical properties.
Where more than one appropriate model or valid empirical result was available for a given physical-chemical property, the median was taken as the key value. More detailed documentation of how the key values were derived (including the Least-Squares Adjustment Procedure of Schenker et al. 2005) and further discussion of the empirical data may be found in Appendix B.
TBB and TBPH are characterized by sparing solubility in water, low to very low vapour pressures, high organic carbon-water partition coefficients, and high to very high octanol-water partition coefficients.
| Property | TBB | TBPH | References |
|---|---|---|---|
| Physical state | liquid | liquid | NA |
| Melting point (°C) | -25 (mixture) | -25 (mixture) | Great Lakes Chemical Corporation 1997a |
| Boiling point (°C) | 455 | 565 | MPBPWIN 2010, ACD Percepta c1996-2014 |
| Vapour pressure (Pa) | 3.02 x 10⁻⁶ | 1.29 x 10⁻⁹ | MPBPWIN 2010, ACD Percepta c1996-2014 |
| Henry’s law constant (Pa·m3/mol) | 5.88 x 10⁻¹ | 2.97 x 10⁻² | HENRYWIN 2011 |
| Water solubility (mg/L) | 2.82 x 10⁻³ | 3.07 x 10⁻⁵ | ACD Percepta c1996-2014, WATERNT 2010, WSKOWWIN 2010, VCCLAB 2005, ECHA 2013 |
| Log KAW | -3.63 | -4.92 | NA (calculated) |
| Log KOW | 7.71 | 10.10 | ACD Percepta, c1996-2014, KOWWIN 2010, VCCLAB 2005, Abraham et al. 1994, ECHA 2013 |
| Log KOC | 5.12 | 6.38 | KOCWIN 2010 |
| Log KOA | 11.34 | 15.03 | KOAWIN 2010 |
4. Sources
TBB and TBPH do not occur naturally. Review of the open patent literature indicates that TBB and TBPH arise from the same synthetic process, where either compound may become the dominant product by adjusting the reaction conditions (Bohen et al. 1991, Hill et al. 1997, Rose et al. 1998, Bartley et al. 2007). TBB and TBPH co-occur in the commercial product Firemaster BZ-54 (CAS RN 219632-53-8), with proportions reported from 70 to 80% TBB : 20 to30% TBPH (Ma et al. 2012, de Jourdan et al. 2014). Firemaster BZ-54 (BZ-54) is blended with organophosphate flame retardants in an approximately 50:50 ratio to produce another commercial product, Firemaster 550 (FM-550) (Weil and Levchick 2004, Chen et al. 2013). Commercial mixtures with these compositions will be hereafter referred to in this report as “TBB/TBPH mixture” and “TBB/TBPH/Organophosphate mixture”, respectively. TBPH is sold on its own as DP-45, although Materials Safety Data Sheets indicate that a small amount of residual TBB is present (La Guardia et al. 2012).
Sources of exposure to TBB and TBPH to the environment are primarily from waste streams or effluents of polyurethane foam manufacturers using TBB/TBPH mixtures (containing only TBB and TBPH, or including other compounds) as additive flame retardants, plastic compounding plants using TBPH as a plasticizer and/or flame retardant, wastewater treatment systems effluents, and cleaning of transport containers.
TBB and TBPH are not on the DSL. Therefore, they are subject to the New Substances Notifications Regulations (Chemicals and Polymers) pursuant to CEPA. Based on information gathered from a survey conducted under section 71 of CEPA, and data from New Substance Notifications (including data collected in relation to the record keeping requirements of Ministerial Conditions), the total quantities of TBB (in TBB/TBPH mixtures) and TBPH (alone or in TBB/TBPH mixtures) imported into Canada in 2011 were in the range of 10 000 to 100 000 kg. These quantities include importation of neat substance/mixture, and quantities pre-blended into industrial formulations (ECCC 2013 to 2014, Environment Canada 2000 to 2014). No manufacture of either substance was identified in Canada. Also, no export of TBB or TBPH out of Canada in 2011 was identified.
The commercial importance of TBB and TBPH has increased primarily as an alternative for the commercial pentabromodiphenyl ether mixture (pentaBDE) (Covaci et al. 2011). TBPH is considered a low production volume chemical in Europe (Harju et al. 2009). TBPH production estimates in the United States were 450 to 4500 tonnes/year from 1990 to 2012, and thus TBPH is considered a high-production volume chemical in the US (US EPA 2014a; US EPA 2014b; US EPA 2014c). TBB production estimates in the United States were withheld, and no other estimates could be found (US EPA 2014c).
5. Uses
According to manufacturer literature, the TBB/TBPH mixture and the TBB/TBPH/Organophosphate mixture are marketed for flexible polyurethane foam applications (Great Lakes Solutions c2014a; Great Lakes Solutions c2014b), and TBB/TBPH mixture is also marketed for automotive use (Great Lakes Solutions c2014a).
In Canada, as TBB and TBPH are not on the DSL, they are subject to the New Substances Notifications Regulations (Chemicals and Polymers) pursuant to CEPA. Risk management measures (i.e., Ministerial Conditions) have been placed on some New Substance notifiers, generally at higher schedule notification. For these notifiers, the Ministerial Conditions limit the import of TBB and TBPH for use as a flame retardant additive in polymer matrices, and place some restrictions on environmental release, disposal, and transport vessel handling (Canada 2002, 2003, 2006, 2010 and 2011).
On the basis of the information submitted under section 71 of CEPA (ECCC 2013 to 2014), TBB and TBPH are used in Canada as flame retardants in manufactured items containing flexible polyurethane foam in seating and bedding (e.g., mattresses, pillows, cushions, and any seating, furniture and furnishings), plastic, and industrial fabric coating. In preliminary product testing conducted by Health Canada of children’s manufactured items (e.g., nursing pillows, toys) purchased in Canada in 2014, TBB and TBPH were detected in a foam chair, at maximum concentrations of approximately 5% and 2%, respectively, but were not detected in the remaining 22 children’s manufactured items (Health Canada 2014). In a separate report on children’s foam chairs from various retail outlets, TBB and TBPH were measured in both foam chairs purchased in Canada (as well as in half of the 40 chairs purchased in the U.S.) (CEH 2013b). A project conducted by the Commission for Environmental Cooperation (CEC) involved the testing of 132 furniture products from Canada, the U.S. and Mexico for the presence of sixteen emerging flame retardants, including TBB and TBPH. Both substances were detected in foam from a sofa that was purchased in Canada (CEC 2015). TBB and TBPH were measured (up to 154.4 and 11.6 mg/g, respectively) in flexible polyurethane foam from vehicles (n=18) collected from salvage yards in the Greater Toronto Area, in Canada (Mochungong et al. 2014).
TBB and TBPH are not listed as approved food additives in the Lists of Permitted Food Additives, which have been incorporated by reference into their respective Marketing Authorizations issued under the Food and Drugs Act (Health Canada [modified 2017]), nor have they been identified as being used/present in formulations of food packaging materials or incidental additives (2013 email from Food Directorate, Health Canada, to Risk Management Bureau, Health Canada; unreferenced). TBB and TBPH are not listed in the Drug Products Database, the Therapeutic Products Directorate's internal Non-Medicinal Ingredient Database, the Natural Health Products Ingredients Database or the Licensed Natural Health Products Database as medicinal or non-medicinal ingredients present in final pharmaceutical products, natural health products or veterinary drugs in Canada (DPD [modified 2017], NHPID [modified 2017], LNHPD [modified 2016]; 2013 email from the Therapeutic Products Directorate, Health Canada, to Risk Management Bureau, Health Canada; unreferenced). According to the notifications submitted under the Cosmetic Regulation to Health Canada, TBB and TBPH are not used in cosmetic products in Canada (2014 emails from the Consumer Product Safety Directorate, Health Canada, to the Existing Substances Risk Assessment Bureau, Health Canada; unreferenced).
In the U.S., the TBB/TBPH/Organophosphate mixture has been measured in several children’s manufactured items containing flexible polyurethane foam, including nap mats (CEH 2013a), car seats, changing table pads, portable mattresses, and a rocking chair (Stapleton et al. 2011). The TBB/TBPH/Organophosphate mixture has been measured in couches containing flexible polyurethane foam (Stapleton et al. 2009; Stapleton et al. 2012), and was identified in 18% of post-pentaBDE phase-out foam samples from couches (US EPA 2014d). In Australia, the TBB/TBPH mixture is listed as used in automotive furnishings as well as furniture foam, both at concentrations less than 20% (NICNAS 2004).
Internationally, TBPH alone is primarily used as an additive flame retardant and plasticizer in polyvinyl chloride (PVC), neoprene, styrene butadiene rubber, and ethylene propylene diene monomer rubber (Great Lakes Solutions c2014c, Andersson et al. 2006, Covaci et al. 2011). PVC containing TBPH is used in electrical equipment such as wire and cable insulation, and in film and sheeting (Great Lakes Solutions c2014c; Covaci et al. 2011). Manufactured items and products that may contain TBPH include adhesives, coatings, coated fabric, and wall coverings (Great Lakes Solutions c2014c, Unitex Chemical Corporation 2009, Covaci et al. 2011, TemaNord 2011).
6. Releases to the environment
Anthropogenic releases to the environment depend upon losses that occur during the manufacture, industrial use, consumer/commercial use and disposal of a substance and products containing that substance. Releases of TBB and TBPH to the Canadian environment resulting from use as additive flame retardants are expected to be diffuse, with some point sources (e.g., wastewater systems connected to: foam manufacturing facilities, plastic compounding facilities, textile plants). Releases may occur in both indoor and outdoor environments. For TBPH alone, releases from the following industrial activities are expected in Canada: formulation, plastic compounding, and industrial fabric coating; and for TBB/TBPH together in a mixture: manufacturing of polyurethane foam, polyurethane insulation injection, and polyurethane adhesive use.
Potential releases of TBB and TBPH to the environment may be of the greatest point source magnitude during manufacturing, formulation, and/or industrial use stages. For instance, La Guardia et al. (2010) found correlation of industrial influence and TBB and TBPH concentrations in a small wastewater treatment plant (~10 000 population served) that received influent from industry. Specifically, the authors note a substantial decline in concentrations of both TBB and TBPH in wastewater biosolids following relocation of an automotive interior manufacturer from the area. However, potential release of TBB and TBPH from products available to consumers may also be very significant. As additive flame retardants (rather than reactive flame retardants chemically bonded to the polymer), there is a greater possibility for release of TBB and TBPH from products available to consumers to the environment (Guerra et al 2011). TBB and TBPH may be entering dust from products available to consumers through direct partitioning, volatilization and adsorption, or physical weathering and abrasion (Toms et al 2011). Melymuk et al. (2014) indicate that a principle source of flame retardants to wastewater may be dust from textiles, furniture and electronics entering the wastewater system from cleaning and laundering. Schreder and La Guardia (2014) present evidence that household dust entering laundry wastewater is the primary source of TBB, TBPH, and other flame retardants to wastewater treatment plants serving primarily households.
Releases to the environment are expected to occur primarily through wastewater. Release to the soil could also occur through the application of wastewater biosolids to agricultural and pasture lands. Emissions to air can result in atmospheric deposition to soil and water. When a substance is unintentionally transferred to land, it may be washed into the wastewater collection system or surface water or transferred by wind or rain to nearby soil. However, the low volatility of TBB and TBPH suggests that these substances will not preferentially remain in the gas phase following emission, nor will they tend to volatilize from water or soil into air. Finally, while most landfills in Canada treat their leachate through wastewater treatment systems, landfills where the leachate is not collected and treated have the potential to leach substances into groundwater (potentially reaching surface water).
This information is used to further develop exposure characterization scenarios to estimate resulting environmental concentrations.
7. Measured environmental concentrations
Data concerning concentrations of TBB and TBPH in the Canadian environment have been identified. Additional international data have also been identified and are included in Table 7‑1 and Table 7‑2 below.
7.1 Air
TBB and TBPH were detected at 89% and 100%, respectively, of the 9 North American sites that were part of the Global Atmospheric Passive Sampling Network (GAPS) in 2005 (Lee et al. 2010). Air monitoring in Toronto showed that TBB and TBPH were detected in the majority of samples (96 and 85%; n=70) collected from 2010 to 2011, albeit at relatively low concentrations (up to 1.9 pg/m3 for TBB and up to 1.1 pg/m3 for TBPH) (Shoeib et al. 2014). Separate measurements in Toronto (Diamond et al. 2013), demonstrate a higher detection frequency (100% for both TBB and TBPH) in the ambient air samples (n=20) also collected in 2011. In this study, TBB was measured up to 9 pg/m3 (mean of 3.2 pg/m3) while TBPH was measured up to 7 pg/m3 (mean of 2.5 pg/m3) (Diamond et al. 2013).
Ma et al. (2012) measured atmospheric concentrations of TBB and TBPH in the Great Lakes atmosphere over the course of two years (2008 to 2010), using air samples collected by the Integrated Atmospheric Deposition Network (IADN). Concentrations of both compounds were found to be increasing rapidly over time, and as can be seen in Table 7‑1, are correlated with the more urban sampling areas (Ma et al. 2012). In this study, the Chicago and Cleveland sites showed the highest concentrations of TBB (0.5 to 55 pg/m3) and TBPH (0.36 to 290 pg/m3), while remote sites such as Eagle Harbor and Sleeping Bear Dunes exhibited the lowest levels of TBB (0.05 to 7.5 pg/m3) and TBPH (0.11 to 32 pg/m3). At the Canadian rural site (Point Petre, Ontario), TBB and TBPH were detected at lower frequencies (16% and 53%, respectively; n=45) than the urban sites, and levels of TBB (0.074 to 0.82 pg/m3) and TBPH (0.18 to 3.7 pg/m3) were similar to the U.S. remote sites (Ma et al. 2012).
Xiao et al. have reported TBB and TBPH air concentrations measured in the Canadian Arctic at Alert, Nunavut, the northernmost inhabited location in the world, from 2007 to 2008, noting that the concentrations found are similar to those of the dominant commercial pentaBDE congeners, BDE-47 and BDE-99 (Iqaluit 2010, Xiao et al. 2012a). Median TBB and TBPH levels were found to be 0.46 pg/m3 (range of 0.16 to 2.2 pg/m3) and 0.69 pg/m3 (range of 0.1 to 1.5 pg/m3), respectively (Xiao et al. 2012a). This study suggests that TBB and TBPH may have the potential for long-range transport.
7.2 Water
TBB and TBPH were measured in a preliminary study at open lake sites in Lake Ontario at mean concentrations of 0.8 and 2.2 pg/L, respectively, whereas only TBPH was detected in open lake sites in Lake Erie, at a mean concentration of 1.51 pg/L (Muir et al. 2011). Venier et al. (2014) also reported concentrations of TBB and TBPH in the Great Lakes from an approximately equal number of open lake and near shore sampling locations, for samples collected from 2011 to 2012 (n=5). Concentrations of TBB and TBPH were highest in Lake Ontario (mean of 7.9 and 0.27 pg/L, respectively) and Lake Erie (mean of 5.6 and 10.4 pg/L, respectively). Valls-Cantenys et al. (2013) measured TBPH in a Spanish river at a mean concentration of 2200 pg/L, while TBB was not detected.
7.3 Sediment and soil
Mean sediment concentrations of TBB and TBPH were reported in the Yadkin River, North Carolina, at the outfall of a textile wastewater treatment plant, as 3850 ng/g TOC and 19200 ng/g TOC, respectively. Neither compound was detected upstream of the plant, and concentrations were negatively correlated with distance downstream (La Guardia et al. 2012). La Guardia et al. (2013) also reported mean sediment concentrations of TBB and TBPH in Durban Bay, South Africa of 545 ng/g TOC and 96 ng/g TOC respectively.
Pelletier et al. (2013) reported the highest sediment concentrations from Canadian sites in central Lake Ontario sediment core samples, collected in 2012. The maximum sediment concentrations for TBB and TBPH were 2.40 ng/g dry weight (dw) and 1.17 ng/g dw, respectively. Both compounds were detected in the single sample reported for Lake Erie sediment (Pelletier et al. 2013). Sediment concentrations of TBB and TBPH are further discussed in the Health Section (section 10.1.1.1).
No published studies were identified which attempted to measure concentrations of TBB or TBPH in Canadian soil.
7.4 Wastewater and biosolids
Concentrations of TBB and TBPH were measured in Ontario wastewater samples by Zhou et al. (2010a). TBB was detected in all samples, at concentrations ranging from approximately 4 to 30 ng/L, while TBPH was detected in only one sample at a concentration of approximately 2 ng/L (Zhou et al. 2010a). TBB and TBPH were among analytes measured in influent, effluent, and biosolids samples collected over three years (2013 to 2015) from eight Canadian wastewater treatment systems representing a variety of treatment types (Shanmuganathan et al. 2016). Detection frequencies for TBB and TBPH were over 80% for influent and biosolids samples. Concentrations of TBB ranged from 11 to 477 ng/L and non-detect to 29 ng/L in influent and effluent samples, while concentrations of TBPH in these samples ranged from 0.4 to 326 ng/L and non-detect to 44 ng/L, respectively. TBB and TBPH concentrations in biosolids ranged from 5 to 1227 ng/g dw and 56 to 1820 ng/g dw respectively (Shanmuganathan et al. 2016). Mean concentrations in biosolids were also reported for TBB and TBPH to range from non-detect to 2491 ng/g dw and from 273 to 1340 ng/g dw, respectively, from a large secondary wastewater treatment plant in California (Davis et al. 2012).
| Medium | Location; year | TBB concentration (detection frequency) | TBPH concentration (detection frequency) | Unit | Reference |
|---|---|---|---|---|---|
| Air | Point Petre, Canada; 2008-2010 | 0.074 – 0.82 (16%) | 0.18 – 3.7 (53%) | pg/m3 | Ma et al. 2012 |
| Air | Sleeping Bear, USA; 2008-2010 | 0.086 – 7.5 (24%) | 0.11 – 16 (49%) | pg/m3 | Ma et al. 2012 |
| Air | Eagle Harbor, USA; 2008-2010 | 0.05 – 6.6 (60%) | 0.13 – 32 (61%) | pg/m3 | Ma et al. 2012 |
| Air | Sturgeon Point, USA; 2008-2010 | 0.11 – 4.1 (36%) | 0.14 – 17 (73%) | pg/m3 | Ma et al. 2012 |
| Air | Cleveland, USA; 2008-2010 | 0.5 – 55 (66%) | 0.47 – 290 (99%) | pg/m3 | Ma et al. 2012 |
| Air | Chicago, USA; 2008-2010 | 0.5 – 19 (90%) | 0.36 – 76 (93%) | pg/m3 | Ma et al. 2012 |
| Air | Alert, Canada; 2007-2008 | 0.00 – 14.42; 1.06 | 0.01 – 3.38; 0.46 | pg/m3 | Xiao et al. 2012a; Xiao et al. 2012b |
| Air | Toronto, Canada; 2010-2011 | ND – 1.87 (96%) | ND – 1.07 (87%) | pg/m3 | Shoeib et al. 2014 |
| Air | Toronto, Canada; 2010-2011 | 3.2 (100%) | 2.5 (100%) | pg/m3 | Diamond et al. 2013 |
| Water | Lake Erie; 2005-2010 | ND | 1.51 | pg/L | Muir et al. 2011 |
| Water | Lake Ontario; 2005-2010 | 0.80 | 2.2 | pg/L | Muir et al. 2011 |
| Water | Lake Erie; 2012 | 5.6 | 10.4 | pg/L | Venier et al. 2014 |
| Water | Lake Huron; 2012 | 1.3 | 4.5 | pg/L | Venier et al. 2014 |
| Water | Lake Michigan; 2012 | 2.6 | 2.6 | pg/L | Venier et al. 2014 |
| Water | Lake Ontario; 2011 | 7.9 | 0.27 | pg/L | Venier et al. 2014 |
| Water | Lake Superior; 2011 | 1.4 | 3.0 | pg/L | Venier et al. 2014 |
| Water | Ria, Spain | ND | 1300 | pg/L | Valls-Cantenys et al. 2013 |
| Water | River, Spain | ND | 2200 | pg/L | Valls-Cantenys et al. 2013 |
| Sediment | North Carolina, USA | ND – 3850 | ND – 19200 | ng/g TOC | La Guardia et al. 2012 |
| Sediment | Lake Saint-Pierre; 2012 | ND – 0.10 (40%) | NQ – 0.18 (100%) | ng/g dw | Pelletier et al. 2013 |
| Sediment | Lake Ontario; 2012 | ND – 2.40 (38%) | ND – 1.17 (94%) | ng/g dw | Pelletier et al. 2013 |
| Sediment | Lake Erie; 2012 | 0.18 (100%) | 0.22 (100%) | ng/g dw | Pelletier et al. 2013 |
| Sediment | Pacific Watershed, Canada; 2012 | ND – NQ (33%) | NQ (100%) | ng/g dw | Pelletier et al. 2013 |
| Sediment | Atlantic Sector, Canada; 2012 | ND – 0.35 (33%) | NQ – 0.13 (100%) | ng/g dw | Pelletier et al. 2013 |
| Sediment | Durban Bay, South Africa; 2011 | 545 (91%) | 96 (60%) | ng/g TOC | La Guardia et al. 2013 |
| Suspended sediment | Montreal; 2012 | ND – 0.11 (27%) | ND – 0.17 (40%) | ng/g dw | Pelletier et al. 2013 |
a Concentrations are presented as ranges or arithmetic means. ND = not detected; NQ = below limit of quantification; TOC = total organic carbon; dw = dry weight.
7.5 Biota
TBB and TBPH concentrations were measured in European starling (Sturnus vulgaris) eggs collected between 2009 and 2011 from landfill and industrial sites in five provinces, as well as from sites located 10 km and 40 km from urban centres, all within Canada. TBB was not detected in samples collected in 2009 and was therefore not examined further in the study. Among all of the sites sampled, the highest median (2.2 ng/g ww) and maximum (26 ng/g ww) concentrations of TBPH were found in eggs from landfills serving Vancouver and Montreal respectively (Chen et al. 2013).
TBB and TBPH were determined in ring-billed gulls (Larus delawarensis) collected from Deslauriers Island in 2010 (Gentes et al. 2012). Although neither substance was detected in plasma samples, TBB and TBPH were detected in 11% and 89% of liver samples, with maximum concentrations of 1.55 ng/g ww and 17.6 ng/g ww respectively (Gentes et al. 2012).
TBPH was measured in peregrine falcon (Falco peregrinis) eggs, being detected in a third of the eggs collected from Canadian sites at concentrations up to 4.5 ng/g ww (Guerra et al. 2012).
TBB and TBPH were detected in 32% and 18% fish samples from the Great Lakes and two additional lakes in Ontario, respectively. TBB concentrations ranged from 0.011 to 0.041 ng/g, while TBPH concentrations ranged from 0.044 to 0.078 ng/g (unspecified weight basis) (Zhou et al. 2010b). In a more recent study by Houde et al., TBPH was detected in northern pike (Esox lucius) and muskellunge (Esox masquinongy) liver samples from the St. Lawrence River and tributaries, whereas TBB was not detected (Houde et al. 2014).
Concentrations of TBB and TBPH were determined in blubber samples collected from Indo-Pacific humpback dolphins (Sousa chinensis) and finless porpoises (Neophocaena phocaenoides) in the Pearl River Delta, China. Mean concentrations of TBB and TBPH were determined as less than 0.04 ng/g lw (lipid weight) and 0.51 ng/g lw in the dolphin samples, and 5.6 ng/g lw and 342 ng/g lw in the porpoise samples, respectively (Lam et al. 2009). However, these values should not necessarily be interpreted as steady state concentrations, as the majority of animals from which samples were taken were found in advanced states of decomposition. In a more recent study by the same primary authors, the concentration of TBB had increased above the detection limit in dolphin samples, but the reported concentrations of both compounds in porpoises were substantially lower. In the newer study, mean concentrations of TBB and TBPH were determined as 0.186 ng/g lw and 0.517 ng/g lw in the dolphin samples, and 0.0907 ng/g lw and 0.098 ng/g lw in the porpoise samples, respectively (Zhu et al. 2014).
TBPH was detected in muscle tissue of juvenile European eels (Anguilla anguilla) collected from the Vida river near the Danish-German border at a mean concentration of 7.4 ng/g lw (Sühring et al. 2013).
Samples were analyzed from seven different species (one fish, three mammals, and three birds) from the Norwegian Arctic for TBB and TBPH. TBB was detected in all seven Arctic species, while TBPH was detected in only five of the seven species. The detection percentage for TBB was higher than that for TBPH in the species in which both were found. TBB was detected in 90% of polar bear (Ursus maritimus) plasma samples at a mean concentration of 3.46 ng/g ww. The remaining species-specific results are provided in Table 7‑2 (Sagerup et al. 2010).
Finally, TBB and TBPH were determined in both a native mollusk (Elimia proxima) and an invasive mollusk (Corbicula fluminea) at the outfall of a textile wastewater treatment plant on the Yadkin River, North Carolina, USA, and at a series of distances downstream. The maximum measurements presented in Table 7‑2 correspond to the outfall, with lower concentrations and non-detects (less than 1 ng/g lw) reported downstream (16.8 to 44.6 km) (La Guardia et al. 2012).
| Organism; tissue | Location; year | TBB concentration (detection frequency) | TBPH concentration (detection frequency) | Reference |
|---|---|---|---|---|
| Ring-billed gull; liver | Deslauriers Island, Canada; 2010 | ND – 1.5 ng/g ww (11%) | ND – 17.6 ng/g ww (89%) | Gentes et al. 2012 |
| European starling; egg pool homogenate | Twenty-one sites across Canada, including landfills, industrial sites, and sites 10km and 40km from urban centres; 2009-2011 | ND | ND – 26 ng/g ww (47%) | Chen et al. 2013 |
| Peregrine falcon; egg | Toronto and Montreal; 2007-2009 | ND | ND – 4.5 ng/g ww (33%) | Guerra et al. 2012 |
| Fish (unspecified); unspecified | Great Lakes and two additional lakes in Ontario; unspecified | ND – 0.041 ng/g; 0.029 ng/g (unspecified weight basis) (18%) | ND – 0.078 ng/g; 0.060 ng/g (unspecified weight basis) (18%) | Zhou et al. 2010b |
| Northern pike; liver | St. Lawrence River and tributaries; 2008-2012 | ND | 5.4 ng/g lw (64%) | Houde et al. 2014 |
| Muskellunge; liver | St. Lawrence River and tributaries; 2008-2012 | ND | ND – 13 ng/g lw (40%) | Houde et al. 2014 |
| Yellow perch; whole fish homogenate | St. Lawrence River and tributaries; 2008-2012 | ND | ND | Houde et al. 2014 |
| European eel (elvers); muscle | Vida River, Danish/German border; unspecified | NA | 0.10 ng/g ww | Suhring et al. 2013 |
| Capelin; whole fish | Svalbard, Norway; 2009 | 0.378 ng/g ww (100%) | 0.719 ng/g ww (90%) | Sagerup et al. 2010 |
| Common eider; liver | Svalbard, Norway; 2009 | 0.862 ng/g ww (100%) | 1.652 ng/g ww (60%) | Sagerup et al. 2010 |
| Black-legged kittiwake; liver | Svalbard, Norway; 2009 | 0.732 ng/g ww (90%) | 1.799 ng/g ww (70%) | Sagerup et al. 2010 |
| Brunnich’s guillemot; egg | Svalbard, Norway; 2008 | 1.213 ng/g ww (90%) | 1.799 ng/g ww (70%) | Sagerup et al. 2010 |
| Ringed seal; liver | Svalbard, Norway; 2007 | 0.435 ng/g ww (100%) | 0.573 ng/g ww (60%) | Sagerup et al. 2010 |
| Arctic fox; liver | Svalbard, Norway; 2007-2008 | 0.975 ng/g ww (90%) | ND | Sagerup et al. 2010 |
| Polar bear; plasma | Svalbard, Norway; 2008 | 3.640 ng/g ww (90%) | ND | Sagerup et al. 2010 |
| Perch; muscle | Finland and Sweden; 2009 | ND – 0.022 ng/g ww (63%) | ND – 0.46 ng/g ww (88%) | TemaNord 2011 |
| Arctic char; muscle | Faroe Islands; 2009 | 0.0031 ng/g dw (100%) | 0.011 ng/g dw (100%) | TemaNord 2011 |
| Atlantic cod; liver | Faroe Islands, Iceland, Norway; 2005-2009 | ND – 0.12 ng/g ww (20%) | ND – 0.2 ng/g fw (40%) | TemaNord 2011 |
| Blue mussels | Iceland, Norway; 2009 | 0.0041 – 0.0049 ng/g ww (100%) | 0.009 – 0.057 ng/g ww (100%) | TemaNord 2011 |
| Crab | Norway | ND | ND | DNV 2010 |
| Mussels | Norway | ND | ND | DNV 2010 |
| Indo-Pacific humpback dolphin; blubber | Pearl River Delta, China; 2002-2007 | ND | ND – 5.3 ng/g lw | Lam et al. 2009 |
| Finless porpoise; blubber | Pearl River Delta, China; 2003-2008 | ND – 70 ng/g lw | ND – 3859 ng/g lw | Lam et al. 2009 |
| Indo-Pacific humpback dolphin; blubber | Pearl River Delta, China; 2003-2011 | 0.0614 – 0.64 ng/g lw (100%) | ND – 7.55 ng/g lw (83%) | Zhu et al. 2014 |
| Finless porpoise; blubber | Pearl River Delta, China; 2003-2012 | ND – 0.219 ng/g lw (>80%) | ND – 1.06 ng/g lw (>80%) | Zhu et al. 2014 |
| Invasive mollusk | Yadkin River, USA; 2009 | ND – 2200 ng/g lw | ND – 1370 ng/g lw | La Guardia et al. 2012 |
| Native mollusk | Yadkin River, USA; 2009 | ND – 1740 ng/g lw | ND – 380 ng/g lw | La Guardia et al. 2012 |
a Concentrations are presented as ranges or arithmetic means. ND = not detected; NA = not analyzed; ww = wet weight; dw = dry weight; lw = lipid weight.
8. Environmental fate and behaviour
8.1 Environmental distribution
Level III fugacity modelling (EQC 2003) simulates the distribution of a substance in a hypothetical, evaluative environment known as the “unit world.” The EQC model simulates the environmental distribution of a chemical at a regional scale (i.e., 100 000 km2) and outputs the fraction of the total mass in each compartment from an emission into the unit world and the resulting concentration in each compartment. Environment Canada uses only the mass-fraction distribution results for general information on environmental fate of a substance and generally does not use the compartmental concentrations results for the predicted environmental concentration (PEC) in a substance assessment. Some exceptions to this may occur (e.g., when a wide dispersive release of a substance suggests that regional scale concentrations are appropriate for the PEC(s)).
The mass-fraction distributions of TBB and TBPH are given in Table 8‑1 and Table 8‑2 respectively, using individual steady-state emissions to air, water and soil. The Level III EQC model assumes non-equilibrium conditions between environmental compartments, but equilibrium within compartments. The results represent the net effect of chemical partitioning, inter-media transport, and loss by both advection (out of the modelled region) and degradation/transformation processes.
Generally, the results of Level III fugacity modelling show that TBB and TBPH are expected to predominantly reside in soil or sediment, depending on the compartment of release, with a modest fraction present in water (Table 8‑1 and Table 8‑2). In parameterizing the EQC model, reaction half-lives for water, soil, and sediment were set to “negligible,” while atmospheric oxidation model outputs (AOPWIN) were input as air reaction half-lives (see section 8.2).
| Substances released to: | Air (%) | Water (%) | Soil (%) | Sediment (%) |
|---|---|---|---|---|
| Air (100%) | 0.0457 | 0.0289 | 99.3 | 0.592 |
| Water (100%) | Negligible | 4.35 | 6.45 | 89.2 |
| Soil (100%) | Negligible | 0.0123 | 99.7 | 0.252 |
| Substances released to: | Air (%) | Water (%) | Soil (%) | Sediment (%) |
|---|---|---|---|---|
| Air (100%) | Negligible | Negligible | 99.6 | 0.400 |
| Water (100%) | Negligible | 1.01 | 0.372 | 98.6 |
| Soil (100%) | Negligible | Negligible | 99.7 | 0.344 |
The low vapour pressure of both TBB and TBPH (3.02 × 10⁻⁶ Pa and 1.29 × 10⁻⁹ Pa, respectively), high partition coefficients (log Kow of 7.71 and 10.10, and log Koc of 5.12 and 6.38, respectively), and persistence suggest that when released to the environment, these compounds will be less likely to partition to or remain in air, with small fractions remaining in water.
If released to air, very small fractions (less than 0.1%) of TBB and TBPH will remain in air, with most of the substance being deposited from air to soil and water with further partitioning to the sediment compartment. However, on the basis of measured air concentrations in the Canadian North with no known appreciable local sources, the small masses of TBB and TBPH that remain in air have the potential for long-range transport. Some organic flame retardants, such as certain polybrominated diphenyl ethers (PBDEs), are known or strongly suspected to undergo long-range transport in air associated with fine suspended particulates (e.g. Breivik et al. 2006, Gouin et al. 2006). Results from AEROWIN suggest that ~40 to 80% of the TBB and 99 to 100% of the TBPH fractions released to air will be associated with the particulate phase largely because of high estimated log Koa values (AEROWIN 2010). The OECD POPs screening model provides similar results for the fraction of chemical in air bound to aerosol particles: 0.65 and 1.00 for TBB and TBPH, respectively (OECD 2009a). Characteristic travel distances (CTD) predicted by the OECD POPs model for TBB and TBPH were 580 km and 2850 km, respectively (OECD 2009a).
When released to water, the high partition coefficients (Kow and Koc) suggest that TBB and TBPH primarily adsorb to the organic fraction of suspended solids and sediments. Relatively small (less than 5%) fractions may remain in water and are likely persistent (see following section). Given the high estimated log Koc values, once adsorbed to the sediment, TBB and TBPH are not expected to be mobile, and may remain in this compartment with little degradation.
According to the estimated log Koc values, TBB and TBPH are expected to be relatively immobile if released to the soil compartment. Low vapour pressures indicate that minimal volatilization from dry soil surfaces should occur. As with sediment, little degradation is expected in soil, and thus overall transfer of TBB and TBPH out of the soil compartment is expected to be minimal.
Overall, the physical-chemical properties and results of Level III fugacity modelling (Table 8‑1 and Table 8‑2) support the expectation that TBB and TBPH will predominantly reside in soil or sediment, depending on the compartment of release (EQC 2003).
8.2 Environmental persistence
Considering the likely releases, predicted partitioning characteristics, and the measured environmental concentrations of TBB and TBPH, environmental persistence will be considered in all media compartments. In order to provide the best possible weight of evidence for persistence of TBB and TBPH, empirical and modelled data are considered. Relevant transformation processes for TBB and TBPH include hydrolysis, photodegradation, and biodegradation (catabolism).
Consideration of the empirical lines of evidence for hydrolysis, photodegradation, and biodegradation gives an overall expectation for persistent behaviour of TBB and TBPH in the environment. The empirical abiotic hydrolysis data corroborates with the notion of slow hydrolysis owing to its steric hindrance and sparing water solubility. Photodegradation was only directly studied in hydrogen atom donating organic solvents as opposed to a more environmentally relevant system. However, in amended sediment mesocosm studies, shorter dissipation time (DT50) values in the particulate phase versus sediment phase may be at least partially explained by the increased light exposure received by the particulate phase. The empirical data also suggests an overall low biodegradation potential of TBB and TBPH. Generally, model predictions neither fully support nor refute the empirical findings that biodegradation of TBB and TBPH is limited. Considering all lines of evidence, these compounds are expected to be persistent in water, soil, and sediment.
Table 8‑3, Table 8‑4, and Table 8‑5 present empirical and modelled degradation data for TBB and TBPH.
8.2.1 Abiotic degradation
Consideration of the chemical structures of TBB and TBPH suggests that abiotic hydrolysis of the ester groups may be favourable for these compounds owing to the electron withdrawing character of multiple bromine substitutions on the aromatic ring. Conversely, steric effects from the branched ester substituents and sparing solubility of both compounds in water are suggestive of slow hydrolysis reactions. Empirical data pertaining to a commercial mixture of TBB and TBPH shows that the hydrolysis reaction is in fact slow. An abiotic hydrolysis study found no measurable hydrolysis of the TBB/TBPH mixture at pH 4, 7, or 9 and 50°C. According to the criteria stated within the test method (92/69/EEC C7), the hydrolysis half-life was concluded to be greater than 1 year at each pH value and 25°C (Great Lakes Chemical Corporation 1997b). HYDROWIN predictions of the hydrolysis half-lives of TBB and TBPH were likely underestimated. Tetrabromophenyl and 2-ethylhexyl are not available from the fragment library or otherwise cannot be considered by this model (ortho fragment positions) and are thus replaced with tribromophenyl and isobutyl respectively. These substitute fragments would contribute less to steric hindrance of the hydrolysis reaction. Furthermore, TBB and TBPH are sparingly soluble in water.
Davis et al. (2009) reported the reductive photodebromination of both TBB and TBPH under solar radiation in a series of organic solvents. The rates of degradation were slower for TBB and TBPH than for decaBDE and the nonaDBE congeners included in the study across all solvents. Dibrominated and tribrominated degradation products were observed for both TBB and TBPH, most missing both ester branches in the case of TBPH (Davis and Stapleton 2009). Although photodegradation data for TBB and TBPH in the air compartment were not identified, the observation of both particulate and gaseous phase TBB and TBPH at Alert, Nunavut suggests that photodegradation in the air compartment may be relatively slow (Xiao et al. 2012b).
Partially debrominated photodegradation products were also identified in a recent mesocosm study conducted with a TBB/TBPH commercial mixture (de Jourdan et al. 2013). Formation of TBPH degradation products was enhanced in the suspended particulate phase versus the sediment phase, consistent with greater light exposure. Estimated median dissipation time (DT50) values were reported for TBB and TBPH from the mesocosm study. The DT50 values of TBB and TBPH from the particulate phase were 9 days and 25 days respectively. The DT50 value of TBPH in the sediment compartment was reported as greater than 200 days, since the actual estimate of 9303 days carried a large uncertainty (de Jourdan et al. 2013). A DT50 value of TBB from sediment was not reported.
No empirical data are available concerning the degradation of TBB and TBPH in air. The predicted half-lives for atmospheric degradation of TBB and TBPH by reaction with the hydroxyl radical are 11.8 and 5.9 hours respectively (AOPWIN 2010). These short half-lives suggest limited long-range transport potential of gas phase TBB and TBPH, but do not preclude fine particle transport as discussed above. The ozone reaction half-life of these compounds could not be estimated since they do not contain double or triple carbon-carbon bonds.
Therefore, on the basis of the empirical and modelled abiotic degradation data for TBB and TBPH, these substances are not expected to persist in the gas phase, but may persist sorbed to fine particulates in air, and are expected to persist in the water compartment.
| Test material or modelled substance | Fate process | Medium | Degradation endpoint or prediction | Degradation value | Method | Reference |
|---|---|---|---|---|---|---|
| TBB/ TBPH Mixture | Hydrolysis | Aqueous buffers; pH 4, 7, 9 | Half-life | >1 year | 92/69/EEC C7 | Great Lakes Chemical Corporation 1997b |
| TBB | Hydrolysis | Water | Half-life | 34.1 days (pH 7); 3.4 days (pH 8) | QSAR | HYDROWIN 2010 |
| TBPH | Hydrolysis | Water | Half-life | 29.2 days (pH 7); 2.9 days (pH 8) | QSAR | HYDROWIN 2010 |
| TBB | Mesocosm | Particulate phase | Median dissipation time (DT50) | 9 days | Published study | de Jourdan et al. 2013 |
| TBPH | Mesocosm | Particulate phase | Median dissipation time (DT50) | 25 days | Published study | de Jourdan et al. 2013 |
| TBPH | Mesocosm | Sediment phase | Median dissipation time (DT50) | >200 days | Published study | de Jourdan et al. 2013 |
| TBB | Atmospheric oxidation | Air (Gas phase) | Half-life | 11.8 hours | QSAR | AOPWIN 2010 |
| TBPH | Atmospheric oxidation | Air (Gas phase) | Half-life | 5.9 hours | QSAR | AOPWIN 2010 |
| TBB | Ozone reaction | Air | N/A | N/A | QSAR | AOPWIN 2010 |
| TBPH | Ozone reaction | Air | N/A | N/A | QSAR | AOPWIN 2010 |
Abbreviations: N/A = not applicable, the model does not provide an estimate for this type of structure. QSAR = Quantitative Structure Activity Relationship.
8.2.2 Biodegradation
Empirical biodegradation studies were submitted for commercial TBPH and mixtures of TBB and TBPH. The ready biodegradability of TBPH was assessed by a modified Sturm test (OECD 301B) with an inoculated mineral salts medium. Cumulative carbon dioxide production was measured as 2 to 3% of the theoretical production, indicating that the material was not readily biodegradable (Pennwalt Corporation 1989a). The ready biodegradation of a commercial mixture of TBB and TBPH was determined by a closed bottle test (OECD 301D), and was found to be less than 6% within 28 days (Great Lakes Chemical Corporation 1998a). Assuming first-order kinetics, half-lives from these data can be calculated by rearranging the integrated rate law for k and substituting into the expression for half-life. The resulting half-lives are approximately 600 to 1000 days for TBPH, and 300 days for TBB/TBPH mixture. The inocula in both of the above studies were collected from presumably local wastewater treatment plants treating primarily domestic wastewater. Appropriate controls showed the inocula were viable and the test material was not inhibitory in either test.
A shake flask die-away test (OPPTS 835.3170) was also performed on a commercial mixture of TBB and TBPH (Great Lakes Chemical Corporation 2003a). This study found degradation half-lives of 3.5 days and 8.5 days in active water and active sediment, respectively. According to the details of the RP-HPLC/MS methodology, it is likely that only TBB was analyzed in this study, and thus only one half-life is attributed to the mixture test material for each compartment. No reason is provided in the study for this observation. On the basis of physical-chemical properties and degradation modeling, TBPH is expected to degrade more slowly than TBB, and thus, this result may be considered a best case for TBPH in terms of biodegradation potential. Whereas the ready biodegradation tests used either no solvent, or the solvent (chloroform) was evaporated to dryness before commencing the test, the shake flask die-away protocol was amended to employ methanol as a co-solvent. Methanol may have facilitated availability for biodegradation, and was also demonstrated by Davis and Stapleton (2009) to be a good hydrogen atom donating solvent for photodegradation of TBB and TBPH (Davis and Stapleton 2009). Photolysis is a potential explanation for approximately one third of the test material degrading in the sterile controls in this experiment.
A porous pot simulation of wastewater treatment (OECD 303A, OPPTS 835.3220) was also conducted for a mixture of TBB and TBPH (Great Lakes Chemical Corporation 2002). The measured concentration (of TBB only, as above) associated with activated sludge at the conclusion of the 21-day test period was 111% of the nominally dosed concentration, indicating no biodegradation. Again, this result was considered to represent a best case for TBPH.
Biodegradation models were also used to contribute to the weight of evidence regarding environmental persistence. Biodegradation was also modelled using BIOWIN 2010 and CATALOGIC 2013. The results are partially consistent with the empirical degradation data. BIOWIN sub-model 4 predicts primary degradation to be more rapid for TBPH than for TBB. BIOWIN sub-models predict a low potential for ultimate biodegradation of both compounds, whereas CATALOGIC predicts biological oxygen demand percentages which neither overtly support nor refute persistent behaviour. The CATALOGIC model (2013) recognized 52% and 75% of the fragments of TBB and TBPH respectively, and concluded that neither substance was within the structural domain of the model, therefore the results should be used with caution. CATALOGIC predicted ester hydrolysis as the most likely initial transformation for both substances, with partial debromination to 3,4,5-tribromobenzoic acid and 4,5-dibromophthalic acid as the most stable transformation products for TBB and TBPH respectively. These transformation products are considered further in Appendix C. The mixed biodegradation modeling results are not surprising as these compounds contain structural features that are typically associated with biodegradability, namely esters, but also feature steric hindrance around the esters, sparing water solubility, and strong adsorption to solids, that would be expected to significantly slow biodegradation.
| Test material or modelled substance | Medium | Degradation endpoint or prediction | Degradation value | Method | Reference |
|---|---|---|---|---|---|
| TBPH | Inoculated mineral salts medium | 28-day degradation | 2-3% | OECD 301B; 92/69/EEC C5 | Pennwalt Corporation 1989a |
| TBB/ TBPH Mixture | Inoculated mineral salts medium | 28-day degradation | 6% | OECD 301D; 92/69/EEC C4 | Great Lakes Chemical Corporation 1998a |
| TBB/ TBPH Mixture | Active water | Primary degradation half-life | 3.5 days | OPPTS 835.3170 | Great Lakes Chemical Corporation 2003a |
| TBB/ TBPH Mixture | Active sediment | Primary degradation half-life | 8.5 days | OPPTS 835.3170 | Great Lakes Chemical Corporation 2003a |
| Fate Process | Test method or model basis | TBB Model result and prediction | TBPH Model result and prediction | Reference |
|---|---|---|---|---|
| Primary Bio-degradation (aerobic) | Sub-model 4: Expert Survey | 2.94a (biodegrades slowly) | 3.21a (biodegrades quickly) | BIOWIN 2010 |
| Ultimate Bio-degradation (aerobic) | Sub-model 3: Expert Survey | 1.89a (biodegrades slowly) | 1.97a (biodegrades slowly) | BIOWIN 2010 |
| Ultimate Bio-degradation (aerobic) | Sub-model 5: MITI linear probability | 0.29b (biodegrades slowly) | 0.36b (biodegrades quickly) | BIOWIN 2010 |
| Ultimate Bio-degradation (aerobic) | Sub-model 6: MITI non-linear probability | 0.06b (biodegrades very slowly) | 0.06b (biodegrades very slowly) | BIOWIN 2010 |
| Ultimate Bio-degradation (aerobic) | % BOD | 35 | 42 | Catalogic 2013 |
Abbreviations: BOD = Biological Oxygen Demand.
a Output is a numerical score from 0 to 5.
b Output is a probability score.
8.3 Potential for bioaccumulation
The discussion on the potential for bioaccumulation examines several parameters, including physical chemical properties, bioconcentration factor (BCF), biomagnification factor (BMF), trophic magnification factor (TMF), and bioaccumulation factor (BAF). The role of metabolic biotransformation in determining bioaccumulation potential is also discussed. Empirical data and model results were considered for evaluation of the bioaccumulation potential of TBB. Only empirical data are presented for TBPH as the modelled log Kow value of 10.10 resides outside the domain of available bioaccumulation models and empirical bioaccumulation data. Modelled log Kow values of 7.71 and 10.10 for TBB and TBPH respectively, suggest that TBB has a high potential to bioaccumulate in biota, while TBPH has a low potential to bioaccumulate. In addition to log Kow, the log Koa values of 11.34 and 15.03 for TBB and TBPH respectively suggest that given a terrestrial dietary exposure, these compounds will have the potential to biomagnify in terrestrial food webs as suggested by Gobas et al. (2003) and Kelly et al. (2007). However, the use of log Kow and log Koa are not sufficient evidence, by themselves, to determine bioaccumulation potential as these are simply partition coefficients and do not account for physiological parameters, such as biotransformation. Metabolic biotransformation is in fact a significant consideration for TBB and TBPH. Observations made in the submitted empirical data, and in the open literature, including specific in vitro metabolism studies, were considered in a weight-of-evidence approach to evaluate the bioaccumulation characteristics of TBB and TBPH (ECCC 2013 to2014, Bearr et al. 2010, Sagerup et al. 2010, Bearr et al. 2012, de Jourdan et al. 2012, La Guardia et al. 2012, Roberts et al. 2012, de Jourdan et al. 2014).
While the physical chemical properties suggest potential for bioaccumulation of TBB, in considering the overall weight of evidence, this is substantially outweighed by the published mesocosm and feeding studies with fathead minnows, in vitro examinations of metabolic biotransformation, and general absence of increased concentrations in predator-prey relationships in biota monitoring data. These lines of evidence point to limited bioaccumulation potential. Although exposure via gills may be less important for these poorly water soluble substances, an empirical bioconcentration factor also suggests limited bioaccumulation.
The physical-chemical properties (log Kow and steric factors), mesocosm studies, and feeding studies suggest a limited bioaccumulation potential for TBPH, although in general, this may be less due to metabolic biotransformation than in the case of TBB. Bioaccumulation of TBPH was not modelled as the estimated log Kow value of 10.10 exceeds the domain of the models used to estimate bioconcentration and bioaccumulation potential (see ECCC 2018).
8.3.1 Bioconcentration factor (BCF)/Bioaccumulation factor (BAF)
A flow-through bioconcentration test (OECD 305) was submitted for a commercial mixture of TBB and TBPH (NICNAS 2004; Great Lakes Chemical Corporation 2003b). In this study, juvenile rainbow trout were exposed to measured concentrations of 0.96 μg/L or 8.9 μg/L, with the inclusion of N,N-dimethylformamide as a co-solvent (not exceeding 0.01%). Measured tissue concentrations in the 0.96 μg/L exposure group were almost all below the limit of quantification for both the uptake and depuration phases, thereby making analysis of these data unreliable. The higher exposure concentration of 8.9 μg/L is above the quantification limit, but on the same order of magnitude as the predicted solubility of TBB. Both exposure concentrations are much higher than the predicted solubility of TBPH. On the basis of the analytical chemistry methodology, TBPH does not appear to have been considered as a component of the mixture in this study. The analytical determination by HPLC/MS employed selective ion monitoring (negative mode) at 485 and 487 amu, which is more likely to correspond to TBB [M-Br+O]- (Zhou et al. 2010b). Consistent with this, only a single peak is shown in the representative chromatograms for matrix fortification, water, and tissue measurements, despite the differences in hydrophobicity that should make TBB and TBPH easily resolvable by HPLC. The study did not attempt to identify or quantify potential metabolites.
The steady-state BCF values for the higher concentration exposure group were reported as 1.74 L/kg, 2.27 L/kg, and 2.02 L/kg for edible tissue, non-edible tissue, and whole fish respectively. For this exposure group, the average edible tissue concentration increased throughout the five-week uptake phase. However, steady-state was stated to be achieved in both edible and non-edible tissues by Day 4, as the trend was not statistically significant. The time to steady-state was in fact probably longer than four days, as during the depuration phase, 50% clearance was reached in approximately one week (Great Lakes Chemical Corporation 2003b). The seemingly rapid depuration resonates with other published studies (Bearr et al. 2012, de Jourdan et al. 2012, de Jourdan et al. 2013). Despite the lack of consideration for both components of the mixture, the results of this study nevertheless provide support for a limited potential for bioconcentration for TBB. From physical and chemical property values (such as log Kow and effective molecular size), TBB would be expected to show a larger potential for bioaccumulation than TBPH. Conversely, data will be presented that suggest TBB may be more readily metabolized than TBPH.
| Test material | Test organism | Experimental concentration (duration) | Steady State BCF (L/kg) | Reference |
|---|---|---|---|---|
| TBB/ TBPH Mixture (Only TBB analyzed) | Rainbow trout (Oncorhynchus mykiss) | 8.9 μg/L (60 days) | 1.74 (edible); 2.27 (non-edible); 2.02 (whole fish) | Great Lakes Chemical Corporation 2003b |
Recent investigations relating fish BCF data and molecular size parameters (Dimitrov et al. 2005, Sakuratani et al. 2008) suggest that the probability of a molecule crossing gill cell membranes as a result of passive diffusion declines significantly with increasing maximum diameter (Dmax). Based on the 3D analysis of conformers calculated using the BCFmax Model with Mitigating Factors (Dimitrov et al. 2005), the maximum diameters of TBB and TBPH are 1.5 nm and 1.7 nm, and the effective diameters are 1.0 nm and 1.3 nm, respectively. In comparison with the thresholds proposed by Dimitrov et al. (2005), this suggests that TBB and TBPH may experience somewhat restricted uptake from steric effects at the gill surface. This may partly explain the low observed empirical BCF values, in conjunction with metabolism of the TBB and TBPH uptake.
Empirical measures of BAF were not identified. However, La Guardia et al. determined biota-sediment accumulation factors (BSAF) in a bivalve species (Corbicula fluminea) and gastropod (Elimia proxima) at the outfall of a textile wastewater treatment plant (TBB and TBPH) and at varying distances downstream (only TBPH was detected in downstream sediments). For TBB, log BSAF values were approximately -0.24 and -0.34 for the bivalve and gastropod respectively at the outfall. For TBPH, log BSAF values ranged from -1.73 to -1.15 for the bivalve, and from -1.74 to -1.55 for the gastropod, respectively. The order of magnitude difference in BSAF values was concluded to reflect the reduced bioavailability of TBPH inferred from the physical-chemical properties (La Guardia et al. 2012).
8.3.2 Biomagnification factor (BMF) and trophic magnification factor (TMF)
A BMF exceeding 1 indicates that biomagnification is potentially occurring, which may be considered an indicator of the potential for uptake and accumulation in biota, and are considered in the overall weight of evidence.
Bearr et al. (2010) examined bioaccumulation in fathead minnows of TBB/TBPH and TBB/TBPH/Organophosphate mixtures received through amended feed. Lipid concentrations of TBB and TBPH in the minnows after approximately two months of feeding were both significantly different from the control, but it is not clear if steady state was reached. The greatest whole fish concentrations measured accounted for only 0.59% and 0.19% respectively of the daily dietary exposure, indicating low biomagnification potential for these compounds. Direct elimination is a possibility, but the detection of metabolites in this study indicates that the compounds indeed have some bioavailability and were taken into the organisms (Bearr et al. 2010).
The available biomagnification data do not provide kinetic data (e.g. dietary assimilation efficiency, or elimination rates), although from KOW it can be reasonably presumed that dietary assimilation is low (Kelly et al. 2004). Although limited to a single study, the available biomagnification data suggest that the BMFs for TBB and TBPH do not exceed 1.
The TMF is a measure of the biomagnification potential of a substance within a studied food web under field conditions, and is estimated by correlating the normalized substance concentrations in biota at different trophic levels. No TMF values were available for TBB or TBPH at the time of this analysis. However, environmental monitoring conducted by Sagerup et al. (2010) in Svalbard, Norway was, for the most part, not supportive of a potential for biomagnification across trophic levels within Arctic food webs. The mean lipid normalized TBB concentration in polar bears (Ursus maritimus) was indeed an order of magnitude higher than that of their most relevant prey, the ringed seal (Phoca hispida). However, the comparison of plasma concentrations from polar bears to egg, liver, or whole body concentrations in prey organisms carries some uncertainty. No such increases in TBB concentration were observed in other predator-prey relationships among the measured organisms in the study. For example, there was no increase between capelin (Mallotus villosus) and three of its predators: Brunnich’s guillemot (Uria lomvia), kittiwake (Rissa tridactyla), and the ringed seal. Levels were also not elevated in Arctic foxes (Vulpes lagopus), which feed from both the marine and terrestrial food web, and occasionally consume ringed seal remains left by polar bears. Mean lipid normalized concentrations of TBPH were all lower in the guillemot, kittiwake, and ringed seal compared to capelin. These biota concentrations are summarized in Table 7‑2.
8.3.3 Other bioaccumulation-related studies
Accumulation and transformation of TBB and TBPH in fathead minnows were recently examined by de Jourdan et al. (2012, 2014) in an amended sediment mesocosm study. Sediment in the mesocosms received a nominal loading of 500 ng/g of TBB/TBPH mixture, and growth adjusted concentrations of both TBB and TBPH in the fish were measured at 7, 14, 28, and 42 days. Several brominated transformation products were identified (although data was either not shown, or a limited response was reported), and the authors concluded that overall accumulation of TBB and TBPH was inconsistent and limited (de Jourdan et al. 2012, de Jourdan et al. 2014).
Bearr et al. (2012) studied in vitro metabolism of TBB and TBPH in fathead minnow, common carp, mouse, and snapping turtle hepatocyte subcellular fractions. S9, cytosol, and microsome fractions were available for fish and mice, while only S9 was available for snapping turtle. Incubations of fractions containing 1 mg of protein and 300 ng of TBB/TBPH mixture were carried out for 2 hours. With the exception of snapping turtle and TBB, metabolic loss was observed for both compounds across all studied species. Metabolic rates for TBB ranged approximately from 1.5 to 3 pmol/mg/min for fish and mice. TBPH was metabolized by snapping turtle, mice and fish at approximate rates of 0.2, 0.2 to 0.3, and 0.3 to 0.6 pmol/mg/min, respectively. Assuming the substrate concentration was sufficiently large to approach maximum velocity (Vmax), allowing for a further assumption of zero order kinetics over the duration of the incubation, these results suggest in vitro metabolism half-lives of approximately 1 to 2 hours for TBB (with the exception of snapping turtles), and approximately 1.5 to 4 hours for TBPH.
Another mammalian in vitro study demonstrated that TBB, but not TBPH, was rapidly metabolized by rat liver microsomes (Roberts et al. 2012). In the same study, TBB metabolites were formed at a faster rate than TBPH metabolites by porcine carboxylesterase. In general, the literature indicates that TBPH is more resistant to metabolism than TBB, which follows from the increased steric hindrance around the ester functional groups. Specific metabolites identified for TBB include 2,3,4,5-tetrabromobenzoic acid (TBBA), which may further be metabolized to methyl 2,3,4,5-tetrabromobenzoate (M-TBB), and 2-ethylhexyl 3,4-dibromobenzoate (EH-DBB) (Bearr et al. 2012, Roberts et al. 2012). Mono(2-ethylhexyl) 3,4,5,6-tetrabromophthalate (TBMEHP) was identified as a metabolite of TBPH (Roberts et al. 2012).
8.3.4 Modelled bioaccumulation
Considering that the empirical BAF for TBB was not identified, a value was estimated using both structure-based models and a three trophic level kinetic mass-balance model. The median metabolic rate constant (kM) for TBB was first estimated as 0.1957 day-1 for a 10-g fish at 15°C using the BCFBAF kM-QSAR (BCFBAF 2010) and assuming a log Kow of 7.71. This rate constant is on the order of similar non-brominated phthalates found in the CEMC kM database (BCFBAF 2010, Arnot et al. 2008). Using this kM value, a middle trophic level probabilistic BAF value of 8446 L/kg (95% prediction interval: 1982 to 35 987 L/kg) was obtained (Arnot and Gobas 2003a, BCFBAF 2010). Default environmental characteristics (e.g., dissolved and total organic carbon both set to 0.5 mg/L) were used in the model. Considering the “dietary BAF” study described in section 8.3.2, the predicted BAF may be considered a worst-case estimate of bioaccumulation potential of TBB for the purposes of an appropriately conservative risk characterization, rather than a major line of evidence for bioaccumulation potential.
8.4 Summary of environmental fate
TBB and TBPH are expected to be released to the environment from industrial sources and manufactured items primarily through wastewater. On the basis of the physical-chemical properties, these compounds are expected to strongly sorb to solid phases in various media (e.g., biosolids, sediments, aerosols, soil). Results of Level III fugacity modelling suggest these compounds will predominantly reside in soil or sediment, depending upon the compartment of release. When released to water, small, but non-negligible fractions are predicted to remain. TBB and TBPH have been detected in all environmental compartments with the exception of soil, for which no attempts to measure in Canadian soil could be found. TBB and TBPH are expected to persist in all compartments except the gas-phase. Sorption to fine particulates, resulting in greater persistence, and consequent atmospheric transport, as has been observed for other organic flame retardants, is a potential explanation for the presence of these compounds in the Canadian North despite short predicted half-lives in the gas phase (Breivik et al. 2006, Gouin et al. 2006, Xiao et al. 2012a, Xiao et al. 2012b). Metabolites of TBB and TBPH are likely to be similarly persistent.
Toward an overall weight-of-evidence for bioaccumulation, a low bioaccumulation potential for TBB and TBPH is suggested by studies that both explicitly examine metabolism (Bearr et al. 2012, Roberts et al. 2012), and others which suggest metabolism is occurring (Bearr et al. 2010, de Jourdan et al. 2012, Great Lakes Chemical Corporation 2003b, de Jourdan et al. 2014). Modelled BAF results for TBB suggest some potential for bioaccumulation. However, when taken in conjunction with a reduced bioaccumulation potential suggested by the physical chemical properties (e.g., high log Kow in the case of TBPH and moderately large maximum diameters for both compounds), the weight of evidence suggests that these substances have a low potential to be highly bioaccumulative.
9. Potential to cause ecological harm
9.1 Ecological effects
Empirical data for TBB and TBPH were considered in the weight of evidence for evaluating ecological effects. Modelled data were also considered for TBB to supplement the weight of evidence, whereas TBPH falls outside the domain of available models (log Kow of greater than 9.0). Although the majority of TBB and TBPH released is expected to partition to soil and sediment, neither suitable toxicity data nor analogues with relevant empirical toxicity data could be identified for these compartments. However, a modest fraction of these compounds is predicted to remain in the water compartment, to which TBB and TBPH are expected to be released. Thus, available information is presented for this compartment of exposure. An equilibrium partitioning approach is used to estimate exposure in the soil and sediment compartments. Sub-lethal effects of TBB and TBPH on aqueous and avian organisms have also been examined in the open literature.
9.1.1 Empirical and modelled data for aquatic toxicity
Empirical aquatic toxicity studies were available for TBB/TBPH mixtures, as well as TBPH alone. Several pelagic trophic levels (i.e., algae, invertebrates, and fish) are represented in the available data set. However, in all studies, organisms were exposed to concentrations above the predicted solubility limits of both compounds (TBB: 2.82 x 10⁻³ mg/L; TBPH: 3.07 x 10⁻⁵ mg/L). Organic co-solvents were used in each study to enhance the solubility of TBB and TBPH, thus producing worst-case exposures. Results of these studies are summarized in Table 9‑1.
A Daphnia magna immobilization study (OECD 202) was conducted on TBPH (Pennwalt Corporation 1989b). Nominal test concentrations up to 1 mg/L were employed, with acetone as a co-solvent. Measured concentrations were presented in the study, but likely had little relation to actual water concentration (extraction with hexane and analysis in acetonitrile). The nominal and measured 48-hour EC50 values for immobile and floating daphnids were 0.34 mg/L and 0.27 mg/L respectively. Acute toxicity to rainbow trout (OECD 203) was also studied for TBPH (Pennwalt Corporation 1989c). Fish were exposed to nominal concentrations exceeding the water solubility of TBPH by up to 9 orders of magnitude, with ethanol as a co-solvent. Undissolved test material was observed at all dose levels. No mortalities were recorded, and thus the study concluded no effects at saturation.
A series of aquatic toxicity studies were also submitted for a commercial mixture of TBB and TBPH (NICNAS 2004, Great Lakes Chemical Corporation 1998b, 1998c, 1998d). This included a Daphnia magna immobilization study (OECD 202), an acute toxicity test on rainbow trout (OECD 203), and an algal growth inhibition test (OECD 201). Each of these studies employed dimethylformamide as a co-solvent and nominal exposure concentrations many orders of magnitude above the water solubility of either compound. The Daphnia magna were exposed to nominal concentrations ranging from 0.10 to 10 mg/L, while the trout and algae were each exposed to a single nominal concentration of 10 mg/L. Measured concentrations were determined by liquid-liquid extraction into dichloromethane, followed by RP-HPLC in an isocratic 98% acetonitrile mobile phase, and as above, are unlikely to represent realistic water concentrations. Furthermore, it is ambiguous as to which component of the TBB/TBPH mixture the measured concentrations correspond. In the “typical chromatogram” of the stock and fortified sample solutions, the test material is attributed to the latter eluting of two clearly resolved peaks, suggesting TBPH. However, in the calibration chromatogram, the earlier eluting peak is not present, which would otherwise suggest that the peak may be TBB while TBPH elutes off scale. No explanations are offered in the study as to the discrepancy between stock and calibration solutions. The results of the aquatic toxicity studies are presented in Table 9‑1 on the basis of the singular measured concentrations reported in the studies.
Finally, a chronic toxicity test was submitted for the cladoceran, Daphnia carinata, exposed to TBB/TBPH mixture (Lim 2003). Acetone was employed as a co-solvent at 0.02%, a level above the recommended value of 0.01% in Environment Canada’s Guidance Document on Statistical Methods for Environmental Toxicity Tests (Environment Canada 2007). This may have facilitated uptake of the test material compared to the studies above. There were no mortalities in the solvent controls. Significant mortalities were observed compared to the control treatments over 15 days. The NOEC and LOEC were 0.0625 and 0.125 mg/L respectively, based on mortality after 15 days exposure. The 15-day LC50 was calculated at 0.079 mg/L. The study also examined the number of young produced per adult, and concluded there was no significant effect of TBB/TBPH mixture on the reproductive output. At 0.125 mg/L, which resulted in 80% mortality, the survivors produced a standard amount of offspring compared to controls. All concentrations in this study were presented on a nominal basis.
| Test material | Test organism | Endpoint | Value (mg/L) | Reference |
|---|---|---|---|---|
| TBB/ TBPH Mixture | Cladoceran (Daphnia carinata) | 15d LC50 | 0.079 (nominal) | Lim 2003 |
| TBB/ TBPH Mixture | Water flea(Daphnia magna) | 48h EC50 (immobilization) | 0.42 (measured) | Great Lakes Chemical Corporation 1998b |
| TBB/ TBPH Mixture | Water flea (Daphnia magna) | 48h NOEC | 0.12 (measured) | Great Lakes Chemical Corporation 1998b |
| TBB/ TBPH Mixture | Rainbow trout (Oncorhynchus mykiss) | 96h NOEC | > 12 (measured) | Great Lakes Chemical Corporation 1998c |
| TBB/ TBPH Mixture | Algae (Selenastrum capricornutum) | 96h NOEC | > 5.1 (measured) | Great Lakes Chemical Corporation 1998d |
| TBPH | Cladoceran (Daphnia magna) | 48h EC50 (immobilization and floating) | 0.27 (measured) | Pennwalt Corporation 1989b |
| TBPH | Rainbow trout (Oncorhynchus mykiss) | 96h NOEC | > 31 (measured) | Pennwalt Corporation 1989c |
Abbreviations: LC = lethal concentration; EC = effective concentration; NOEC = no observed effect concentration.
A predicted no-effect concentration (PNEC) for water was derived from the critical toxicity value (CTV) of 0.079 mg/L (selected as the most sensitive, and only chronic value) for Daphnia carinata, by dividing this value by an assessment factor of 100. As reflected in Table 9‑1, Daphnia carinata appeared to be the most sensitive among the species for which aquatic toxicity data was available. However, given the high uncertainty regarding the validity of the measured concentrations in studies for other species, a factor of 10 was maintained to account for inter- and intra- variability in sensitivity. The assessment factor was also comprised of a factor of 10 for extrapolation from the severe endpoint mortality to sub-lethal effects. The resulting PNEC for water is 7.9 x 10⁻⁴ mg/L. This PNEC, which is approaching the water solubility limit of TBB, is assumed applicable to TBB, TBPH, and mixtures of the two.
Aquatic toxicity of TBB was also modelled with ECOSAR, whereas TBPH falls outside of the model domain. Aquatic toxicity of the observed, suggested or modelled metabolites of TBB and TBPH discussed in section 8.3.3 was also modelled. Owing to the steric hindrance associated with the 2-ethylhexyl group, the neutral organic structure activity relationship (SAR) result was considered over the ester SAR when this group was present. Predicted chronic values for TBB are lower than those for the identified metabolites, and assuming that the relative hazard can be read across, this suggests that the potential metabolites raise no independent concerns above and beyond those of the parent compounds themselves. This is in line with the arguments of Parkerton and Konkel (2000) suggesting that phthalate metabolites also contribute to the internal residue and resulting narcotic effects. It is recognized that this does not capture the potential for other sub-lethal effects, and that initial QSAR modeling of predicted metabolites has high uncertainty because of limited testing and data. ECOSAR modeling is further discussed, and results presented, in Appendix C.
9.1.2 Aquatic effects from dietary exposure
The theoretical toxicity potential from dietary uptake was investigated because of significant partitioning of TBB and TBPH to sediment and soil coupled with a high degree of environmental stability and likely continuous presence (Mackay et al. 2014). Exposure via dietary intake is relevant for both TBB and TBPH, as suggested by the measured environmental concentrations. No empirical bioaccumulation factors were available for either substance; while only TBB is amenable to bioaccumulation modeling (high log Kow of 10.10 for TBPH precludes reliable predictions). The critical body residue (CBR) concept was therefore applied to investigate the potential for adverse effects (i.e., mortality) in fish from dietary uptake of TBB. As the more bioavailable of the two substances, this analysis was ultimately considered conservative. The CBR concept considers whether the uptake of a chemical from the environment can accumulate to critical body burden levels associated with mortality. McCarty (1986, 1987a, 1987b, 1990), McCarty and Mackay (1993), McCarty et al. (1985, 1991), Van Hoogen and Opperhuizen (1988), and McCarty et al. (2013) have shown that internal concentrations of neutral narcotic chemicals in fish causing death are fairly constant at about 2 to 8 mmol/kg for acute exposures and 0.2 to 0.8 mmol/kg for chronic exposures. McCarty and Mackay (1993) and Escher et al. (2011) provide the mathematical formula as follows:
CBR = (BAF (or BCF, normalized to 5% lipid) x water concentration of chemical) / molecular weight of the chemical
The CBR is calculated using the modelled BAF value for TBB. The water concentration is the highest predicted environmental concentration (calculated in section 9.2.1 below). The results of the CBR analysis are presented and discussed in risk characterization (section 9.3.1).
9.1.3 Other ecological effects studies
Additional studies found in the open literature provide additional information on potential ecological effects of TBB and TBPH.
The amended sediment mesocosm study discussed in section 8.3.3 also included condition and biochemical measures of the fathead minnows (Pimephales promelas) caged above the sediment (de Jourdan et al. 2012). The condition factor in immature fish, which incorporated total weight and fork length, was 0.88 +/- 0.1 in the control mesocosm and 1.00 +/- 0.1 in the TBB/TBPH mixture exposed mesocosm. This is a statistically significant difference by Holm-Sidak pairwise comparison. The only other statistically significant result involving TBB/TBPH mixture in this study was the thiobarbituric acid reactive substance assay (TBARS), a measure of oxidative stress, which was significantly lower in the depuration phase versus uptake phase for immature minnows exposed to TBB/TBPH mixture, but not statistically significant against the control group (de Jourdan et al. 2012).
The study conducted by Bearr et al. (2010) discussed in section 8.3.2 also included an examination of the potential for TBB/TBPH and TBB/TBPH/Organophosphate mixtures present in the diet to induce DNA damage in liver tissue or blood of fathead minnows, measured by the Comet assay. Both TBB/TBPH and TBB/TBPH/Organophosphate mixtures induced statistically significant increases in the percentage of DNA residing in the comet tail versus control for the liver samples, but not blood. DNA strand breaks measured by the comet assay provide evidence for genotoxicity of these formulations. Lipid normalized fish tissue concentrations of TBB and TBPH at the end of the exposure period were on the order of 0.02 mmol/kg. Percentage of DNA in the tail returned to statistically insignificant increases in the depuration phase. As only a single amended food concentration was evaluated in this study, there is uncertainty as to whether effects would be associated with lower tissue concentrations.
McGee et al. (2013) studied developmental toxicity to zebrafish from components of TBB/TBPH/Organophosphate mixture. Static exposures up to 10 µM TBB (5.5 mg/L) or 10 µM TBPH (7.1 mg/L) with a 0.02% dimethylsulfoxide vehicle in embryonic media resulted in no significant effects on embryonic survival or development. Other components of TBB/TBPH/Organophosphate mixture induced severe developmental abnormalities at these concentrations. Although not investigated further, the authors suggest that the absence of developmental toxicity from TBB and TBPH may have resulted from decreased embryonic uptake relative to other components, particularly owing to adsorption to test chamber surfaces.
9.1.4 Empirical studies in wildlife
Egloff et al. (2011) conducted an in vitro study to determine concentration-dependent effects on hepatic messenger RNA (mRNA) expression levels of 11 transcripts for genes involved in xenobiotic metabolism, lipid metabolism, and thyroid hormone homeostasis, in primary cultures of chicken embryonic hepatocytes. TBPH was added at the following concentrations: 0.01, 0.1, 1, 3, 10, and 30 μM (n=3 replicates per treatment group) and incubated for 36 hours. Hepatocyte viability was not affected by TBPH (or any brominated flame retardant). TBPH induced no changes in mRNA expression for any of the genes of interest.
CTV in wildlife piscivores for TBB of 23 and 14 mg/kg bw/d were determined from a Wildlife Toxicity Reference Value (TRV) approach (Sample et al. 1996), where effects in rats were normalized to a typical body weight of mink (Mustela vison) and river otter (Lontra canadensis) respectively, which represent surrogate wildlife species (see ECCC 2018, for detailed calculation and input values). The toxicity endpoint (reduction in birth weight of second generation pups; NOAEL = 15 mg/kg bw/d, and LOAEL = 50 mg/kg bw/d; geometric mean = 27 mg/kg bw/d) was identified from an oral two-generation reproduction and fertility study in rats conducted on a mixture of TBB and TBPH (MPI Research Inc. 2008a, see Health section for detailed analysis of rodent toxicity studies). Although conducted on a mixture of TBB and TBPH, the result was considered applicable to TBB for the purposes of risk characterization. An assessment factor of 10 was applied to account for inter- and intra-species variation. As a two generational study, and noting that low birth weight is linked to many developmental or neurodevelopmental problems, no additional contribution to the assessment factor is proposed for extrapolation to chronic or sub-lethal effects. The resulting TRV was 2.3 to 1.4 mg/kg bw/d.
For soil-based exposures, the procedures for mink and river otter (i.e., scaling the toxicity value for body size) were followed for extrapolation to shrew. Using an upper body weight limit of 10 g for the shrew, the result yields a body weight normalized toxicity threshold reference value of 7.3 mg/kg bw/d.
9.2 Ecological exposure
While measured TBB and TBPH concentrations in the environment have been presented, limited data concerning the concentrations of TBB and TBPH in water in Canada have been identified. Therefore, environmental concentrations have been estimated from available information, including substance quantities, estimated release rates, and characteristics of the receiving environment. Environmental concentrations have been estimated for industrial and product release scenarios, as described in the following sections.
9.2.1 Industrial exposure scenarios and predicted environmental concentrations
Aquatic exposure to TBPH or TBB/TBPH mixtures is expected if the substances are released from industry (e.g., manufacture, formulation) either directly to receiving surface water or to a wastewater treatment system that discharges its effluent to a receiving surface water body. The concentration of the substance in the receiving water near the discharge point of the wastewater system is used as the predicted environmental concentration (PEC) in evaluating the aquatic risk of the substance. It can be calculated using the equation:
PEC = (1000 x Q x L x (1-R) / (N x F x D)
Where
PEC: aquatic concentration resulting from industrial releases, mg/L
Q: total substance quantity used annually at an industrial site, kg/yr
L: loss to wastewater, fraction
R: wastewater system removal rate, fraction
N: number of annual release days, d/yr
F: wastewater system effluent flow, m3/d
D: receiving water dilution factor, dimensionless
As TBPH and TBB/TBPH mixtures are used by industrial facilities and are reported to be released to water, several conservative aquatic industrial release scenarios were developed to cover a range of different industrial activities in Canada. For TBPH, the scenarios include: plastic compounding, industrial fabric coating, and commercial product formulation. For TBB/TBPH mixture, the scenarios include: polyurethane foam manufacturing, polyurethane insulation injection, and polyurethane adhesive use. All scenarios incorporate either primary or secondary off-site wastewater treatment preceding release to rivers or lakes. Further description of these scenarios may be found in ECCC 2018.
Table 9‑2 presents the range of inputs used to estimate resulting aquatic concentrations close to the industrial point of discharge.These scenarios yield predicted environmental concentrations (PECs) in water for TBPH from 1.7 x 10⁻⁶ to 3.8 x 10⁻⁴ mg/L, and for TBB/TBPH mixture from 5.1 x 10⁻¹⁰ to 3.3 x 10⁻⁶ mg/L. These are total water concentrations, and do not account for dissolved organic carbon in the receiving water. Where predicted PEC values exceeded the water solubility (3.1 x 10⁻⁵ mg/L for TBPH, and 2.8 x 10⁻³ mg/L for TBB), 10x the water solubility was used for the upper limit PEC. In the case of TBB/TBPH mixture, 10x the water solubility of TBB were considered the upper limit. Therefore, for industrial exposure scenarios the resulting valid PECs ranged from 1.7 x 10⁻⁶ to 3.1 x 10⁻⁴ mg/L for TBPH, while the PECs for TBB/TBPH were all below the water solubility of TBB and thus considered acceptable.
| Input | Value | Justification and reference |
|---|---|---|
| Quantity used per site (kg/yr) | Less than 20 000 | Section 71 survey or New Substances Notification |
| Loss to wastewater (%) | 0.0011 to 1 | Fabric: OECD 2004 Plastic: OECD 2009b Blending: EC standard assumption |
| Wastewater treatment system removal efficiency (%) | Primary: 57 Secondary: 81.6 | As a conservative assumption, the lowest removal rate for either compound as predicted by a suite of models (ASTreat 2006, STP-EX 2008, SimpleTreat 2013, and STP Model 2006). ASTreat generated the lowest rates. |
| Number of annual release days (days) | Industrial release: 250 to 350 | NPRI or EC standard assumption |
| Wastewater treatment system effluent flow (m3/day) | 10 595 to 2 237 760 | ERRIS 2014 internal database |
| Dilution factor (unitless) | Lakes: 10 Rivers: 2.1 to 10 | Lakes: EC standard assumption Rivers: site-specific wastewater treatment system effluent flow/receiving environment flow (HYDAT 2013). When a dilution factor was greater than 10, a maximum default value of 10 was used. |
As discussed in section 8.3, the model suggests some level of bioaccumulation of TBB. The modelled probabilistic bioaccumulation factor was used to conduct a conservative risk analysis for piscivorous wildlife for TBB (i.e., 8446 L/kg). A Wildlife PEC was derived from a Total Daily Intake (TDI) for mink (Mustela vison) and river otter (Lontra canadensis) consuming fish following the approach of the US EPA (1993). In calculating TDI, a water concentration (Ct) of 3.3 x 10⁻⁶ mg/L was selected as the most conservative water PEC of all exposure scenarios for TBB/TBPH mixture. This resulted in a TDI of 6.0 x 10⁻³ mg/kg bw/d for mink and 4.5 x 10⁻³ mg/kg bw/d for river otter.
Soil concentration and potential uptake rate in a small mammal (i.e., shrew or vole) were estimated using a mass-balance model that involves equilibrium partitioning principles to estimate the overall fate of the substance in the soil and exposure to soil biota (BASL4 2011). This analysis was performed for TBB with the highest biosolid concentration calculated across all of the TBB/TBPH mixture scenarios as input. Assuming a biosolids application rate of 8.3 tonnes/ha every year, over a period of 10 years, the BASL4 model (2011) estimates the resulting dietary uptake rate in the small terrestrial mammal. The default in the BASL4 model is no metabolism, which was left as an extremely conservative assumption, acknowledging several lines of evidence presented in section 8.3.3 for metabolism. The small mammal intake rate (TDI) predicted for TBB was 0.67 mg/kg bw/d. In this scenario, the modelled combined layer soil concentration after 10 years of application was 0.02 mg/kg dw.
An equilibrium sediment-water partition approach was used to estimate the concentration of TBPH or TBB/TBPH mixture in bottom sediment. This approach is based on a partitioning principle described by the European Chemicals Agency (ECHA 2010) and incorporates two additional calculation methods. The first method is to estimate the substance’s concentration in the aqueous phase (dissolved) of the overlying water from its total concentration, according to studies by Gobas (2007 and 2010). The second method is to estimate a substance’s concentration in bottom sediment from its concentration in the aqueous phase of the overlying water using an equilibrium partitioning assumption between bottom sediment and overlying water described by the US EPA’s National Center for Environmental Assessment (US EPA 2003). At equilibrium, the predicted environmental concentration (PEC) in bottom sediment can linearly correlate with the concentration in the aqueous phase of the overlying water. Sediment exposure scenarios were developed as an extension of the industrial aquatic release scenarios described above to determine equilibrium sediment PECs, standardized to 4% organic carbon (a typical organic carbon content in bottom sediment for rivers and lakes). The resulting PEC in bottom sediment for TBPH ranged from 8.0 x 10⁻³ to 1.4 mg/kg dw, while the resulting PEC values for TBB/TBPH mixture ranged from 2.5 x 10⁻⁶ to 1.6 x 10⁻² mg/kg dw. The higher PEC values approach the highest North American measured concentrations of 3.9 mg/kg for TBB and 19.2 mg/kg for TBPH (normalized to ~1% OC) at the outfall of a textile wastewater treatment plant (La Guardia et al. 2012).
9.2.2 Exposure scenario for products available to consumers and predicted environmental concentrations
In addition to industrial sources, TBB and TBPH can be released to the environment through manufactured items. The presence of TBB and TBPH in dust samples strongly supports the release of these substances from products available to consumers (see section 10.1.1.3), and various mechanisms for transfer from such products to dust have been proposed (Toms et al. 2011). Clothing, and the dust entrapped with it, has been proposed as an important source of additive flame retardants, including TBB and TBPH to wastewater treatment systems via cleaning and laundering activities (Schreder and La Guardia 2014, Melymuk et al. 2014).
Schreder and La Guardia (2014) measured the mean concentration of TBB and TBPH in residential dust and laundry wastewater sampled from 20 homes in the northwestern United States between 2011 and 2012. The mean concentrations of TBB and TBPH in the laundry wastewater were measured as 551 ng/L and 711 ng/L, respectively. It is noted that the concentration of TBPH in laundry wastewater is above the modelled water solubility, but may reflect a total concentration, or simply be a function of the other components present in laundry wastewater (e.g., detergent). The authors also measured the influent and effluent concentrations of TBB and TBPH at two local wastewater treatment plants serving these homes. These plants receive over 80% of their input from households, with no known flame retardant discharges from the remaining industrial contribution. Using the proportion of influent expected from laundry wastewater and the proportion of influent expected from households, the authors determined that laundry wastewater may be a primary source of these flame retardants to the wastewater treatment plants (Schreder and La Guardia 2014).
Laundry wastewater data from the northwestern United States from the Schreder and La Guardia study (2014) is considered sufficiently representative to construct an exposure scenario relevant to Canada for laundry wastewater, as a route to the environment for TBB and TBPH released from products available to consumers. Environment Canada indicates that the average domestic water use is 343 L/day/Canadian, while 20% of the water is used for laundry (Environment Canada 2013). These values, multiplied by 365 days/year, 35,540,400 Canadians, and the mean concentrations of TBB and TBPH in laundry wastewater reported above give an annual national release of 490 kg/year and 633 kg/year for TBB and TBPH respectively (Schreder and La Guardia 2014, Statistics Canada 2014).
The annual quantities of TBB and TBPH released from households via laundry wastewater were used to estimate predicted near source environmental concentrations, assuming 365 days of use, 100% release, and the same wastewater treatment system removal efficiencies employed above for the industrial scenarios. The predicted near source environmental concentrations ranged from 5th to 95th percentile values of 1.4 x 10⁻⁹ to 3.8 x 10⁻⁶ mg/L for TBB and 2.2 x 10⁻⁹ to 4.4 x 10⁻⁶ mg/L for TBPH.
Using the approach described above for the industrial exposure scenarios, piscivorous mammal TDI values were calculated probabilistically using the distribution of TBB concentrations identified above. The resulting TDI values were 1.3 x 10⁻⁴ mg/kg bw/d and 1.1 x 10⁻⁴ mg/kg bw/d for mink and river otter respectively.
A small mammal intake rate was also calculated for this exposure scenario. The concentration of TBB in biosolids was first estimated by multiplying the per person daily TBB release rate by the highest wastewater treatment system removal efficiency, and dividing by the per person daily biosolid generation rate. Using the BASL4 model with the same parameters described for the industrial scenarios, the resulting small mammal intake rate was 0.24 mg/kg bw/d. When measured biosolids concentrations available from Shanmuganathan et al. (2016) were applied in BASL4 modelling with the same parameters, the maximum small mammal intake rate, corresponding to the maximum concentration of TBB measured across eight wastewater treatment systems, was 1.5 mg/kg bw/d.
Overall, releases from products available to consumers are expected to be geographically dispersed and spread out over the duration of the service life and end-of-life stages. While the laundry scenario presented above is believed to address a major source of release to the environment during service life of products available to consumers, there is an absence of data to quantitatively address end-of-life releases from manufactured items (including non-residential sources) and dust disposal. Kajiwara et al. (2014) reported leaching rates for a series of brominated flame retardants from simulated landfill conditions ranging from 0.001 to 0.58% over a 3.5-year study. This supports the relevance of landfill leachate as a potential source of TBB and TBPH to wastewater and/or the environment. However, no Canadian TBB or TBPH landfill leachate data have been reported to date, but such data could help interpret releases from dust disposed of as solid waste as well as end-of-life releases.
9.3 Characterization of ecological risk
The approach taken in the evaluation of current potential for ecological harm was to examine various supporting information and develop conclusions on the basis of a weight-of-evidence approach and using precaution as required under CEPA. Lines of evidence considered include results from a conservative risk quotient calculation, as well as information on persistence, bioaccumulation, inherent or ecological toxicity, sources, fate of the substance, and presence and distribution in the environment.
9.3.1 Risk quotient analysis
A risk quotient analysis, integrating conservative estimates of exposure with toxicity information, was performed for the aquatic medium, critical body residues in fish, piscivorous mammalian wildlife uptake, and small mammal uptake following agricultural application of biosolids to determine whether there is potential for ecological harm in Canada.
Although TBB and TBPH are predicted to eventually partition to the soil or sediment compartments, modest fractions may remain in water. The industrial scenarios presented in Section 9.2.1 yielded predicted environmental concentrations (PEC) in water of 1.7 x 10⁻⁶ to 3.1 x 10⁻⁴ mg/L for TBPH and 5.1 x 10⁻¹⁰ to 3.3 x 10⁻⁶ mg/L for TBB/TBPH mixture (see ECCC 2018). A predicted no-effect concentration (PNEC) of 7.9 x 10⁻⁴ mg/L was derived from a chronic toxicity value assumed applicable to both compounds and the mixture (see section 9.1). The resulting risk quotients (PEC/PNEC) for the industrial scenarios are below 1, ranging from 2.1 x 10⁻³ to 0.39 for TBPH and from 6.5 x 10⁻⁷ to 4.2 x 10⁻³ for TBB/TBPH mixture. The scenario for products available to consumers presented in Section 9.2.2 yielded PEC values ranging from 5th to 95th percentiles of 1.4 x 10⁻⁹ to 3.8 x 10⁻⁶ mg/L for TBB and 2.2 x 10⁻⁹ to 4.4 x 10⁻⁶ mg/L for TBPH. The resulting risk quotients are similarly below 1, ranging from 2.8 x 10⁻⁶ to 5.6 x 10⁻³ for TBPH and from 1.8 x 10⁻⁶ to 4.8 x 10⁻³ for TBB.
Exposures of TBB were estimated for fish using the modelled bioaccumulation factor (8446 L/kg) and both the highest predicted environmental water concentration among the industrial exposure scenarios (3.3 x 10⁻⁶ mg/L) and the distribution of TBB concentrations from the exposure scenario for products available to consumers. Uncertainties in the BAF, and variation in exposure parameters for the scenario for products available to consumers, are considered to provide a distribution of possible exposure levels for a middle trophic level fish. The critical body burden levels associated with effects such as mortality via baseline narcosis mode of action, 2 to 8 mmol/kg for acute exposures and 0.2 to 0.8 mmol/kg for chronic exposures (see section 9.1.2), are shown against the distribution of medium-sized fish body residues presented in Figure 9-1 for the industrial scenario, and Figure 9-2 for the scenario for products available to consumers. On the basis of the comparison, TBB is unlikely to have exposures in fish at levels resulting in either acute or chronic lethality to fish via baseline narcosis for either scenario. While the thresholds for baseline narcosis are well established in the literature, narcotic lethality is not a particularly protective endpoint for these substances given the evidence presented for sub-lethal effects. Although crude, a comparison can be made between the predicted fish body residues in Figure 9-1 and Figure 9-2, and the lipid normalized tissue concentrations associated with DNA damage in fathead minnows (~0.02 mmol/kg) (Bearr et al. 2010, see section 9.1.3). This comparison shows that the concentrations associated with potential genotoxicity are at least two orders of magnitude above and the 95th percentile of worst-case exposure estimates.
Following through with the worst-case modelled bioaccumulation potential, mammalian piscivores may also be exposed to TBB from consumption of contaminated fish. Therefore, a conservative risk analysis was also conducted for piscivorous wildlife, mink and river otter, for TBB. Predicted no-effect intake rates (TRV, section 9.1.4) are compared graphically against probabilistic total daily intake values (TDI, sections 9.2.1 and 9.2.2), in Figure 9-1 and Figure 9-2 for the industrial scenario and the scenario for products available to consumers, respectively. The figures demonstrate that the distributions of TDI values are well below the calculated TRVs, suggesting low risk. Numerically, the 95th percentile TDI values for mink and river otter are approximately 0.032 mg/kg bw/d and 0.024 mg/kg bw/d for the industrial scenario, and 0.011 mg/kg bw/d and 0.009 mg/kg bw/d for the scenario for products available to consumers, which are well below the species weight adjusted TRV values of 2.3 mg/kg bw/d and 1.4 mg/kg bw/d, respectively.
Finally, a conservative uptake rate of TBB from soil by small terrestrial mammals (e.g., the shrew) was calculated using the BASL4 model as 0.67 mg/kg bw/d and 0.24 mg/kg bw/d for the industrial scenario and scenario for products available to consumers, respectively (see sections 9.2.1 and 9.2.2). Comparing these values to the weight normalized toxicity threshold reference value (TRV) of 7.3 mg/kg bw/d for the shrew indicates a low potential for risk to small terrestrial mammals from application of biosolids to soils (Table 9‑4).
| Media | Scenario | PNEC | PEC | RQ |
|---|---|---|---|---|
| Water | Industrial release to water | 7.9 x 10⁻⁴ mg/L | 1.7 x 10⁻⁶ to 3.1 x 10⁻⁴ mg/L | 2.1 x 10⁻³ to 0.39 |
| Water | Product release via residential laundry wastewater | 7.9 x 10⁻⁴ mg/L | 2.2 x 10⁻⁹ to 4.4 x 10⁻⁶ mg/L (5th to 95th percentile) | 2.8 x 10⁻⁶ to 5.6 x 10⁻³ |
| Media | Scenario | PNEC or TRV | PEC or TDI | RQ |
|---|---|---|---|---|
| Water (TBB/TBPH mixture) | Industrial release to water | 7.9 x 10⁻⁴ mg/L | 5.1 x 10⁻¹⁰ to 3.3 x 10⁻⁶ mg/L | 6.5 x 10⁻⁷ to 4.2 x 10⁻³ |
| Water (TBB) | Product release via residential laundry wastewater | 7.9 x 10⁻⁴ mg/L | 1.4 x 10⁻⁹ to 3.8 x 10⁻⁶ mg/L (5th to 95th percentile) | 1.8 x 10⁻⁶ to 4.8 x 10⁻³ |
| Wildlife (TBB) | Piscivore (mink/fish), Industrial | 2.3 mg/kg bw/d | 0.032 mg/kg bw/d (95th percentile) | 1.4 x 10⁻² |
| Wildlife (TBB) | Piscivore (otter/fish), Industrial | 1.4 mg/kg bw/d | 0.024 mg/kg bw/d (95th percentile) | 1.7 x 10⁻² |
| Wildlife (TBB) | Piscivore (mink/fish), Products available to consumers | 2.3 mg/kg bw/d | 0.011 mg/kg bw/d (95th percentile) | 4.8 x 10⁻³ |
| Wildlife (TBB) | Piscivore (otter/fish), Products available to consumers | 1.4 mg/kg bw/d | 0.009 mg/kg bw/d (95th percentile) | 6.4 x 10⁻³ |
| Wildlife (TBB) | Agricultural application of biosolids (small mammal), Industrial | 7.3 mg/kg bw/d | 0.67 mg/kg bw/d | 9.2 x 10⁻² |
| Wildlife (TBB) | Agricultural application of biosolids (small mammal), Products available to consumers | 7.3 mg/kg bw/d | 0.24 mg/kg bw/d | 3.3 x 10⁻² |
| Wildlife (TBB) | Agricultural application of biosolids (small mammal), Monitoring | 7.3 mg/kg bw/d | 1.5 mg/kg bw/d | 0.21 |

Figure 9‑1. Long description
Industrial exposure scenario: Graphical comparison of estimated TBB critical body residues (CBR) of fish with thresholds for acute and chronic narcotic toxicity, total daily intake (TDI) of TBB with toxicity threshold reference values (TRV) for piscivorous mammals, mink and river otter, and TDI of TBB resulting from agricultural application of biosolids with TRV for shrew.
This figure shows the calculated distributions of total daily intake rates (TDI) for mink and river otter (X-axis) and body residues in fish which they consume (secondary X-axis), where Cw (predicted water concentration) is taken from the worst case industrial exposure scenario. Percentiles are plotted on the Y-axis. Toxicity threshold reference values (TRV) for mink and river otter, and fish chronic and acute body residue thresholds are plotted as vertical lines. TRVs are approximately two orders of magnitude above the 95th percentile of TDI for mink and river otter. The fish chronic body residue threshold is approximately three orders of magnitude above the 95th percentile of the calculated fish body residue distribution.
TDI for the shrew following agricultural application of biosolids, modeled for the industrial scenario associated with the highest biosolds concentration, and TRV for shrew are also plotted as vertical lines. The shrew TRV is approximately one order of magnitude above the TDI.

Figure 9‑2. Long description
Scenario for products available to consumers: Graphical comparison of estimated TBB critical body residues (CBR) of fish with thresholds for acute and chronic narcotic toxicity, total daily intake (TDI) of TBB with toxicity threshold reference values (TRV) for piscivorous mammals, mink and river otter, and TDI of TBB resulting from agricultural application of biosolids with TRV for shrew.
This figure shows the calculated distributions of total daily intake rates (TDI) for mink and river otter (X-axis) and body residues in fish which they consume (secondary X-axis), where Cw is a distribution of predicted environmental concentrations corresponding to consumer product release via laundry wastewater. The probabilistic Cw increases variability in the resulting TDI and fish body residue distributions relative to those for industrial scenario calculated from a deterministic estimate of Cw. Percentiles are plotted on the Y-axis. Toxicity threshold reference values (TRV) for mink and river otter, and fish chronic and acute body residue thresholds are plotted as vertical lines. TRVs are approximately two orders of magnitude above the 95th percentile of TDI for mink and river otter. The fish chronic body residue threshold is approximately three orders of magnitude above the 95th percentile of the calculated fish body residue distribution.
TDI for the shrew following agricultural application of biosolids, modeled using the consumer product release contribution to biosolds, and TRV for shrew are also plotted as vertical lines. The shrew TRV is approximately one order of magnitude above the TDI.
9.3.2 Consideration of the lines of evidence
TBB and TBPH are expected to be persistent in water, soil, sediment, and adsorbed to fine particles in air, but not persistent in the gas phase. However, these compounds are not highly bioaccumulative, due in part to poor bioavailability, but also owing to metabolic biotransformation. Import volumes of TBB and TBPH into Canada, along with information on their uses, indicate potential for release into the Canadian environment. TBB and TBPH are additive flame retardants for polyurethane, while TBPH also functions as a plasticizer. Sources to wastewater and subsequently the environment are expected to be industrial waste streams and release from manufactured items. Once released into the environment, these substances will be found mainly in water, soil, and sediments, with a large majority in the latter two compartments. TBB and TBPH have the potential for long-range transport (LRT), most likely by association with fine atmospheric particulates. Aquatic exposures are likely limited to the near field, given expected partitioning to sediments. Without effects data for soil and sediment-dwelling organisms, focus was placed on the aquatic compartment, the compartment of release. A mixture of TBB and TBPH has been demonstrated to have moderate potential for toxicity to aquatic organisms. However, a low potential for risk is calculated when weighed against conservative aquatic exposure scenarios for TBPH and TBB/TBPH mixture. Calculated fish concentrations from water and dietary exposure to TBB were a few orders of magnitude below established critical body residue thresholds for lethality from a narcotic mode of action, and also well below tissue concentrations that have been associated with reversible DNA damage in fathead minnows. Minimal risk was also observed when comparing calculated TBB intake rates by terrestrial wildlife (i.e., mink and river otter via fish consumption, and the shrew from biosolid amended soil) to body weight adjusted toxicity reference values. As the mammalian toxicity data correspond to sensitive reproductive endpoints, greater weight is placed on the mammalian scenarios in the overall risk characterization than on the comparison of modelled fish concentrations to narcotic thresholds. All industrial exposure calculations used current Canadian industrial use quantity data. A table summarizing the major lines of evidence for risk characterization is presented in Appendix D.
This information indicates that TBB and TBPH have low potential to cause ecological harm in Canada at current exposure levels. TBB and TBPH may have the potential to cause ecological harm if quantities used or presence in manufactured items was to increase.
9.3.3 Uncertainties in evaluation of ecological risk
Significant uncertainty was noted with the empirical physical and chemical property data available for a mixture of TBB and TBPH, and with summary data available for TBPH (see Appendix B). Physical and chemical properties were therefore modelled individually for TBB and TBPH. Multiple, equally appropriate models were used for a given physical chemical property when available. A high degree of random error was noted among the model results, particularly for Kow and water solubility. For instance, the water solubility predictions from different models for TBB and TBPH span three and five orders of magnitude, respectively. To increase confidence in the physical and chemical properties, random error was addressed by calculating the median result of multiple models, while the potential for systematic error was addressed by allowing a factor of 10 over the median, least squares adjusted water solubility when calculating predicted environmental concentrations.
An empirical bioconcentration study conducted on TBB/TBPH mixture was performed, with an organic co-solvent, at nominal test concentrations slightly above the expected water solubility of TBB, and two orders of magnitude above the expected water solubility of TBPH. Furthermore, it is likely that only TBB was analyzed in the determination of measured tissue concentrations. These factors increase uncertainty and decrease confidence in terms of potential underestimation of the BCF. No empirical BAF data on TBB/TBPH were identified. Results of BAF modelling for TBB were therefore carried forward for fish exposure and piscivorous mammal uptake calculations. The model results were conservative in context of the low bioaccumulation potential of TBB suggested by several other lines of evidence (e.g., metabolic biotransformation), and thus the impact of uncertainty was likely minimal (Bearr et al. 2010, Bearr et al. 2012, de Jourdan et al. 2012).
The exposure characterization focuses on industrial point sources and release from products available to consumers via residential laundry wastewater as being most relevant for TBB and TBPH in the environment. The absence of landfill leachate data presents a significant uncertainty in terms of assessing the validity of this assumption. Particularly as additive flame retardants, with only non-covalent linkages to the polymer matrix, TBB and TBPH are expected to migrate from both in service and end-of-life manufactured products, as evidenced by concentrations in household dust (see Health section), and inferred from simulated landfill studies with other brominated flame retardants (Kajiwara et al. 2014). Additional manufactured item exposure scenarios (e.g., landfill leachate to address end of life manufactured items and dust disposed of as solid waste) could not be developed with the information currently available, adding uncertainty to the overall exposure characterization. Additionally, releases from industrial transport container cleaning were not considered in a quantitative manner owing to a high degree of uncertainty. Conservative assumptions were made as detailed in ECCC 2018, but overall there is a low to moderate confidence with the exposure scenarios used to generate PEC values.
In this SOS report, risk quotient analysis was conducted for the pelagic aquatic environment, for exposures to piscivorous mammalian wildlife from consumption of fish contaminated with TBB, and for uptake of TBB by small mammals following agricultural application of biosolids. Deficiencies in the available aquatic toxicity data (e.g., testing orders of magnitude above water solubility, and absent or poor analytical chemistry) introduced a higher uncertainty and lower confidence in the risk analysis for the aquatic environment relative to the fish CBR analysis and mammalian uptake scenarios. Modelled fish concentrations (95th percentile) were approximately two orders of magnitude below tissue concentrations that have been associated with sub-lethal effects (DNA damage). However, as the study examined only a single amended food concentration, there was some uncertainty as to whether the sub-lethal effects could be observed at lower tissue concentrations. The sensitive two-generation mammalian reproduction study afforded a higher confidence in the risk analysis to piscivorous mammalian wildlife. High-quality empirical BAF data for both compounds would further reduce uncertainty in both fish CBR and piscivorous mammal risk analysis.
Based on the predicted partitioning behavior of TBB and TBPH, the significance of soil and sediment as important media of exposure is not well addressed as there are no effects data available for benthic or soil organisms. Indeed, the only effects data identified apply primarily to pelagic aquatic exposures. The lack of effects data for these compartments is considered a critical data gap in this report, and leaves the possibility for false negatives regarding risk to sediment-dwelling and terrestrial organisms.
10. Potential to cause harm to human health
This human health evaluation is based on the combined exposure of TBB and TBPH (i.e., TBB/TBPH). Evaluating combined exposures of TBB and TBPH is considered to be a conservative approach as both substances co-occur in the environment and in certain manufactured items that the general population is expected to be in contact with. Although limited, health effects information was available for TBPH and commercial mixtures of TBB and TBPH; however, little was available for TBB. In the present report, the most critical effect levels were identified from mixture studies of TBB and TBPH.
10.1 Exposure
10.1.1 Environmental media and food
TBB and TBPH have recently been monitored in environmental media in Canada, particularly in the Great Lakes region, and elsewhere worldwide (see Measured Environmental Concentrations, section 7). Given their very low water solubility and very low volatility, TBB and TBPH are expected to partition predominantly to particles, dust, soil and sediment when released in the environment.
Canadians may be exposed to TBB and TBPH in air, dust, soil, sediment, water and food, including breast milk. Conservative estimates of daily intakes of TBB and TBPH are presented in Appendix E. For all age groups, the main contribution to the estimated daily intake was from the ingestion of dust, food (fish and breast milk), and the inhalation of particles in indoor air. Exposures via ambient air and water were very low and considered negligible. Breastfed infants (0 to 6 months) were the most highly exposed age group, with an estimated intake of 160 ng/kg-bw/d predominantly from breast milk and dust.
10.1.1.1 Ambient air
As described in section 7, TBB and TBPH have been monitored in ambient air in Canada and elsewhere.
Recent air monitoring in Toronto, Ontario, Canada showed that TBB and TBPH were detected in the majority of samples (>85%) collected in 2010 and 2011, with concentrations measured up to 9 pg/m3 and 7 pg/m3, respectively (Shoeib et al. 2014; Diamond et al. 2013). TBB and TBPH were also frequently detected in ambient air samples of urban sites collected along the Great Lakes (Jan 2008 to Dec 2010) from the IADN (Ma et al. 2012). In this study, the Chicago and Cleveland sites were associated with the highest concentrations of TBB (0.5 to 55 pg/m3) and TBPH (0.36 to 290 pg/m3). At the Canadian rural site (Point Petre, Ontario), TBB and TBPH were detected at lower frequencies (16% and 53%, respectively; n=45) than at the urban sites, and levels of TBB (range of 0.074 to 0.82 pg/m3) and TBPH (range of 0.18 to 3.7 pg/m3) were also similar to those at U.S. remote sites (Ma et al. 2012). The authors highlight that the atmospheric concentrations of TBB and TBPH increased rapidly and significantly over the sampling period, perhaps indicating that compounds are replacing PBDEs (Ma et al. 2012).
Daily intake estimates of TBB and TBPH for ambient air exposure were estimated using the sum of the maximum concentrations of 9 and 7 pg/m3, respectively, measured in Toronto (Diamond et al. 2013). These concentrations are considered adequately conservative for deriving chronic upper bound exposure intakes for the general population of Canada.
TBB and TBPH have also been detected in the Canadian Arctic in Alert, Nunavut, which suggests that TBB and TBPH may be available for long-range transport. Median TBB and TBPH levels were found to be 0.46 pg/m3 (range of 0.16 to 2.2 pg/m3) and 0.69 pg/m3 (range of 0.1 to 1.5 pg/m3), respectively (Xiao et al. 2012a). Alert Nunavut is the northernmost inhabited location in the world (Iqaluit 2010), and the values selected for monitoring in Toronto were considered sufficient to account for potential variability in air concentrations for northern populations based on comparisons to levels reported for Alert by Xiao et al. (2012a).
10.1.1.2 Indoor air
Two studies have reported indoor air values for TBB and TBPH from samples collected in Canada. TBB and TBPH were measured in air from homes in Toronto in 2013 at maximum concentrations of 291 and 43 pg/m3 and median levels of 12 and 3.1 pg/m3, respectively. TBB was detected in all 34 samples collected while TBPH was only detected in 22 samples (Venier et al. 2016). TBB and TBPH were also measured in air from homes in the Greater Toronto Area (n=32) and Ottawa (n=19) between February and July 2015 (3 week sampling period). Air was sampled using polyurethane foam (PUF) samplers in bedrooms in all homes (n=51) and additionally in a ‘most used room’ (MUR) in 26 of the homes. Over all samples collected (n=77), TBB was measured in the range 1.40 to 2833 pg/m3 with a mean concentration of 77.24 pg/m3 and a detection frequency of 56%. TBPH was measured in the range 3.50 to 146.62 pg/m3 with a mean concentration of 8.90 pg/m3 and a detection frequency of 7% (Yang et al. 2017).
TBB and TBPH have also been measured in indoor air from several other environments. Bradman et al. (2014) detected TBB and TBPH to a limited extent (15 and 17.5%) in air samples collected from 40 early childhood education (ECE) centres (e.g., daycares) in California, where median levels for both substances were not detected (method detection limit (MDL) = 0.1 ng/m3 or 100 pg/m3). The 95th percentile concentrations of TBB and TBPH were found to be 2290 and 990 pg/m3, respectively. In a recent preliminary study on gymnast exposure, air samples were collected from two gymnasiums in Boston, U.S., where TBB and TBPH concentrations were found to be 26100 pg/m3 (26.1 ng/m3) and 16 900 pg/m3 (16.9 ng/m3) near the foam pits, and 5010 pg/m3 (5.01 ng/m3) and 2660 pg/m3 (2.66 ng/m3) away from the pits, respectively (Carignan et al. 2013). In both studies (i.e., Bradman et al. 2014; Carignan et al. 2013), the authors report the presence of flexible polyurethane foam as a potential source of exposure. Norway’s Climate and Pollution Agency measured TBB and TBPH in a very limited number of indoor air samples (specific indoor environment not specified) (n=3) collected in 2009, where TBB and TBPH ranged from not detected (detection limit = 1.2 pg/m3) to 6.7 pg/m3 and 6.7 to 7.4 pg/m3, respectively (TemaNord 2011).
Daily intake estimates of TBB and TBPH from exposure to indoor air were estimated using the sum of the maximum concentrations of TBB and TBPH (2833 and 146.62 pg/m3, respectively), measured in homes in the Greater Toronto Area and Ottawa (Yang et al. 2017). These levels are considered appropriate for deriving upper bound intakes for the general population of Canada.
10.1.1.3 Dust
TBB and TBPH have been widely detected in dust studies of homes, education facilities, and other indoor environments in Canada, the U.S. and elsewhere (Appendix F).
TBB (not TBPH) was included in the Canadian baseline study of halogenated flame retardants in archived house dust samples collected from 2007 to 2010 across 13 Canadian cities within the Canadian House Dust Study (CHDS) as per the method described by Fan et al. (2016). TBB was detected in 96.8% of samples (n=631), and concentrations ranged from not detected (MDL = 1.5 ng/g) to 22 371 ng/g, with a median of 123 ng/g and 95th percentile of 1831 ng/g (Kubwabo et al., manuscripts in preparation, Environmental Health Science and Research Bureau (EHSRB), Health Canada; unreferenced, dated June 5, 2017). TBB and TBPH were both detected in the majority of house dust samples collected in Vancouver, British Columbia, in 2007 to 2008 (n=116) (Shoeib et al. 2012), and Toronto in 2012 (n=12) (Diamond et al. 2013). In the Vancouver study, TBB and TBPH median concentrations were reported to be 510 ng/g (range of not detected [detection limit = 0.30 ng/g] to 18 000 ng/g) and 330 ng/g (10 to 6400 ng/g), respectively, with 95th percentile concentrations of 1408 ng/g and 1107 ng/g, respectively (Shoeib et al. 2012). In the preliminary Toronto study, TBB and TBPH concentrations ranged from not detected (<15 ng/g) to 7300 ng/g and not detected (<19 ng/g) to 9200 ng/g, respectively.
Additional Canadian studies measured TBB and TBPH in dust in 35 homes and 10 offices in Toronto in 2012 (Abbasi et al. 2016), in 23 homes in Toronto in 2013 (Venier et al. 2016), and in 51 homes in the Greater Toronto Area (n=32) and Ottawa (n=19) (Yang et al. 2017). Concentrations of TBB and TBPH in dust ranged from not detected to 15,300 ng/g and not detected to 34,500 ng/g, respectively, with wider ranges in homes than in offices. Abbasi et al. (2016) also analyzed the association of TBB and TBPH in dust from the 2012 study with dust on products (n=65) in the same locations. TBB was detected in all personal computers (14.82 to 1010.0 ng/wipe, n=10) and 79% of audio/video devices (not detected to 514.92 ng/wipe, n=20). TBPH was detected in all personal computers (0.22 to 194.06 ng/wipe, n=10) and small household appliances (0.04 to 14.23 ng/wipe, n=11), as well as in 86% of flat screen TVs (not detected to 74.73 ng/wipe, n=14). The authors showed that there was a positive correlation between the geometric mean concentrations of halogenated flame retardants (including TBB and TBPH) in home and office dust with those in dust from the surfaces of electronic products.
Results from house dust studies in the U.S. are generally consistent with Canadian data, where TBB and TBPH central tendency values range from 48 ng/g (median) to 322 ng/g (geometric mean) and 66 to 923 ng/g (geometric means) (Stapleton et al. 2008,2009; Dodson et al. 2012; Springer et al. 2012; Johnson et al. 2013; Hoffman et al. 2014). The highest maximum concentrations of TBB and TBPH reported in the U.S. were found to be 75 000 ng/g (44% detection) and 47 110 ng/g (60% detection), respectively, for samples (n=50) collected from 2002 to 2007 (Stapleton et al. 2009).
Children spend several hours a day indoors in childhood education facilities (e.g., schools, daycares), and dust exposure in these facilities, particularly for young children, is of importance owing to young children’s unique behaviour such as crawling (proximity to the floor) and frequent hand-to-mouth activity leading to relatively higher dust exposures (US EPA 2011). Bradman et al. (2014) measured TBB and TBPH in dust (in addition to air) collected in 39 ECE environments (e.g., daycares) in California. Both substances were detected in 100% of samples. Median TBB and TBPH concentrations in these facilities were 362 (up to 14 812 ng/g) and 133 ng/g (up to 7 490 ng/g), respectively, while 95th percentile concentrations were found to be 6 558 and 1 299 ng/g, respectively (Bradman et al. 2014). Dust samples were also collected in preschools and daycare centres (2007 to 2008; n=36) in the United Kingdom, where TBB ranged from not detected (detection limit = 2 ng/g) to 289 ng/g (mean of 45 ng/g) while TBPH ranged from not detected (detection limit = 2 ng/g) to 6 175 ng/g (mean of 381 ng/g) (Ali et al. 2011a).
TBB and TBPH were also measured in dust samples (n=8) (in addition to air samples) collected from two gymnasiums in the Boston gymnast exposure study (Carignan et al. 2013). The median concentrations of TBB and TBPH (28 900 and 30 000 ng/g, respectively) in the first gym were considerably higher than the second gym (10 and 60 ng/g, respectively). Also, the authors observed significantly higher median concentrations of TBB and TBPH in handwipes collected from gymnasts after practice (222 and 96.4 ng/wipe, respectively) relative to those collected before (60.8 and 27.9 ng/wipe, respectively) (Carignan et al. 2013).
TBB and TBPH have also been frequently detected in offices, cars and aircrafts. Webster et al. (2011) and Springer et al. (2012) included TBPH in their analyses of dust in offices and cars in the Boston area, USA, in 2009, where median concentrations were found to be 410 and 400 ng/g, respectively. These concentrations were significantly higher than those measured in households (median of 150 ng/g) in the same study. In a study in Belgium, TBB and TBPH concentrations in dust samples (n=6) were lower than those measured in Belgian houses (n=39) (Ali et al. 2011a). The substances were also measured in dust from aircraft cabins, with median levels of TBB and TBPH in carpets of 350 and 640 ng/g, respectively, and of 740 ng/g and 1200 ng/g, respectively, in air vents (Allen et al. 2013).
As no Canadian dust data for ECE facilities were identified and since maximum dust concentrations of TBB and TBPH in Canadian homes are higher than the values reported for ECE environments in California (Abbasi et al. 2016; Venier et al. 2016; Yang et al. 2017), daily intakes of TBB and TBPH via dust for the general population of Canada were estimated using the maximum concentration of TBB (22 371 ng/g) measured in the Canadian House Dust Study (personal communication from EHSRB, Health Canada, dated June 5, 2017) and the maximum concentration of TBPH (6400 ng/g; n=116) from the Vancouver study (Shoeib et al. 2012). The values selected are considered appropriate to characterize indoor exposures for Canadians based on the variability in exposure potential (e.g., concentration, duration and frequency) relative to other environments.
10.1.1.4 Soil and sediment
As described in section 7, no monitoring data on TBB and TBPH in soil in Canada were identified. However, both substances have recently been monitored in sediment core samples from Canadian sites in Lake Ontario and Lake Erie (Pelletier et al. 2013), as well as in the U.S. (La Guardia et al. 2013).
A predicted environmental concentration (PEC) of 20 000 ng/kg dw (0.02 mg/kg dw) for TBB and TBPH combined in Canadian soil was estimated for land application of biosolids on an agricultural field using conservative approaches (see section 9.2.1). As no monitoring studies on TBB and TBPH in soil were identified, the soil PEC for the TBB/TBPH mixture was selected for deriving intake estimates from the ingestion of soil for the general population in Canada.
10.1.1.5 Drinking water
No studies were identified that reported TBB and TBPH in drinking water in Canada or elsewhere. However, as described in section 7, TBB and TBPH have been monitored in surface water in Canada and elsewhere. Levels of TBB and TBPH in surface water samples (n=5) collected from 2011 to 2012 from the Great Lakes were highest in Lake Ontario (mean of 7.9 and 0.27 pg/L, respectively) and Lake Erie (mean of 5.6 and 10.4 pg/L, respectively) (Venier et al. 2014). In a separate, preliminary study, TBB and TBPH were measured in Lake Ontario at 0.8 and 2.2 pg/L, respectively, with similar results for TBPH (mean of 1.5 pg/L) in Lake Erie (Muir et al. 2011).
As no drinking water data were available, drinking water exposure was characterized using surface water monitoring. Upper-bounding daily intakes of TBB and TBPH for the general population of Canada were based on the sum of the highest TBB and TBPH mean concentrations (7.9 and 10.4 pg/L, respectively) from Lake Ontario and Lake Erie, respectively (Venier et al. 2014). TBPH is a plasticizer used in PVC (Andersson et al. 2006) that may be used in plumbing; this might be a source of contamination in drinking water distribution systems. The use of upper-bounding surface water concentrations of TBPH, where no drinking water treatment is accounted for, is considered to be conservative to account for this uncertainty.
10.1.1.6 Food
No studies were identified that reported TBB and TBPH in marketed foods in North America. In a report on brominated flame retardants in food, the European Food Safety Authority (EFSA) did not identify data on TBB and TBPH in food, and noted that concentrations measured in wildlife may be indicative of presence in food (EFSA 2012). Environmental monitoring of TBB and TBPH in biota in Canada and elsewhere are described in section 7. TBB and TBPH were detected in 32% and 18% of fish samples (species and sample size unspecified) from the Great Lakes and two additional lakes in Ontario, respectively. TBB concentrations ranged from 0.011 to 0.041 ng/g, while TBPH concentrations ranged from 0.044 to 0.078 ng/g (unspecified weight basis) (Zhou et al. 2010b). In a recent Canadian study, TBPH (but not TBB) was detected in northern pike (n=11) and muskellunge (n=10) liver samples from the St. Lawrence River and tributaries. Neither of these substances were detected in yellow perch whole fish (n=29) samples (Houde et al. 2014). Internationally, TBB was not detected (mdl of 30 ng/g lw) in white croaker samples (n=6) from the San Francisco Bay area in the U.S. (Klosterhaus et al. 2012).
TemaNord (2011) screened biota from European Nordic countries for multiple emerging flame retardants. In perch muscle, TBB ranged from not detected (detection limit = 0.006 ng/g ww) to 0.025 ng/g ww, while TBPH ranged from not detected to 0.0089, with the exception of a set of pooled (n=6 and 10 individual) samples (0.46 ng/g ww) collected from a dammed lake. TBB and TBPH were not detected (LOQ of 1.1 ng/g ww) in crab and mussel samples from Norway (DNV 2010). TBB and TBPH have been measured in ringed seal liver (0.435 ng/g ww and 0.573 ng/g ww, respectively), and TBB has been measured (TBPH not detected) in arctic fox liver (0.975 ng/g ww; 90%) and polar bear plasma (3.640 ng/g ww; 90%) from Svalbard, Norway (Sagerup et al. 2010).
Based on the available information, upper-bounding daily intakes of TBB and TBPH from fish consumption were estimated using the sum of the maximum Canadian fish concentrations (0.041 and 0.078 ng/g ww, respectively), measured in the Great Lakes (Zhou et al. 2010b). These concentrations are considered appropriate for deriving upper bound intakes for the general population of Canada given the assumption that TBB and TBPH are present at this concentration in 100% of fish, shellfish and related food items. Although certain northern populations in Canada may, seasonally, consume larger quantities of seafood or game in their diet, this estimate is considered conservative enough to account for this variability.
10.1.1.7 Breast milk
TBB and TBPH biomonitoring data in breast milk is limited. However, Canadian data were identified for TBB and TBPH where they were detected in 78.1% and 32.4%, respectively, of breast milk samples (n=105) collected from 2008 to 2009 from a cohort of nursing women from Sherbrooke, Québec. In this study, TBB and TBPH concentrations ranged from not detected (detection limit = 0.003 ng/g lw) to 24 ng/g lw and not detected (detection limit = 0.15 ng/g lw) to 6.6 ng/g lw, respectively. TBB and TBPH median concentrations were found to be 0.41 ng/g lw and non-detect (<0.15 ng/g lw), respectively, while 95th percentile concentrations for these substances were found to be 5.3 and 4.0 ng/g lw, respectively (Zhou et al. 2014). Upper-bounding daily intakes of TBB and TBPH from breast milk were derived based on 95th percentile concentrations of TBB and TBPH in wet weight, i.e., 0.070 and 0.069 ng/g wet wt, respectively (Zhou et al. 2014; wet weight concentrations obtained from personal communication from EHSRB, Health Canada, dated May 15, 2014). These concentrations are considered appropriate for deriving upper bound intakes for nursing infants within the general population of Canada.
10.1.2 Products available to consumers
TBB and TBPH are additive flame retardants typically used together in a mixture with a variety of uses and applications in manufactured items (see section 5), some of which may result in general population exposure. Dermal and oral exposure estimates were derived using conservative approaches for scenarios deemed relevant for the general population (Table 10‑1). TBB and TBPH are nonvolatile substances; therefore, they are not expected to appear in their gaseous form under normal conditions. Additionally, releases to air are expected to be accounted for through indoor air and dust exposure estimates (see sections 10.1.1.2 and 10.1.1.3).
Based on a survey of Canadian industry, TBB and TBPH are used in flexible polyurethane foam used in several manufactured items such as mattresses, pillows, cushions, and seating, furniture and furnishings in Canada (ECCC 2013-2014). TBB/TBPH/Organophosphate mixture was screened by the U.S. Consumer Product Safety Commission (CPSC) in two studies on flame retardants in foam, and measured at concentrations up to 6.8% w/w (U.S. CPSC 2005a; U.S. CPSC 2005b). The TBB/TBPH/Organophosphate mixture has been measured in flexible polyurethane foam in couches purchased in the U.S. (Stapleton et al. 2009; Stapleton et al. 2012), and was identified in 18% of post-pentaBDE phase-out couch samples (US EPA 2014d).
In preliminary product testing conducted by Health Canada of children’s manufactured items (e.g., nursing pillows, toys) purchased in retail stores in Ottawa, Ontario, in January and May 2014 respectively, TBB and TBPH were detected (above the LOQ of 0.3%) in three foam subsamples of a foam chair, at maximum concentrations of approximately 5 and 2%, respectively. TBB and TBPH were not detected in the remaining 22 children’s manufactured items (Health Canada 2014). In a separate report on children’s foam chairs from various retail outlets from the US and Canada, TBB and TBPH were measured in both foam chairs purchased in Canada (as well as in half of the 40 chairs purchased in the U.S.) (CEH 2013b). The TBB/TBPH /Organophosphate mixture has also been measured in other children’s manufactured items in the U.S., including nap mats (CEH 2013a), car seats, changing table pads, portable mattresses, and a rocking chair, ranging from 0.585 to 4.25 % in concentration (reported as 5.85 to 42.5 mg/g) (Stapleton et al. 2011). More recently, TBB and TBPH were among the flame retardants targeted in a study run by the Commission for Environmental Cooperation (CEC). In this study, 132 furniture products were purchased in Canada, the U.S. and Mexico between December 2014 and April 2015 and 717 samples were collected from these products (245 of which were from products purchased in Canada). TBB and TBPH were found in foam from a sofa that was purchased in Canada at levels of 3.9% w/w and 1.4% w/w, respectively (CEC 2015). Finally, TBB and TBPH were also measured at concentrations up to 154.4 and 11.6 mg/g, respectively, in flexible polyurethane foam from vehicles (n=18) collected from salvage yards in the Greater Toronto Area, in Canada (Mochungong et al. 2014).
Based on the available information, dermal and oral exposures for direct contact with flexible polyurethane foam manufactured items were estimated (Table 10‑1). Dermal exposure intakes were estimated for children and adults in contact with foam mattresses. The migration rate of 1.97 × 10⁻⁵ mg/cm2/hr for the TBB/TBPH/Organophosphate mixture, based solely on measuring the migration of TBB from the foam, was used to estimate dermal exposures based on a migration study of treated furniture foam covered with fabric by the US CPSC (US CPSC 2005b). The migration study was based on a foam concentration of 6.8% for the TBB/TBPH/Organophosphate mixture which was considered appropriate based on reported levels of total TBB and TBPH up to 7% (Health Canada 2014). TBB is more water soluble than TBPH (see Section 3) and the migration study was liquid-mediated using an aqueous saline solution (US CPSC 2005b), therefore this migration rate is likely higher than what would be found were TBPH to be measured. Dermal absorption of TBB and TBPH through human skin has been investigated in two in vitro studies (Frederiksen et al. 2016; Knudsen et al. 2016a). TBB was reported to have an absorption of approximately 11%, while TBPH was reported to have an absorption of approximately 8 to 10% (Frederiksen et al. 2016; Knudsen et al. 2016a). Since the migration rate used in the exposure estimates was based on TBB migration, the dermal absorption value for TBB was selected for use in dermal uptake estimates. However, since higher absorptions could be possible due to different use conditions or with the inclusion of TBPH absorption, an upper value of 100% absorption was also considered in the estimates.
Oral exposure intakes were also estimated for infants and toddlers mouthing children’s manufactured items containing foam (e.g., nap maps, children’s chairs). In the absence of mouthing-specific migration rates, the migration rate used for the dermal scenario was applied for the oral scenario of children mouthing foam-containing objects. It was assumed that infants and toddlers mouth foam-containing items for 24.5 minutes per day (Norris and Smith 2002 cited in US EPA 2011). Complete details on the dermal and oral scenarios are provided in Appendix G.
The highest estimated uptake for dermal exposure to TBB plus TBPH was 5.8×10⁻² mg/kg bw/d for infants. The estimated intake for both infants and toddlers mouthing foam objects was found to be 1.0 ×10⁻⁵ mg/kg bw/d.
| Exposure Route and Duration | Source | Age Group | Systemic exposure to TBB+TBPH |
|---|---|---|---|
| Dermal (daily) | Foam in children’s mattresses | Infant (0-6 mos; 7.5 kg) | 1.9×10⁻³ – 5.8×10⁻² mg/kg bw/d |
| Dermal (daily) | Foam in children’s mattresses | Toddler (0.5-4 yr; 15.5 kg) | 1.3×10⁻³ – 4.4×10⁻² mg/kg bw/d |
| Dermal (daily) | Foam mattresses | Adult (70.9 kg) | 5.0×10⁻⁴ – 2.0×10⁻² mg/kg bw/d |
| Oral (Intermittent) | Foam in children’s manufactured items | Infant (0-0.5 yr; 7.5 kg) Toddler (0.5-4 yr; 15.5 kg) | 1.0 ×10⁻⁵ mg/kg bw/d |
While exposure to other manufactured items treated with TBPH only or the TBB/TBPH mixtures may be possible, the overall exposure potential (frequency, duration, and magnitude) for these scenarios are not expected to result in higher exposures than those quantitatively presented for flexible polyurethane foam.
10.1.3 Biomonitoring
TBB and TBPH have been measured in human serum in Canada. TBB and TBPH were detected in 57% and 17%, respectively, of maternal serum (blood) samples collected from 2008 to 2009 from mothers following delivery in Sherbrooke, Quebec (Zhou et al. 2014). These serum samples were collected from the same study cohort from which breast milk samples were collected (see section 10.1.1.7). TBB and TBPH concentrations in serum ranged from not detected (detection limit = 0.38 ng/g) to 68 ng/g lipid weight (lw) and not detected (detection limit = 7.3 ng/g) to 164 ng/g lw, respectively, with median values of 1.6 and <7.3 ng/g lw, respectively. The 95th percentile concentrations of TBB and TBPH for this cohort were reported at 22 and 33 ng/g lw, respectively. This study was the first report of the presence of TBB in human serum.
TBB and TBPH were targeted in a paired mother-toddler biomonitoring study in Sweden involving 24 mothers and their toddlers (11 to 15 months). TBB and TBPH were not detected (method quanitification limits, mLOQ, of 30 and 100 pg/sample, respectively) in serum samples collected from both mothers and toddlers (Sahlström et al. 2014). In China, TBPH was detected in only one of the 10 pooled human serum samples based on sex and age collected from 164 men and 141 women residing within 10 km of a production site of halogenated flame retardants in Laizhou Bay (He et al. 2013). The single value of 260 ng/g lw was associated with the 30 to 39 year old pool comprised of women, and was approximately double the maximum value (164 ng/g lw) measured in the Canadian study. This Chinese study represented the first report of TBPH in humans, and TBB was not measured in this study.
A method has been developed to quantify exposure to the TBB/TBPH/Organophosphate mixture in humans (Hoffman et al. 2014). The TBB urinary metabolite, 2,3,4,5-tetrabromobenzoic acid (TBBA), was selected as the biomarker of exposure to TBB/TBPH/Organophosphate mixture because there are no known additional uses of TBB, while other commercial products exist for the other components (e.g., TBPH) of the mixture. The method was applied to a U.S. cohort of adult volunteers (n=64) residing in North Carolina. One group of participants (n=53) provided one daily spot urine sample (along with dust samples and handwipes; see section 10.1.1.3), and another group (n=11) provided spot urine samples over five consecutive days. TBBA was frequently detected (72.4%) in adult urine samples (n=64). Median concentrations of urinary TBBA (corrected for specific gravity) for the larger group (n=53) was 5.36 pg/mL, with a maximum of 340.6 pg/mL. The authors noted that TBBA levels were highly variable between study participants, indicating either potential differences in exposure patterns or in TBB metabolism between subjects. The authors also hypothesized that TBB was rapidly metabolized to TBBA, and that the spot urine sample was likely indicative of recent exposure (i.e., less than one day previous). Also, repeated samples (n=11) collected over five consecutive days indicated moderate temporal reliability. While the authors did not observe significant correlations between dust concentrations and TBBA levels in urine, levels in handwipes were positively correlated with urinary TBBA (Hoffman et al. 2014).
An additional study was recently published on TBBA, the TBB metabolite, in urine spot samples collected from 21 mother-toddler pairs from New Jersey, U.S., in 2013 and 2014 (Butt et al. 2014). Overall, the cohort was highly educated, mostly Caucasian and of high socioeconomic status. TBBA was detected in 16 of 23 children (70%) and in 6 of 22 adults (27%). Children’s TBBA levels (normalized to specific gravity) ranged from not detected (MDL of 3.0 pg/mL) to 84.9 pg/mL. The authors noted that the geometric mean level in children of 7.4 pg/mL was comparable to that in adults from the North Carolina study (geometric mean of 5.6 pg/mL, specific gravity normalized; Hoffman et al. 2014). Due to the low detection frequency of TBBA in adults in this study, the adult geometric mean was not calculated, and statistical tests comparing mother-child levels could not be performed. However, children’s TBBA levels were higher in all 15 pairs for which there was a detectable level in the child, suggesting that TBB exposure was higher in children as compared to their mothers (Butt et al. 2014).
In the United States, spot urine samples from the 2013-2014 National Health and Nutrition Examination Survey (NHANES) were analyzed for TBBA (Ospina et al. 2018). Of the 2666 samples, TBBA was detected in 5% of the samples (LOD = 0.05 µg/L for both substances). As such, the geometric mean concentrations of TBBA for all age groups could not be calculated. The unadjusted 95th percentile value for the total population (6 to 60 years and older) was 0.050 µg/L and for children 6 to 11 years old (the only age group with concentrations above the LOD) was reported to be 0.070 µg/L (the 95th percentile concentration for all other age groups was below the LOD) (Ospina et al. 2018). It should be noted that the data from Ospina et al. (2018) had a much lower detection frequency compared to the other two studies (Hoffman et al. 2014, Butt et al. 2014) likely as a result of its higher LOD (50 pg/mL compared to 3.0 pg/mL).
Based on the available information, the predominance and specificity of TBBA make it a suitable biomarker for exposure to TBB. Reverse dosimetry was used to estimate daily intakes of TBB based on urinary TBBA concentrations identified in the three studies described above and results are shown in Table 10‑2. Briefly, as per Aylward et al. (2012) (equation 1), reverse dosimetry is based on measured spot urinary concentrations, assumptions regarding 24-h urinary volume, and data on the fraction of ingested parent compound excreted in urine (i.e., the fractional urinary excretion, or FUE). The FUE selected was based on a rodent toxicokinetic study, where 43% to 65% of radiolabelled TBB (exclusively in the form of TBBA) in urine was recovered 24 hours following the oral administration of single and repeated doses of 0.1 µ mol/kg of TBB in female rat and male mice (Knudsen et al. 2016b). Although Hays and Kirman (2017) derived an FUE of 0.6 for TBB in urine based on the similar data from Knudsen et al. (2014 as cited in Hays and Kirman 2017), an FUE of 0.45 (mid-point value between the single 24 hour dose in rats (43%) and mice (47%) was selected for derivation of the intake estimates for TBB as a conservative approach. More details of toxicokinetic information are described in section 10.2.1. Details regarding the reverse dosimetry are provided in Appendix H.
| Study | Participants | Location | TBBA urinary concentrations (pg/mL) | Reverse dosimetry intake estimates for TBB only (ng/kg-bw/day) |
|---|---|---|---|---|
| Ospina et al. (2018) | Children (6 to 11 yrs) (n=421) | U.S.A. | < 50a [0.174 µg/g creatinine] (P50) 70a [0.235 µg/g creatinine] (P95) | 5.1 (P50) [10.2] 7.2 (P95) [13.8] |
| Ospina et al. (2018) | Teens (12 to 19 yrs) (n=427) | U.S.A. | < 50a (P50 and P95) [0.174 µg/g creatinine] | 5.3 (P50 and P95) [11.5] |
| Ospina et al. (2018) | Adults (20 to 60+ yrs) (n=1818) | U.S.A. | < 50a (P50 and P95) [0.174 µg/g creatinine] | 5.3 (P50 and P95) [11.6] |
| Butt et al. 2014 | Toddlers (1 – 5 years) (n=23) | New Jersey, U.S. | 7.4b (geometric mean) 84.9b (maximum) | 0.9 (geometric mean) 10.7 (maximum) |
| Hoffman et al. 2014 | Adults (women and men) (n=64) | North Carolina, U.S. | 5.6c (geometric mean) 340.6b (maximum) | 0.6 (geometric mean) 36.2 (maximum) |
Abbreviations: P50, 50th percentile; P95, 95th percentile
a Concentrations shown are unadjusted for hydration status and creatinine adjusted concentrations are shown in brackets (as reported in the studies)
b Concentrations are normalized to specific gravity (as reported in the studies).
The range in intakes of TBB based on reverse dosimetry for toddlers, children, teens and adults were similar to the deterministic intake estimates of both TBB and TBPH combined (1.8 to 78 ng/g kg-bw/d) (see Appendix E). However, given the likely short half-life of TBB, reverse dosimetry spot urine sampling is variable and may not reflect upper bound exposures given within-individual and within-day variability (Aylward et al. 2012). Knudsen et al. (2014, 2016b) described TBB as being rapidly metabolized, and Hoffman et al. (2014) showed that TBBA in urine from rats exposed to the TBB/TBPH/Organophosphate mixture increased significantly during the first 2 to 3 hours following exposure, but appeared to level off around 6 to 8 hours post-exposure.
Despite these limitations, reverse dosimetry has been characterized as a useful method of exposure assessment for environmental chemical exposures because it demonstrates and measures stable markers for biologically absorbed chemicals in the body (Sexton et al. 2004; Aylward et al. 2012). However, some limitations in the reverse dosimetry values presented above should be noted. Although two of the studies are based on small cohorts from the U.S., the data from Ospina et al. (2018) is considered nationally representative and is likely representative of the Canadian population given the similarity of uses and availability of products in the US and Canadian markets. Also, while there is little uncertainty that TBBA is an appropriate in vivo biomarker of TBB exposure, the FUE value (based on a rat toxicokinetics study), and its use for humans, is an uncertainty. Roberts et al. (2012) demonstrated that formation of TBBA was significantly faster in rat liver microsomes in vitro as compared to other rat tissues and human tissues examined in the same study. Finally, the assumption of equivalent absorption, distribution, metabolism and elimination between age groups (adults and children), and between individuals (males and females) over time is an additional uncertainty.
10.2 Health effects
No classifications of the health effects of TBPH or TBB by national or international regulatory agencies were identified. No chronic toxicity/carcinogenicity studies were identified. Little information was available for TBB; however, limited data are available regarding the short-term repeat-dose toxicity, acute toxicity and genotoxic effects of TBPH as well as reproductive and developmental effects of the TBB/TBPH mixture.
10.2.1 Toxicokinetics
Metabolism of TBPH or TBB:
Information on the metabolism of TBPH or TBB in mammals is limited. In a recent study, Hoffman et al (2014) assessed human exposure to TBB/TBPH/Organophosphate mixture in adult male and female human volunteers (n = 64). Results indicated frequent but highly variable detection of TBBA, a metabolite of TBB, in human spot urine samples. In the same study, a single dose 1 mg exposure of TBB/TBPH/Organophosphate mixture in rats showed elimination of TBBA in urine which peaked at about 3 hours and levelled off at around 6 to 8 hours. These results showed rapid formation of TBBA from TBB and also fast elimination of TBBA from the body suggesting limited possibility of bioaccumulation of TBB. In this toxicokinetics study, the authors only screened for TBB (and its metabolite) as a biomarker of TBB/TBPH/Organophosphate mixture exposure as TBB is thought to be limited to TBB/TBPH/Organophosphate mixture whereas TBPH is present in other commercial products (Hoffman et al. 2014). Interestingly, TBBA was identified as a major metabolite in serum and urine samples (after 24 hr) when nine adult female SD rats were exposed to a single gavage dose (500 mg/kg bw in corn oil) of a commercial flame retardant mixture which contained > 95% TBPH and <5% TBB. In this study a minor metabolite, TBPA (2,3,4,5-tetrabromo phthalic acid) was suggested as a TBPH-specific biomarker (Silva et al 2015). However, extensive metabolism studies would be required to reach a definite conclusion.
In another toxicokinetics study, female rats and male mice were given TBB and TBPH via intravenous (IV) or oral route (dose vehicle specified as corn oil) and TBB [14C] radioactivity was measured in urine and feces. Results indicated fecal recovery was minimal before 24 hr; however, total recovery of more than 93% of TBB in urine and feces was observed 72 hours after single or repeat-dose oral (0.1, 1.0, 10, or 100 µmol/kg) or IV (0.1 µmol/kg) administration. Three metabolites of TBB (TBBA, TBBA-glycine and TBBA-sulfate) were apparent in urine and feces following single or repeat-dose administration. Parent to metabolite ratio varied with dose but not following single vs repeat-dose exposure (Knudsen et al. 2016b). About 20 to 30% of the IV administered TBB appeared in feces as metabolites and retention of TBB in tissue was minimal. In contrast, TBPH was eliminated principally in feces after oral or IV exposure in rats (0.1 or 10 µmol/kg) and mice (0.1 µmol/kg). However, 75% of the TBPH (0.1 µmol/kg) given by IV appeared in feces as metabolites, indicating the importance of biliary excretion (Personal communication with G. Knudsen and ESRAB; unreferenced).
The metabolism of TBPH or TBB was studied in human or rat liver or intestinal subcellular fractions (cytosol or microsomes) and porcine carboxylesterase (PCE) in vitro. No metabolites of TBPH were detected in human or rat subcellular fractions and no loss of TBPH was observed in human liver microsomes. However, TBPH slowly metabolized to form TBMEHP (mono(2-ethyhexyl) tetrabromophthalate) in the presence of purified PCE (Roberts et al. 2012; Springer et al. 2012). Also, no phase II TBPH metabolites, including those from sulfation, glucuronidation or glutathione conjugation in human liver microsomes and cytosol were detected (Roberts et al. 2012). In contrast, TBB rapidly metabolized to TBBA in human or rat liver microsomes. The hydrolysis of TBB to TBBA was likely catalyzed by the carboxylesterases present, also releasing 2-ethylhexanol. No other metabolites were detected in this study (Roberts et al. 2012). There was no indication of the involvement of cytochrome P450 enzymes; however, the authors hypothesized that carboxylesterases were responsible for the metabolism of TBB, as TBB was converted to TBBA when incubated with PCE. It was proposed that a similar mechanism may be present in humans because both human and porcine carboxylesterases were previously shown to catalyze metabolic reactions in a similar manner (Huang et al. 1996); however, this was not clear in the Roberts et al. (2012) study. Species-specific evaluation of metabolism revealed that formation of TBBA was significantly faster in vitro in rat liver microsomes as compared to microsomes from other rat and human tissues in the same study, but was similar to TBBA formation in PCE.
Limited information is available regarding the metabolism of TBPH or TBB in mammals. Based on the information available, it is suggested that rapid metabolism of TBB may reduce its potential for bioaccumulation; conversely, slower metabolism of TBPH than TBB may cause longer residence time of TBPH in mammalian tissue. The presence of bulky bromines at TBPH and TBB may resist the complete debromination of these two substances in mammals, as observed in a photodegradation study (Davis and Stapleton 2009).
10.2.2 Carcinogenicity and genotoxicity
TBPH:
Carcinogenicity
No chronic toxicity/carcinogenicity studies were identified for TBPH or the commercial mixtures of TBPH and TBB.
Genotoxicity
The genotoxicity data for TBPH are generally negative. The mutagenic potential of TBPH was examined in vivo (Micronucleus assay) by intraperitoneal (80, 400, or 2000 mg/kg bw/d) or intradermal (2000 mg/kg bw/d; given on 5 separate occasions, 24 hours apart) administration of TBPH to male and female mice. There was no increase in the number of micronucleated erythrocytes in bone marrow of treated mice, whether TBPH was given intraperitoneally or intradermally. It was concluded that TBPH was not clastogenic in male or female mice (Pennwalt Corporation 1987a).
In an in vitro Ames assay, Salmonella typhimurium strains (TA 98, 100, 1535, 1537 and 1538) were exposed to various concentrations of TBPH (50, 158, 500, 1580, and 5000 µg/plate dissolved in 0.1 ml of dimethyl sulfoxide (DMSO) with or without metabolic activation or 0.10 to 150 µL/plate with or without metabolic activation) in order to examine the mutagenicity of TBPH. No genotoxicity was observed for TBPH (Pennwalt Corporation 1987b; Hazelton 1986).
The DNA damaging potential of TBPH was investigated by using a Chromosomal Aberration (CA) assay in which human lymphocytes were exposed to 0, 40, 200 or 1000 µg/ml of TBPH. TBPH was weakly clastogenic at the highest dose (1000 µg/mL) (Pennwalt Corporation 1987c).
Due to the paucity of information, the in silico QSAR prediction tools/models available at the Existing Substances Risk Assessment Bureau (ESRAB) were used in order to predict the carcinogenicity or genotoxicity potential of TBPH or TBB. The carcinogenicity potential of TBPH or TBB was predicted positive by the CaseUltra or ModelApplier models, but these models considered DEHP as a structural analogue (ESRAB 2014). However, the available literature does not support the similar mechanism of action of TBPH and DEHP (Pennwalt Corporation 1988). TBPH and TBB were also predicted as non-genotoxic by (Q)SAR models (Percepta, Toxtree, Model Applier, TIMES, CaseUltra and Derek Nexus) (Table 10‑3). These negative predictions for genotoxicity are supported by the limited empirical data which also showed no genotoxicity potential for TBPH in the in vitro and in vivo assay systems (Huntingdon Life Sciences, Ltd., 1997a,b; Pennwalt Corporation 1987a,b,c).
Commercial TBB/TBPH mixture:
No mutagenicity was observed when up to 5000 µg/plate of TBB/TBPH mixture was examined in vitro by incubating it in Salmonella typhimurium or Escherichia coli gene mutation assay (Huntingdon Life Sciences, Ltd. 1997a). Similarly, TBB/TBPH mixture was not clastogenic in a chromosomal assay when human lymphocytes were exposed to 78.1 to 5000 µg/mL of the test substance with or without metabolic activation (Huntingdon Life Sciences, Ltd. 1997b).
Based on the available information, i.e., generally negative genotoxicity data and the absence of adverse effects in acute or short-term studies, the carcinogenicity potential of TBB, TBPH or TBB/TBPH mixture) is low, at human relevant concentrations.
10.2.3 Reproductive and developmental toxicity
TBPH:
No studies were identified regarding the reproductive or developmental toxicity potential of TBPH.
Commercial TBB/TBPH mixture:
Details of the reproductive and developmental studies and selected critical effects are presented in Appendix H. In a two-generation reproductive toxicity study, TBB/TBPH mixture was administered by gavage to groups of 25 male and female CD rats daily at doses of 15, 50 and 165 mg/kg bw/d mixed in peanut oil (5 ml/kg) and the effects were examined in the P0, F1 and F2 generation (MPI Research Inc. 2008a). In the P0 generation, a significant reduction was seen in premating food consumption and body weight and gestation body weight only in P0 females in 165 mg/kg bw/d group. The F1 male and female pups had a statistically lower body weight at birth and at lactation, but only in the high dose group (165 mg/kg bw/d). Also, a significant reduction was seen in premating, gestation, and lactation body weight, but only in the F1 females in the high dose group.
A significant reduction in body weight (at birth) was also seen in male and female F2 pup in the 50 or 165 mg/kg bw/d dose group; as well, a statistically significant increase was seen in anogenital distance (AGD) in F2 female pups at both 50 mg/kg bw/d and 165 mg/kg bw/d and a significant increase in the thymus weight relative to body weight in F2 male or female pups only in the 50 mg/kg bw/d group. The authors of this study considered these findings as sporadic and not dose-related.
Although the study authors did not consider the above mentioned effects as significant, Health Canada’s evaluation is different from that of the study authors based on the fact that the most consistent effect observed in P0, F1 and F2 generation was decreased body weight, reduced body weight gain and food consumption.
The decrease in the body weight of F2 pups at birth was considered an adverse effect by Health Canada, therefore, a LOAEL of 50 mg/kg bw/d and NOAEL of 15 mg/kg bw/d were identified in this evaluation (Appendix H). The NOAEL of 15 mg/kg bw/d was selected to establish a margin of exposure (MOE). Low birth weight is usually associated with several factors including reduced maternal food intake, reduced maternal body weight or body weight gain or transfer of toxins to fetus via placenta (Beyer et al. 2011; Reyes and Manalich 2005). The low birth weights have been associated with many developmental or behavioral problems in animals and humans (Addison et al. 2009; Beyer et al. 2011). Moreover, a significant increase seen in the AGD in F2 female pups in 50 or 165 mg/kg bw/d dose group also indicates the potential of the mixture of TBPH and TBB to produce reproductive effects especially during the critical window of development in rats. An increase or decrease in the AGD is considered a sensitive indicator of reproductive toxicity by the reproductive biologists; however, in the absence of dose-related effects and no adverse biochemical or physical effects, the increase in AGD in F2 female pups (MPI Research Inc. 2008a) was considered as additional evidence of the toxicity of TBB/TBPH mixture. A non-dose-related increase in thymus weight and a decrease in spleen weight were considered not to be of toxicologic importance by Health Canada evaluators in the absence of histopathological changes.
In a developmental study, TBB/TBPH mixture was administered via gavage to time-mated SD female rats once daily at doses of 0, 50, 100 or 300 mg/kg bw/d from GD 6 to 19 and animals were sacrificed on GD 20 (MPI Research Inc. 2008b).
In this study, maternal toxicity was observed following 100 and 300 mg/kg bw/d exposure to TBB/TBPH mixture and the signs of toxicity included hair loss at the abdominal region, statistically lower maternal body weight and weight gain, and lower food consumption. A significant decrease in fetal body weight was seen in 100 or 300 mg/kg bw/d dose groups as compared to control. No fetal skeletal abnormalities were observed at 50 or 100 mg/kg bw/d dose, however, exposure to 300 mg/kg bw/d of TBB/TBPH mixture caused malformations such as fused cervical vertebral arches in two fetuses (one fetus each from different litters), which were considered dose-related. There was also an increased incidence of variation in fetal ossification, incompletely ossified skull bones and unossified sternebrae. The study authors identified a NOAEL of 50 mg/kg bw/d for maternal and developmental toxicity (MPI Research Inc. 2008b).
Overall, based on the available data from the above reported reproductive or developmental studies, it appears that exposure to the mixture of TBPH and TBB may not produce adverse effects in the reproductive or developmental endpoint following short-term exposure at human relevant concentrations.
10.2.4 Other systemic effects
TBPH:
Short-tem, repeated-dose (28-day) toxicity of TBPH and TBMEHP
Male and female Sprague-Dawley (SD) rats received dietary exposure to 0, 200, 2000 or 20000 ppm (0, 22, 223.4 or 2331 mg/kg bw/d, dose conversion by study author) of TBPH for 28 days.
No mortality or clinical signs of toxicity were observed in any group treated with TBPH. A slight decrease was seen in body weight in high-dose females. There was a significant decrease in alanine aminotransferase (ALT) activity in females in the high- dose group and marginally low blood phosphorous (P) levels were seen in females in all dose groups and males in the high-dose group only. No other adverse effects were noted following gross, histopathological, hematological or biochemical examination. Electron microscopy of liver was negative for peroxisome proliferation.
In comparison, exposure to 15 000 ppm (1507 mg/kg bw/d) of DEHP caused lower food consumption, lower bodyweight gain and high food conversion ratio in rats in the positive control group. Moreover, the DEHP-treated rats had hair loss on the ventral side and had higher platelet numbers, high alkaline phosphatase activities, urea and albumin concentration and albumin to globulin (A/G) ratios in males, and low alanine and aspartate amino-transferase activity in females. Changes in organ weight included higher liver and low testes weights. The males in the positive control group also had small and flaccid testes. Histopathological changes in DEHP rats included panacinar hepatocytic granular eosinophilic extensive cytoplasm in males and females, a lack of centriacinar hepatocytic glycogen in males, and a lack of germinal epithelium in the testes (Pennwalt Corporation 1988).
TBPH has been suggested to be metabolized or debrominated to form DEHP and may cause toxicity in animals (Roberts et al 2012; Springer et al 2012). DEHP is a known male reproductive toxicant and has been proposed to induce hepatotoxicity by activation of peroxisome proliferator activated receptor α (PPARα) by its metabolite, mono(2-ethylhexyl) phthalate (MEHP) in rats and mice (Rusyn et al. 2006).
The above data signifies that TBPH, which has been suggested as a brominated analogue of DEHP (Roberts et al. 2012; Springer et al. 2012) did not cause adverse effects in rats as compared to DEHP which produced frank toxicity in the same study. A NOAEL of 223.4 mg/kg bw/d and a LOAEL of 2331 mg/kg bw/d was identified for TBPH (Pennwalt Corporation 1988). These studies suggest that despite the similarities in the chemical structure, TBPH and DEHP do not produce similar adverse effects and possibly act through different mode of action in animals.
In a short-term study, timed pregnant Fischer 344 rats were exposed (on GD 18 and 19) via gavage to 0, 200 or 500 mg/kg bw/d of TBMEHP. Results indicated a significant decrease in liver alkaline phosphatase (ALP) and a significant increase in alanine transaminase (ALT) levels in the dams receiving 500 mg/kg bw/d of TBMEHP. Blood urea nitrogen (BUN) levels were significantly higher and calcium (Ca+2) levels decreased significantly in dams in the high-dose group. Serum cholesterol and T3 levels decreased significantly in a dose-dependent manner, but no changes were seen in serum T4 levels. Histopathological exam of dam liver showed proliferation and apoptosis in the high dose group (500 mg/kg bw/d), but no changes were seen in the kidney or thyroid gland. Also, no changes were seen in the organ (liver, kidney adrenal or ovary) weights at any dose. There was a significant increase in multinucleated germ cells (MNGs) in seminiferous cords in testes of fetuses born to dams who received the high dose of TBMEHP (500 mg/kg bw/d). Ex vivo incubation of fetal testes with TBMEHP showed no changes in testosterone (T) production as compared to control. This study also revealed that unlike MEHP (a metabolite of DEHP), in utero exposure to TBMEHP did not cause reduction in testosterone production and did not have an antiandrogenic action as seen following MEHP exposure (Springer et al. 2012). Despite the suggestions that TBMEHP and MEHP look structurally similar, these two metabolites do not appear to act in the same manner which further supports TBPH and DEHP having dissimilar properties.
In the same study, a dose-dependent decrease was observed in vitro in the activity of deiodinase enzyme when rat hepatic microsomes were co-incubated with TBMEHP at concentrations of 0, 0.2, 2, 20, 100 or 200 µM. Murine NIH 3T3 L1 cells treated with 0, 10, 50, or 100 µM of TBMEHP for 7 days caused significant stimulation of lipid accumulation after 50 or 100 µM dose, although, with lower efficacy as compared to the MEHP positive control. TBMEHP treatment caused an increase in the expression of adipocyte-specific protein, Perilipin and also induced the activation of PPARα and PPARγ and AOX or FABP4 genes driven by them, respectively. The efficacy of TBMEHP was lower than MEHP (100 µM) which is a metabolite of DEHP. Interestingly, not TBPH, but TBMEHP up-regulated FABP4 and AOX genes; therefore, TBMEHP was proposed as an environmental obesogen by the study authors (Springer et al. 2012). This information should be considered preliminary as these observations have been made in in vitro murine cells and its relevance in humans is not clear.
Exposure to TBMEHP in vitro caused alterations in thyroid hormones (due to inhibition of deiodinase) and changes in fetal testis and liver function which were linked to PPARα or γ agonist activity of TBMEHP (Springer et al. 2012). The relevance of this mode of action to humans is debatable (Ito and Nakajima 2008). This study identified several potential effects of TBMEHP in various in vitro or in vivo systems; however, effects were usually noticed after high-dose exposure and were subtle as compared to those induced by its proposed analogue MEHP. Moreover, evidence suggests that TBPH is not metabolized to TBMEHP in human microsomes (Roberts et al 2012); therefore, it is too early to draw conclusions about the relevance of the mode of action of TBMEHP in humans.
QSAR analysis of TBPH, TBB and their metabolites to examine the similarity with their proposed structural analogues
TBPH and its metabolite TBMEHP are of interest to scientists as both compounds have been proposed to be structurally or functionally similar to DEHP and its metabolite MEHP, respectively (Roberts et al 2012).
TBPH has been suggested to be a a brominated analogue of DEHP, which in animals is known to cause adverse effects on reproduction and development, and has also shown the potential to cause alterations in the endocrine system (EURAR 2008).
The available empirical data do not provide evidence that TBPH or DEHP have similar effects. In a repeated-dose (28-day) toxicity study TBPH did not induce hepatotoxicity or peroxisome proliferation in rats (Pennwalt Corporation 1988). However, exposure to DEHP produced signs of toxicity including lower food consumption, lower bodyweight gain and high food conversion ratio in rats. Moreover, the DEHP-treated rats also showed adverse biochemical, gross or histopathological changes (Pennwalt Corporation 1988g) which were not even qualitatively similar to the effects of TBPH.
In an in vitro study with human salivary esterase, DEHP metabolized to MEHP at about a 100 time faster rate than TBPH which indicated differences between the hydrolysis of TBPH and DEHP (Niino et al. 2003). It is possible that these differences could be because of the reduced metabolic hydrolysis due to steric hindrance caused by the fully brominated TBPH (Roberts et al. 2012). It is suggested that such differences in structure could be a reason for different properties of TBPH as compared to DEHP (e.g., differences in receptor binding and metabolism, etc.)
To investigate further, Health Canada carried out a QSAR analysis to determine the ability of these flame retardants, their potential metabolites and DEHP to bind to the estrogen or androgen receptor (See Table 10‑3).
| Effect/(Q)SAR model | TBPH | TBMEHP | TBB | TBBA | DEHP | MEHP |
|---|---|---|---|---|---|---|
| ER binding affinity TIMES | Weakly active (as metabolite) | Weakly active | Not active | Not active | Weakly active | Weakly active |
| ER binding Toolbox profiler | Non-binder | Non-binder | Non-binder | Non-binder | Non-binder | Non-binder |
| ER binding US EPA Exp system | Unknown | Not active | Unknown | Not active | Not active | Not active |
| ER binding CaseUltra | Not active | Not active | Not active | Not active | Positive | Positive |
| ER binding Percepta | Non-binder | Non-binder | Non-binder | Non-binder | Non-binder | Non-binder |
| AR binding affinity TIMES | Not active | Not active | Not active | Not active | Not active | Weak |
| AhR binding TIMES | Non-binder | Non-binder | Non-binder | Non-binder | Non-binder | Non-binder |
Briefly, these (Q)SAR models predicted no potential of TBPH or TBB or their metabolites (TBMEHP or TBBA, respectively) for binding to estrogen, androgen or aryl hydrocarbon receptor (See Table 10‑3). This is similar to the data in a recently published study which reported no binding ability of TBPH or TBB and no TCDD-like activity of these substances in vitro (Saunders et al. 2013). Similarly, in a luciferase reporter assay, TBPH or TBB did not show any binding potential towards the estrogen receptor (ER) (Pers. comm., EHSRB, 2014). In the QSAR analysis, the only exception was the Oasis TIMES model which predicted weak activity for TBPH based on its simulated tetrabrominated monoester metabolite TBMEHP, which appears to be a favoured metabolite of TBPH in in vitro studies (Roberts et al 2012). This prediction is similar to that obtained for the metabolite MEHP for the chemical DEHP. However, MEHP has also been flagged by CaseUltra and Times AR binding, whereas for TBMEHP, the metabolite of TBPH was not flagged by these models.
Based on the above observations, it is suggested that although TBPH and DEHP appear similar in structure, the presence of bromine in TBPH may cause important differences in physio-chemical properties, binding ability to the receptors, and potency or mode of action of the two substances. However, more empirical evidence is needed to further elucidate mode(s) or mechanism(s) of action.
Short-term repeated-dose (28-day) toxicity of the commercial TBB/TBPH mixture
Repeated-dose exposure to TBB/TBPH mixture at doses of 0, 160, 400 or 1000 mg/kg bw/d via gavage for 28 days (followed by 14-day recovery period) in male and female SD rats did not cause mortality in any dose group. The exposure-related effects were primarily observed in females in the 1000 mg/kg bw/d group, and included significant decrease in food consumption, reduced body weight gain, and relaxed vaginal openings in all females throughout the treatment. Increased salivation was observed in both sexes in the high-dose group only (1000 mg/kg bw/d). Moreover, there was a significant increase in the albumin-globulin (A/G) ratio and serum chloride levels in male or female rats in the 1000 mg/kg bw/d group. Regeneration of renal tubular epithelium was also noted in all animals in all treatment groups. All of the changes were reversible and the animals recovered fully within the two-week recovery period. A NOEL and a LOEL for systemic toxicity and kidney effects was identified as less than or equal to160 mg/kg bw/d, respectively, by the study authors (WIL Research Laboratories, Inc.1997e), which is agreed upon in the present evaluation.
Acute effects of TBPH
Acute exposure to TBPH did not cause mortality or signs of toxicologic significance in experimental animals.
The oral LD50 for TBPH was reported as greater than 5000 mg/kg bw/d in male and female CD rats. A single oral (gavage) dose of 5000 mg/kg bw/d of TBPH did not cause any mortality or signs of toxicity (Jadlocki and Seckar 1987; WIL 1986a).
Similarly, a single dermal application of 2 ml/kg of TBPH on shaved skin of male or female New Zealand white rabbits did not cause mortality or toxicity and the study author reported the dermal LD50 greater than 2000 mg/kg or equivalent to 3090 mg/kg bw/d (Pennwalt Corporation 1987h; WIL 1986b).
Acute effects of the commercial TBB/TBPH mixture
Limited information is available regarding TBB/TBPH mixture. In the absence of adequate information about TBPH and TBB singly, information available for TBB/TBPH mixture was used to inform the evaluation.
The LD50 of TBB/TBPH mixture was reported as greater than 2000 mg/kg bw/d in male or female SD rats (Huntingdon Life Sciences Ltd. 1996d). In another study, the oral LD50 of TBB/TBPH mixture was reported as greater than 5000 mg/kg bw/d in male and female Crl:CD BR rats. No mortality or macroscopic changes were observed (WIL Research Laboratories Inc. 1997f).
A single dermal dose of 2000 mg/kg bw/d of TBB/TBPH mixture did not cause any adverse effects in male or female Crl:CD BR rats, but slight or reversible erythema or desquamation was seen in two females. The dermal LD50 was reported as greater than or equal to 2000 mg/kg bw/d (WIL Research Laboratories Inc. 1997b). Similarly, a single dose (0.5 ml) of undiluted TBB/TBPH mixture caused slight, but reversible irritation male or female New Zealand rabbits (WIL Research Laboratories Inc. 1997c).
10.2.5 Irritation and sensitization
TBPH:
Slight irritation of the eye was noted following instillation of 0.1 ml of TBPH into the lower eyelid of male or female New Zealand rabbits. These effects were reversible and the eyes were normal 24 hours after the exposure (Pennwalt Corporation 1987d; WIL 1986c). Similarly, TBPH caused very slight (HPVIS 2012) or no (ECHA Dossier) dermal irritation (Pennwalt Corporation 1987e; WIL 1986d).
The skin sensitization potential of TBPH was reported negative in Dunkin-Hartley Guinea pigs when examined using the Buehler test (Pennwalt Corporation 1987f).
Commercial TBB/TBPH mixture:
Instillation of 0.1 ml of TBB/TBPH mixture in the eye of male or female New Zealand rabbits caused slight irritation which was reversible and completely subsided within 4 days or less (WIL Research Laboratories Inc. 1997a).
The skin sensitization potential of TBB/TBPH mixture was examined by using Buehler test. Exposure to undiluted TBB/TBPH mixture did not result in sensitization of skin in Guinea pigs (WIL Research Laboratories Inc. 1997d; NICNAS 2004). However, in a Guinea Pig Maximization Test (GPMT), induction with intradermal injection (80% commercial mixture in Alembicol D) followed by topical application (96% commercial mixture) caused slight to well-defined irritation in 3 out of 10 (30%) guinea pigs after challenge with TBB/TBPH mixture (50% v/v in Alembicol D), and it was reported as a substance which has a potential to cause skin sensitization (Huntingdon Life Sciences Ltd 1999c).
10.3 Characterization of risk to human health
TBPH:
Results of a repeated-dose toxicity study showed that dietary exposure to TBPH for 28 days did not produce any signs of toxicological significance in male or female rats (Pennwalt Corporation 1988). No significant changes were seen after gross or histopathological exam of the tissue and there was no evidence of peroxisome proliferation (PPAR-α) in the liver of TBPH-treated rats. The LOAEL of 2331 mg/kg bw/d was identified as this was the highest dose at which decrease in ALT, or P levels was seen; however, these effects were seen only in females in the absence of any other adverse biochemical, gross or histopathological effects, which do not suggest adversity.
Commercial TBB/TBPH mixture:
The critical effect levels for risk characterization in this evaluation were obtained from the reproductive and developmental studies. In a two-generation reproductive toxicity study in rats, the lowest LOAEL was identified at 50 mg/kg bw/d based on significant decrease in body weight of F2 female pups at birth, with a corresponding NOAEL of 15 mg/kg bw/d which was selected to determine the margin of exposure (MOE) (Table 10‑4).
Comparison of the lowest NOAEL (15 mg/kg bw/d) with the highest estimate of total daily exposure via environmental media (1.6 × 10⁻⁴ mg/kg bw/d) resulted in a margin of exposure of approximately 93 300. This margin is considered adequate to account for uncertainties in the exposure and health effects databases.
The data from a developmental study suggests that TBB/TBPH mixture may not produce adverse developmental effects following short-term exposure of humans to relevant concentrations of TBB/TBPH mixture (Table 10‑4).
With respect to TBB and TBPH in certain manufactured items, contact with flexible polyurethane foam manufactured items was identified as a potential source of exposure. Comparison of the NOAEL of 15 mg/kg bw/d from the two-generation oral study to the highest estimate of daily dermal uptake (5.8×10⁻² mg/kg bw/d) for infants in contact with children’s foam mattresses resulted in a margin of exposure of approximately 260. Comparison of this same NOAEL (15 mg/kg bw/d) to the estimate of intake from intermittent oral exposure (1.0 ×10⁻⁵ mg/kg bw/d) for young children (infants and toddlers) mouthing children’s foam manufactured items resulted in a margin of exposure of approximately 106. The MOEs are considered adequate to account for uncertainties in the exposure and health effects database.
Estimates of daily exposure intake were also calculated using reverse dosimetry from national and regional U.S. biomonitoring studies (Ospina et al. 2018; Butt et al. 2014; Hoffman et al. 2014) in which concentrations of TBBA, as a biomarker of TBB, were measured in urine spot samples. Although estimates of daily intake derived from biomonitoring data are associated with a number of uncertainties (see section 10.1.3), biomonitoring provides a direct measure of the internal dose of the chemical and is potentially reflective of uptake from all routes of exposure (NRC 2006). The estimates of TBB daily intakes based on reverse dosimetry of TBBA maximum (or 95th percentile) concentrations ranged from 1.07 × 10⁻⁵ to 3.62 × 10⁻⁵ mg/kg-bw/day. These concentrations were shown to be variable, but overall are consistent with estimates of exposure from environmental media and food.
As such, all MOEs are considered adequate to account for uncertainties in the exposure and health effects databases.
| Exposure Route and Duration | Source | Age Group | Systemic exposure (mg/kg bw/d) | MOE based on NOAEL of 15 mg/kg bw/d |
|---|---|---|---|---|
| Oral (primary route) | Environmental media and food | Infant (breastfed) | 1.6 × 10⁻⁴ | ~93 300 |
| Dermal (daily) | Children’s foam mattresses | Infant | 1.7×10⁻² – 5.8×10⁻² | 260 – 7900 |
| Oral (intermittent) | Children’s foam manufactured items | Infant and Toddler | 1.0 × 10⁻⁵ | 1 500 000 |
| Potentially all (daily) | Potentially all | Toddler | 1.07 × 10⁻⁵ (TBB only) | ~1 401 000 |
| Potentially all (daily) | Potentially all | Children (6-11 yrs) | 1.38 x 10⁻⁵ (TBB only) | ~1 087 000 |
| Potentially all (daily) | Potentially all | Teens (12-19 yrs) | 1.15 x 10⁻⁵ (TBB only) | ~1 304 000 |
| Potentially all (daily) | Potentially all | Adults | 1.16 x 10⁻⁵ – 3.63× 10⁻⁵ (TBB only) | >414 000 |
10.4 Uncertainties in evaluation of risk to human health
This SOS report acknowledges uncertainties regarding the exposure database and health effects database.
Canadian empirical data of TBB and TBPH in fish were very limited. No data in the primary literature were available for TBB and TBPH in marketed foods in North America. As such, the assumption that fish is the only source of dietary exposure (with the exception of breast milk) is an uncertainty. Exposure estimates for certain manufactured items were based on the highest empirical migration data specific to the TBB/TBPH mixture for flexible polyurethane foam covered with a cotton-polyester fabric; however, while the foam tested was treated with the TBB/TBPH/Organophosphate mixture, it was only TBB that was measured in this study, which is an uncertainty. The extent of the effect of the fabric cover on the migration of TBB and TBPH is unknown and is an uncertainty. Furthermore, there is uncertainty in the use of a range of dermal absorption values for TBB and TBPH from flexible polyurethane foam in furniture. Though dermal absorption values have been found for each of these two substances (Frederiksen et al. 2016; Knudsen et al. 2016a), 100% was selected as the upper end of the range to account for the possibility of higher absorptions due to unknown effects of factors such as skin occlusion, combined TBB and TBPH absorption, and differing dose levels. While using 100% dermal absorption likely leads to an overestimation of exposure, it is unknown what dermal absorption of TBB and TBPH together would be most appropriate for this scenario. Additional assumptions made relating to the amount of the TBB/TBPH mixture that may come into direct contact with the skin (e.g., surface area exposed) are also uncertainties but likely lead to overestimations of exposure (see Appendix G). The oral estimates were based on the migration study designed for dermal exposure; therefore there are uncertainties regarding saliva leachability compared to the saline solution used in dermal migration tests (US CPSC 2005b), and migration rates due to mouthing behaviour (e.g., force applied during the mouthing of foam toys might affect the migration rate). While the dermal and oral scenarios were based on covered foam (as per the migration study), exposure to uncovered foam cannot be precluded and is an uncertainty. Foam is considered to be an appropriate material type for evaluating upper bounding exposure given its porosity and potential for substance migration; however, there is uncertainty regarding the use of TBB/TBPH in other products available to consumers in the marketplace. Finally, there are also uncertainties associated with the biomonitoring data used for reverse dosimetry which was based on national and regional U.S. biomonitoring studies.
The health effects characterization includes several uncertainties. Confidence in the health effects database is low to moderate as data are not available regarding the toxicological endpoints required to conduct a comprehensive hazard evaluation. There is uncertainty in the database due to interspecies or intraspecies differences. As indicated earlier, no chronic toxicity or carcinogenicity data are available regarding the effects of TBPH or TBB in animals. Limited information is available related to short-term or acute effects of TBPH and TBB/TBPH mixture. There is a lack of information about the metabolism, fate and bioavailabilities of TBPH and TBB following ingestion, inhalation or dermal exposure.
As for the risk characterization, this SOS report is based on toxicological studies with TBB/TBPH ratios that may differ from those found in environmental media and products available to consumers evaluated herein. Also, it cannot be precluded that commercial products containing different ratios of these substances may be available in the Canadian market.
11. Outcome
Considering all available lines of evidence presented in this SOS report, there is currently a low potential for harm to organisms and the broader integrity of the environment from TBB and TBPH.
On the basis of the adequacy of the margin between the upper-bounding estimates of exposure from environmental media or products available to consumers and effect levels in a two generation reproductive toxicity study, the potential of harm to human health from TBB and TBPH is low.
Although present estimated levels of exposure of TBB and TBPH are not indicative of harm to the environment or to human health, it is important to recognize that these substances are new substances, as they are not on the DSL, and that Ministerial Conditions under the New Substances Notification Regulations (Chemicals and Polymers) impose handling stewardship practices to prevent releases of these substances to the environment. There may be concerns if import and use quantities were to increase in Canada or if Ministerial Conditions were not in place.
As TBB and TBPH are among commercial alternatives to high-volume legacy flame retardants like the polybrominated diphenyl ethers (PBDEs), and noting that TBPH has high-production volume status in other jurisdictions, there is a probability that quantities could increase in Canada. Given that TBB and TBPH are not on the DSL, they will continue to be subject to the New Substances Notifications Regulations (Chemicals and Polymers) of CEPA. This will ensure pre-market notification of any new importation or manufacturing of these substances and will allow further restrictions to be put in place, as needed. In addition, the current manner in which these substances are restricted (e.g. conditions on use, handling, disposal, and release) under the New Substances Notifications Regulations (Chemicals and Polymers) will remain in place, ensuring that industrial releases are minimized and that record-keeping of substance use and quantity
References
Abbasi G, Saini A, Goosey E, Diamond ML. 2016. Product screening for sources of halogenated flame retardants in Canadian house and office dust. Sci. Total Environ. 545–546:299–307.
Abraham MH, Chadha HS, Whiting GS, Mitchell RC. 1994. Hydrogen bonding. 32. An analysis of water-octanol and water-alkane partitioning and the ∆log P parameter of Seiler. J Pharm Sci. 83(8):1085-1100.
ACD Percepta [Prediction Module]. c1996-2014. Version 14.0. Toronto (ON): Advanced Chemistry Development. [accessed 2014 May].
Addison K, Griffin MP, Moorman JR, Lake DE, O’Shea TM. 2009. Heart rate characteristics and neurodevelopmental outcome in low birth weight infants. J Perinatol. 29(11):750-756.
[AEROWIN] AEROWIN Program for Windows [Estimation Model]. 2010. Version 1.00. Washington (DC): US Environmental Protection Agency, Office of Pollution Prevention and Toxics; Syracuse (NY): Syracuse Research Corporation. [accessed 2014 May].
Ali N, Ali L, Mehdi T, Dirtu AC, Al-Shammari F, Neels H, Covaci A. 2013. Levels and profiles of organochlorines and flame retardants in car and house dust from Kuwait and Pakistan: Implication for human exposure via dust ingestion. Environ Int. 55:62-70.
Ali N, Dirtu AC, Van den Eede N, Goosey E, Harrad S, Neels H, Mannetje A, Coakley J, Douwes J, Covaci A. 2012. Occurrence of alternative flame retardants in indoor dust from New Zealand: Indoor sources and human exposure assessment. Chemosphere 88:1276-1282.
Ali N, Harrad S, Goosey E, Neels H, Covaci A. 2011a.″Novel″ brominated flame retardants in Belgian and UK indoor dust: Implications for human exposure. Chemosphere 83(10):1360-1365.
Ali N, Van den Eede AC, Dirtu H, Covaci A. 2011b. Assessment of human exposure to indoor organic contaminants via dust ingestion in Pakistan. Indoor Air 22:200-211.
Allen JG, Stapleton HM, Vallarino J, McNeely E, McClean MD, Harrad SJ, Rauert CB, Spengler JD. 2013. Exposure to flame retardant chemicals on commercial airplanes. Environ Health 12:17.
Andersson PL, Öberg K, Örn U. 2006. Chemical characterization of brominated flame retardants and identification of structurally representative compounds. Environ Toxicol Chem. 25(5):1275-1282.
Arnot JA, Gobas FAPC. 2003a. Steady State BCF and BAF model excel spreadsheet v1.2. [Spreadsheet based on Arnot and Gobas 2003b].
Arnot JA, Gobas FAPC. 2003b. A generic QSAR for assessing the bioaccumulation potential of organic chemicals in aquatic food webs. QSAR Comb Sci. 22(3):337-345.
Arnot, JA, MacKay D, Bonnell M, Parkerton T. 2008. A database of fish biotransformation rates. Environ Toxicol Chem. 27(11):2263-2270.
Ash M, Ash I. 2003. Handbook of Paint and Raw Coating Materials. Synapse Information Resources, Inc., Endicott, NY.
ASTreat Model [sewage treatment plant removal model]. 2006. Version 1.0. Cincinnati (US): Procter & Gamble Company. [cited May 2014]. Available from Procter & Gamble Company, P.O. Box 538707, Cincinnati, OH 45253-8707, U.S.
[AOPWIN] Atmospheric Oxidation Program for Windows [Estimation Model]. 2010. Version 1.92a. Washington (DC): US Environmental Protection Agency, Office of Pollution Prevention and Toxics; Syracuse (NY): Syracuse Research Corporation. [accessed 2014 May].
Aylward LL, Kirman CR, Adgate JL, McKenzie LM, Hays SM. 2012. Interpreting variability in population biomonitoring data: Role of elimination kinetics. Journal of Exposure Science and Environmental Epidemiology 22:398-408.
Bartley DW, Siebecker JD, Falloon SB, inventors; Great Lakes Chemical Corporation, assignee. 2007. Process for producing tetrabromobenzoate esters. United States patent US 7,307,183 B2.
Bearr JS, Mitchelmore CL, Roberts SC, Stapleton HM. 2012. Species specific differences in the in vitro metabolism of the flame retardant mixture, Firemaster® BZ-54. Aquatic Toxicol. 124-125:41-47.
Bearr JS, Stapleton HM, Mitchelmore CL. 2010. Accumulation and DNA damage in fathead minnows (Pimephales promelas) exposed to 2 brominated flame-retardant mixtures, Firemaster® 550and Firemaster® BZ-54. Environ Toxicol Chem. 29(3): 722-729.
Bergman Å, Rydén A, Law RJ, de Boer J, Covaci A, Alaee M, Birnbaum L, Petreas M, Rose M, Sakai S et al. 2012. A novel abbreviation standard for organobromine, organochlorine and organophosphorous flame retardants and some characteristics of the chemicals. Environ Int. 49:57-82.
Beyer BK, Chernoff N, Danielsson BR, Davis-Bruno K, Harrouk W, Hood RD, Janer G, Liminga UW, Kim JH, Rocca M, Rogers J, Scialli AR. 2011. ILSI/HESI Maternal toxicity workshop summary: Maternal toxicity and its impact on study design and data interpretation. Birth Defects Res (Part B). 92:36-51.
[BCFBAF] Bioaccumulation Program for Windows [Estimation Model]. 2010. Version 3.00. Washington (DC): US Environmental Protection Agency, Office of Pollution Prevention and Toxics; Syracuse (NY): Syracuse Research Corporation. [accessed 2014 May].
[BIOWIN] Biodegradation Probability Program for Windows [Estimation Model]. 2010. Version 4.10. Washington (DC): US Environmental Protection Agency, Office of Pollution Prevention and Toxics; Syracuse (NY): Syracuse Research Corporation. [accessed 2014 May].
[BASL4] Biosolid-Amended Soil: Level IV model. 2011. Version 1.00. Peterborough (ON): Trent University, Canadian Environmental Modelling Centre. [accessed 2014 May]
Bohen JM, Mancuso AJ, inventors; Atochem North America, Inc., assignee. 1991. High yield method for preparation of diakyl esters of polyhaloaromatic acids. United States patent 5,049,697.
Bradman A, Castorina R, Gaspar F, Nishioka M, Colon M, Weathers W, Egeghy PP, Maddalena R, Williams J, Jenkins PL, McKone TE. 2014. Flame retardant exposures in California early childhood education environments. Chemosphere. 116:61-66.
Breivik K, Wania F, Muir DCG, Alaee M, Backus S, Pacepavicius G. 2006. Empirical and modeling evidence of the long-range atmospheric transport of decabromodiphenyl ether. Environ Sci Technol. 40(15):4612-4618.
Butt C, Congleton J, Hoffman K, Fang M, Stapleton M. 2014. Metabolites of organophosphate flame retardants and 2-ethylhexyl tetrabromobenzoate in urine from paired mothers and toddlers. Environ Sci Technol. 48(17):10432-10438.
Canada. 1999. Canadian Environmental Protection Act, 1999. S.C., 1999, c. 33. Part III. vol. 22(3).
Canada. 2002. Ministerial Condition No 11173 [PDF], Dept. of the Environment. Canada Gazette I 136(24):1780-1781. [accessed 2002 June 15].
Canada. 2003. Ministerial Condition No 11910 [PDF], Dept. of the Environment. Canada Gazette I 137(44):3426-3427. November 1, 2003.
Canada. 2005. Canadian Environmental Protection Act, 1999: New Substances Notification Regulations (Chemicals and Polymers). P.C. 2005-1484.. SOR/2005-247. [accessed 2005 August 31]
Canada. 2006. Ministerial Condition No 13961 [PDF], Dept. of the Environment. Canada Gazette I 140(18):972-974. [accessed 2006 May 6].
Canada. 2010. Ministerial Condition No 15926 [PDF], Dept. of the Environment. Canada Gazette I 144(28):1878-1880. [accessed 2010 July 10].
Canada. 2011. Ministerial Condition No 8720 [PDF], Dept. of the Environment. Canada Gazette I 145(38):2986-2988. [accessed 2011 September 17].
Canada, Dept. of the Environment. 2013. Canadian Environmental Protection Act, 1999: Notice with respect to certain organic flame retardant substances [PDF]. Canada Gazette, Part I, vol. 147(13):613-633.
Canada, Dept. of the Environment, Dept. of Health. 2011. Canadian Environmental Protection Act, 1999: Announcement of planned actions to assess and manage, where appropriate, the risks posed by certain substances to the health of Canadians and the environment. Canada Gazette, Part I. Vol 145(41), Supplement to the Canada Gazette.
Carignan, C. C., Heiger-Bernays, W., McClean, M. D., Roberts, S. C., Stapleton, H. M., Sjodin, A., & Webster, T. F. 2013. Flame retardant exposure among collegiate United States gymnasts. Environ Sci Technol. 47(23):13848-13856.
CATALOGIC [Computer Model]. 2013. Version 5.11.6. Bourgas (BG): Bourgas Prof. Assen Zlatarov University, Laboratory of Mathematical Chemistry. [cited May 2014].
CEC. 2015. Enhancing Trilateral Understanding of Flame Retardants and Their Use in Manufactured Items: Analysis of Select Flame Retardants Contained in Office and Household Furniture. Montreal, Canada: Commission for Environmental Cooperation. 16 pp.
[CEH] Center for Environmental Health. 2013a. Playing on poisons: harmful flame retardants in children’s furniture [PDF]
[CEH] Center for Environmental Health. 2013b. Naptime nightmares: toxic flame retardants in child care nap mats.
Chemtura Corporation. 2007a. DP-45™ Technical Data Sheet [PDF] West Lafayette (IN): Chemtura Corporation.
Chen D, Martin P, Burgess NM, Champoux L, Elliott JE, Forsyth DJ, Idrissi A, Letcher RJ. 2013. European starlings (sturnus vulgaris) suggest that landfills are an important source of bioaccumulative flame retardants to Canadian terrestrial ecosystems. Environ Sci Technol. 47(21):12238-12247.
Clark B, Henry JG, Mackay D. 1995. Fugacity analysis and model of organic-chemical fate in a sewage treatment plant. Environ Sci Technol. 29:1488-1494.
Covaci A, Harrad S, Abdallah MAE, Ali N, Law RJ, Herzke D, de Wit CA. 2011. Novel brominated flame retardants: A review of their analysis, environmental fate and behaviour. Enivon Int. 37(2):532-56.
Davis EF, Klosterhaus SL, Stapleton HM. 2012. Measurement of flame retardants and triclosan in municipal sewage sludge and biosolids. Environ Int. 40(1):1-7.
Davis EF, Stapleton HM. 2009. Photodegradation pathways of nonabrominated diphenyl ethers, 2-ethylhexyltetrabromobenzoate and di(2-ethylhexyl)tetrabromophthalate: identifying potential markers of photodegradation. Environ Sci Technol. 43(15):5739-5746.
de Jourdan B, Oakes K, Hanson M, Sibley P, Servos M, Muir D, Solomon K. 2012. Physiological effects of 3 non-pbde brominated flame retardants on pimephales promelas (fathead minnow) exposed in outdoor mesocosms. Environmental Pollution and Ecotoxicology. 55-66.
de Jourdan BP, Hanson ML, Muir CGD, Solomon KR. 2013. Environmental fate of three novel brominated flame retardants in aquatic mesocosms. Environ Toxicol Chem. 32(5):1060-1068.
de Jourdan BP, Hanson ML, Muir CGD, Solomon KR. 2014. Fathead minnow (pimephales promelas rafinesque) exposure to three novel brominated flame retardants in outdoor mesocosms: bioaccumulation and biotransformation. Environ Toxicol Chem. 33(5):1148-55.
Diamond M, Goosey E, Saini A, Chaudhuri S. 2013. Assessment of the prevalence and exposure to the new flame retardants (NFRs) in Canadian indoor environments. Contract prepared for Health Canada. Diamond Environmental Research Group, University of Toronto. (Unpublished report).
Dimitrov S, Dimitrova N, Parkerton T, Comber M, Bonnell M, Mekenyan O. 2005. Base-line model for identifying the bioaccumulation potential of chemicals. SAR QSAR Environ Res. 16(6):531-554.
Dirtu AC, Ali N, Van den Eede N, Neels H, Covaci A. 2012.Country specific comparison for profile of chlorinated, brominated and phosphate organic contaminants in indoor dust. Case study for Eastern Romania, 2010. Environ Int. 49:1-8.
[DNV] The Norwegian Veritas AS. 2010. Moskeland T. Environmental screening of selected “new” brominated flame retardants and selected polyfluorinated compounds 2009. Climate and Pollution Agency (KLIF), Norway.
Dodson RE, Perovich LJ, Covaci A, Van den Eede N, Ionas AC, Dirtu AC, Brody JG, Rudel RA. 2012. After the PBDE Phase-Out: A Broad Suite of Flame Retardants in Repeat House Dust Samples from California. Environ Sci Technol. 46(24):13056-13066.
[DPD] Drug Product Database [database]. [modified 2017 Feb 17]. Ottawa (ON): Government of Canada. [accessed 2014 April 24].
[ECOSAR] Ecological Structure Activity Relationships Class Program [Estimation Model]. 2012. Version 1.11. Washington (DC): US Environmental Protection Agency, Office of Pollution Prevention and Toxics; Syracuse (NY): Syracuse Research Corporation. [accessed 2014 May].
[ERRIS] Effluent Regulatory Reporting Information System [internal database]. 2014. Gatineau (QC): Environment Canada. [accessed 2014 May].
Egloff C, Crump D, Chiu S. Manning G, McLaren KK, Cassone CG, Letcher RJ, Gauthier LT, Kennedy SW. 2011. In vitro and in ovo effects of four brominated flame retardants on toxicity and hepatic mRNA expression in chicken embryos. Toxicol Lett. 207(1):25-33.
[ECCC] Environment and Climate Change Canada. 2013-2014. Data for certain organic flame retardants substance grouping collected under the Canadian Environmental Protection Act, 1999, section 71: Notice with respect to certain organic flame retardant substances. Data prepared by: Environment and Climate Change Canada, Health Canada; Existing Substances Program.
[ECCC] Environment and Climate Change Canada. 2018. Supporting Documentation: Information in support of the State of the Science report for Benzoic acid, 2,3,4,5-tetrabromo-, 2-ethylhexyl ester and 1,2-Benzenedicarboxylic acid, 3,4,5,6-tetrabromo-, bis(2-ethylhexyl) ester. Gatineau (QC): ECCC. Available from: substances@ec.gc.ca
Environment Canada. 2000-2014. Unpublished confidential information for Firemaster BZ-54, Firemaster 550, Pyronil 45, DP-45, and Uniplex FRP45 submitted to Environment Canada under the New Substances Notification Regulations of CEPA. Gatineau (QC): Environment Canada.
Environment Canada. 2007. Guidance document on statistical methods for environmental toxicity tests . Ottawa (ON): Method Development and Applications Section, Environmental Technology Centre, Environment Canada. 283 p. Report No.: EPS 1/RM/46.
Environment Canada. 2013. Wise water use. Ottawa (ON): Government of Canada. [accessed 2014 November, archived].
Environment Canada, Health Canada. 2007. Chemical substances: Categorization [Internet]. Ottawa (ON): Government of Canada. [updated May 25, 2013; accessed 2013 July 31]
[EQC] Equilibrium Criterion Model. 2003. Version 2.02. Peterborough (ON): Trent University, Canadian Environmental Modelling Centre. [accessed May 2014].
[EPI Suite] Estimation Programs Interface Suite for Microsoft Windows [Estimation Model]. 2000-2012. Version 4.1. Washington (DC): US Environmental Protection Agency, Office of Pollution Prevention and Toxics; Syracuse (NY): Syracuse Research Corporation. [accessed 2014 January].
Escher BI, Ashauer R, Dyer S, Hermens JLM, Lee JH, Leslie HA, Mayer P, Meador JP, Warne MSJ. 2011. Integr Environ Assess Manag. 7(1):28-49.
[ECHA] European Chemicals Agency. C2007-2013. Registered substances database. Search results for [CAS RN 26040-51-7]. Helskinki (FI): ECHA. [updated 2014 Jan 24; accessed 2014 Feb 4].
[ECHA] European Chemicals Agency. 2010. Guidance on information requirements and chemical safety assessment. Chapter R.16:Environmental exposure estimation. May 2010. Guidance for the implementation of REACH. Helsinki (FI): European Chemicals Agency.
[ECHA] European Chemicals Agency. 2013. bis(2-ethylhexyl) tetrabromophthalate. CAS RN 26040-51-7. Substance dossier. [accessed 2014 May].
[EURAR] European Union Risk Assessment Report 2008 [PDF]. CAS 117-81-7. Bis(2-ethylhexyl)phthalate (DEHP). European Chemicals Bureau.
European Commission. 2004. Guidance Document on Dermal Absorption [PDF] (SANCO/222/2000 rev.7, 19 March 2004).
European Commission, 2011. Identification and evaluation of data on flame retardants in consumer products. Final Report. Brussels, Belgium: prepared for the European Commission, Health and Consumers Department, by ARCADIS Belgium, Contract no. 17.020200/09/549040.
[EFSA] European Food Safety Authority 2012.Panel on Contaminants in the Food Chain (CONTAM). 2012. Scientific Opinion on Emerging and Novel Brominated Flame Retardants (BFRs) in Food. EFSA Journal, 10(10):2908.
[EU] European Union. 2008. European Union risk assessment report: Tris(2-chloro-1-methylethyl) phosphate (TCPP) [PDF] Luxembourg (LU): Office for Official Publications of the European Communities. 408 p. CAS: 13674-84-5 [accessed 2014 May]
[ESRAB] Existing Substances Risk Assessment Bureau. 2014. Existing Substances Risk Assessment Bureau (ESRAB), Health Canada, Ottawa.
Fan X, Kubwabo C, Rasmussen PE, Wu F. 2016. Non-PBDE halogenated flame retardants in Canadian indoor house dust: sampling, analysis, and occurrence. Environ. Sci. Pollut. Res. 23:7998–8007.
Fic A, Žegura B, Gramec D, Mašič LP. 2014. Estrogenic and androgenic activities of TBBA and TBMEPH, metabolites of novel brominated flame retardants, and selected bisphenols, using the XenoScreen XL YES/YAS assay. Chemosphere. 112:362-369.
Frederiksen M, Vorkamp K, Jensen NM, Sørensen JA, Knudsen LE, Sørensen LS, Webster TF, Nielsen JB. 2016. Dermal uptake and percutaneous penetration of ten flame retardants in a human skin ex vivo model. Chemosphere 162:308-314.
Gentes M, Letcher RJ, Caron-Beaudoin E, Verreault J. 2012. Novel flame retardants in urban-feeding ring-billed gulls from the St. Lawrence River, Canada. Environ Sci Technol. 46(17):9735-9744.
Gobas FAPC, Kelly BC, Arnot JA. 2003. Quantitative Structure Activity Relationships for predicting the bioaccumulation of POPs in terrestrial food-webs. QSAR Comb Sci. 22:346-351.
Gobas FAPC. 2007. Development and review of a generic water–sediment modelling framework for organic chemicals. Report prepared for Environment Canada. Burnaby (BC): Simon Fraser University, Faculty of Environment. March 26, 2007.
Gobas FAPC. 2010. Comments on approach to sediment exposure approach. Report prepared for Environment Canada. Burnaby (BC): Simon Fraser University, Faculty of Environment. March 25, 2010.
Gouin T, Thomas GO, Chaemfa C, Harner T, Mackay D, Jones KC. 2006. Concentrations of decabromodiphenyl ether in air from Southern Ontario: Implications for particle-bound transport. Chemosphere. 64(2):256-261.
Great Lakes Chemical Corporation. 1997a. CN-2065: Physicochemical properties. 1997. Dec 9. Huntingdon Life Sciences Ltd. Study # GLC 037/970940.
Great Lakes Chemical Corporation. 1997b. CN-2065: Abiotic degradation: hydrolysis as a function of pH. 1997 Sep 3. Huntingdon Life Sciences Ltd. Study # GLC 042/970941
Great Lakes Chemical Corporation. 1998a. CN-2065: Ready biodegradability (closed bottle test). 1998 Jan 8. Huntingdon Life Sciences Ltd. Study # GLC 36/973741.
Great Lakes Chemical Corporation. 1998b. CN-2065: Acute toxicity to Daphnia magna. 1998 Apr 29. Huntingdon Life Sciences Ltd. Study # GLC 33/973259.
Great Lakes Chemical Corporation. 1998c. CN-2065: Acute toxicity for Rainbow trout. 1998 Apr 29. Huntingdon Life Sciences Ltd. Study # GLC 32/973376.
Great Lakes Chemical Corporation. 1998d. CN-2065: Algal growth inhibition. 1998 Apr 29. Huntingdon Life Sciences Ltd. Study # GLC 34/972950.
Great Lakes Chemical Corporation. 2002. Porous pot test method for assessing the biodegradability of CN-2065 during wastewater treatment simulation. 2002 May 8. Wildlife International Ltd. Project # 298E-101A.
Great Lakes Chemical Corporation. 2003a. CN-2699: Shake flask die-away test. 2003 Feb 21. Wildlife International Ltd. Project # 298E-103.
Great Lakes Chemical Corporation. 2003b. CN-2699: A flow-through bioconcentration test with the rainbow trout (Oncorhynchus mykiss). 2003 Apr 9. Wildlife International Ltd. Project # 298A-114.
Great Lakes Solutions. c2014a. Firemaster BZ-54: Product Overview [Internet]. West Lafayette (IN): Chemtura. [accessed 2014 May, archived].
Great Lakes Solutions. c2014b. Firemaster 550: Product Overview . West Lafayette (IN): Chemtura. [accessed 2014 May, archived]
Great Lakes Solutions. c2014c. Firemaster DP-45: Product Overview. West Lafayette (IN): Chemtura. [accessed 2014 May, archived]
Guerra P, M Alaee, E Eljarrat and D Barcelo. 2011. Introduction to Brominated Flame Retardants: Commercially Products, Applications, and Physicochemical Properties. In Eljarrat E, Barceló D. editors. 2011. Brominated Flame Retardants. Series: The Handbook of Environmental Chemistry. Volume 16. Heidelberg Berlin:Springer. 290 pp.
Guerra P, Alaee M, Jiménez B, Paoepavicius G, Marvin C, Madnnis G, Eljarrat E, Barcelò D, Champoux L, Fernie K. 2012. Emerging and historical brominated flame retardants in peregrine falcon (Falco peregrinus) eggs from Canada and Spain. Environ Int. 40(1):179-186.
Harju M, Heimstad ES, Herzke D, Sandanger T, Posner S, Wania F. 2009. Current state of knowledge and monitoring requirements - Emerging "new" brominated flame retardants in flame retarded products and the environment [PDF] . Oslo (NO): Norwegian Pollution Control Authority. 113 p. Report No. TA-2462/2008 [accessed 2014 May]
Hays SM, Kirman CR. 2017. Risk assessment and biomonitoring equivalent for 2-ethylhexyl-2,3,4,5 tetrabromobenzoate (TBB) and tetrabromobenzoic acid (TBBA). Regulatory Toxicology and Pharmacology. 89:186-192.
Hazelton. 1986 (Project: 20988). Mutagenicity evaluation of CN-322. Hazelton Biotechnologies Company, Kensington, Maryland, USA.
He S, Li M, Jin J, Wang Y, Bu Y, Xu M, Yang X, Liu A. 2013. Concentrations and trends of halogenated flame retardants in the pooled serum of residents of Laizhou Bay, China. Environ Toxicol Chem. 32(6):1242-1247.
Health Canada. 1995. Investigating human exposure to contaminants in the environment: A handbook for exposure calculations. Ottawa (ON): Great Lakes Health Effects Program, Health Protection Branch, Health Canada.
Health Canada. 1998. Exposure factors for assessing total daily intake of priority substances by the general population of Canada. Unpublished report. Ottawa (ON): Health Canada, Environmental Health Directorate.
Health Canada 2014. CMP Survey 2014-2015: Determination of Flame Retardants in Consumer Products. Project No.: 2014-2048. June 19, 2014. (Unpublished report).
Health Canada. [modified 2017 May 3]. Lists of Permitted Food Additives. Ottawa (ON): Health Canada Food Directorate. [accessed 2014 April 24].
[HENRYWIN] Henry’s Law Constant Program for Microsoft Windows [Estimation Model]. 2011. Version 3.20. Washington (DC): US Environmental Protection Agency, Office of Pollution Prevention and Toxics; Syracuse (NY): Syracuse Research Corporation. [accessed 2014 May].
Hill JE, Favstritsky NA, Mamuzic RL, Bhattacharya B, inventors; Great Lakes Chemical Corporation, assignee. June 10, 1997. One-pot synthesis of ring-brominated benzoate compounds. United States patent 5,637,757.
Hoffman K, Fang M, Horman B, Patisaul HB, Garantziotis S, Birnbaum LS, Stapleton HM. 2014. Urinary tetrabromobenzoic acic (TBBA) as a biomarker of exposure to the flame retardant mixture Firemaster 550. Environ Health Perspect. 122(9):963-969.
Houde M, Berryman D, de Lafontaine Y, Verreault J. 2014. Novel brominated flame retardants and dechloranes in three fish species from the St. Lawrence River, Canada. Sci Total Environ. 479-480(1):48-56.
[HPVIS] High Production Volume Information System [database on the internet]. 2012. US EPA [updated Feb 3, 2014].
Huang TL, Shiotsuki T, Uematsu T, Borhan B, Li QX, Hammock BD. 1996. Structure- activity relationships for substrates and inhibitors of mammalian liver microsomal carboxylesterases. Pharm Res. 13:493-506.
Huntingdon Life Sciences Ltd. 1996d. CN-2065 Acute Oral Toxicity to the Rat (Report No: GLC29/961902/AC). Huntingdon, UK, Huntingdon Life Sciences Ltd (unpublished report submitted by ISM Pty Ltd) [cited in NICNAS 2004].
Huntingdon Life Sciences Ltd. 1997a. CN-2065 Bacterial Mutation Assay (Report: GLC 38/97612). Huntingdon, England, Huntingdon Life Sciences Ltd (unpublished report submitted by ISM Pty Ltd) [cited in NICNAS 2004].
Huntingdon Life Sciences Ltd. 1997b. CN-2065 In Vitro Mammalian Chromosome Aberration Test in Human Lymphocytes (Report: GLC 39/971448). Huntingdon, England, Huntingdon Life Sciences Ltd (unpublished report submitted by ISM Pty Ltd) [cited in NICNAS 2004].
Huntingdon Life Sciences Ltd. 1999c. Firemaster BZ-54 Skin Sensitisation to the Guinea-pig (Magnusson & Kligman Method) (Report: GLC 081/984927/SS). Huntingdon, England, Huntingdon Life Sciences Ltd (unpublished report submitted by ISM Pty Ltd) [cited in NICNAS 2004].
[HYDAT] HYDAT Database. 2013. Environment Canada, Water survey of Canada. [accessed 2014 May].
[HYDROWIN] Hydrolysis Rates Program for Microsoft Windows [Estimation Model]. 2010. Version 2.00. Washington (DC): US Environmental Protection Agency, Office of Pollution Prevention and Toxics; Syracuse (NY): Syracuse Research Corporation. [accessed 2014 May].
[ICRP].International Commission on Radiological Protection. 2003. Basic anatomical and physiological data for use in radiological protection: Reference values. ICRP Publication 89. Ann. ICRP 32(3-4).
Iqaluit 2010. 2010. Archived – About Nunavut. Government of Canada.
Jadlocki JF and Seckar JA. 1987. Acute oral toxicity test in the rat. March 11, 1987. Pennwalt Corporation. Life Science Research Ltd. Study # 86/PTC013/634. [cited in HPVIS, ECHA].
Johnson PI, Stapleton HM, Mukherjee B, Hauser R, Meeker JD. 2013. Associations between brominated flame retardants in house dust and hormone levels in men. Sci Total Environ. 445-446:177-184.
Kelly BC, Gobas FAPC, McLachlan MS. 2004. Intestinal absorption and biomagnification of organic contaminants in fish, wildlife, and humans. Environ Toxicol Chem. 23(10):2324-2336.
Kelly BC, Ikonomou MG, Blair JD, Morin AE, Gobas FAPC. 2007. Food web–specific biomagnification of persistent organic pollutants. Science. 317(5835):236-239.
Klosterhaus SL, Stapleton HM, La Guardia MJ, Greig DJ. 2012. Brominated and chlorinated flame retardants in San Francisco Bay sediments and wildlife. Environ. Int. 47:56-65.
Knudsen GA, Sanders JM, Birnbaum L. 2014. Biological fates of flame retardants, 2-ethylhexyl tetrabromobenzoate and Bis(2-ethylhexyl tetrabromophthalate), in female Sprague Dawley rats. NCI at NIEHS, RTP, NC, USA. (unpublished study).
Knudsen GA, Hughes MF, Sanders JM, Hall SM, Birnbaum LS. 2016a. Estimation of human percutaneous bioavailability for two novel brominated flame retardants, 2-ethylhexyl 2,3,4,5-tetrabromobenzoate (EH-TBB) and bis(2-ethylhexyl) tetrabromophthalate (BEH-TEBP). Toxicol. Appl. Pharmacol. 311:117-127.
Knudsen GA, Sanders JM, Birnbaum LS. 2016b. Disposition of the emerging brominated flame retardant, 2-ethylhexyl 2,3,4,5-tetrabromobenzoate, in female SD rats and Male B6C3F1 mice: Effects of dose, route and repeated administration. Toxicological Sciences. 154(2):392-402.
[KOAWIN] Octanol Air Partition Coefficient Program for Microsoft Windows [Estimation Model]. 2010. Version 1.10. Washington (DC): US Environmental Protection Agency, Office of Pollution Prevention and Toxics; Syracuse (NY): Syracuse Research Corporation. [accessed 2014 January].
[KOCWIN] Organic Carbon Partition Coefficient Program for Windows [Estimation Model]. 2010. Version 2.00. Washington (DC): US Environmental Protection Agency, Office of Pollution Prevention and Toxics; Syracuse (NY): Syracuse Research Corporation. [accessed 2014 January].
[KOWWIN] Octanol-Water Partition Coefficient Program for Microsoft Windows [Estimation Model]. 2010. Version 1.68. Washington (DC): US Environmental Protection Agency, Office of Pollution Prevention and Toxics; Syracuse (NY): Syracuse Research Corporation. [accessed 2014 January].
La Guardia MJ, Hale RC, Harvey E, Chen D. 2010. Flame-retardants and other organohalogens detected in sewage sludge by electron capture negative ion mass spectrometry. Environ Sci Techol. 44(12):4658-4664.
La Guardia MJ, Hale RC, Harvey E, Mainor TM, Ciparis S. 2012. In situ accumulation of hbcd, pbdes, and several alternative flame-retardants in the bivalve (corbicula fluminea) and gastropod (elimia proxima). Environ Sci Technol. 46(11):5798-5805.
La Guardia MJ, Hale RC, Newman B. 2013. Brominated flame-retardants in Sub-Saharan Africa: Burdens in Inland and coastal sediments in the eThekwini metropolitan municipality, South Africa. Environ Sci Techol. 47(17):9643-9650.
Lakind JS, Naiman DQ. 2008. Bisphenol A (BPA) daily intakes in the United States: Estimates from the 2003-2004 NHANES urinary BPA data. Journal of Exposure Science and Environmental Epidemiology. 18:608-615.
Lam JCW, Lau RKF, Murphy MB, Lam PKS. 2009. Temporal trends of hexabromocyclododecanes (HBCDs) and polybrominated diphenyl ethers (PBDEs) and detection of two novel flame retardants in marine mammals from Hong Kong, South China. Environ Sci Tecnhol. 43(18):6944-6949.
Lee SC, Sverko E, Harner T, Schachtschneider J, Zaruk D, DeJong M, Barresi E. 2010. “New” flame retardants in the global atmosphere under the GAPS Network [PDF]. Toronto (ON): Environment Canada, Atmospheric Science & Technology Directorate; Burlington (ON): Environment Canada, Water Science & Technology Directorate. Abstract presented at the 5th International Symposium on Brominated Flame Retardants in Kyoto, Kyoto (JP), April 2010.
Lentner C, editor. 1981. Geigy scientific tables volume 1: Units of measurement, body fluids, composition of the body, nutrition. 8th ed. Basel (CH): Ciba-Geigy Ltd.
Lim, RP. 2003. Toxicity of Firemaster BZ-54 to the cladoceran, daphnia carinata. Study report for International Sales and Marketing PTY Ltd. Report on behalf of accessUTS Ltd. (University of Technology Sydney). Project number C02/62/008.
[LNHPD] Licensed Natural Health Products Database [database]. [modified 2016 Aug 10]. Ottawa (ON): Government of Canada. [accessed 2014 April 24].
Ma, Y., Salamova, A., Venier, M., & Hites, R. A. 2013. Has the Phase-Out of PBDEs Affected Their Atmospheric Levels? Trends of PBDEs and Their Replacements in the Great Lakes Atmosphere. Environ Sci Technol. 47(20):11457-11464.
Ma Y, Venier M, Hites RA. 2012. 2-ethylhexyl tetrabromobenzoate and bis(2-ethylhexyl)
tetrabromophthalate flame retardants in the great lakes atmosphere. Environ Sci Techol. 46(1):204-208.
Mackay D, Hughes DM, Romano ML, Bonnell M. 2014. The role of persistence in chemical evaluations. Integr. Environ. Assess. Manag. 10(4): 588-594.
McCarty LS. 1986. The relationship between aquatic toxicity QSARs and bioconcentration for some organic chemicals. Environ Toxicol Chem. 5(12): 1071-1080.
McCarty LS. 1987a. Relationship between toxicity and bioconcentration for some organic chemicals: I Examination of the relationship. In: QSAR in Environmental Toxicology-II, KLE Kaiser (ed). D Reidel Publishing Co, Dordecht, The Netherlands. 207-220 pp.
McCarty LS. 1987b. Relationship between toxicity and bioconcentration for some organic chemicals: II Application of the relationship. In: QSAR in Environmental Toxicology-II, KLE Kaiser (ed). D Reidel Publishing Co, Dordecht, The Netherlands. 221-229 pp.
McCarty LS. 1990. A kinetics-based analysis of quantitative structure-activity relationships in aquatic toxicity and bioconcentration bioassays with organic chemicals. [Ph.D. thesis]. University of Waterloo. Waterloo, Ontario, Canada.
McCarty LS, Arnot JA, Mackay D. 2013. Evaluation of critical body residue for acute narcosis in aquatic organisms. Environ Toxicol Chem. 32(10):2301-2314.
McCarty LS, Hudson PV, Craig GR, Kaiser KLE. 1985. The use of quantitative structure-activity relationships to predict the acute and chronic toxicities of organic chemicals to fish. Environ Toxicol Chem. 4(5):595-606.
McCarty LS, Mackay D. 1993. Enhancing ecotoxicological modeling and assessment: critical body residues and modes of toxic action. Environ Sci Technol. 27:1719-1728.
McCarty LS, Mackay D, Smith AD, Ozburn GW, Dixon DG. 1991. Interpreting aquatic toxicity QSARs: the significance of toxicant body residues at the pharmacologic endpoint. Science of the Total Environment, Special Issue: QSAR in Environ Toxicol. 109:515-525.
McGee SP, Konstantinov A, Stapleton HM, Volz DC. 2013. Aryl phosphate esters within a major pentaBDE replacement product induce cardiotoxicity in developing zebrafish embryos: Potential role of the aryl hydrocarbon receptor. Tox Sci. 133(1):144-156.
[MPBPWIN] Melting Point Boiling Point Program for Microsoft Windows [Estimation Model]. 2010. Version 1.43. Washington (DC): US Environmental Protection Agency, Office of Pollution Prevention and Toxics; Syracuse (NY): Syracuse Research Corporation. [accessed 2014 January].
Melymuk L, Robson M, Csiszar SA, Helm PA, Kaltenecker G, Backus S, Bradley L, Gilbert B, Blanchard P, Jantunen L, Diamond ML. 2014. From the City to the Lake: Loadings of PCBs, PBDEs, PAHs and PCMs from Toronto to Lake Ontario. Environ Sci Technol. 48:3732-3741.
Mochungong P, Abbasi G, Diamond ML, Zhu J. 2014. Polybrominated diphenyl ethers and alternative brominated flame retardants in furniture and electric and electronic devices collected from the Greater Toronto Area, Canada. Unpublished manuscript. 20 pp.
MPI Research, Inc. 2008a. An oral two-generation reproduction and fertility study in rats. Study number 1038-008. [accessed 2008 September 29].
MPI Research, Inc. 2008b. Prenatal developmental toxicity study in rats. Study number 1038-006. [accessed 2008 August 20].
Muir DCG, Teixeira CF, Epp J, Young T, Wang X, Keir M, Backus S. 2011. Bioaccumulation of selected halogenated organic flame retardants in remote lakes and in the Great Lakes. Burlington (ON): Environment Canada, Aquatic Ecosystem Protection Research Division; Water Quality Monitoring and Surveillance Division. Poster presented at the 32nd Annual SETAC North America Meeting, Boston (MA), [accessed 2011 November].
[NCI] National Chemical Inventories [database on a CD-ROM]. 2014. Issue 1. Columbus (OH): American Chemical Society, Chemical Abstracts Service. [accessed 2014 May]
[NRC] National Research Council. 2006. Human Biomonitoring for Environmental Chemicals Washington, DC: The National Academies Press. [accessed 2014 December].
[NHPID] Natural Health Products Ingredients Database [database]. [modified 2017 June 21]. Ottawa (ON): Government of Canada. [accessed 2014 April 24].
[NICNAS] National Industrial Chemicals Notification and Assessment Scheme. 2004. Full public report: Firemaster BZ-54 [DOC]. Canberra (AU): NICNAS. 37 p. Report No.: STD/649 [accessed 2014 May].
Niino T, Ishibashi T, Ishiwata H, Takeda K, Onodera S. 2003. Characterization of human salivary esterase in enzymatic hydrolysis of phthalate esters. J Health Sci. 49:76-81.
Norris and Smith 2002. Research into the mouthing behaviour of children up to 5 years old. London, England: Consumer and Competition Policy Directorate, Department of Trade and Industry. Cited in US EPA 2011 Exposure Factors Handbook.
[OECD] Organisation for Economic Co-operation and Development. 2004. Emission scenario document on textile finishing industry [PDF] . Paris (FR): OECD, Environment Directorate. Report No: ENV/JM/MONO(2004)12, JT00166691 [accessed 2014 May].
[OECD] Organisation for Economic Co-operation and Development. 2009a. OECD Pov and LRTP Screening Tool [Internet]. Version 2.2. Paris (FR): Organisation for Economic Co-operation and Development. A software model for estimating overall persistence (Pov) and long-range transport potential (LRTP) of organic chemicals. [accessed 2014 May].
[OECD] Organisation for Economic Co-operation and Development. 2009b. Emission scenario document on plastics additives [PDF] [Internet]. Paris (FR): OECD, Environment Directorate. (Series on Emission Scenario Documents No. 3). Report No.: ENV/JM/MONO(2004)8/REV1. JT03267870. [accessed 2014 May].
Ospina M, Jayatilaka NK, Wong L-Y, Restrepo P, Calafat AM. 2018. Exposure to organophosphate flame retardant chemicals in the U.S. general population: Data from the 2013-2014 National Health and Nutrition Examination Survey [including supplementary information]. Environment International. 110:32-41.
Parkerton TF, Konkel WJ. 2000. Application of quantitative structure-activity relationships for assessing the aquatic toxicity of phthalate esters. Ecotox Environ Safety. 45:61-78.
Pelletier M, Verreault J, Backus S. 2013. Unpublished Chemicals Management Plan sediment monitoring data submitted to the Ecological Assessment Division of Environment Canada, Gatineau, QC.
Pennwalt Corporation. 1987a. Assessment of clastogenic action on bone marrow erythrocytes in the micronucleus test. July 28, 1987. Life Science Research, Ltd. Study # 87/PSV001/300 [cited in HPVIS, ECHA].
Pennwalt Corporation. 1987b. Assessment of mutagenic potential in histidine auxotrophs of Salmonella typhimurium (The Ames test). 1987 Jan 8. Life Science Research, Ltd. Study # 86/PTC018/601 [cited in HVPIS, ECHA].
Pennwalt Corporation. 1987c. In vitro assessment of the clastogenic activity of RC9927 in cultured human lymphocytes. 1987 March 18. Life Science Research, Ltd. Study # 87/PTC017/004 [cited in HPVIS, ECHA].
Pennwalt Corporation. 1987d. Acute eye irritation/corrosion in the rabbit. Jan 21, 1987. Life Science Research, Ltd. Study # 86/PTC016/686 [cited in HPVIS, ECHA].
Pennwalt Corporation. 1987e. Acute dermal irritation/corrosion test in the rabbit. Jan 21, 1987. Life Science Research, Ltd. Study # 86/PTC015/682 [cited in HPVIS, ECHA].
Pennwalt Corporation. 1987f. Delayed contact hypersensitivity study in guinea pigs. March 6, 1987. Life Science Research, Ltd. Study # 87/PTC012/056 [cited in HPVIS, ECHA].
Pennwalt Corporation. 1987h. Acute percutaneous toxicity in the rabbit. Jan 21, 1987. Life Science Research, Ltd. Study # 86/PTC014/676 [cited in HPVIS, ECHA].
Pennwalt Corporation. 1988. Toxicity study by dietary administration to CD rats for four weeks. Apr 7, 1988. Life Science Research, Ltd. Study # 87/PSV003/926 [cited in HPVIS, ECHA].
Pennwalt Corporation. 1989a. Pyronil 45: Assessment of its ready biodegradability (modified Sturm test). July 10, 1989. Life Science Research Ltd. Study # 89/PSV032/0244 [cited in HPVIS].
Pennwalt Corporation. 1989b. Pyronil 45: Acute toxicity to daphnia magna. July 10, 1989. Life Science Research Ltd. Study # 89/PSV031/0195 [cited in HPVIS].
Pennwalt Corporation. 1989c. Pyronil 45: Acute toxicity to rainbow trout. June 30, 1989. Life Science Research Ltd. Study # 89/PSV030/0194 [cited in HPVIS].
Personal Communication. 2014. Environmental Health Sciences and Research Bureau (EHSRB), Health Canada.
Perucca J, Bouby N, Valeix P, Bankir L. 2007. Sex difference in urine concentration across differing ages, sodium intake, and level of kidney disease. Am J Physiol Regul Integr Comp Physiol. 292:R700-R705.
Reyes L, Manalich R. 2005. Long-term consequences of low birth weight. Kidney International. 68(97):S107-S111.
[RIVM] Rijksinstituut voor Volksgezondheid en Milieu [National Institute for Public Health and the Environment]. 2008. Chemicals in Toys. A general methodology for assessment of chemical safety of toys with a focus on elements [PDF]. Bilthoven (NL): RIVM. Report No.:320003001/2008. [accessed 2018 July 9].
Roberts SC, Macaulay LJ, Stapleton HM. 2012. In vitro metabolism of the brominated flame retardants 2-ethylhexyl-2,3,4,5-tetrabromobenzoate (tbb) and bis(2-ethylhexyl) 2,3,4,5-tetrabromophthalate (tbph) in human and rat tissues. Chem Res Toxicol. 25(7):1435-1441.
Rose RS, Bhattacharya B, Favstritsky NA, inventors; Great Lakes Chemical Corporation, assignee. 1998. Use of ring-brominated benzoate compounds as flame retardants and/or plasticizers. United States patent 5,728,760.
Rusyn I, Peters JM, Cunningham ML. 2006. Effects of DEHP in liver: Modes of action and species-specific differences. Crit Rev Toxicol. 36(5):459-479.
Sagerup K, Herzke D, Harju M, Evenset A, Christensen GN, Routti H, Fuglei E, Aars J, StrømH, Gabrielsen GW. 2010. New brominated flame retardant in Arctic biota.Tromsø (NO): Klima- OG Forurensnings- Direktoratet. 30 p. Report No.: 1070/2010 [accessed 2014 May].
Sahlström L, Sellstrom U, de Wit CA. 2012. Clean-up method for determination of established and emerging brominated flame retardants in dust. Anal Bioanal Chem. 404:459-466.
Sahlström LM, Sellström U, de Wit CA, Lignell S, Darnerud PO. 2014. Brominated flame retardants in matched serum samples from Swedish first-time mothers and their toddlers. Environ Sci Technol. 48(13), 7584-7592.
Sakuratani Y, Noguchi Y, Kobayashi K, Yamada J, Nishihara T. 2008. Molecular size as a limiting characteristic for bioconcentration in fish. J Environ Biol. 29(1): 89-92.
Sample BE, Opresko DM, Suter II GW. 1996. Toxicological Benchmarks for Wildlife: 1996 Revision.Health Sciences Research Division, Oak Ridge Tennessee. Submitted to United States Department of Energy. Contract No. DE-AC05-84OR21400.
Saunders DMV, Higley EB, Hecker M, Mankidy R, Giesy JP. 2013. In vitro endocrine disruption and TCDD-like effects of three novel brominated flame retardants: TBPH, TBB & TBCO. Toxicol Lett. 223: 252-259.
Schenker U, Macleod M, Scheringer M, Hungerbühler K. 2005. Improving data quality for environmental fate models: a least-squares adjustment procedure for harmonizing physicochemical properties of organic compounds. Environ Sci Technol. 39(21):8434-8441.
Schreder, ED, La Guardia, MJ. 2014. Flame retardant transfers from U.S. households (dust and laundry wastewater) to the aquatic environment. Environ Sci Technol. 48(19): 11575-11583.
Seth R, Webster E, Mackay D. 2008. Continued development of a mass balance model of chemical fate in a sewage treatment plant. Water Res. 42:595-604.
Sexton K, Needham LL, and Pirkle JL. Human biomonitoring of environmental chemicals. Am Scientist 2004: 92: 38-45.
Shanmuganathan M, Zhang Z, Sverko E, Brymer R, Gill B, Smyth SA, Marvin CH. 2016. The analysis of halogenated flame retardants in Canadian wastewater treatment plants using gas chromatography with tandem mass spectrometry (GC-MS/MS). Unpublished report submitted under the Chemicals Management Plan. Manuscript in preparation.
Shoeib M, Ahrens L, Jantunen L, Harner T. 2014. Concentrations in air of organobromine, organochlorine and organophosphate flame retardants in Toronto, Canada. Atmospheric Environment. 99:140-147.
Shoeib M, Harner T, Webster GM, Sverko E, Cheng, Y. 2012. Legacy and current-use flame retardants in house dust from Vancouver, Canada. Environ Pollut. 169:175-182.
Silva MJ, Hilton D, Furr J, Gray LE, Preau JL, Calafat AM, Ye X. 2015. Quantification of tetrabromo benzoic acid and tetrabromo phthalic acid in rats exposed to the flame retardant Uniplex FPR-45. (Publised online). Arch Toxicol [accessed 2015 March 25].
SimpleTreat [sewage treatment plant removal model]. 2013. Version 3.1. Bilthoven (NL): National Institute for Public Health and the Environment (RIVM). [cited May 2014]. Available from: National Institute for Public Health and the Environment (RIVM), Laboratory for Ecological Risk Assessment, PO Box 1, 3720 BA Bilthoven, The Netherlands.
Springer C, Dere E, Hall SJ, McDonnell EV, Roberts SC, Butt CM, Stapleton HM, Watkins DJ, McClean MD, Webster TF, Schlezinger JJ, Boekelheide K. 2012. Rodent thyroid, liver, and fetal testis toxicity of the monoester metabolite of bis-(2-ethylhexyl) tetrabromophthalate (TBPH), a novel brominated flame retardant present in indoor dust. Environ Health Perspect. 120(12):1711-1719.
Stapleton HM, Allen JG, Kelly SM, Konstantinov A, Klosterhaus S, Watkins D, McClean MD, Webster TF. 2008. Alternate and new brominated flame retardants detected in U.S. house dust. Environ Sci Technol. 42(18): 6910-6916.
Stapleton, HM, Klosterhaus S, Eagle S, Fuh J, Meeker JD, Blum A, Webster TF. 2009. Detection of organophosphate flame retardants in furniture foam and U.S. house dust. Environ Sci Technol. 43(19):7490-7495.
Stapleton HM, Klosterhaus S, Keller A, Ferguson PL, Van Bergen S, Cooper E, Webster TF, Blum A. 2011. Identification of flame retardants in polyurethane foam collected from baby products. Environ Sci Technol. 45(12):5323-5331.
Stapleton HM, Sharma S, Getzinger G, Ferguson PL, Gabriel M, Webster TF, Blum A. 2012. Novel and High Volume Use Flame Retardants in US Couches Reflective of 2005 pentaBDE Phase Out. Environ Sci Technol. 46:13432-13539.
Stapleton HM, Misenheimer J, Hoffman K, Webster TF. 2014. Flame retardant associations between children’s handwipes and house dust. Chemosphere. 116:54-60.
Statistics Canada. 2014. Population by year, by province and territory. [accessed 2014 November].
[STP-EX] Sewage Treatment Plant Expanded Model. 2008. Windsor (ON): University of Windsor, Dept. of Civil and Environmental Engineering. [Model described in Seth et al. 2008].
[STP Model] Fugacity-based Sewage Treatment Plant Model. 2006. Version 2.1. Peterborough (ON): Trent University, Canadian Environmental Modelling Centre. [Model based on Clark et al. 1995].
Sühring R, Möller A, Freese M, Pohlmann J, Wolschke H, Sturm R, Xie Z, Hanel R, Ebinghaus R. 2013. Brominated flame retardants and dechloranes in eels from German Rivers. Chemosphere. 90(1):118-124.
[TemaNord] Nordic Council of Ministers. 2011. Schlabach M, Remberger M, Brorström-Lundén E, Norström k, Kaj L, Andersson H, Herzke D, Borgen A and Harju M, 2011. Brominated Flame Retardants (BFR) in the Nordic Environment. TemaNord 2011: 528. Nordic Council of Ministers, Copenhagen, Denmark.
Toms, L-ML, Hearn L, Sjödin A, Mueller JF. 2011. Introduction to Brominated Flame Retardants: Commercially Products, Applications, and Physicochemical Properties. In Eljarrat E, Barceló D. editors. 2011. Brominated Flame Retardants. Series: The Handbook of Environmental Chemistry. Volume 16. Heidelberg Berlin:Springer. 290 pp.
Unitex Chemical Corporation. 2009. Uniplex FRP-45: CAS NO. 26040-51-7 . Greensboro (NC): Unitex Chemical Corporation. [accessed 2014 May].
[US CPSC] US Consumer Product Safety Commission, 2005a. Analysis of FR Chemicals Added to Foams, Fabrics, Batting, Loose Fill, and Barriers. [PDF] Washington (DC): Directorate for Laboratory Sciences, US CPSC. (uff6)
[US CPSC] US Consumer Product Safety Commission, 2005b. Migration of Flame Retardant Chemicals in Upholstered Furniture Foam [PDF] Washington (DC): Division of Chemistry, US CPSC. (uhff2)
[US CPSC] US Consumer Product Safety Commission. 2006. CPSC Staff Preliminary risk assessment of flame retardant chemicals in upholstered furniture foam. [PDF] US Consumer Product Safety Commission.
[US EPA] U.S. Environmental Protection Agency. 1993. Wildlife Exposure Factors Handbook. Washington, DC; EPA/600/R-93/187.
[US EPA] U.S. Environmental Protection Agency. 2003. Exposure and human health reassessment of 2,3,7,8-tetrachlorodibenzo-p-dioxin (TCDD) and related compounds, Part I: Estimating exposure to dioxin-like compounds, Volume 3: Site-specific assessment procedures, Chapter 4: Estimating exposure media concentrations. National Center for Environmental Assessment, Washington, DC; EPA/600/P-00/001Cb.
[US EPA] U.S. Environmental Protection Agency. 2011. Exposure Factors Handbook: 2011 Edition. National Center for Environmental Assessment, Washington, DC; EPA/600/R-09/052F. Available from the National Technical Information Service, Springfield, VA
[US EPA] U.S. Environmental Protection Agency. 2012. Standard Operating Procedures for Residential Pesticide Exposure Assessment [PDF] Office of Chemical Safety and Pollution Prevention, Washington (DC).
[US EPA] U.S. Environmental Protection Agency, 2013. TSCA Work Plan Chemicals Washington (DC): Office of Pollution Prevention and Toxics, US EPA. [accessed 2013 June].
[US EPA] U.S. Environmental Protection Agency. 2014a. Chemical Data Reporting (CDR): Non-confidential IUR Production Volume Information (1986-2002) [database]. Washington (DC): U.S. EPA. [accessed 2014 May].
[US EPA] U.S. Environmental Protection Agency. 2014b. Inventory Update Reporting (IUR): Non-confidential 2006 IUR Company/Chemical Records [database]. Washington (DC): U.S. EPA [accessed 2014 May].
[US EPA] U.S. Environmental Protection Agency. 2014c. Chemical Data Access Tool (CDAT) [database]. Washington (DC): U.S. EPA. [accessed 2014 May].
[US EPA] US Environmental Protection Agency. 2014d. Design for the Environment. Flame Retardants Used in Flexible Polyurethane Foam: An Alternatives Assessment Update [PDF]
Valls-Cantenys C, Villaverde-de-Sáa E, Rodil R, Quintana JB, Iglesias M, Salvadó V, Cela R. 2013. Application of polydimethylsiloxane rod extraction to the determination of sixteen halogenated flame retardants in water samples. Anal Chim Acta. 770:85-93.
Van den Eede N, Dirtu AC, Ali N, Neels H, Covaci A. 2012. Multi-residue method for the determination of brominated and organophosphate flame retardants in indoor dust. Talanta. 89:292-300.
Van Haarst EP, Heldeweg EA, Newling DW, Schlatmann TJ. 2004. The 24-h frequency-volume chart in adults reporting no voiding complaints: defining reference vales and analysing variables. BJU International. 93:1257-1261.
Van Hoogen G, Opperhuizen A. 1988. Toxicoketics of chlorobenzenes in fish. Environ Toxicol Chem. 7(3): 213-219.
[VCCLAB] Virtual Computational Chemistry Laboratory. 2005. ALOGPS 2.1. [accessed 2013 October].
Venier M, Dove A, Romanak K, Backus S, Hites R. 2014. Flame retardants and legacy chemicals in Great Lakes’ water. Environ Sci Technol. 48(16): 9563-9572.
Venier M, Audy O, Vojta S, Bečanova J, Romanak K, Melymuk L, Krátká M, Kukučka P, Okeme J, Saini A, Diamond ML, Klánová J. 2016. Brominated flame retardants in the indoor environment – Comparative study of indoor contamination from three countries. Environ Int. 94:150-160.
[WATERNT] Water Solubility Program [Estimation Model]. 2010. Version 1.01. Washington (DC): US Environmental Protection Agency, Office of Pollution Prevention and Toxics; Syracuse (NY): Syracuse Research Corporation. [accessed 2014 May].
Weil ED, Levchik SV. 2004. Commercial flame retardancy of polyurethanes. J Fire Sci. 22(4):293-303.
Webster T, Watkins DJ, Walker C, Fraser AJ, Heiger-Bernays W, Stapleton HM, McClean MD. 2010. PentaBDE Alternatives in Homes, Offices and Cars. (Abstract).
WIL Research Laboratories, Inc. 1997a. Primary Eye Irritation Study of CN-2065 in Albino Rabbits (WIL Project No: WIL-12372). Ashland, OH, WIL Research Laboratories, Inc (unpublished report submitted by ISM Pty Ltd) [cited in NICNAS 2004].
WIL Research Laboratories, Inc. 1997b. Acute Dermal Toxicity Study of CN-2065 in Albino Rats (WIL Project No: WIL-12371). Ashland, OH, WIL Research Laboratories, Inc (unpublished report submitted by ISM Pty Ltd) [cited in NICNAS 2004].
WIL Research Laboratories, Inc. 1997c. Primary Dermal Irritation Study of CN-2065 in Albino Rabbits (WIL Project No: WIL-12372). Ashland, OH, WIL Research Laboratories, Inc (unpublished report submitted by ISM Pty Ltd) [cited in NICNAS 2004].
WIL Research Laboratories, Inc. 1997d. Skin Sensitisation Study of CN-2065 in Albino Guinea Pigs (WIL Project No: WIL-12374). Ashland, OH, WIL Research Laboratories, Inc (unpublished report submitted by ISM Pty Ltd) [cited in NICNAS 2004].
WIL Research Laboratories, Inc. 1997e. A 28-day Repeated Dose Oral Toxicity Study of CN-2065 in Rats (WIL Project No: WIL-12375). Ashland, OH, WIL Research Laboratories, Inc (unpublished report submitted by ISM Pty Ltd) [cited in NICNAS 2004].
WIL Research Laboratories, Inc. 1997f. Acute Oral Toxicity Study of CN-2065 in Albino Rats (WIL Project No: WIL-12370). Ashland, OH, WIL Research Laboratories, Inc (unpublished report submitted by ISM Pty Ltd) [cited in NICNAS 2004].
WIL Research Laboratories, Inc. 1986a. Acute oral toxicity (LD50) study in Albino rats with CN-322: Final report. (WIL Project No: WIL-12069). Ashland OH, WIL Research Laboratories, Inc. [accessed 1986 March 10].
WIL Research Laboratories, Inc. 1986b. Acute dermal toxicity (LD50) study in Albino rabbits with CN-322: Final report. (WIL Project No: WIL-12070). Ashland OH, WIL Research Laboratories, Inc. [accessed 1986 March 10]
WIL Research Laboratories, Inc. 1986c. Primary eye irritation study in Albino rabbits with CN-322: Final report. (WIL Project No: WIL-12072). Ashland OH, WIL Research Laboratories, Inc. [accessed 1986 March 10]
WIL Research Laboratories, Inc. 1986d. Primary dermal irritation study in Albino rabbits with CN-322: Final report. (WIL Project No: WIL-12071). Ashland OH, WIL Research Laboratories, Inc. [accessed 1986 March 10]
Wilson R, Jones-Otazo H, Petrovic S, Mitchell I, Bonvalot Y, Williams D, Richardson GM. 2013. Revisiting dust and soil ingestion rates based on hand-to-mouth transfer. Human and Ecological Risk Assessment 19(1): 158-188.
[WSKOWWIN] Water Solubility for Organic Compounds Program for Microsoft Windows [Estimation Model]. 2010. Version 1.42. Washington (DC): US Environmental Protection Agency, Office of Pollution Prevention and Toxics; Syracuse (NY): Syracuse Research Corporation. [accessed 2014 January].
Wu AHB. 2006. Tietz clinical guide to laboratory tests. 4th ed. St. Louis (MO): Saunders Elsevier. p. 1102-1104.
Xiao H, Shen L, Su Y, Barresi E, DeJong M, Hung H, Lei Y, Wania F, Reiner EJ, Sverko E et al. 2012a. Atmospheric concentrations of halogenated flame retardants at two remote locations: The Canadian High Arctic and the Tibetan Plateau. Environ Pollut. 161: 154-161.
Xiao H, Hung H, Wania F, Lao R, Sabljic E, Sverko E, Lei YD, Fellin P, Barresi E. 2012b. Field evaluation of a flow-through sampler for measuring pesticides and brominated flame retardants in the arctic atmosphere. Environ Sci Techol. 46(14): 7669-7676.
Yang C, Diamond ML, Latifovic L, Tsirlin D, Harris SA, Jantunen L. 2017. Semivolatile Organic Compounds in Canadian Homes; A Comprehensive Household Exposure Study. Contract prepared for Health Canada. University of Toronto, Cancer Care Ontario, Environment and Climate Change Canada. (Unpublished report).
Zhou SN, Buchar A, Siddique S, Tasker L, Abdelouahab N, Zhu J. 2014. Measurements of selected brominated flame retardants in nursing women: implications for human exposure. Environ Sci Technol. 48(15):8873-8880.
Zhou SN, Reiner EJ, Marvin C, Helm P, Riddell N, Dorman F, Misselwitz M, Shen L, Crozier P, MacPherson K et al. 2010a. Development of liquid chromatography atmospheric pressure chemical ionization tandem mass spectrometry for analysis of halogenated flame retardants in wastewater. Anal Bioanal Chem. 396(3):1311-1320.
Zhou SN, Reiner EJ, Marvin C, Kolic T, Riddell N, Helm P, Dorman F, Misselwitz M, Brindle ID. 2010b. Liquid chromatography–atmospheric pressure photoionization tandem mass spectrometry for analysis of 36 halogenated flame retardants in fish. J Chromat A. 1217(5):633-641.
Zhu B, Lai NLS, Wai T, Chan LL, Lam JCW, Lam PKS. 2014. Changes of accumulation profiles from PBDEs to brominated and chlorinated alternatives in marine mammals from the South China Sea . Environ Int. 66:65-70.
Appendices
Appendix A. Substance identity information
| CAS RN | Other selected names and abbreviations |
|---|---|
| 183658-27-7 | 2-ethylhexyl 2,3,4,5-tetrabromobenzoate; Benzoic acid, 2,3,4,5-tetrabromo-, 2-ethylhexyl ester (TSCA, IECSC)a; EtH-TeBBzob; EHTeBBb; EH-TBBb; TBBb |
| 26040-51-7 | Bis(2-ethylhexyl) 3,4,5,6-tetrabromophthalate; 1,2-Benzenedicarboxylic acid, 3,4,5,6-tetrabromo-, 1,2-bis(2-ethylhexyl) ester (TSCA)a; 1,2-Benzenedicarboxylic acid, 3,4,5,6-tetrabromo-, bis(2-ethylhexyl) ester (IECSC, NDSL, PICCS, NZIoC)a; Di(2-ethylhexyl) tetrabromophthalatea; Phthalic acid, tetrabromo-, bis(2-ethylhexyl) estera; DP 45a; Pyronil 45a; Uniplex FRP 45a; BEH-TEBPb; bEtH-TeBPhtb; TeBrDEHPb; BEH-TBPb; TBPHb |
| 219632-53-8 | 1,3-Isobenzofurandione, 4,5,6,7-tetrabromo-, reaction products with 2-ethyl-1-hexanol (IECSC, AICS, NZIoC)a; Firemaster BZ-54c; Firemaster 550c (when mixed 50:50 with aromatic organophosphate flame retardants) TBB/TBPH mixture; TBB/TBPH/Organophosphate mixture |
a Names acquired from the National Chemical Inventories (NCI 2014).
b Names acquired from Bergman et al. (2012).
c Names acquired from Stapleton et al. (2012), Chen et al. (2013), and Personal communication from Chemtura to Ecological Assessment Division, Environment Canada (2014, unreferenced).
Appendix B. Physical-chemical properties
The EPI Suite of models was employed for all parameters in Table B-1 (EPI Suite 2000-2012). The experimental value adjustment (EVA) option available in the HENRYWIN, KOWWIN, and WATERNT models was not employed for TBB and TBPH, as no suitable physical-chemical analogue could be identified.
Additional appropriate models were used to increase confidence in the derived physical chemical properties. ACD/log P Classic and GALAS (Global, Adjusted Locally According to Similarity”) models from the ACD Percepta suite were deemed appropriate for TBB and TBPH based on a high representation of brominated aryl fragments in the training sets. Models contained in the ACD Percepta suite were also used to estimate vapour pressure, water solubility, and log Koc (ACD Percepta c1996-2014). Virtual Computational Chemistry Laboratory models for water solubility and log Kow were also used (ALOGPS, VCCLAB 2005). Poly-Parameter Linear Free Energy Relationships (ppLFER) were also used to estimate log Kow as per Abraham et al. (1994), using the solvation parameters calculated by Absolv (ACD Percepta c1996-2014). Each of the modelled results was assumed to carry the same approximate level of uncertainty for TBB and TBPH, and thus the median result from all available and appropriate models for a given parameter was selected as the key value.
Empirical measurements of log Kow and water solubility are summarized in the ECHA Registered Substances chemical database for TBPH (ECHA 2013). Full studies were not available at the time of evaluation for review. However, the summaries available on the REACH website indicate that by OECD Guideline 117, the empirical value of log Kow is 10.2 for TBPH. This summary concedes that the result does not meet the range of application of Guideline 117. The water solubility of TBPH, determined under Guideline 105, is reported as an unbounded value of < 5 x 10⁻⁵ mg/L, without co-solvent. Noting the limitations in these results (e.g. range of application, unbounded values), and that the full studies were not available for review, it was decided that an appropriate method to weigh these results in the determination of physical-chemical properties was to consider them among the appropriate model results for calculation of medians.
Physical-chemical properties of TBB and TBPH were checked for internal consistency and harmonized according to the Least-Squares Adjustment Procedure (LSA) (Schenker et al. 2005). To conduct this, the median values of the applicable physical chemical parameters (vapour pressure, water solubility, log Kow, log Koa, and log Kaw) were input into the model. The values input into the LSA model are summarized in Table B-1. The LSA output produced the critical values for these parameters as summarized in Table 3-1.
| Property | TBB | TBPH | Reference |
|---|---|---|---|
| Molecular weight (g/mol) | 549.9 | 706.2 | NA |
| Melting point (°C) | -25 | -25 | Great Lakes Chemical Corporation, 1997a |
| Boiling point (°C) | 433 | 540 | MPBPWIN 2010 |
| Boiling point (°C) | 478 | 585 | ACD Percepta c1996-2014 |
| Median boiling point (°C) | 455 | 562 | NA |
| Vapour pressure (Pa) | 4.00 x 10⁻⁷ | 1.00 x 10⁻¹¹ | ACD Percepta c1996-2014 |
| Vapour pressure (Pa) | 4.58 x 10⁻⁶ | 2.28 x 10⁻⁹ | MPBPWIN 2010 (Modified Grain Method) |
| Median vapour pressure (Pa) | 2.49 x 10⁻⁶ | 1.15 x 10⁻⁹ | NA |
| log KOW | 7.73 | 10.08 | ACD/log P Classic (ACD Percepta c1996-2014) |
| log KOW | 6.97 | 8.91 | ACD/log P GALAS (ACD Percepta c1996-2014) |
| log KOW | 8.69 | 12.18 | ppLFER; Abraham et al. 1994, (ACD Percepta c1996-2014) |
| log KOW | 8.75 | 11.95 | KOWWIN 2010 |
| log KOW | 6.99 | 8.36 | ALOGPS 2.1 (VCCLAB 2005) |
| log KOW | NA | 10.20 | ECHA 2013 |
| Median log KOW | 7.73 | 10.14 | NA |
| Water solubility (mg/L) | 3.42 x 10⁻³ | 1.92 x 10⁻⁶ | WATERNT 2010 |
| Water solubility (mg/L) | 8.54 x 10⁻⁵ | 6.99 x 10⁻⁸ | WSKOWWIN 2010 (input median log Kow) |
| Water solubility (mg/L) | 8.92 x 10⁻⁴ | 1.90 x 10⁻⁵ | ACD/logS0 GALAS (ACD Percepta c1996-2014) |
| Water solubility (mg/L) | 8.92 x 10⁻² | 1.66 x 10⁻³ | ACD LogS Classic (ACD Percepta c1996-2014) |
| Water solubility (mg/L) | 7.42 x 10⁻² | 2.45 x 10⁻² | ALOGPS 2.1 (VCCLAB 2005) |
| Water solubility (mg/L) | NA | 5.0 x 10⁻⁵ | ECHA 2013 |
| Median water solubility (mg/L) | 3.42 x 10⁻³ | 3.45 x 10⁻⁵ | NA |
| log KOC | 4.47 | 5.94 | KOCWIN 2010 (MCI method) |
| log KOC | 5.12 | 6.38 | KOCWIN 2010 (KOW method, input median log KOW) |
| log KOC | 5.58 | 6.86 | ACD Percepta c1996-2014 |
| Median log KOC | 5.12 | 6.38 | NA |
| log KOA | 11.32 | 14.99 | KOAWIN 2010 (input median log KOW) |
| log KAW | -3.59 | -4.91 | HENRYWIN 2011 (from Bond method) |
An empirical dataset of physicochemical properties was submitted for a commercial mixture of TBB and TBPH of unknown proportion. The empirical dataset contained measurements of properties such as water solubility and octanol-water partition coefficient, and additional data included in Table B-2. There was significant uncertainty with these data. Several of the values were unbounded, while others were contradictory with other empirical information submitted. For example, a water solubility value of 2.01 mg/L was reported for a mixture of TBB and TBPH (Great Lakes Chemical Corporation 1997a). This value is exceedingly high given the hydrophobic elements in the chemical structures (e.g., branched alkyl chains, brominated aromatic ring). Furthermore, the requirements for organic co-solvents in the accompanying studies at nominal concentrations which should have been soluble based on this value of 2.01 mg/L also suggest a low confidence. However, a melting point of -25°C was identified as a key value from this data set, and ascribed to both TBB and TBPH, as the model predictions were unreasonable for substances which are stated to be liquids at standard temperature and pressure. Similarly, the empirical boiling point range may also be more realistic for flame retardant substances than the modelled values.
| Property | Empirical value for TBB/TBPH Mixture | Method |
|---|---|---|
| Melting point (°C) | <-25 | EEC 92/69, A.1 |
| Boiling point (°C) | 317-331 | EEC 92/69, A.2 |
| Vapour pressure (Pa) | 1.3 x 10⁻⁴ | EEC 92/69, A.4 |
| Water solubility (mg/L) | 2.01 | EEC 92/69, A.6 |
| Log KOW | >6.2 | EEC 92/69, A.8 |
| Log KOC | >4.5 | OECD TGP/94.75 (Draft) |
Appendix C. QSAR screening of potential transformation products
Potential metabolites identified in the published literature for TBB include 2,3,4,5-tetrabromobenzoic acid (TBBA), which may further be metabolized to methyl 2,3,4,5-tetrabromobenzoate (M-TBB), and 2-ethylhexyl 3,4-dibromobenzoate (EH-DBB) (Bearr et al. 2012, Roberts et al. 2012), while mono(2-ethylhexyl) 3,4,5,6-tetrabromophthalate (TBMEHP) was identified as a metabolite of TBPH (Roberts et al. 2012). The predicted most-stable transformation product identified by CATALOGIC (2013) for TBB is 3,4,5-tribromobenzoic acid (TrBBA), and for TBPH is 4,5-dibromophthalic acid (DBPA). For high-level QSAR screening of persistence, bioaccumulation, and effect endpoints for transformation products of TBB and TBPH, log Kow and water solubility values were estimated with ACD/logP Classic and WATERNT respectively. Table C-1 summarizes basic physical chemical properties for identified transformation products. Tables C-2 and C-3 present the results of QSAR screening of potential transformation products for persistence and bioaccumulation endpoints.
TBB itself also falls within the model domain of ECOSAR. Due to the sterically hindered nature of the esters present in these compounds, the Neutral Organic SAR (Baseline toxicity) results were considered over the Esters class. Values greater than 10x the water solubility were excluded from Table C-4.
This analysis is intended to be a precautionary measure to show that the observed, suggested, or modelled metabolites for TBB and TBPH did not raise any concerns for persistence, bioaccumulation, or ecological effects beyond those of the parent compounds themselves. It is recognized that this does not capture the potential for other sub-lethal effects, and that initial QSAR modelling of predicted transformation products has high uncertainty.
| Transformation Product | MW (g/mol) | log Kow | Water Solubility (mg/L) | SMILES |
|---|---|---|---|---|
| TBBA | 437.7 | 4.28 | 20.1 | BrC1=C(C(O)=O)C=C(Br)C(Br)=C1Br |
| M-TBB | 451.7 | 4.19 | 9.6 | BrC1=C(C(OC)=O)C=C(Br)C(Br)=C1Br |
| EH-DBB | 392.1 | 7.03 | 0.085 | BrC1=C(Br)C=C(C(OCC(CCCC)CC)=O)C=C1 |
| TBMEHP | 593.9 | 6.43 | 0.012 | BrC1=C(C(O)=O)C(C(OCC(CCCC)CC)=O)=C(Br)C(Br)=C1Br |
| TrBBA | 358.8 | 4.18 | 21.4 | BrC1=C(Br)C(Br)=CC(C(O)=O)=C1 |
| DBPA | 323.9 | 2.70 | 1667 | BrC1=C(Br)C=C(C(O)=O)C(C(O)=O)=C1 |
| Transformation Product | log Kow | Atmospheric oxidation (AOPWIN 2010) predicted half-life, days | Ozone reaction (AOPWIN 2010) predicted half-lifea | Hydrolysis (HYDROWIN 2010) predicted half-lifeb, days | Biodegradation (BIOWIN 2010 submodels 3, 4, 5 and 6) results |
|---|---|---|---|---|---|
| TBBA | 4.28 | 19.9 | n/a | n/a | Sub-models 3,4,6: ‘biodegrades slowly’; Sub-model 5: ‘biodegrades quickly’ |
| M-TBB | 4.19 | 46.2 | n/a | 1.8 (pH 8) 18 (pH 7) | Sub-models 3,4,6: ‘biodegrades slowly’; Sub-model 5: ‘biodegrades quickly’ |
| EH-DBB | 7.03 | 0.971 | n/a | 20.4 (pH 8) 204 (pH 7) | Sub-models 3,4,5: ‘biodegrades slowly’; Sub-model 6: ‘biodegrades quickly’ |
| TBMEHP | 6.43 | 0.936 | n/a | 3.4 (pH 8) 34 (pH 7) | Sub-models 3,4,6: ‘biodegrades slowly’; Sub-model 5: ‘biodegrades quickly’ |
| TrBBA | 4.18 | 18.4 | n/a | n/a | Sub-models 3,4: ‘biodegrades slowly’; Sub-models 5,6: ‘biodegrades quickly’ |
| DBPA | 2.70 | 9.95 | n/a | n/a | Sub-models 3,4,5,6: ‘biodegrades quickly’ |
a Only olefins and acetylenes (double and triple carbon-carbon bonds) can be modelled for ozone reaction.
b Only esters, carbamates, epoxides, halomethanes, specific alkyl halides, and phosphorus esters can be modelled. Ortho-position fragments on phenyl rings are not considered.
| Transformation Product | log Kow | Predicted BCF (no metabolism) (L/kg ww) | Predicted BCF Mid-trophic level fish (metabolism) (L/kg ww) | Predicted BAF Mid-trophic level fish (metabolism) (L/kg ww) | Predicted kM (1/day) (10 g fish, 15°C) |
|---|---|---|---|---|---|
| TBBA | 4.28 | 3.16 | 452 | 459 | 0.577 |
| M-TBB | 4.19 | 270 | 158 | 158 | 2.19 |
| EH-DBB | 7.03 | 1.29 x 10⁴ | 518 | 8.95 x 10³ | 0.232 |
| TBMEHP | 6.43 | 56.2 | 217 | 433 | 1.18 |
| TrBBA | 4.18 | 3.16 | 439 | 445 | 0.524 |
| DBPA | 2.70 | 3.16 | 27.2 | 27.2 | 3.03 |
| Substance | Log Kow | Water solubility (mg/L) | Test organism | Endpoint | Value (mg/L) | Reference |
|---|---|---|---|---|---|---|
| TBB | 7.71 | 0.0028 | Fish, Daphnid, Green Algae | ChV | 0.0006 - 0.018 | ECOSAR 2012 |
| TBBA | 4.28 | 20.1 | Fish, Daphnid, Green Algae | ChV | 4.0 - 16.8 | ECOSAR 2012 |
| M-TBB | 4.19 | 9.6 | Fish, Daphnid, Green Algae | ChV | 0.15 -1.90 | ECOSAR 2012 |
| EH-DBB | 7.03 | 0.085 | Fish, Daphnid, Green Algae | ChV | 0.0017 -0.033 | ECOSAR 2012 |
| TBMEHP | 6.43 | 0.012 | Fish, Daphnid, Green Algae | ChV | 0.008 -0.12 | ECOSAR 2012 |
| TrBBA | 4.18 | 21.4 | Fish, Daphnid, Green Algae | ChV | 4.0 -15.8 | ECOSAR 2012 |
| DBPA | 2.70 | 1667 | Fish, Daphnid, Green Algae | ChV | 44 - 112 | ECOSAR 2012 |
Appendix D. Weight of evidence table for ecological risk characterization
| Line of Evidence | Level of confidencea | Relevance in assessmentb | Weight assignedc |
|---|---|---|---|
| Predicted Total Daily Intake vs. Toxicity Threshold Reference Value (reproduction) for relevant mammals, risk quotients < 1 | high | high | high |
| Predicted Critical Body Residue in fish vs. baseline narcosis thresholds and concentrations associated with DNA damage, risk quotients < 1 | moderate | high | moderate to high |
| Persistence in the environment | moderate | high | moderate to high |
| Bioaccumulation in organisms | moderate | high | moderate to high |
| Aquatic risk quotients < 1 | moderate | moderate | moderate |
| Ubiquitous and/or continuous presence, long-range transport | moderate | low to moderate | low to moderate |
| Sediment and soil compartments | NA | NA | NA |
Abbreviations: NA: Not available
a Level of confidence is determined according to data quality, data variability, data gaps and if data are fit for purpose.
b Relevance refers to the impact of the evidence in the assessment.
c Weight is assigned to each line of evidence according to the combined level of confidence and relevance in the assessment.
Appendix E. Combined estimates of daily intake of TBB and TBPH by various age groups within the general population of Canada
| Route of Exposure | 0–6 moa (breast milk fed)b | 0–6 moa (formula fed)c | 0–6 moa (not formula fed)d | 0.5–4 yre | 5–11 yrf | 12–19 yrg | 20–59 yrh | ≥60 yri |
|---|---|---|---|---|---|---|---|---|
| Ambient Airj | 5.6E-07 | 5.6E-07 | 5.6E-07 | 1.2E-06 | 9.4E-07 | 5.3E-07 | 4.6E-07 | 4.0E-07 |
| Indoor Airk | 7.3E-04 | 7.3E-04 | 7.3E-04 | 1.6E-03 | 1.2E-03 | 6.9E-04 | 6.0E-04 | 5.2E-04 |
| Drinking Waterl | N/A | 2.0E-06 | 7.3E-07 | 8.3E-07 | 6.5E-07 | 3.7E-07 | 3.9E-07 | 4.1E-07 |
| Foodm | 1.4E-02 | NI | NI | 4.2E-04 | 3.4E-04 | 1.9E-04 | 1.9E-04 | 1.2E-04 |
| Dustn | 1.5E-01 | 1.5E-01 | 1.5E-01 | 7.6E-02 | 2.9E-02 | 1.1E-03 | 1.0E-03 | 1.0E-03 |
| Soilo | N/A | N/A | N/A | 1.8E-05 | 1.4E-05 | 4.7E-07 | 4.5E-07 | 4.2E-07 |
| Total Intake | 1.6E-01 | 1.5E-01 | 1.5E-01 | 7.8E-02 | 3.0E-02 | 2.0E-03 | 1.8E-03 | 1.6E-03 |
Abbreviations: N/A = not applicable; NI = data not identified in the literature; mo = months; yr = years.
a Assumed to weigh 7.5 kg, to breathe 2.1 m3 of air per day (Health Canada 1998), and to ingest 38 and 0 mg of dust and soil per day, respectively (Wilson et al. 2013).
b Exclusively for breast milk-fed infants, assumed to consume 0.742 L of breast milk per day (Health Canada 1998), and breast milk is assumed to be the only dietary source. The sum of the 95th percentile concentrations of TBB (0.07 ng/g wet weight) and TBPH (0.069 ng/g wet weight) in breast milk samples (n=102) collected from 2008 to 2009 from women from Sherbrooke, Quebec, Canada (Zhou et al. 2014; personal communication from EHSRB, Health Canada, dated May 15, 2014), multiplied by a breast milk density of 1.03 g/mL (converted to 0.072 and 0.071 µg/L), was selected for deriving upper-bounding daily intakes of TBB and TBPH for breast milk exposure.
c Exclusively for formula-fed infants, assumed to drink 0.8 L of water per day (Health Canada 1998), where water is used to reconstitute formula. No monitoring data on TBB and TBPH in formula were identified; therefore dietary intakes are only those from water. See footnote on drinking water for details.
d Exclusively for not formula-fed infants, assumed to drink 0.7 L of water per day (Health Canada 1998), and approximately 50% of non-formula-fed infants are introduced to solid foods by 4 months of age, and 90% by 6 months of age (Health Canada 1998).
e Assumed to weigh 15.5 kg, to breathe 9.3 m3 of air per day, to drink 0.7 L of water per day, to consume 54.7 g of fish per day (Health Canada 1998), and to ingest 41 and 14 mg of dust and soil per day, respectively (Wilson et al. 2013).
f Assumed to weigh 31.0 kg, to breathe 14.5 m3 of air per day, to drink 1.1 L of water per day, to consume 89.8 g of fish per day (Health Canada 1998), and to ingest 31 and 21 mg of dust and soil per day, respectively (Wilson et al. 2013).
g Assumed to weigh 59.4 kg, to breathe 15.8 m3 of air per day, to drink 1.2 L of water per day, to consume 97.3 g of fish per day (Health Canada 1998), and to ingest 2.2 and 1.4 mg of dust and soil per day, respectively (Wilson et al. 2013).
h Assumed to weigh 70.9 kg, to breathe 16.2 m3 of air per day, to drink 1.5 L of water per day, to consume 111.7 g of fish per day (Health Canada 1998), and to ingest 2.5 and 1.6 mg of dust and soil per day, respectively (Wilson et al. 2013).
i Assumed to weigh 72.0 kg, to breathe 14.3 m3 of air per day, to drink 1.6 L of water per day, to consume 72.9 g of fish per day (Health Canada 1998), and to ingest 2.5 and 1.5 mg of dust and soil per day, respectively (Wilson et al. 2013).
j The sum of maximum concentrations of TBB (9 pg/m3) and TBPH (7 pg/m3), measured in Toronto, Ontario, Canada (Diamond et al. 2013), was selected for deriving upper-bounding estimates of daily intake for ambient air exposure. Canadians are assumed to spend 3 hours outdoors each day (Health Canada 1998).
k The sum of the maximum concentrations of TBB (2833 pg/m3) and TBPH (146.62 pg/m3) measured in homes in the Greater Toronto Area and Ottawa (Yang et al. 2017) was selected for deriving upper-bounding estimates of daily intake for indoor air exposure. Canadians are assumed to spend 21 hours indoors each day (Health Canada 1998).
l No drinking water monitoring data were identified. The sum of the highest mean concentrations of TBB (7.9 pg/L) and TBPH (10.4 pg/L), measured in Lake Ontario and Lake Erie surface water, respectively (Venier et al. 2014), was selected for deriving upper-bounding estimates of daily intake for drinking water exposure.
m No monitoring data on marketed foods in Canada were identified; however environmental fish data were available. The sum of the maximum concentrations of TBB (0.041 ng/g) and TBPH (0.078 ng/g), measured in Lake Ontario fish (Zhou et al. 2010b), was selected for deriving upper-bounding estimates of daily intake for exposure to all fish-related food items in the fish food group. Amounts of foods consumed on a daily basis by each age group over 12 food groups were obtained from the 1970 to 1972 Nutrition Canada Survey (Health Canada 1998).
n The sum of the maximum concentrations of TBB (22 371 ng/g) in the Canadian baseline study (personal communication from EHSRB, Health Canada, dated June 5, 2017), measured in various Canadian cities, and TBPH (6400 ng/g), measured in Vancouver, Canada homes (Shoeib et al. 2012), were selected for deriving upper-bounding estimates of daily intake for dust exposure.
o No monitoring data of soil in North America were identified. Therefore, the maximum predicted environmental concentration (PEC) of 0.02 mg/kg dw for the TBB/TPBH mixture was selected for deriving upper-bounding estimates of daily intake for soil exposure.
Appendix F. Monitoring of TBB and TBPH in household dust
| Location | Sample Type | Year; n | TBB Mediana (Range) (ng/g) | TBPH Mediana (Range) (ng/g) | Reference |
|---|---|---|---|---|---|
| Various, Canada | Vacuum | 2007-10; 631 | 123 (<1.5 – 22 371) | NM | Kubwabo et al. 2017 (unpublished) |
| Vancouver, BC, Canada | Vacuum | 2007-08; 116 | 120 (<0.30 – 18 000) | 99 (10 – 6400) | Shoeib et al. 2012 |
| Toronto, ON, Canada | Vacuum – homes | 2012; 35 | 215 (geomean) (ND -7540) | 77 (geomean) (ND -10,000) | Abbasi et al. 2016 |
| Toronto, ON, Canada | Vacuum | 2013; 35 (from 23 homes) | 966 (121 – 15 300) | 431 (69 – 34 500) | Venier et al. 2016 |
| Greater Toronto Area (GTA) and Ottawa | Vacuum | 2015; 77 (from 51 homes; GTA n=32, Ottawa n=19) | 293 (59 – 10 041) | 489 (89 – 26 674) | Yang et al. 2017 |
| California, US | Living Area Surfaces | 2006; 16 | 48 (4 – 4700) | 140 (36 – 1900) | Dodson et al. 2012 |
| California, US | Living Area Surfaces | 2011; 16 | 100 (45 – 3590) | 260 (<2 – 3800) | Dodson et al. 2012 |
| Boston, US | MLA Carpets and Floors | 2006; 16 | 322 (geomean) (<6.6 – 15 030) | 234 (geomean) (3 – 10630) | Stapleton et al. 2008 |
| Boston, US | Bedroom Carpets and Floors | 2006; 14 | 90.4 (geomean) (<10.6 – 378) | 105 (geomean) (1.5 – 763) | Stapleton et al. 2008 |
| Boston, US | Vacuum | 2006; 7 | 91.1(geomean) (35.7 – 669) | 65.8 (geomean) (24.3 – 111) | Stapleton et al. 2008 |
| Boston, US | Vacuum | 2002-07; 50 | 840 (geomean) (<450 – 75 000) | 650 (geomean) (<300 – 47110) | Stapleton et al. 2009 |
| Boston, US | Living Area Surfaces | 2006; 19 | 322 (geomean) | 234 (geomean) | Webster et al. 2010 |
| Boston, US | Living Area Surfaces | 2009; 30 | 248 (geomean) | 923 (geomean) | Webster et al. 2010 |
| Boston, US | Living Area Surfaces | 2009; 31 | NM | 150 (geomean) (<4 – 12 400) | Springer et al. 2012 |
| Boston, US | Living Area Surfaces | 2002-03; 38 | 68.4(NS – 75 460) | 435(NS – 47 110) | Johnson et al. 2013 |
| North Carolina | Vacuum in MLA | NS; 53 | 275.5 (<8.9–18149) | 487.0 (<33.5 – 4814) | Hoffman et al. 2014 |
Abbreviations: MLA = main living area; ND = not detected; NS = not specified; NM = not measured
a Unless specified otherwise.
| Location | Sample Type | Sampling Year; n | TBB Median (range) | TBPH Median (range) | Reference |
|---|---|---|---|---|---|
| Antwerp, Belgium | Carpets and Floors | 2008; 39 | 1 (<2 – 436) | 13 (<2 – 5 004) | Ali et al. 2011a |
| Belgium | Vacuum | 2010; 6 | <9 | 6.11 (2.42 – 8.19) | Van den Eede et al. 2012d |
| Belgium | Vacuum | 2006; 2 | <9 | 10.6 (10.3 – 11) | Van den Eede et al. 2012 |
| Iasi, Romania | Carpets | 2010; 47 | <2 (<2 – 21) | 10 (<2 – 150) | Dirtu et al. 2012 |
| Romania | Vacuum | 2007; 3 | <9 | 8.1 (3.25 – 12.7) | Van den Eede et al. 2012d |
| Stockholm, Sweden | Living Area Surfaces | 2006; 6 | 172 (25 – 440) | 538 9 (260 – 950) | Sahlström et al. 2012d |
| Spain | Vacuum | 2006; 1 | <9 | 3.8 | Van den Eede et al. 2012d |
| New Zealand | Carpet and Floor | 2008 | 2 (<2 – 2285) | 12 (<2 – 640) | Ali et al. 2012 |
| New Zealand | Mattress | 2008 | 3 (<2 – 2285) | 1 (<2 – 50) | Ali et al. 2012 |
| Location | Sample Type | Sampling Year; n | TBB Median (range) | TBPH Median (range) | Reference |
|---|---|---|---|---|---|
| New Zealand | Carpet and Floor | 2008; 34 | 2 (<2 – 2285) | 12 (<2 – 640) | Ali et al. 2012 |
| New Zealand | Mattress | 2008; 16 | 3 (<2 – 40) | 1 (<2 – 50) | Ali et al. 2012 |
| Gujrat (rural), Pakistan | Carpets and Floors | 2011; 31 | 0.03 (<0.2 – 4.5) | 3.5 (<0.2 – 141) | Ali et al. 2011b |
| Faisalabad, Pakistan | Living Area Surfaces | 2011; 15 | 0.4 (<0.2 – 4.8) | 5.8 (1.6 – 167) | Ali et al. 2013 |
| Kuwait City, Kuwait | Vacuum | 2011; 15 | 6.6 (0.6 – 550) | 54 (7.2 – 1835) | Ali et al. 2013 |
Appendix G. Exposure estimates of TBB and TBPH from manufactured items
Based on the available information, dermal exposure uptakes were estimated for direct contact with flexible polyurethane foam-containing mattresses for infants, toddlers, and adults. Oral exposure estimates were also derived for infants and toddlers from mouthing (sucking) on foam manufactured items intended for children. The exposure parameters and values used to estimate exposures are presented in Tables G-1 and G-2, and are based on conservative assumptions.
Dermal exposure intake estimates
Intake = [SA × SCF × M × ED × DA] / BW
| Symbol | Description | Value |
|---|---|---|
| SAa | Surface area of skin contact (cm2) | 545-1840 (Infant) 797-2890 (Toddler) 2033-9100 (Adult) |
| SCFb | Skin contact factor | 1 |
| Mc | Migration rate (mg/cm2/hr) | 1.97 × 10⁻⁵ |
| EDd | Exposure duration (hr/d) | 12 (Infant) 12 (Toddler) 8 (Adult) |
| DAe | Dermal absorption | 11-100% |
| BWf | Body weight (kg) | 7.5 (Infant) 15.5 (Toddler) 70.9 (Adult) |
| Uptake | Uptake estimates (mg/kg bw/d) | 1.9×10⁻³ – 5.8×10⁻² (Infant) 1.3×10⁻³ – 4.4×10⁻² (Toddler) 5.0×10⁻⁴ – 2.0×10⁻² (Adult) |
a For this scenario, a range in surface areas (SA) were used to represent dermal contact with a mattress. For the lower SA used, it is assumed that an individual is wearing shorts and a t-shirt that cover half of the limbs. The surface area of exposure is based on exposure to a fraction of the lower half of the limbs (arms and legs) and the back of the head. The surface areas of the limbs (Health Canada 1995) were multiplied by one half to account for clothing coverage and then were multiplied by one third to account for the triangular shape of limbs, where only one side is directly in contact with the mattress (US CPSC 2006). The total surface area of the head (Health Canada 1995) was multiplied by a factor of 0.5 to represent exposure to the back of the head only. For the higher SA used, it was assumed that half of the body was in dermal contact with the mattress (US EPA 2012).
b No TBB-specific skin contact factor (SCF), i.e., the fraction of substance on a surface adhering to skin, was identified in the literature. As such, a value of 1 was selected to assume that all of the chemical in contact with the skin is available for absorption.
c The migration rate of 1.97 × 10⁻⁵ mg/cm2/hr for TBB/TBPH/Organophosphate mixture was used to estimate dermal exposures, and is based on a migration study of treated furniture foam by the US CPSC (US CPSC 2005b). Briefly, a furniture miniseat mock-up was built and consisted of a block of foam covered with cotton-polyester fabric and attached to plywood. The miniseat was wetted with a saline solution, to mimic sweat, with pressure applied to imitate the action of lying down. The migration rate of 1.97 × 10⁻⁵ mg/cm2/hr for TBB/TBPH/Organophosphate mixture was determined based on the reported maximum daily amount of TBB extracted (2.8 µg) onto the filter (5.5 cm diameter) over the course of the migration testing period (6 hours) (US CPSC 2005b).
d Exposure duration for sleeping was adjusted from durations reported in US CPSC (2006) for leisurely sitting to account for longer sleeping durations relative to sitting.
e Dermal absorption of TBB has been reported to be approximately 11% while that of TBPH has been reported to be approximately 8 to 10% (Frederiksen et al. 2016; Knudsen et al. 2016a). The migration rate used for the TBB/TBPH/Organophosphate mixture was determined through the measurement of the migration of TBB from foam (CPSC 2005b), so a dermal absorption of 11% was selected as the lower end of the absorption range used in this calculation. 100% was selected as the upper end of the dermal absorption range to account for the possibility of higher absorptions (e.g., due to occluded skin; inclusion of TBPH absorption; exposure to different dose levels).
f Health Canada (1998).
Oral exposure intake estimates
Intake = [SA × M × ED] / BW
| Symbol | Description | Value |
|---|---|---|
| SAa | Surface area of direct mouthing | 10 cm2 (Infant) 20 cm2 (Toddler) |
| Mb | Migration rate | 1.97 × 10⁻⁵ mg/cm2/hr |
| EDc | Exposure duration | 24.5 min/d |
| BWd | Body weight | 7.5 kg (Infant) 15.5 kg (Toddler) |
| Intake | Intake estimate | 1.0 ×10⁻⁵ mg/kg bw/d (Infant) 1.0 ×10⁻⁵ mg/kg bw/d (Toddler) |
a Surface area for infants is based on multiple references (RIVM 2008). Surface area for toddlers is based on professional judgement reflecting twice the surface area of the opening of a toddler’s mouth.
b Given that no other migration data was identified, the migration rate of 1.97 × 10⁻⁵ mg/cm2/hr for TBB/TBPH/Organophosphate mixture as presented in the dermal scenario was also used to estimate oral exposure.
c The mouthing duration for children’s foam products such as nap mats, car seats, small furniture was based on the duration for “other objects” in Norris and Smith (2002) cited in US EPA (2011).
d Health Canada (1998).
Appendix H. TBB intake estimate from urinary TBBA biomonitoring reverse dosimetry
Reverse dosimetry was used to derive estimates of daily intakes from urine concentrations for toddlers (aged 1 to 5 years), children (aged 6 to 11 years), teens (aged 12 to 19 years), and adult men and women. The urine concentrations in the literature were corrected for specific gravity or creatinine and presented in section 10.1.3, with the maximum or 95th percentile concentrations for each age group shown in Table H-1. All other parameters have been previously discussed and are also presented below. Daily intakes calculated using reverse dosimetry are shown in the equation below.
Daily Intake = [[Urine] × VUrine OR CER× MWR] / [BW × FUE ]
| Symbol | Description | Value |
|---|---|---|
| [Urine]SG | Maximum urinary concentrations of metabolite corrected for specific gravity (pg/mL) | 84.9 (Toddlers)a 341 (Adults)b |
| [Urine]CR | 95th Percentile urinary concentrations of metabolite creatinine corrected (µg/g) | 0.235 (Children)c 0.174 (Teens)c 0.174 (Adults)c |
| Vurine | Total daily urine volume (L/d) | 0.7 (Toddlers)d 2.03 (Adults)e |
| CERf | Daily creatinine excretion rate (g Cr/day) | 0.65 (Children) 1.4 (Teens) 1.7 (Adults) |
| BWg | Body weight (kg) | 15.5 (Toddlers) 31.0 (Children) 59.4 (Teens) 70.9 (Adult) |
| FUEh | Fractional urine excretion (based on rat toxicokinetic study) | 45% (common to all age groups) |
| MWR | Molecular weight ratio between parent and metabolite, i.e., TBB and TBBA | 1.26 |
| Intake | Intake (ng/kg bw/d) | 10.7 (Toddlers) 13.8 (Children) 11.5 (Teens) 11.6 (Adults) 36.2 (Adults) |
a Toddlers (n=23) were recruited from New Jersey, U.S., and were between 1 and 5 years of age (Butt et al. 2014). This study included paired mothers to the toddlers; however, TBBA was not frequently detected in mothers and was therefore not included here.
b Adult male and female participants (n=64) were recruited in North Carolina, U.S. (Hoffman et al. 2014)
c Total of 2666 samples for children 6 to 11 years old (n=421), teens (n=427) and adults (n=1818) from across the U.S. from the 2013-2014 NHANES data (Ospina et al. 2018). Data from NHANES is considered to be nationally representative.
d Mean total daily urinary void volumes are reported to range from 0.45 to 0.7 L/d for toddlers (3 to 5 yrs) (ICRP 2003; Lentner 1981; Wu 2006). The upper bound value of 0.7 L/d was selected for conservatism for reverse dosimetry.
e Mean total daily urinary void volumes are reported to range from 0.6 to 2.03 L/d for men and women (ICRP 2003; Van Haarst et al. 2004; Wu 2006; Perucca et al. 2007; Lakind and Naiman 2008). The upper bound value of 2.03 L/d was selected for conservatism for reverse dosimetry.
f High end values from ICRP 2003.
g Health Canada 1998
h Following the oral administration (via corn oil) of radiolabelled TBB/TBPH/Organophosphate mixture in a rat and mouse study, between 43% and 65% of radiolabelled TBB was excreted in urine 24 hours following administration based on single and repeated dosing. (Knudsen et al. 2016b). The value of 45% (mid-point value between the single 24 hour dose in rats (43%) and mice (47%)) was selected for conservatism for reverse dosimetry.
Appendix I. Summary of critical health effects studies of the TBB/TBPH commercial mixture
Substance |
Endpoint |
Method |
Result |
|---|---|---|---|
Commercial mixture of TBPH and TBB (MPI Research, Inc. 2008a) |
Reproductive Toxicity |
Two-generation reproduction and fertility study in rats. Species/Strain: Crl:CD SD rats (n = 25/sex/dose) Treatment: Commercial mixture of TBPH and TBB (80:20 ratio of TBB: TBPH according to S71 submission) Route: Oral (gavage) Dose: 0, 15, 50 or 165 mg/kg bw/d; Vehicle: peanut oil Dosing regimen: The P0 generation was treated daily for 10 weeks pre-mating; through mating through gestation and lactation until scheduled anesthesia. The F1 started receiving treatment daily from Postnatal Day (PND) 22 (after weaning on LD21) until scheduled euthanasia. The F1 were mated and produced the F2 generation. |
Results: P0 parents: Only P0 parental female rats in 165 mg/kg bw/d group had statistically significant (treatment-related) lower body weight and body weight gain during premating period (week 4, week 6-10). Decreased body weight also reported during gestation in the highest dose group. Statistically significant decrease in P0 weekly food consumption during premating (comparable to controls during gestation and lactation). P0 Repro effects: Significantly lower food consumption, mean number of total pups (live + dead) at birth in 15 and 50 mg/kg bw/d groups compared to controls, but since not observed in 165 mg/kg bw/d, considered spurious and unrelated to treatment by study authors. Statistically lower mean number of uterine implant scars in 50 mg/kg bw/day group compared to controls, but since not observed in 165 mg/kg bw/d, considered spurious and unrelated by study authors. F1 Pups: Statistically significantly lower body weight at birth and in lactation (LD7) in F1 and F2 pups at 165 mg/kg bw/d. Lower through lactation (LD14, LD21) but only significant when sexes combined on LD21 compared to control. Lower body weight (8-10% lower than control at LD21) at weaning in F1 pups resulted in lower body weight during F1 parental premating period. Statistically significant lower spleen weight [absolute and relative (to brain and body weight)] in LD21 F1 male pups and LD21 F2 male and female pups at 165 mg/kg bw/d. F1 Parents: Statistically lower body weight and body weight gain during premating in F1 females at 165 mg/kg bw/d. Lower body weight (not statistically significant) at premating in F1 males at 165 mg/kg bw/d, but body weight gain was unaffected. Similar for F1 females at 165 mg/kg bw/d, but significant at LD21 for differences in body weight compared to controls. Statistically significant reduction (for most instances) in food consumption in F1 females at 165 mg/kg/d. F1 Repro: Lower stillborn index in F1 treated groups compared to control, but not statistically significant. F2 Pups: Statistically lower F2 pup weight at birth in 50 mg/kg bw/d pups, but were slight (less than 10%; evaluator calculated to be ~7-9% on LD0, 3-4.5% LD4) and comparable to controls through lactation; not considered toxicologically meaningful by study authors. At 165 mg/kg bw/d F2 pup weights were statistically significantly decreased at birth, through lactation and at weaning; considered treatment-related. F2 female pup ano-genital distance was statistically longer in 50 and 165 mg/kg bw/d groups; greatest at 50 mg/kg bw/d (not dose-related); considered unclear especially in the absence of an effect on sex ratios and macroscopic changes at LD21. Sporadic but statistically significant increase in thymus weight in 50 mg/kg bw/d F2 pups (relative to brain or body weight) compared to control (15% and 11% difference in females and males, respectively (calculated by evaluator)). Author considered “spurious and unrelated to treatment”. 165 mg/kg bw/d: statistically different F2 male and female brain to body weight ratios, lower liver and liver to brain weight and lower spleen weight (absolute and relative to body or brain weight) compared to controls. Study authors note that the toxicological significance of these changes is unclear. Evaluator derived effect levels: Parental LOAEL = 165 mg/kg bw/d (NOAEL = 50 mg/kg bw/d) based on reduced body weight in P0 and F1 females. Reproductive LOAEL = 50 mg/kg bw/d (NOAEL = 15 mg/kg bw/d) based on increased AGD in F2 female pups. Critical effects: Neonatal LOAEL = 50 mg/kg bw/d; NOAEL = 15 mg/kg bw/d based on decreased F2 pup weight at birth. |
Commercial mixture of TBPH and TBB (MPI Research Inc. 2008b). |
Developmental Toxicity |
Species: Time-mated female Crl:CD SD rats (8-10 weeks of age; n = 25 females/dose group (treatment and control)). Treatment: Commercial mixture of TBPH and TBB (80:20 ratio of TBB: TBPH according to S71 submission). Route: Oral (gavage). Dose: 0, 50, 100 or 300 mg/kg bw; 5 mL/day Frequency: daily, from GD 6 – 19. Vehicle: Peanut oil; 5 mL/kg All animals were terminated on GD 20. |
No mortality occurred among animals. Maternal toxicity observed at 100 or 300 mg/kg dose (hair loss at the abdominal region, statistically lower gestation body weight and weight gain, lower food consumption). Fetal body weight was statistically decreased in 100 or 300 dose groups as compared to control. No fetal skeletal abnormalities seen at 50 or 100 mg/kg bw/d dose. At 300 mg/kg bw/d, malformations such as fused cervical vertebral neural arches seen in two fetuses (one fetus each from different litter). These effects were considered dose-related. There was also increased incidence of variation in fetal ossification, incompletely ossified skull bones and unossified sternebrae. NOAEL for maternal and developmental toxicity = 50 mg/kg bw/d (identified by authors). Maternal LO(A)EL = 100 mg/kg bw/d based on decreased body weight, body weight gain and food consumption. Fetal LO(A)EL = 100 mg/kg bw/d based on statistically significantly decreased body weight. |
Commercial mixture of TBPH and TBB (WIL Research Laboratories, Inc., 1997e) [WIL-12375] |
Short-term Toxicity |
Species: Rat – SD (male and female) n = 12 males and 12 females, each in Control & 1000 mg/kg bw/d group and 6 males and 6 females each in 160 and 400 mg/kg bw/d group Dose: Gavage with Commercial mixture of TBPH and TBB (purity 97.4%) at 0, 160, 400 or 1000 mg/kg bw/d (5 ml/kg) for 28 consecutive days with 14-day recovery period Vehicle: corn oil (5 ml/kg) Study quality: GLP; OECD 407 Functional Observational Battery (FOB) addition to standard OECD TG 407: home cage, handling, open field, sensory, neuromuscular and physiological observations as well as locomotor activity. Observations on six animals/sex/group during pre-test, study week 3 and study week 5 (recovery; control and high-dose). |
No mortality observed Treatment- related findings included relaxed vaginal openings in a number of females in all dose groups [control, 160, 400, 1000 mg/kg bw/d = 0/6, 1/6, 2/6, 5/12] – Effects were reversible during recovery period. Increased salivation in most animals both sexes in the high-dose group (1000 mg/kg bw/d); generally sporadic and limited occurrences week 1 to end of dosing – Effects reversed during recovery. Low incidence of scabbing, relaxed scrotum, wet yellow material on urogenital area and ocular discharge. Statistically significant decrease in mean body weight gain in high-dose animals and mid-dose females, as well as in low-dose females on week 3. Statistically significant decrease in body weight gain in low-dose females from week 2 to end of dosing. Comparable high-dose vs control recovery for body weight gain. Recovery for high-dose mean body weights; within 7% of controls. Decreased food consumption observed in males in 1000 mg/kg bw/d group in week 1 and 2 and high-, mid- and low-dose females from week 1 to end of dosing; no differences from control during recovery. Decreased mean body weight in high-dose females for physical observations at study week 3. No significant differences observed in the functional observational battery and motor activity tests. Significant increase in mean albumin-globulin (A/G) ratio in high-dose group at study week 4. Significant increase in mean serum chloride in all high-dose male and female rats and mid and low-dose females; potentially treatment related. Statistically significant decrease in mean platelet and lymphocyte count in female in high-dose group in week 4. During recovery period, females in high-dose group had increase mean total leukocyte and absolute lymphocyte count and decrease in mean red blood cells, haemoglobin and hematocrit count – not considered treatment-related as changes were to high-dose females only and/or values were within historical controls. Significant decrease in mean absolute heart, ovary and adrenal gland weight in high-dose female vs control. Increased mean relative (to body weight) liver weight in high-dose groups and in mid-dose male. Increased mean relative (to final body weight means) brain weights in females in all treatment groups and increased relative heart and kidney weights in the females in mid-dose group. *Significance noted to be a result of reduced final body weight means. **Not considered to be a direct effect of treatment by authors (absolute organ weights had no differences in corresponding relative to final mean body weight; relative weight not difference in corresponding absolute organ weight means. Regeneration of renal cortical tubular epithelium noted in all treatment groups at necropsy [control, 160, 400, 1000 mg/kg bw/d: males = 0/6, 2/6, 4/6, 5/6; females: 0/6, 6/6, 6/6, 6/6] – no observation of renal tubular regeneration in 1000 mg/kg bw/d group. Other microscopic changes of the kidney included nephropathy, tubular mineralization, hydronephrosis and nonsuppurative inflammation in control and treated groups. Substantial to full recovery from all effects was observed in animals following 2 weeks of cessation of exposure. LOEL = 160 mg/kg bw/d based on body weight effects in females, kidney effects in males and females as well as increased levels of mean serum chloride at all dose levels in females. LOAEL = 1000 mg/kg bw/d: changes in body weight and clinical chemistry in both sexes. |