
Tropical cyclone season summary: 2015
The 2015 tropical cyclone season in the Atlantic Basin was slightly below average in terms of the number of named storms. There were 11 named storms, four of which reached hurricane strength. However, the 2015 tropical cyclone season had a relatively low impact on Canadian territory.
The first storm that the Canadian Hurricane Centre (CHC) tracked was Tropical Storm Ana, with one message issued. That bulletin was primarily released to inform the public that impacts on Atlantic Canada were unlikely.
The second storm requiring response from the CHC was Tropical Storm Claudette. Impacts on land areas of Atlantic Canada were minimal. Heavy showers and gusty winds below gale-force occurred over southeastern portions of Newfoundland. Swell waves reached the southern coastlines of Nova Scotia and Newfoundland with minimal impact. Gale-force winds and significant waves occurred offshore.
Post-Tropical Storm Henri's remnants gave some minimal impacts to southeastern Newfoundland as well in the form of rainfall and gusty easterly winds. Offshore, gale-force winds and elevated sea states were reported.
The fourth storm of concern to Canadian territory was Hurricane Joaquin. Although Joaquin tracked south of the marine district at hurricane strength, impact was relatively minimal. Gale warnings were in effect for the extreme southern marine areas during Joaquin's closest approach. Large swell waves reached the southern coastlines of Nova Scotia and Newfoundland.
Below is a map showing the four storms of tropical origin that affected Canadian territory in 2015.
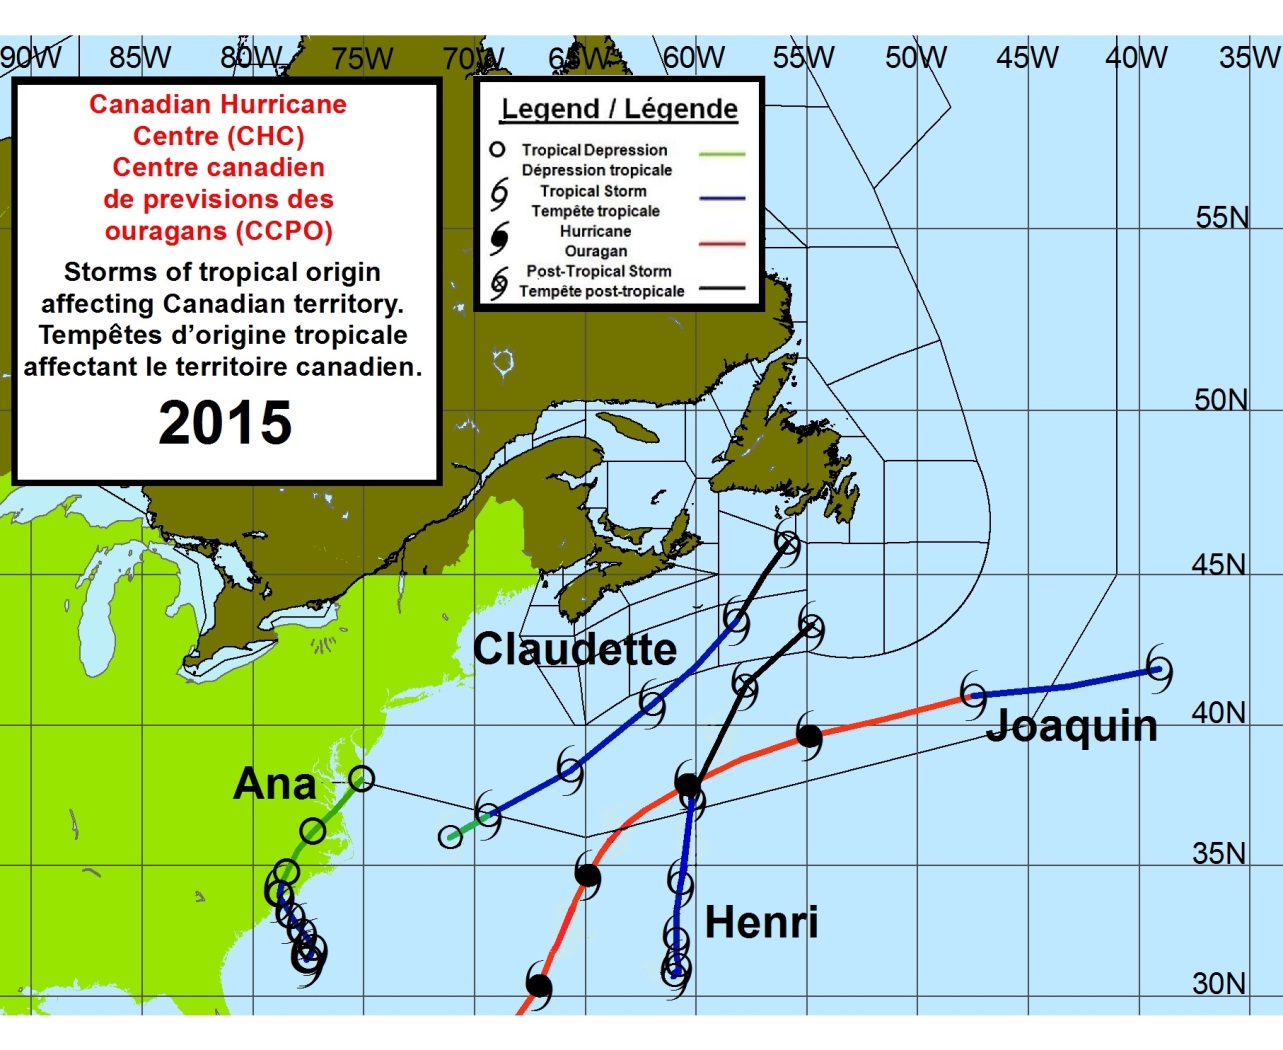
Long description
Four storms of tropical origin generated response from the Canadian Hurricane Centre (CHC) in 2015. The CHC issued one bulletin on Tropical Storm Ana to say that the storm would have minimal impact to Canada. The second storm requiring response from the CHC was Tropical Storm Claudette. This storm was mostly a marine impacting storm giving gale-force winds and large waves offshore. However, gusty winds below gale-force and heavy showers reached southeastern portions of the Avalon Peninsula. Claudette also produced swell waves along the southern coastlines of Nova Scotia and Newfoundland. Post-Tropical Storm Henri produced similar conditions to Newfoundland as Claudette did. Hurricane Joaquin tracked south of Canada’s marine areas. However, gale-force winds likely occurred over the extreme southern Grand Banks and large swell waves reached the southern coastlines of Nova Scotia and Newfoundland.
Legend Details
 Indicates Point on the track of a Tropical Depression
 Indicates Point on the track of a Tropical Storm
 Indicates Point on the track of a Hurricane
 Indicates Point on the track of a Post-Tropical Storm
A summary of bulletins issued by the CHC is shown below, including a history of previous years. In terms of the number of information statements issued, 2015 was one of the least active years for the CHC.
| Bulletin summaries | 2015 | 2014 | 2013 | 2012 | 2011 | 2010 | 2009 | 2008 | 2007 | 2006 |
|---|---|---|---|---|---|---|---|---|---|---|
| Unique hurricane information statements (WOCN3X/4X CWHX) | 23 | 82 | 32 | 64 | 99 | 79 | 37 | 90 | 48 | 93 |
| Number of storms represented by these bulletins | 4 | 4 | 2 | 4 | 8 | 4 | 2 | 6 | 4 | 5 |
The following is a summary of the four events of tropical origin that impacted Canadian territory in 2015.
Ana
Long description
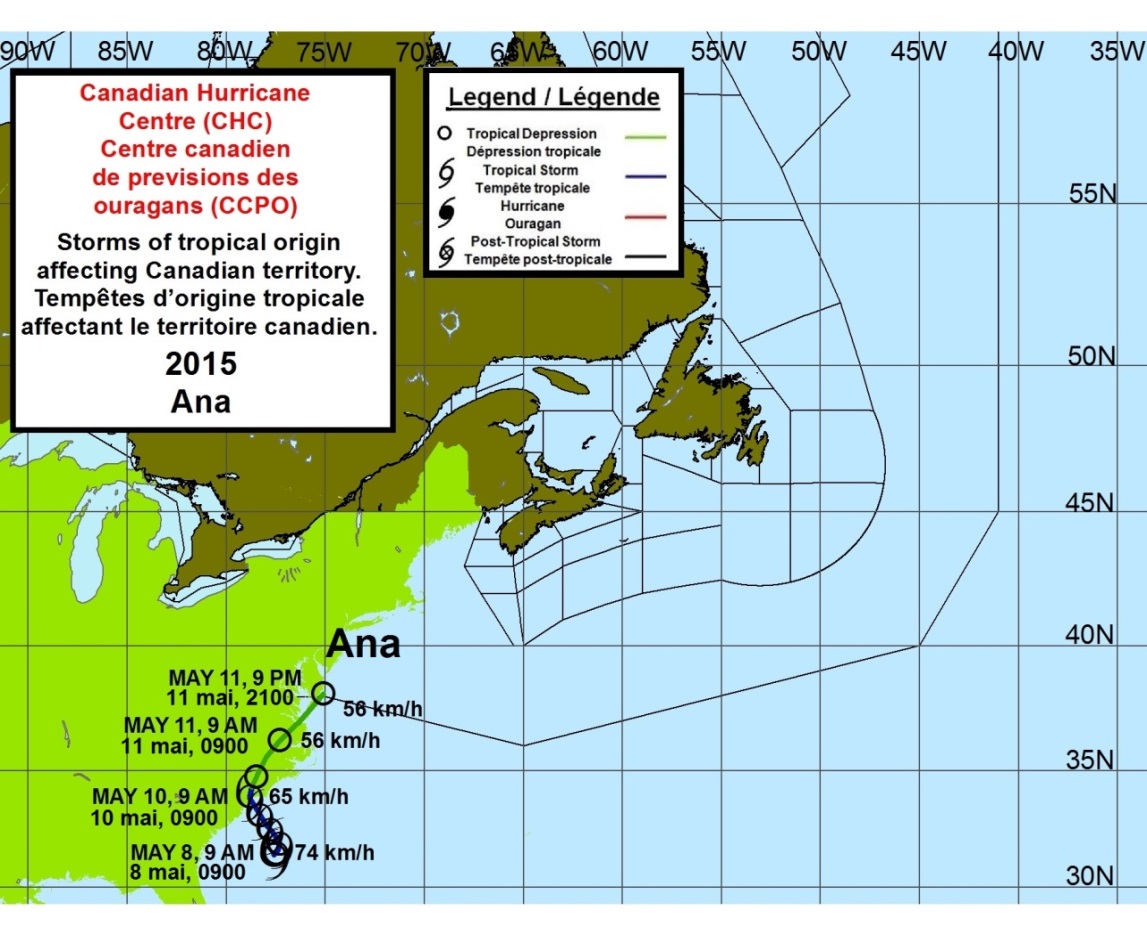
Tropical Storm Ana formed as a subtropical storm from a non-tropical area of low pressure north of the Bahamas early on May 8th. Later that day, Ana intensified to a 50 knot (95 km/h) storm while moving over the warm Gulf Stream waters. Ana became fully tropical in nature by early morning of May 9th. However, dry air and northwesterly wind shear halted intensification and limited most of the convection to the eastern side of the circulation. Late on May 9th and early on May 10th, Ana accelerated toward the coast of South Carolina while gradually weakening as it moved over cooler water closer to the coast. During the morning of May 10th, Ana made landfall in between Myrtle Beach and North Myrtle Beach. Of note, Ana was the earliest recorded tropical cyclone to make landfall in the United States.
After landfall, Ana weakened to a tropical depression during the afternoon of May 10th. Tropical Depression Ana then moved over eastern North Carolina and southeastern Virginia on May 11th before re-entering the Atlantic that evening. Ana at that point became a remnant low. This low accelerated northeastward and merged with a frontal system near southwestern Nova Scotia late on May 12th. Impacts on Canadian territory were minimal. However, a slight enhancement of rainfall over southwestern Nova Scotia was possible. Yarmouth reported showers and thundershowers during the evening of May 12th.
Legend Details
Indicates Point on the track of a Tropical Depression
Indicates Point on the track of a Tropical Storm
Indicates Point on the track of a Hurricane
Indicates Point on the track of a Post-Tropical Storm
Visible Satellite Image Of Ana Near the Time of Landfall in South Carolina

Storm and Synoptic History
Tropical Storm Ana formed as a subtropical storm from a non-tropical area of low pressure north of the Bahamas on May 8th. After being classified as Subtropical Storm Ana at 00:00 UTC, May 8th, the storm intensified to a 50 knot (95 km/h) storm while moving over the warm Gulf Stream waters. Ana became fully tropical in nature by early morning of May 9th. Dry air and northwesterly wind shear on May 9th halted intensification and limited most of the convection to the eastern side of the circulation. Late on May 9th and early on May 10th, Ana accelerated toward the coast of South Carolina while gradually weakening as it moved over cooler water closer to the coast. At 10:00 UTC on May 10th, Ana made landfall in between Myrtle Beach and North Myrtle Beach. Of note, Ana was the earliest recorded tropical cyclone to make landfall in the United States.
After landfall, Ana weakened to a tropical depression during the afternoon of May 10th. Tropical Depression Ana then moved over eastern North Carolina and southeastern Virginia on May 11th before re-entering the Atlantic by 00:00 UTC on May 12th. Ana at that point became a remnant low. This low accelerated northeastward and merged with a frontal system near southwestern Nova Scotia late on May 12th. Impacts on Canadian territory were minimal.
Conditions and Impacts
Impacts were minimal; A slight enhancement of rainfall over southwestern Nova Scotia was possible. Yarmouth reported showers and thundershowers in the evening of May 12th.
Warnings & Information Statements
Early in the forecast process, indications were that Ana would track towards Atlantic Canada as a tropical depression or post-tropical storm. Although, forecasters were confident that the impacts from Ana to Atlantic Canada would not be significant, there was some degree of uncertainty with respect to organization of the system as it approached Atlantic Canada.
The challenge for CHC was to determine if whether or not Ana would remain as an entity resulting in rainfall for Nova Scotia. Since Ana was forecast by NHC to track toward Atlantic Canada as a tropical depression or post-tropical storm, the CHC responded to Ana by issuing one unique information statement to inform stakeholders that impacts to Canadian territory would be minimal.
Coordination and Communications Efforts
Very little coordination was required for this storm.
Claudette
Long description
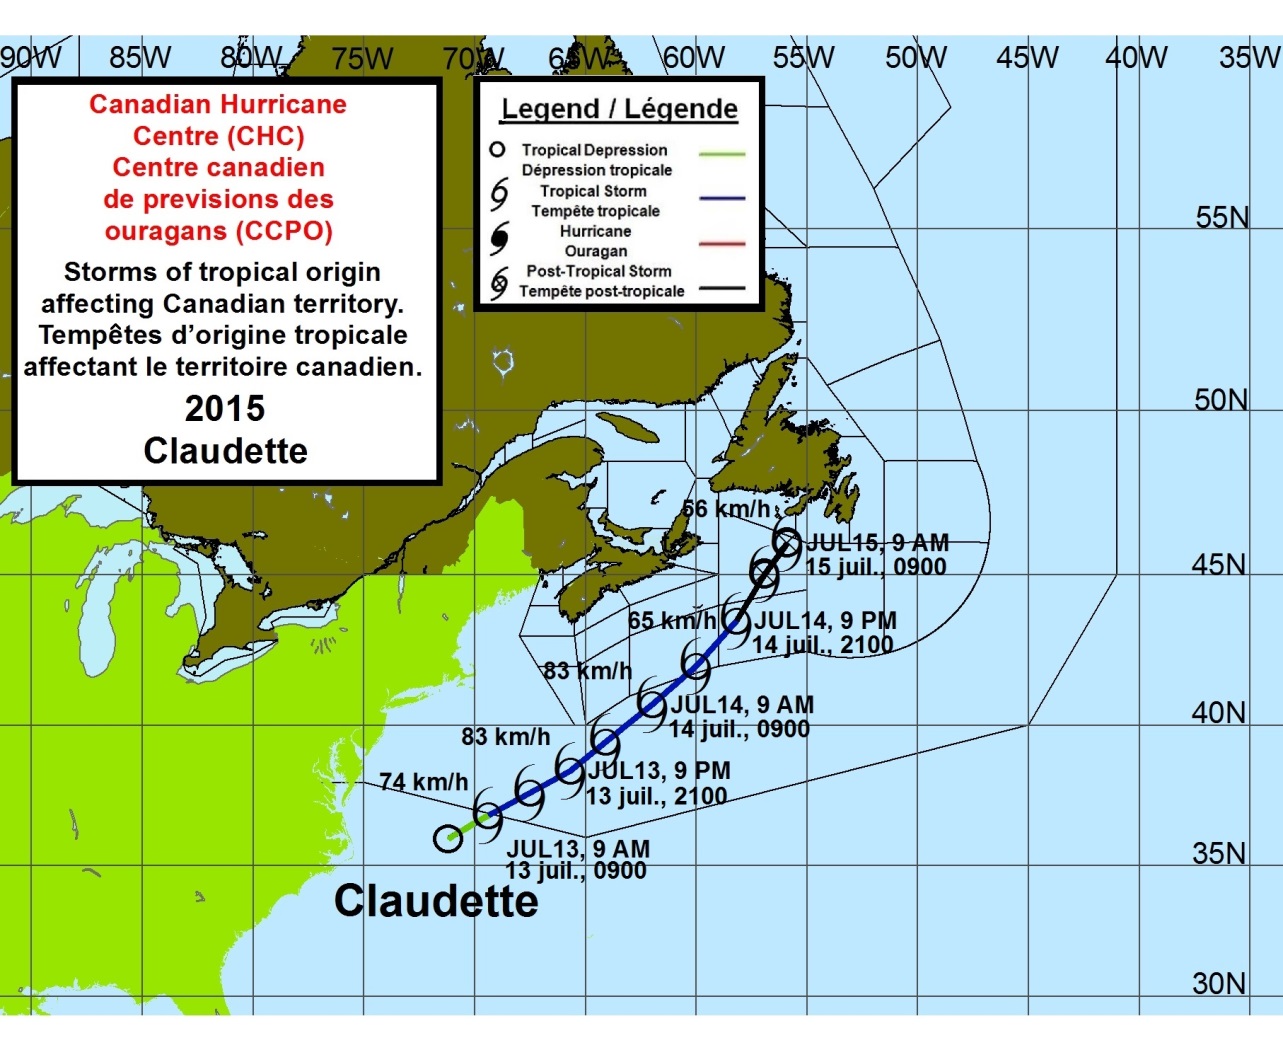
Tropical Storm Claudette formed from a surface low off the Carolina coast. A tropical depression formed very early on July 13th as thunderstorm activity increased near the centre of this low over the Gulf Stream. The depression formed about 410 km east-northeast of Cape Hatteras, North Carolina. By mid-morning on July 13th, the depression had intensified rapidly into Tropical Storm Claudette. Claudette moved northeastward ahead of a trough of low pressure and reached its maximum intensity of 45 knots (85 km/h) on the afternoon of July 13th with a central pressure of 1003 mb.
On July 14th, Claudette began to weaken and by evening, the storm became a remnant-low. Later that day the remnant-low was absorbed by a front south of Newfoundland.
Over land, Claudette produced heavy showers and gusty winds over southeastern Newfoundland. In addition, rain and fog from Claudette’s remnants caused flight cancellations in southeastern Newfoundland.
Offshore, impacts included gale-force winds and average wave heights of 5 metres, with peak waves up to 9 metres recorded. In July, gale-force winds and large seas are not very common in Atlantic Canada. Therefore, mariners had to be extra diligent about Claudette, especially over parts of the southern-most slope waters.
Track readings issued by the Canadian Hurricane Centre:
Tropical Storm Claudette #3
July 13. 2015, 9 PM ADT, wind speed 85 km/h (38.8 N/66.0 W).
Status: Tropical Storm as shown by a tropical storm symbol on a blue track line.
July 14. 2015, 3 AM ADT, wind speed 85 km/h (39.4 N/64.3 W).
Status: Tropical Storm as shown by a tropical storm symbol on a blue track line.
July 14. 2015, 9 AM ADT, wind speed 75 km/h (40.7 N/62.6 W).
Status: Tropical Storm as shown by a tropical storm symbol on a blue track line.
July 14. 2015, 3 PM ADT, wind speed 65 km/h (41.9 N/60.5 W).
Status: Tropical Storm as shown by a tropical storm symbol on a blue track line.
July 14. 2015, 9 PM ADT, wind speed 75 km/h (43.3 N/59.1 W).
Status: Tropical Storm as shown by a tropical storm symbol on a blue track line.
July 15. 2015, 3 AM ADT, wind speed 65 km/h (44.8 N/56.9 W).
Status: Post-Tropical Storm as shown by a post-tropical storm symbol on a black track line.
July 15. 2015, 9 AM ADT, wind speed 55 km/h (46.2 N/55.7 W).
Status: Post-Tropical Storm as shown by a post-tropical storm symbol on a black track line.
Legend Details
Indicates Point on the track of a Tropical Depression
Indicates Point on the track of a Tropical Storm
Indicates Point on the track of a Hurricane
Indicates Point on the track of a Post-Tropical Storm
Satellite Image of Claudette East of the Eastern Seaboard

Storm and Synoptic History
Tropical Storm Claudette formed from a surface low off the Carolina coast. A tropical depression formed by 06:00 UTC on July 13th as thunderstorm activity increased near the centre of this low over the Gulf Stream. The depression formed about 410 km east-northeast of Cape Hatteras, North Carolina. By 12:00 UTC that day, the depression had intensified rapidly into Tropical Storm Claudette. Claudette moved northeastward ahead of a trough of low pressure and reached its maximum intensity of 45 knots (85 km/h) at 18:00 UTC, July 13th with a central pressure of 1003 mb.
On July 14th, Claudette began to weaken and by 00:00 UTC July 15th, the storm became a remnant-low. Later that day the remnant-low was absorbed by a front south of Newfoundland.
Conditions
Gale-force winds occurred over extreme eastern waters of the Maritime marine district. However, winds diminished below gale-force before Claudette reached Newfoundland and the Newfoundland marine district. Wave heights offshore were significant, likely in part due to wave resonance.
Offshore buoys recorded the following wave heights:
Buoy 44258 (Halifax Harbour): 1.5 metres (Peak Wave 2.4)
Buoy 44137 (East Scotian Slope): 2.7 metres (Peak Wave 4.6)
Buoy 44141 (Laurentian Fan): 5.2 metres (Peak Wave 7.2)
Buoy 44139 (Banquereau Bank): 4.6 metres (Peak Wave 9.4)
Buoy 44251 (Nickerson Bank): 1.9 metres (Peak Wave 3.4)
Impacts
The main impacts over land from Claudette were heavy showers and gusty winds over southeastern Newfoundland. In addition, rain and fog from Claudette's remnants caused flight cancellations in southeastern Newfoundland.
Offshore, impacts included gale-force winds and average wave heights of 5 metres, with peak waves up to 9 metres recorded. In July, gale-force winds and large seas are not very common in Atlantic Canada. Therefore, mariners had to be extra diligent about Claudette, especially over parts of the southern-most slope waters.
Warnings & Information Statements
The CHC issued eight unique information statements for this event. There were no tropical storm watches or warnings required. Gale warnings were issued for southeastern portions of the Maritime marine areas.
Coordination and Communications Efforts
There was close coordination between the CHC, and the Atlantic Storm Prediction Centre (ASPC) and the Newfoundland and Labrador Weather Office (NLWO).
There was also initial coordination between the National Hurricane Center (NHC) and the CHC due to the sudden formation and intensification of Claudette.
Henri
Long description
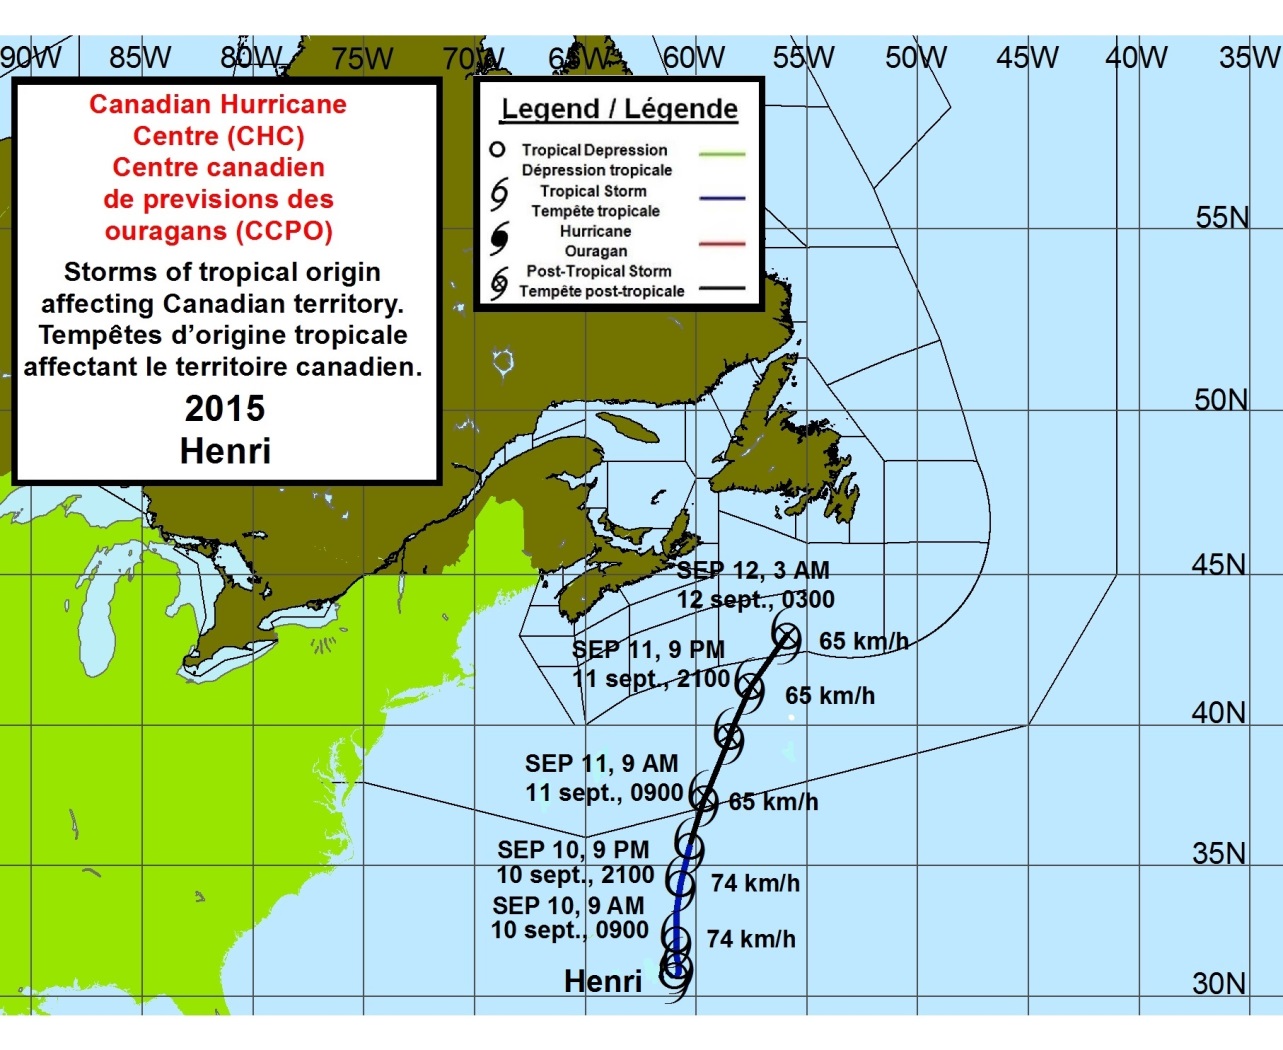
Tropical Storm Henri formed southeast of Bermuda on September 9th. The storm tracked slowly northward at first then accelerated to the north on Sept 10th. Due to increasing westerly shear, Henri was only able to reach a maximum intensity of 45 knots (85 km/h) on Sept 10th.
On September 11th an upper-level trough caused Henri’s circulation to degrade and the storm became post-tropical. By early morning on September 12th, Henri had lost its closed centre and later merged with a non-tropical low.
Post-Tropical Storm Henri produced rain and gusty winds occurred over eastern sections of the Avalon Peninsula. Rainfall amounts were 25 millimetres or less.
Gale-force winds were reported over the Grand Banks as the remnant low of Henri tracked through. Waves were reported by a ship east of Henri to be 3.5 metres. Wave heights from moored offshore buoys were generally in the two to 3 metre range with peak waves generally in the 4 to 5 metre range.
Track readings issued by the Canadian Hurricane Centre:
Tropical Storm Henri # 8
Sept. 10. 2015, 3 AM ADT, wind speed 65 km/h (31.5 N/60.7 W).
Status: Tropical Storm as shown by a tropical storm symbol on a blue track line.
Sept. 10. 2015, 9 AM ADT, wind speed 75 km/h (31.5 N/61.0 W).
Status: Tropical Storm as shown by a tropical storm symbol on a blue track line.
Sept. 10. 2015, 3 PM ADT, wind speed 75 km/h (33.0 N/60.8 W).
Status: Tropical Storm as shown by a tropical storm symbol on a blue track line.
Sept. 10. 2015, 9 PM ADT, wind speed 75 km/h (34.5 N/60.8 W).
Status: Tropical Storm as shown by a tropical storm symbol on a blue track line.
Sept. 11. 2015, 3 AM ADT, wind speed 65 km/h (35.7 N/60.5 W).
Status: Tropical Storm as shown by a tropical storm symbol on a blue track line.
Sept. 11. 2015, 9 AM ADT, wind speed 65 km/h (37.5 N/60.1 W).
Status: Post-Tropical Storm as shown by a post-tropical storm symbol on a black track line.
Sept. 11. 2015, 3 PM ADT, wind speed 65 km/h (39.4 N/58.5 W).
Status: Post-Tropical Storm as shown by a post-tropical storm symbol on a black track line.
Sept. 11. 2015, 9 PM ADT, wind speed 65 km/h (41.2 N/57.7 W).
Status: Post-Tropical Storm as shown by a post-tropical storm symbol on a black track line.
Sept. 12. 2015, 3 AM ADT, wind speed 75 km/h (43.7 N/54.9 W).
Status: Post-Tropical Storm as shown by a post-tropical storm symbol
Legend Details
Indicates Point on the track of a Tropical Depression
Indicates Point on the track of a Tropical Storm
Indicates Point on the track of a Hurricane
Indicates Point on the track of a Post-Tropical Storm
Satellite Image of Henri East of Bermuda

Storm and Synoptic History
Tropical Storm Henri formed southeast of Bermuda on September 9th. The storm tracked slowly northward at first then accelerated to the north on Sept 10th. Due to increasing westerly shear, Henri was only able to reach a maximum intensity of 45 knots (85 km/h) on Sept 10th.
On September 11th an upper-level trough caused Henri's circulation to degrade. By early morning on September 12th, Henri had lost its closed centre and later merged with a non-tropical low.
Conditions
Rain and gusty winds occurred over eastern sections of the Avalon Peninsula. Rainfall amounts were 25 millimetres or less.
Gale-force winds were reported over the Grand Banks as the remnant low of Henri tracked through. Seas were reported by a ship east of Henri to be 3.5 metres. Wave heights from moored offshore buoys were generally in the two to 3 metre range with peak waves generally in the 4 to 5 metre range.
Offshore buoys recorded the following wave heights:
Buoy 44137 (East Scotian Slope): 2.1 metres (Peak Wave 3.8)
Buoy 44141 (Laurentian Fan): 2.7 metres (Peak Wave 5.2)
Buoy 44139 (Banquereau Bank): 2.7 metres (Peak Wave 4.2)
Buoy 44251 (Nickerson Bank): 2.7 metres (Peak Wave 4.8)
Impacts
Impacts were relatively minimal from the remnant low of Tropical Storm Henri. Mariners needed to be aware of strong to gale-force winds and elevated sea states offshore.
Warnings & Information Statements
Gale warnings were issued for the southern part of the east coast marine district of Newfoundland and for all but northernmost section of the Grand Banks.
Coordination and Communications Efforts
The CHC coordinated messaging and gale warnings with the NLWO throughout the event.
Joaquin
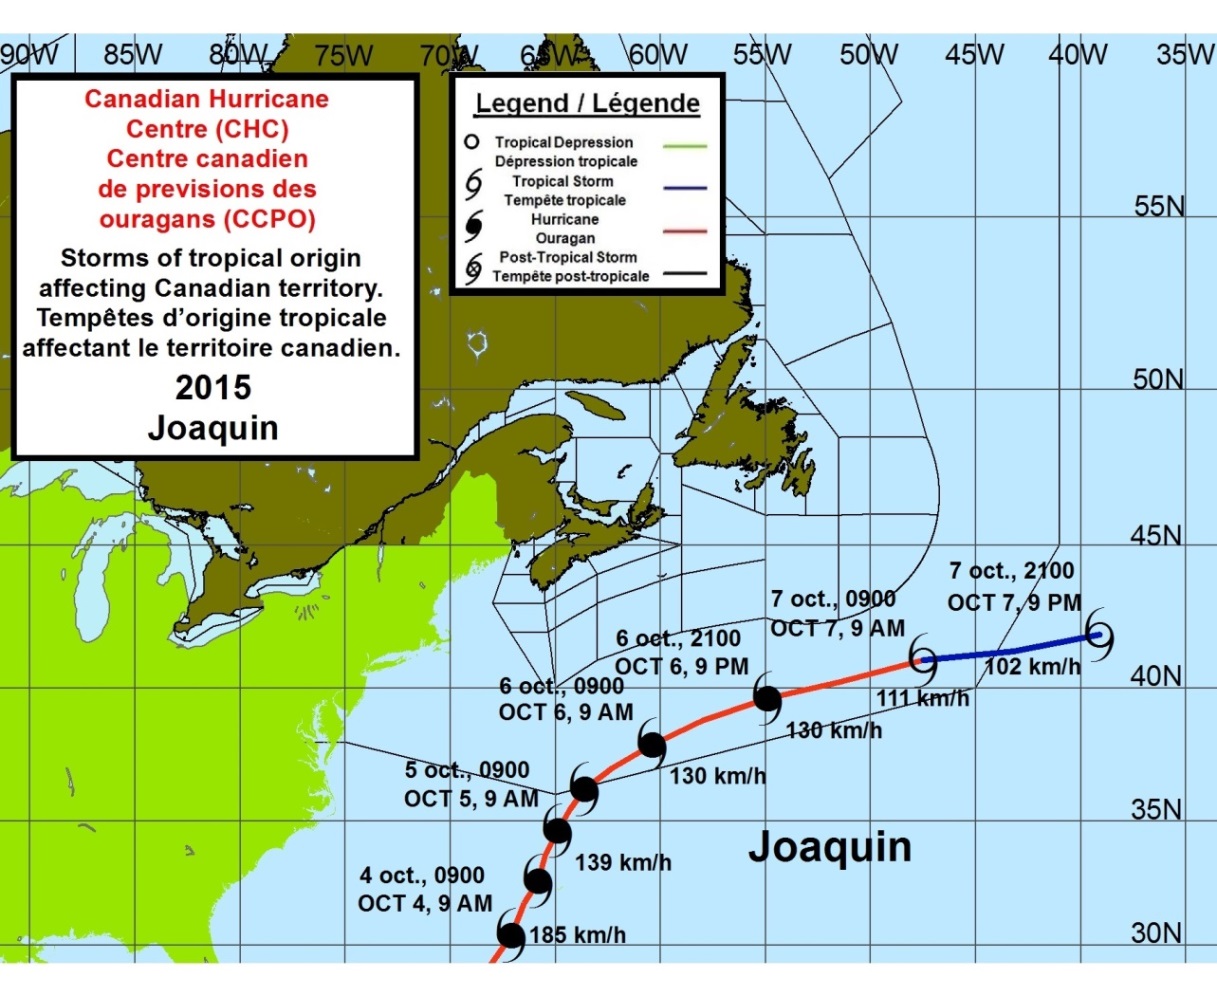
Long description
Hurricane Joaquin developed from a non-tropical low to become a tropical depression on September 28th. On September 29th, the cyclone underwent rapid intensification to become Hurricane Joaquin on September 30th and a Category 3 hurricane on October 1st. Joaquin travelled slowly through the Bahamas on October 1st and 2nd causing devastation. On October 3rd, Joaquin began accelerating away from the Bahamas. It was near noon on October 4th that Joaquin reached its maximum intensity of 135 knots (250 km/h).
Hurricane Joaquin then began to weaken and curve to the north-northeast later on October 4th and by that evening passed 55 nm (105 km) west-northwest of Bermuda at Category 2 strength. Joaquin then curved northeast and then east-northeast around the periphery of a high to the east while gradually weakening. On October 7th Joaquin dropped below hurricane strength while located well southeast of the Grand Banks, at about 1370 km southeast of Cape Race.
Large swell waves reached the southern coastlines of Nova Scotia and Newfoundland. These swell waves were observed by buoy data to be near 2 metres with peak waves near 4 metres. Gale-force winds very likely occurred over the extreme southern scotian slope waters off of Nova Scotia and the extreme southern Grand Banks. Laurentian Fan Buoy reported a gust to 35 knots. However, the winds south of that buoy within the southernmost marine areas were almost certainly stronger and sustained at gale-force.
The extent of impacts to Canadian territory were large swell waves along the south-facing coastlines of Nova Scotia and Newfoundland as well as gale-force winds over the extreme southern marine areas. However, If Hurricane Joaquin had occurred during the summer, the impacts would have been much greater due to much higher sensitivity to coastal wave action. Rip currents almost certainly occurred. Large waves and rip currents would have been a hazard to swimmers.
The CHC did not forecast it’s own track maps for Joaquin and the CHC desk was not staffed on a full time basis. The decision was made by forecasters in Atlantic Canada that regular forecast bulletins from the Atlantic Storm Prediction Centre and the Newfoundland and Labrador Weather Office would sufficiently advise the public and marine communities of Joaquin’s impacts. As a result, staffing from the CHC was not required. This decision was made in part because of climatology of wind and waves in Atlantic Canada in October.
Legend Details
Indicates Point on the track of a Tropical Depression
Indicates Point on the track of a Tropical Storm
Indicates Point on the track of a Hurricane
Indicates Point on the track of a Post-Tropical Storm
Satellite Image of Joaquin Tracking South of Atlantic Canada

Storm and Synoptic History
Hurricane Joaquin developed from a non-tropical low to become a tropical depression on September 28th. On September 29th, the cyclone underwent rapid intensification to become Hurricane Joaquin on September 30th and a Category 3 hurricane on October 1st. Joaquin travelled slowly through the Bahamas on October 1st and 2nd causing devastation. On October 3rd, Joaquin began accelerating away from the Bahamas. It was on October 4th at 16:00 UTC that Joaquin reached its maximum intensity of 135 knots (250 km/h).
Hurricane Joaquin then began to weaken and curve to the north-northeast later on October 4th and by 00:00 UTC October 5th passed 55 nm (105 km) west-northwest of Bermuda at Category 2 strength. Joaquin then curved northeast and then east-northeast around the periphery of a high to the east while gradually weakening. On October 7th Joaquin dropped below hurricane strength while located well southeast of the Grand Banks, at about 1370 km southeast of Cape Race.
Conditions
Large swell waves reached the southern coastlines of Nova Scotia and Newfoundland. These waves were near 2 metres with peak waves near 4 metres as shown by the table of buoy data below. Otherwise Hurricane Joaquin did not affect land areas of Atlantic Canada.
Gale-force winds very likely occurred over the extreme southern scotian slope waters off of Nova Scotia and the extreme southern Grand Banks. Laurentian Fan Buoy reported a gust to 35 knots. However, the winds south of that buoy within the southernmost marine areas were almost certainly stronger and sustained at gale-force.
Offshore buoys recorded the following wave heights:
Buoy 44258 (Halifax Harbour): 2.1 metres (Peak Wave 3.7)
Buoy 44137 (East Scotian Slope): 3.6 metres (Peak Wave 6.2)
Buoy 44141 (Laurentian Fan): 4.1 metres (Peak Wave 6.6)
Buoy 44139 (Banquereau Bank): 3.5 metres (Peak Wave 5.6)
Buoy 44251 (Nickerson Bank): 2.1 metres (Peak Wave 4.4)
Impacts
The extent of impacts to Canadian territory were large swell waves along the south-facing coastlines of Nova Scotia and Newfoundland as well as gale-force winds over the extreme southern marine areas. However, If Hurricane Joaquin had occurred during the summer, the impacts would have been much greater due to much higher sensitivity to coastal wave action. Rip currents almost certainly occurred. Large waves and rip currents would have been a hazard to swimmers.
Warnings & Information Statements
There were two information statements issued by the CHC on this storm on October 2nd. These bulletins stated that the track forecast for Hurricane Joaquin was highly uncertain and had two scenarios. One scenario was that Joaquin would strongly interact with a trough to its west and track northwestward making landfall on the east coast of the United States. Another scenario was for Joaquin to have less interaction with the trough and turn northeastward away from the Eastern Seaboard and well south of Atlantic Canada. On October 2nd, the second track scenario became increasingly more likely. Therefore, the two bulletins issued by the CHC stated that such an offshore track would give minimal impact to land areas in Canada and would not require subsequent bulletins from the CHC.
Hurricane Joaquin was a very significant forecast challenge for the NHC and for forecasters in Atlantic Canada including the CHC lead forecaster. As previously stated, there were two distinct track scenarios for Joaquin. If Hurricane Joaquin were to make landfall in the United States, moisture from the storm could lead to rainfall in southern Ontario and southern Quebec where the ground was already saturated from a previous heavy rain event. However, if Joaquin were to track away from the east coast of the United States and well south of Atlantic Canada, impacts to Canadian land territory would be limited to large swell waves at the coastlines.
Hurricane Joaquin took the second track scenario by turning northeastward into the Atlantic. Once forecasters knew which track scenario Joaquin was going to take, confidence became very high in Joaquin's impacts. Impact to Canadian land territory would be limited to large swell waves at the southern coastlines of Nova Scotia and Newfoundland. Impact to Canadian offshore waters would be limited to gale-force winds over the extreme southern marine areas.
Therefore, the decision was made by forecasters in Atlantic Canada that regular forecast bulletins and staffing from the CHC were not required and that routine forecast products from the ASPC and the NLWO would sufficiently advise the public and marine communities of Joaquin's impacts. This decision was made in part because of climatology of wind and waves in Atlantic Canada in October.
Coordination and Communications Efforts
There was considerable coordination between the head of CHC operations, ASPC and NLWO on Joaquin. This coordination was based on conditions expected over southern marine areas and southern coastlines. In addition, all parties were involved in the decision to not issue regular products on this storm from the CHC. Joaquin generated moderate media coverage in Canada due to its significant impacts in the Caribbean.