
Bird Conservation Strategy for region 14 in New Brunswick and select marine units
- Abridged version -
November 2013

The abridged version of the strategy available here contains a summary of the results, but does not include an analysis of conservation needs by habitat, a discussion of widespread conservation issues, or the identification of research and monitoring needs.
Other formats available for this document:
Table of contents
- Preface
- Acknowledgements
- Bird Conservation Strategy for Bird Conservation Region 14 and Marine Biogeographic Units 11 and 12 in New Brunswick: Atlantic Northern Forest, Bay of Fundy and Gulf of St. Lawrence
- Executive summary
- Introduction: Bird Conservation Strategies
- Section 1: Summary of results - All Birds, All Habitats
- References
List of figures
- Figure 1. Land cover in BCR 14 in New Brunswick, Atlantic Northern Forest.
- Figure 2. Map of protected and designated areas in BCR 14 NB, Atlantic Northern Forest.
- Figure 3. Map of protected and designated areas in MBU 11 (M11) and MBU 12 (M12).
- Figure 4. Percent of priority bird species that are associated with each habitat type in BCR 14 NB.
- Figure 5. Percent of priority bird species that are associated with each habitat type in MBU 11 NB.
- Figure 6. Percent of priority bird species that are associated with each habitat type in MBU 12 NB.
- Figure 7. Percent of priority bird species that are associated with each population objective category in BCR 14 NB.
- Figure 8. Percent of priority bird species that are associated with each population objective category in MBU 11 NB.
- Figure 9. Percent of priority bird species that are associated with each population objective category in MBU 12 NB.
- Figure 10. Percent of identified threats to priority bird species within BCR 14 NB by threat sub-category.
- Figure 11. Percent of identified threats to priority bird species within MBU 11 NB by threat sub-category.
- Figure 12. Percent of identified threats to priority bird species within MBU 12 NB by threat sub-category.
- Figure 13. Percent of all conservation objectives assigned to each conservation objective category in BCR 14 NB.
- Figure 14. Percent of all conservation objectives assigned to each conservation objective category in MBU 11 NB.
- Figure 15. Percent of all conservation objectives assigned to each conservation objective category in MBU 12 NB.
- Figure 16. Percent of recommended actions assigned to each sub-category in BCR 14 NB.
- Figure 17. Percent of recommended actions assigned to each sub-category in MBU 11 NB.
- Figure 18. Percent of recommended actions assigned to each sub-category in MBU 12 NB.
List of tables
- Table 1. Priority bird species in BCR 14 NB, MBU 11 NB, and MBU 12 NB, population objective, and the reason for priority status.
- Table 2. Summary of priority bird species, by bird group, in BCR 14 NB, MBU 11 NB and MBU 12 NB.
- Table 3. Number of priority bird species in BCR 14 NB, MBU 11 NB and MBU 12 NB by reason for priority status.
- Table 4. Relative magnitude of identified threats to priority species within BCR 14 NB, MBU 11 NB and MBU 12 NB by threat category and broad habitat class.
Preface
Environment and Climate Change Canada led the development of all-bird conservation strategies in each of Canada’s Bird Conservation Regions (BCRs) by drafting new strategies and integrating new and existing strategies into an all-bird framework. These integrated all-bird conservation strategies will serve as a basis for implementing bird conservation across Canada, and will also guide Canadian support for conservation work in other countries important to Canada’s migrant birds. Input to the strategies from Environment and Climate Change Canada’s conservation partners is as essential as their collaboration in implementing their recommendations.
Environment and Climate Change Canada has developed national standards for strategies to ensure consistency of approach across BCRs. Bird Conservation Strategies will provide the context from which specific implementation plans can be developed for each BCR, building on the programs currently in place through Joint Ventures or other partnerships. Landowners including Aboriginal peoples will be consulted prior to implementation.
Conservation objectives and recommended actions from the conservation strategies will be used as the biological basis to develop guidelines and beneficial management practices that support compliance with regulations under the Migratory Birds Convention Act, 1994.
Acknowledgements
This document follows templates developed by Alaine Camfield, Judith Kennedy and Elsie Krebs with the help of the BCR planners in each of the Canadian Wildlife Service regions throughout Canada. However, work of this scope cannot be accomplished without the contribution of many colleagues who provided or validated technical information, commented on earlier draft versions of the strategy, and supported the planning process. We would like to extend a sincere thank-you to Doug Bliss, Andrew Boyne, Paul Chamberland, Kevin Davidson, Michael Elliot, Carina Gjerdrum, Alan Hanson, Christie MacDonald, Bryan Martin, Keith McAloney, Bruce Pollard, Martin Raillard, Isabelle Robichaud, Dane Stuckel, Kyle Wellband, Becky Whittam and other reviewers.
Bird Conservation Strategy for Bird Conservation Region 14 and Marine Biogeographic Units 11 and 12 in New Brunswick: Atlantic Northern Forest, Bay of Fundy and Gulf of St. Lawrence
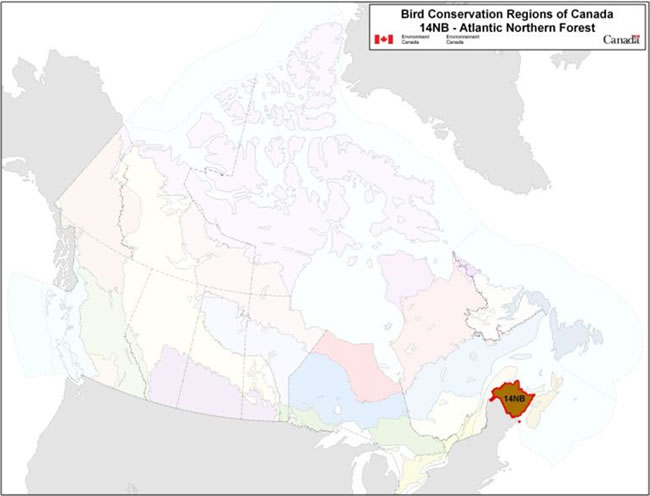
Long description for BCR 14 NB Map
Map of the Bird Conservation Regions (BCRs) of Canada with BCR 14 NB, Atlantic Region: Atlantic Northern Forest highlighted. The extent of the map includes Canada, with Alaska, Greenland and the northern portion of the U.S. also appearing. The map is divided by BCR (12 Canadian BCRs in total), with various colours, and their exact locations and sizes are indistinguishable, aside from BCR 14.
The highlighted BCR 14 NB encompasses all of New Brunswick and its surrounding waters.
Legend: Bird Conservation Regions of Canada. 14 NB - Atlantic Northern Forest; Environment and Climate Change Canada logo, and Government of Canada logo.
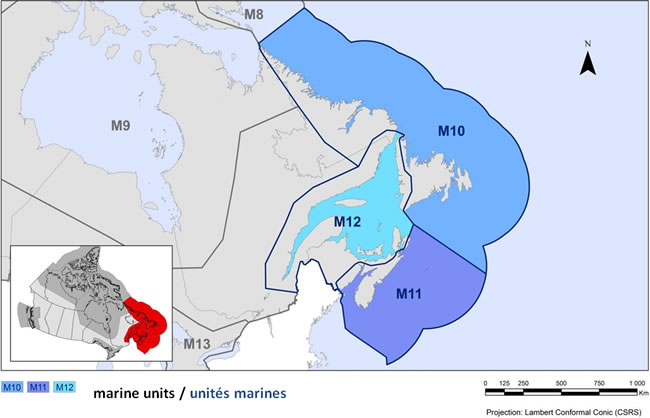
Long description for Marine Unit Map
Map of the Marine Biogeographical Units (MBUs) of eastern Canada. The map’s extent includes the western shore of Hudson Bay to Newfoundland’s offshore areas. M10, M11 and M12 are highlighted, while the adjoining borders of M8, M9 and M13 are visible. M10 covers most of the waters off Labrador and Newfoundland, M11 covers the waters off Nova Scotia, and M12 covers the Gulf of St Lawrence. There is a small map of Canada inset lower left, with the maritime region highlighted. The bilingual legend, along with the scale and projection of the map, appear below.
Executive summary
The landscape of New Brunswick is typical of the Atlantic Northern Forest with mountainous terrain, lowland plains and coastal landforms. Northern temperate forests dominate New Brunswick; the dominant forest types are spruce-fir coniferous and to a lesser extent mixed deciduous-coniferous. The principal land use since European settlement has been forest resource harvesting. As of 2006, only 3% of New Brunswick’s forest area remained untouched by humans. Of the four Atlantic provinces, New Brunswick does not have the largest proportion of agricultural land; however, its agricultural sector is the largest. The traditional fishery in New Brunswick is relatively small and has largely been replaced by aquaculture, making the province a leader in finfish and shellfish culture.
There are 71 priority bird species within the terrestrial and freshwater portions of Bird Conservation Region 14 in New Brunswick (BCR 14 NB) and 29 priority bird species in the marine water-dominated habitats of the Marine Biogeographic Units 11 and 12 around New Brunswick (MBU 11 NB and MBU 12 NB). Wetlands are used by the greatest number of priority bird species (49%), while 44% use forests and 30% use cultivated and managed areas. There are a variety of existing and potential threats to the region’s avifauna. Many of these threats relate to land use, particularly forestry, and include loss or fragmentation of all forest types as a result of logging; habitat loss or fragmentation due to conversion of forest into managed coniferous forests or farmland; and decreases in diet quality, bird health or prey availability due to contamination of food sources related to biocide use in forestry or agriculture. Other threats relate to urban or recreational housing expansion along the coastline, such as habitat loss, disturbance by humans and shoreline modifications for the protection of coastal infrastructure (e.g., roads and houses).
The most frequently identified conservation objective is to ensure adequate habitat availability for priority bird species. As a result, 41% of recommended actions are related to the management or protection of sites or the protection or restoration of habitats.
New Brunswick has 5 500 km of coastline along two main marine waterbodies: the Gulf of St. Lawrence and the Bay of Fundy. There are 47 priority bird species in the coastal habitats of the 3 planning units. Of these, 17 use coastline above the high-tide line (BCR 14 NB), 32 use the intertidal coast of the Bay of Fundy (MBU 11 NB) and 24 use the intertidal coast of the Gulf of St. Lawrence (MBU 12 NB).
Common threats for priority bird species in all three coastal habitats include disturbances due to ATV traffic, dogs walking off-leash and human uses of beaches, and loss of specific habitat features due to changes in sedimentation patterns caused by the installation of riprap which hardens the shoreline. Priority birds in coastal habitats are also threatened by ocean oil spills and oil discharges from shipping activities. Recommended conservation actions to address the threats include managing coastal recreational and commercial activities to minimize disturbance to priority species; raising public awareness of priority birds and their habitat needs and the impacts of disturbance in coastal areas; and developing beneficial management practices and avoidance guidelines to manage shipping activities and minimize accidental oil discharges.
The Bay of Fundy is one of the largest semi-enclosed coastal seas in North America and is recognized as one of the world’s richest marine ecosystems with various marine and estuarine habitats. The MBU 11 NB includes the northern half of the Bay of Fundy, Passamaquody Bay and waters around the Grand Manan archipelago for a total area of 8 000 km2. The Bay of Fundy is renowned for extreme tidal variation and associated currents, and includes some of the most extensive intertidal mudflats, saltmarshes and saltmarsh estuaries in North America.
The Gulf of St. Lawrence is part of one of the largest and most productive estuaries in Canada. It is highly influenced by humans, as it is downstream from some of the largest urban, industrial, and agricultural areas and emitters of industrial and agricultural contaminants. The New Brunswick portion of MBU 12 is significantly warmer and shallower than the rest of the Gulf of St. Lawrence, although in winter this portion is predominantly ice-covered.
There are 29 priority bird species found in the marine waters of MBU 11 NB and 14 priority bird species in the marine waters of MBU 12 NB.
There are a variety of common threats to avifauna assemblages in these marine regions. Current threats include oil pollution from boat traffic, competition for resources or disturbances associated with the fishing industry and aquaculture operations. A combination of beneficial management practices, public education, changes in legislation and clean-up programs could help alleviate many of these threats.
This conservation strategy builds on existing bird conservation strategies and complements those created for the other BCRs across Canada. Collectively, the strategies will serve as a framework for implementing bird conservation nationally and also identify international conservation issues for Canada’s priority birds. Strategies are not highly prescriptive, but rather are intended to guide future implementation efforts undertaken by various partners and stakeholders. More specifically, information presented in this document is based on an extensive and systematic literature review that, in turn, was reviewed by key regional experts on bird conservation. Planning and implementing conservation actions for priority birds in New Brunswick will necessitate further discussion and work in order to prioritize the recommended actions with key partners.
Introduction: Bird Conservation Strategies
Context
This document is one of a suite of Bird Conservation Region strategies (BCR strategies) that have been drafted by Environment and Climate Change Canada for all regions of Canada. These strategies respond to Environment and Climate Change Canada’s need for integrated and clearly articulated bird conservation priorities to support the implementation of Canada’s migratory birds program, both domestically and internationally. This suite of strategies builds on existing conservation plans for the four “bird groups” (waterfowl,Footnote 1 waterbirds,Footnote 2 shorebirdsFootnote 3 and landbirdsFootnote 4) in most regions of Canada, as well as on national and continental plans and includes birds under provincial/territorial jurisdiction. These new strategies also establish standard conservation planning methods across Canada and fill gaps, as previous regional plans do not cover all areas of Canada or all bird groups.
These strategies present a compendium of required actions based on the general philosophy of achieving scientifically based desired population levels as promoted by the four pillar initiatives of bird conservation. Desired population levels are not necessarily the same as minimum viable or sustainable populations but represent the state of the habitat/landscape at a time prior to recent dramatic population declines in many species from threats known and unknown. The threats identified in these strategies were compiled using currently available scientific information and expert opinion. The corresponding conservation objectives and actions will contribute to stabilizing populations at desired levels.
The BCR strategies are not highly prescriptive. In most cases, practitioners will need to consult additional information sources at local scales to provide sufficient detail to implement the recommendations of the strategies. Tools such as beneficial management practices will also be helpful in guiding implementation. Partners interested in participating in the implementation of these strategies, such as those involved in the habitat Joint Ventures established under the North American Waterfowl Management Plan (NAWMP), are familiar with the type of detailed implementation planning required to coordinate and undertake on-the-ground activities.
Strategy Structure
This strategy includes three distinct planning units, the terrestrial portion of Bird Conservation Region 14 in New Brunswick (BCR 14 NB) and Marine Biogeographic Units 11 and 12 around New Brunswick (MBU 11 NB and MBU 12 NB). All three units have distinctive lists of priority bird species. Both MBUs have only two habitat classes: the waterbodies, snow and ice habitat class, and the coastal habitat class. To distinguish these habitat classes in the three planning units, they are renamed “marine waters” and “coastal (intertidal)” for MBU 11 and 12 NB, and ”inland waterbodies” and “coastal (above high tide)” for BCR 14 NB.
Section 1 of this strategy, published here, presents general information about the BCR and MBUs and the subregion, with an overview of the six elementsFootnote 5 that provide a summary of the state of bird conservation at the sub-regional level. Section 2, included in the full version of the strategy, provides more detail on the threats, objectives and actions for priority species grouped by each of the broad habitat types in the subregion. Section 3, also in the full version, presents additional widespread conservation issues that are not specific to a particular habitat or were not captured by the threat assessment for individual species, as well as research and monitoring needs, and threats to migratory birds while they are outside Canada. The approach and methodology are summarized in the appendices of the full version, but details are available in a separate document (Kennedy, et al. 2012). A national database houses all the underlying information summarized in this strategy and is available from Environment and Climate Change Canada.
Characteristics of Bird Conservation Region 14: Atlantic Northern Forest in New Brunswick
Bird Conservation Region 14 (Atlantic Northern Forest) encompasses an area greater than 35.6 million ha and includes the Maritime provinces, the Gaspé Peninsula and the Eastern Townships in Canada, and most of the states of Maine, New Hampshire and Vermont, and parts of New York, Massachusetts and Connecticut in the United States (Dettmers 2006). Most of this BCR is low-mountainous or open hilly country interspersed with valleys and plains; nearly 85% of the BCR is classified as some type of forest (including regenerating forest; Dettmers 2006).
The portion of BCR 14 in the province of New Brunswick extends over 73 000 km2 and reflects the combination of mountainous, lowland plain and coastal landforms encompassed within the Atlantic Northern Forest (also known as the Acadian Forest; Fig. 1). The maps in this document are drawn at scales and resolutions that differ from the land cover percentages provided; however, Dettmers (2006) has estimated that there are 15 different land cover types in all of BCR 14 and within each province and state. The estimates may not be current, but they do provide a relative idea of the importance (in terms of size) of particular habitat types within BCR 14 NB.
Figure 1. Land cover in BCR 14 in New Brunswick, Atlantic Northern Forest.
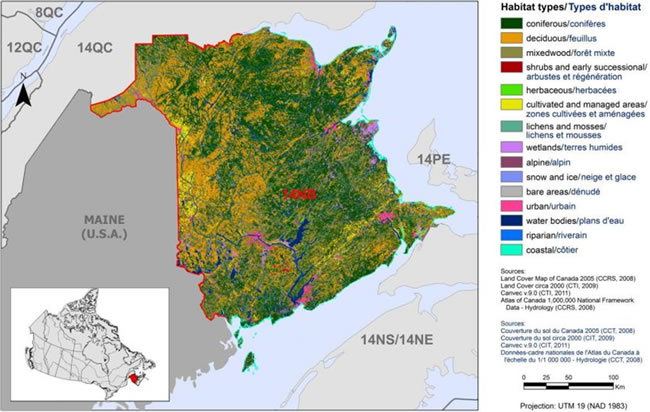
Long description for Figure 1
Map of the landcover in BCR 14 NB Region: Atlantic Northern Forest. The map’s extent includes most of Maine, all of new Brunswick, western PEI, part of central Nova Scotia and part of Quebec along the northern borders of Maine and New Brunswick; adjoining BCRs are also shown.
BCR 14 NB covers all of New Brunswick. The various habitat types that exist in the BCR are shown on the map, and are explained in the following bilingual legend (appearing to the right of the map):
- Coniferous/conifères
- Deciduous/feuillus
- Mixedwood/forêt mixte
- Shrubs and early successional/arbustes et régénération
- Herbaceous/herbacées
- Cultivated and managed areas/zone cultivées et aménagées
- Lichens and mosses/lichens et mousses
- Wetlands/terres humides
- Alpine/alpin
- Snow and ice/neige et glace
- Bare areas/denude
- Urban/urbain
- Water bodies /plans d’eau
- Riparian/riverain
- Coastal/côtier
The remaining text in the legend provides the data sources for the map (i.e. Land Cover Map of Canada 2005 (CCRS, 2008), the projection of the map (i.e. UTM 9 (NAD 1983)) and there is a visual representation of the scale of the map.
For BCRs 14 NB, the most common habitat type is coniferous forest, followed by deciduous forest, with a smaller proportion of wetlands, and cultivated and managed areas.
Northern temperate forests dominate a large portion of BCR 14 NB, and the most predominant forest types include coniferous forests (called evergreen forest in Dettmers (2006); 27 000 km2), mixed deciduous-coniferous forests (14 000 km2) and deciduous forests (13 000 km2). Early successional/shrubland habitat including regenerating forests (5 300 km2) and natural shrublands (650 km2) is another major habitat type in BCR 14 NB. New Brunswick also contains considerable amounts of wetland habitat, including 1 500 km of coastal habitats (e.g., emergent saltmarsh, mud flats, and open water areas associated with estuaries and bays), emergent herbaceous wetlands (2 500 km2), freshwater forested wetlands (2 700 km2), and open freshwater lakes, streams and rivers (1 800 km2; Dettmers (2006)). Agricultural and cultivated areas cover 3 000 km2 (Dettmers 2006). Urban areas include residential areas (1 060 km2), commercial and industrial areas (1 160 km2), and mines and quarries (164 km2; Dettmers 2006).
New Brunswick experiences large seasonal temperature differences, cold winters and warm (and often humid) summers. Unlike the other Maritime provinces, New Brunswick is somewhat sheltered from the Atlantic Ocean and has a large interior that is removed from the ocean’s moderating effects.
The principal land use since European settlement has been harvesting of the extensive forest resources. New Brunswick has the third-largest land area of forest in Atlantic Canada, but it is the leading province in the forestry and logging sector, accounting for 60% of the gross domestic product (GDP) in this sector for the region (Vasarhelyi and Kirk 2007). New Brunswick has only 3% of its forest ecozone area intact, and as of 2006, only fragments of intact forest remain, none of which were larger than 300 km2 (Conservation Council of NB 2010).
While it does not have the largest proportion of land area in agriculture, New Brunswick is the leading province in the agricultural sector, accounting for 55% of the GDP for Atlantic Canada (Vasarhelyi and Kirk 2007). In 1996, 35% of agricultural land was in crops (Statistics Canada 2008) mainly potatoes, greenhouse production and ornamental crops, fruit and berries, vegetables, and grains (New Brunswick Department of Agriculture, Aquaculture and Fisheries, n.d.).
Only a relatively small share of the traditional fishery industry in Atlantic Canada occurs in New Brunswick. However, New Brunswick has the largest aquaculture fishery including both finfish (100 farms) and shellfish (500 sites; Vasarhelyi and Kirk 2007).
Recreational activities are the other significant land uses of this planning unit. In 2010, New Brunswick welcomed an estimated 2.96 million visits of one or more nights from New Brunswick residents on out-of-town trips, and from visitors from other parts of Canada, the United States and overseas (New Brunswick Department of Culture, Tourism and Healthy Living 2012). The tourism industry is worth an estimated $738 million (or 3.5% of the provincial GDP; New Brunswick Department of Culture, Tourism and Healthy Living 2012).
Vasarhelyi and Kirk (2007) ranked industries according to their relative impacts on migratory birds based on their areal extent, importance of GDP or number of people employed. For New Brunswick, forestry is the highest ranked industry, followed by agriculture, electrical generation and commercial fishing (Vasarhelyi and Kirk 2007).
There are 15 First Nation reserves in New Brunswick, identified as either Wolastoqiyik (people of the Saint John River Valley, formerly known as Maliseets) or Mi’kmaq (Aboriginal Affairs and Northern Development Canada 2012). While the Mi’kmaq were semi-nomadic and harvested wildlife available to them (seafood, big and small mammals, fish, seabirds, and eggs), the Wolastoqiyik were primarily sedentary people who supplemented their diets by hunting, fishing, and gathering fruits, berries, nuts and natural produce. The current traditions of the Mi’kmaq and Wolastoqiyik have changed and evolved over time, much of it through French and British colonization of what is now Canada (McMillan 1995); both value all wildlife and life forms within and beyond their territory (Berneshawi 1997). The Maritimes Aboriginal harvest for waterfowl has decreased dramatically and is now a peripheral activity (Benoît 2007).
There are a variety of current and potential threats to the region’s avifauna. Many of the threats are related to anthropogenic land use, particularly forestry activities. Threats include loss or fragmentation of all forest types as a result of logging activities; decreases in diet quality, in the health of birds, or in prey availability due to contamination of food sources from biocides such as pesticides, herbicides or fungicides used by forestry; and loss and fragmentation of forest types due to the construction and maintenance of roads (including service and logging roads).
Three percent (3%) of New Brunswick’s biome is protected either as provincially or federally administered protected areas (Canadian Council on Ecological Areas 2011; Fig. 2). Environment and Climate Change Canada manages 5 National Wildlife Areas and 3 Migratory Bird Sanctuaries for a total area of 70 km2, while Parks Canada Agency manages 2 National Parks for a total area of 445 km2. However, the majority (in both numbers and total surface area) of the protected areas are provincially managed: 64 areas totalling 1 763 km2. The ability of governments to establish protected areas is limited by the amount and location of Crown land. In New Brunswick, half of the land base is privately owned. In addition to protected areas, there are a number of environmental non-governmental organizations engaged in securing and managing lands for conservation. The major organizations engaged in these activities in New Brunswick are:
- Ducks Unlimited Canada (212 km2 of waterfowl habitat, either owned or with restrictive covenants);
- New Brunswick Nature Trust (20 km2); and
- Nature Conservancy Canada (owns or has easements on 38 km2).
In addition, designations that recognize ecological uniqueness (but do not formally protect habitat) have elevated public awareness and promoted the conservation of ecologically significant habitats. These include:
- the Bay of Fundy Biosphere Reserve (4 300 km2);
- The Bay of Fundy Western Hemisphere Shorebird Reserve Network site (620 km2);
- 3 wetlands recognized under the Ramsar Convention on Wetlands of International Importance (184 km2); and
- 11 Important Bird Areas (2 620 km2).
Figure 2. Map of protected and designated areas in BCR 14 NB, Atlantic Northern Forest.
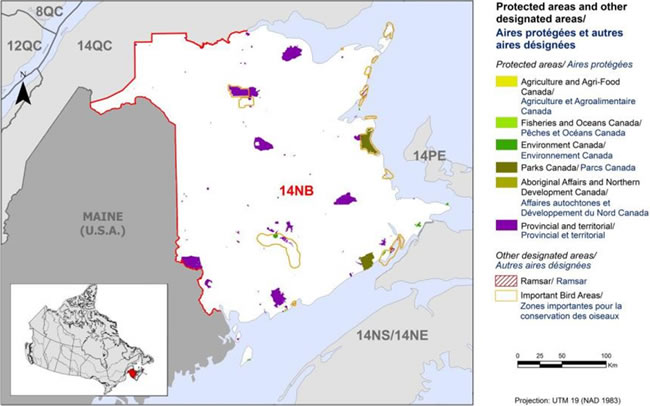
Long description for Figure 2
Map of protected and other designated areas in BCR 14 NB Region: Atlantic Northern Forest. The map’s extent includes most of Maine, all of new Brunswick, western PEI, part of central Nova Scotia and part of Quebec along the northern borders of Maine and New Brunswick; adjoining BCRs are also shown. BCR 14 NB covers all of New Brunswick.
The various types of protected areas that exist in the BCR are shown on the map, and are explained in the following bilingual legend (appearing to the right of the map):
Protected areas/Aires protégées
- Agriculture and Agri-Food Canada/Agriculture et Agroalimentaire Canada
- Fisheries and Oceans Canada/Pêches et Océans Canada
- Environment and Climate Change Canada/Environnement et Changement climatique Canada
- Parks Canada/Parcs Canada
- Aboriginal Affairs and Northern Development Canada/Affaires autochtones et Développement du Nord Canada
- Provincial/Provincial
Other designated areas/autres aires désignées
- Important Bird Areas/ Aires d’importance pour les oiseaux
- Ramsar/Ramsar
There is also a visual representation of scale for the map in the legend and the projection of the map (i.e. UTM 9 (NAD 1983)).
The most common type of protected area shown is provincial. There are also two National Parks and a smaller National Wildlife area visible. Several Important Bird Areas of varying sizes can be seen throughout.
Characteristics of Marine Biogeographic Unit 11: Bay of Fundy of New Brunswick
The Gulf of Maine and Scotian Shelf Ecozone (corresponding to Marine Biogeographic Unit 11 (MBU 11); Fig. 3) is bounded by the Hague Line to the southwest (defining the international border with the United States) and by the southern edge of the Laurentian Channel to the northeast (Fisheries and Oceans Canada 2010). It includes coastal portions of Nova Scotia and New Brunswick, and extends beyond the edge of the continental shelf to the 200 nautical mile limit of the Canadian Exclusive Economic Zone (total area 417 000 km2).
Figure 3. Map of protected and designated areas in MBU 11 (M11) and MBU 12 (M12).
Long description for Figure 3
Map of the Marine Biogeographical Units of eastern Canada. The map’s extent includes the western shore of Hudson Bay to Newfoundland’s offshore areas. M10, M11 and M12 are highlighted in various colours of blue, while the adjoining borders of M8, M9 and M13 are visible. M10 covers most of the waters off Labrador and Newfoundland, M11 covers the waters off Nova Scotia, and M12 covers the Gulf of St Lawrence. North is indicated with an arrow in the upper left corner of the map. There is a small map of Canada inset lower left, with the area of interest highlighted.
The various types of protected areas that exist in the BCR are shown on the map, and are explained in the following bilingual legend (appearing to the right of the map):
Protected areas/Aires protégées
- Agriculture and Agri-Food Canada/Agriculture et Agroalimentaire Canada
- Fisheries and Oceans Canada/Pêches et Océans Canada
- Environment and Climate Change Canada/Environnement et Changement climatique Canada
- Parks Canada/Parcs Canada
- Aboriginal Affairs and Northern Development Canada/Affaires autochtones et Développement du Nord Canada
- Provincial/Provincial
Other designated areas/autres aires désignées
- Important Bird Areas/ Aires d’importance pour les oiseaux
- Ramsar/Ramsar
There is also a visual representation of scale for the map in the legend and the projection of the map (i.e. UTM 9 (NAD 1983)).
The most common type of protected/designated area visible at this scale in MBUs 11 and 12 are Important Bird Areas, which occur fairly frequently in patches along the coasts. There is also a large Fisheries and Oceans Canada protected area east of the Nova Scotian coast.
MBU 11 NB encompasses the Bay of Fundy and part of the Gulf of Maine (which is one of the largest semi-enclosed coastal seas in North America). The area is recognized as one of the world’s richest marine ecosystems with various marine and estuarine habitats (Gulf of Maine Council on the Marine Environment, n.d.). Some extensive saltmarsh estuaries associated with outflow from important river systems are located on both the New Brunswick and the Nova Scotia coasts.
MBU 11 NB includes the northern half of the Bay of Fundy, Passamaquody Bay and waters around the Grand Manan archipelago for a total area of 8 000 km2 (Fig. 3). It is renowned for extreme tidal variation and associated currents, and includes some of the most extensive intertidal mudflats, saltmarshes and saltmarsh estuaries in North America.
There are a variety of current and potential threats to the region’s avifauna. Current threats include pollution from shipping and other boat traffic, oil and gas exploration and exploitation, mineral mining, fishing and aquaculture operations activities (e.g., competition for resources, fisheries by-catch mortality, increased boat traffic and disturbance to specific areas important for birds). Climate change is expected to result in a general warming of atmospheric temperatures at these latitudes, with consequences that could include changes in ocean temperatures, ocean currents, ice regimes, frequency of severe weather events, and abundance and distribution of prey and predators. Other poorly understood factors with the potential to severely affect survival of birds in MBU 11 NB include the arrival or changes in occurrence patterns of alien invasive species (such as tunicates and green crab), ecto- and endo-parasites, and diseases. A combination of beneficial management practices, public education, changes in legislation and clean-up programs could help alleviate many of these threats.
There is currently only one marine protected area in MBU 11 NB, Musquash Estuary, located just west of Saint John (administered by the Department of Fisheries and Oceans), which includes one of the largest salt marshes in the Maritimes. The Bay of Fundy is recognized both as a Biosphere Reserve (4300 km2) and as Western Hemisphere Shorebird Reserve (620 km2).
Characteristics of Marine Biogeographic Unit 12: Gulf of St. Lawrence of New Brunswick
The Estuary and Gulf of Saint Lawrence (corresponding to Marine Biogeographic Unit 12 (MBU 12); Fig. 3) represents one of the largest and most productive estuarine marine ecosystems in Canada, and in the world (total area of approximately 247 000 km2; Therriault 1991). With a drainage basin that includes the Great Lakes, the St. Lawrence marine ecosystem receives more than half of the freshwater inputs from the Atlantic Coast of North America. This ecosystem is also strongly influenced by ocean and climate variability in the North Atlantic, of both Arctic (Labrador Current) and tropical (Gulf Stream) origins. As a result, the area exhibits large spatial and temporal variations in environmental conditions and oceanographic processes (Benoît et al. 2012). This unique setting provides the conditions for a highly diverse and productive biological community and trophic structure (Benoît et al. 2012).
MBU 12 is situated downstream of some of the largest urban and industrial centres, areas of pronounced development on the continent and emitters of industrial and agricultural-based contaminants (Benoît et al. 2012). The massive influx of fresh water, especially during springtime and summer wet seasons, lowers salinity levels in the Gulf and Estuary. Increasing commercial, ecotourism and recreational navigation are vectors for the propagation of aquatic invasive species (Benoît et al. 2012). Shoreline development and associated nutrient and sediment loading as well as a large and expanding shellfish aquaculture industry have transformed large portions of the coast, the estuarine and lagoon waters into aquaculture farms (Benoît et al. 2012). Benoît et al. (2012) reviewed evidence that suggested important aspects of the food-web in MBU 12 changed in the early 1990s. Also, increasing average sea surface temperature and hypoxia, partly as a result of climate change and coastal zone deterioration related to anthropogenic pressures (e.g., coastal eutrophication), may be causing physiological stress in marine organisms (Benoît et al. 2012).
MBU 12 NB encompasses an area approximately 14 000 km2 (Fig. 3). The system is strongly influenced by ocean and climate variability. While colder, low saline Arctic waters (Labrador Current) enter the Gulf from the north and east, prevailing west and southwest winds moderate the influence of ocean on climate. This moderated influence in conjunction with shallower waters within the Northumberland Strait can lead to significantly warmer ocean temperatures in that area. In winter, this portion of the Gulf is predominantly ice-covered. MBU 12 NB has complex coastlines that are the result of glacial processes. The coastlines include extensive sand beaches and some exposed bedrock, but are largely lacking in cliffs. These features are interspersed with large estuaries hosting salt marshes and wetlands of varying size and influence. Spatial and temporal variation in environmental conditions and oceanographic processes result in a diverse and productive biological community and trophic structure.
There are a variety of current and potential threats to the region’s avifauna. Current threats include oil pollution from shipping and other boat traffic; fishing and aquaculture operation activities (e.g., competition for resources, mortality from fisheries by-catch, increased boat traffic and disturbance to areas important for birds). Coastal development affects the shoreline by transforming coastal habitat for housing and infrastructure development (e.g., in-filling of coastal wetlands, irrigation and erosion control). Measures to prevent the erosion of the coast line will be further exacerbated by sea-level rise due to changing climate. Climate change is expected to result in a general warming of atmospheric temperatures at these latitudes, with consequences that could include changes in ocean temperatures, ocean currents, ice regimes, frequency of severe weather events, and abundance and distribution of prey and predators. Other poorly understood factors with the potential to severely affect avian survival include the arrival or changes in occurrence patterns of alien invasive species (such as tunicates and green crab), ecto- and endo-parasites, and diseases. A combination of beneficial management practices, public education, changes in legislation and clean-up programs could help alleviate many of these threats.
Section 1: Summary of results - All Birds, All Habitats
Element 1: Priority species assessment
These Bird Conservation Strategies identify “priority species” from all regularly occurring bird species in each BCR subregion. Species that are vulnerable due to population size, distribution, population trend, abundance and threats are included because of their “conservation concern”. Some widely distributed and abundant “stewardship” species are also included. Stewardship species are included because they typify the national or regional avifauna and/or because they have a large proportion of their range and/or continental population in the subregion; many of these species have some conservation concern, while others may not require specific conservation effort at this time. Species of management concern are also included as priority species when they are at (or above) their desired population objectives but require ongoing management because of their socio-economic importance as game species or because of their impacts on other species or habitats.
The purpose of the prioritization exercise is to focus implementation efforts on the issues of greatest significance for Canadian avifauna. Table 1 provides a full list of all priority species and their reason for inclusion in BCR 14 NB, MBU 11 NB or MBU 12 NB. Tables 2 and 3 summarize the number of priority species in BCR 14 NB, MBU 11 NB or MBU 12 NB by bird group and by the reason for priority status.
There are 71 priority bird species in BCR 14 NB. The list of priority birds is dominated by landbirds (42 species) but also includes 9 species of shorebirds, 10 species of waterbirds and 10 species of waterfowl (Table 1). Although the total number of priority landbirds is higher than the other bird groups, only 26% of all BCR 14 NB landbirds are included as priority species (Table 2), compared to 32% of all shorebirds, 34% of all waterbirds and 36% of all waterfowl species in BCR 14 NB (Table 2).
There are 44 priority bird species in MBU 11 NB. The list of priority birds is dominated by waterbirds (18 species) but also includes 15 species of shorebirds and 11 species of waterfowl (Table 1). In MBU 11 NB, the proportion of shorebirds that are priority species (48%) is much higher than the proportion of total bird species they represent (27%) in MBU 11 NB (Table 2).
There are 28 priority bird species in MBU 12 NB. The list is dominated by shorebirds (12 species) and waterfowl (11 species), and also includes 5 species of waterbirds (Table 1). In MBU 12 NB, the proportion of shorebirds that are priority species (43%) is much higher than the proportion of total bird species they represent (27%) in MBU 12 NB (Table 2). Waterbird species, on the other hand, represent 11% of the priority species MBU 12 NB, but account for 42% of the total bird species (Table 2).
There are 18 species at risk in BCR 14 NB, 6 in MBU 11 NB and 5 in MBU 12 NB that are either protected by federal and/or provincial legislation (Table 1). In BCR 14 NB, 9 landbird species, 1 shorebird species, 2 waterbird species and 2 waterfowl species are protected by federal legislation whereas only 2 landbird species, 1 shorebird species and 1 waterfowl species are protected by provincial legislation (Table 3). In MBU 11 NB, 2 shorebird species, 2 waterbird species and 2 waterfowl species are protected by federal legislation whereas only 1 shorebird species and 1 waterfowl species are protected by provincial legislation (Table 3). In MBU 12 NB, 2 shorebird species, 1 waterbird species and 2 waterfowl species are protected by federal legislation whereas only 1 shorebird species and 1 waterfowl species are protected by provincial legislation (Table 3).
Table 1. Priority bird species in BCR 14 NB, MBU 11 NB, and MBU 12 NB, population objective, and the reason for priority status. Accessible Version of Table 1.
Table 2. Summary of priority bird species, by bird group, in BCR 14 NB, MBU 11 NB and MBU 12 NB. Table 2 is presented here in 3 parts.
| Bird Group | Total Species (% of avifauna) |
Total Priority Species | Percent Listed as Priority | Percent of Priority List |
|---|---|---|---|---|
| BCR 14 NB | ||||
| Landbird | 164 (67%) | 42 | 26% | 59% |
| Shorebird | 28 (11%) | 9 | 32% | 13% |
| Waterbird | 28 (11%) | 10 | 36% | 14% |
| Waterfowl | 26 (10%) | 10 | 38% | 14% |
| Total BCR 14 NB | 246 | 71 | 29% | 100% |
| Bird Group | Total Species (% of avifauna) |
Total Priority Species | Percent Listed as Priority | Percent of Priority List |
|---|---|---|---|---|
| MBU 11 NB | ||||
| Landbird | 4 (3%) | 0 | 0% | 0% |
| Shorebird | 31 (27%) | 15 | 48% | 34% |
| Waterbird | 51 (44%) | 18 | 35% | 41% |
| Waterfowl | 29 (25%) | 11 | 38% | 25% |
| Total MBU 11 NB | 115 | 44 | 38% | 100% |
| Bird Group | Total Species (% of avifauna) |
Total Priority Species | Percent Listed as Priority | Percent of Priority List |
|---|---|---|---|---|
| MBU 12 NB | ||||
| Landbird | 4 (4%) | 0 | 0% | 0% |
| Shorebird | 28 (27%) | 12 | 43% | 43% |
| Waterbird | 44 (42%) | 5 | 11% | 18% |
| Waterfowl | 28 (27%) | 11 | 39% | 39% |
| Total MBU 12 NB | 104 | 28 | 27% | 100% |
Table 3: Number of priority bird species in BCR 14 NB, MBU 11 NB, and MBU 12 NB by reason for priority status. Table 3 is presented here in 3 parts.
| Reason for Priority Listinga | Landbirds | Shorebirds | Waterbirds | Waterfowl |
|---|---|---|---|---|
| BCR 14 NB total | 42 | 9 | 10 | 10 |
| COSEWICb | 12 | 1 | 2 | 2 |
| Federal SARA listedc | 9 | 1 | 2 | 2 |
| Provincially listedd | 2 | 1 | 1 | |
| NAWMPe | - | - | - | 9 |
| National/Continental Concern | 9 | 9 | 7 | - |
| Regional/ Sub-regional Concern | 18 | 0 | 5 | - |
| National/Continental Stewardship | 8 | 0 | 0 | - |
| Regional/Sub-regional Stewardship | 18 | 0 | 0 | - |
| Management Concern | 0 | 0 | 0 | 1 |
| Expert review | 5 | 0 | 1 | 0 |
| Reason for Priority Listinga | Landbirds | Shorebirds | Waterbirds | Waterfowl |
|---|---|---|---|---|
| MBU 11 NB total | 0 | 15 | 18 | 11 |
| COSEWICb | 0 | 2 | 2 | 2 |
| Federal SARA listedc | 0 | 2 | 2 | 2 |
| Provincially listedd | 0 | 1 | 0 | 1 |
| NAWMPe | - | - | - | 10 |
| National/Continental Concern | 0 | 15 | 12 | - |
| Regional/ Sub-regional Concern | 0 | 0 | 6 | - |
| National/Continental Stewardship | 0 | 0 | 3 | - |
| Regional/ Sub-regional Stewardship | 0 | 0 | 2 | - |
| Management Concern | 0 | 0 | 0 | 1 |
| Expert review | 0 | 0 | 1 | 0 |
| Reason for Priority Listinga | Landbirds | Shorebirds | Waterbirds | Waterfowl |
|---|---|---|---|---|
| MBU 12 NB total | 0 | 12 | 5 | 11 |
| COSEWICb | 0 | 2 | 1 | 2 |
| Federal SARA listedc | 0 | 2 | 1 | 2 |
| Provincially listedd | 0 | 1 | 1 | |
| NAWMP5e | - | - | - | 10 |
| National/Continental Concern | 0 | 12 | 3 | - |
| Regional/ Sub-regional Concern | 0 | 0 | 3 | - |
| National/Continental Stewardship | 0 | 0 | 0 | - |
| Regional/ Sub-regional Stewardship | 0 | 0 | 0 | - |
| Management Concern | 0 | 0 | 0 | 1 |
| Expert review | 0 | 0 | 0 | 0 |
a A single species can be on the priority list for more than one reason. Note that not all reasons for inclusion apply to every bird group (indicated by “-”).
b COSEWIC indicates species assessed by the Committee on the Status of Endangered Wildlife in Canada as Endangered, Threatened, or Special Concern (COSEWIC 2012).
c Species listed on Schedule 1 of SARA as Endangered, Threatened or Special Concern (Species at Risk Public Registry 2012).
d Species listed under New Brunswick's Endangered Species Act as Endangered (EN) (New Brunswick 2004)
e NAWMP indicates ”key species” in the New Brunswick Eastern Habitat Joint Venture Five-year Implementation Plan (NB-EHJV 2008), or ranked under NAWMP (NAWMP Plan Committee 2004) as having “High” or “Highest” breeding or non-breeding conservation/monitoring needs in the BCR.
Element 2: Habitats important to priority species
Identifying the broad habitat requirements for each priority species within the BCR and the MBUs allowed species to be grouped by shared habitat-based conservation issues and actions. If many priority species associated with the same habitat face similar conservation issues, then conservation action in that habitat may support populations of several priority species. BCR strategies use a modified version of the standard land cover classes developed by the United Nations (FAO 2000) to categorize habitats, and species were often assigned to more than one habitat class.
The assignment of habitat associations for priority bird species was primarily done through literature review and expert consultation. For each priority species in BCR 14 NB, MBU 11 NB and MBU 12 NB, all of their known habitat associations were considered, not just the primary habitat associations. Because of the variability and the availability of information related to species-habitat associations, quantifying the relative importance of any given habitat was not possible. In this document, statements regarding the importance of habitat types for priority bird species are related to the number of priority birds associated with each habitat and may not reflect the overall importance of the habitat to all bird species in the planning unit. For more quantitative and qualitative field-based information on habitat associations of all breeding birds species in New Brunswick, please consult the Second Maritimes Breeding Bird Atlas (Stewart et al. in prep.).
In BCR 14 NB, wetlands are used by the greatest number of priority bird species. There are 35 priority bird species (or 49%) found in wetlands in BCR 14 NB (Fig. 4). Forested habitats are also important habitat types for priority bird species in BCR 14 NB. The 3 forest types combined include 31 species (44%), with more priority bird species using mixed forest (27 species or 38%) than coniferous (18 species or 25%) or deciduous forests (17 species or 24%; Fig. 4). Cultivated and managed areas are also used by many priority birds (21 species or 30%).
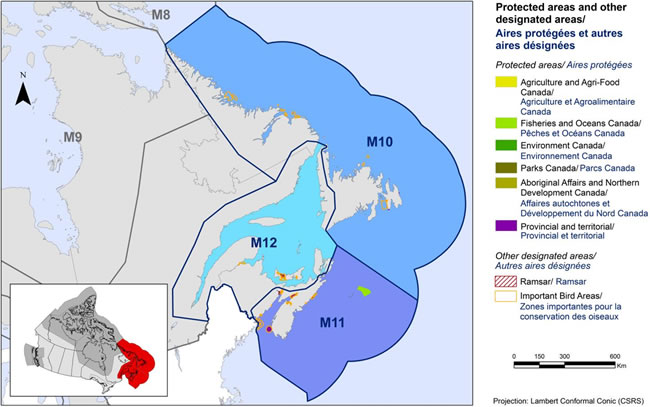
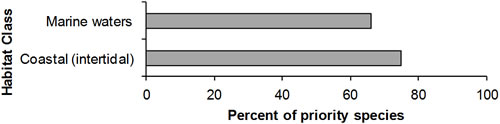
In MBU 11 NB, there are 33 priority bird species (or 75%) found in coastal (intertidal) habitats and 29 priority bird species (or 66%) found in marine waters (Fig. 5). In MBU12 NB, there are 24 priority bird species (or 86%) found in intertidal habitats and 14 priority bird species (or 50%) found in marine waters (Fig. 6).
Figure 4. Percent of priority bird species that are associated with each habitat type in BCR 14 NB.
Note: The total exceeds 100% because species may be assigned to more than one habitat.

Long description for Figure 4
A horizontal bar graph indicating the percent of priority species (x axis) that are associated with each habitat type (y axis: coniferous, deciduous, mixed wood, shrub/early successional, herbaceous, cultivated and managed areas, urban, wetlands, riparian, inland waterbodies, and coastal) in BCR 14 NB Atlantic Region. Note: The total exceeds 100% because each species may be assigned to more than one habitat.
| Habitat Class | Percent |
|---|---|
| Coniferous | 25.35 |
| Deciduous | 23.94 |
| Mixed Wood | 38.03 |
| Shrub/early successional | 9.86 |
| Herbaceous | 11.27 |
| Cultivated and managed areas | 29.58 |
| Urban (artificial surfaces and bare areas) | 8.45 |
| Wetlands | 49.3 |
| Riparian | 18.31 |
| Inland waterbodies | 25.35 |
| Coastal (above high tide) | 23.94 |
Figure 5. Percent of priority bird species that are associated with each habitat type in MBU 11 NB.
Note: The total exceeds 100% because species may be assigned to more than one habitat.
Long description for Figure 5
A horizontal bar graph indicating the percent of priority species (x axis) that are associated with each habitat type (y axis: marine waters and coastal) in MBU 11 NB Atlantic Region. Note: The total exceeds 100% because each species may be assigned to more than one habitat.
| Habitat Class | Percent |
|---|---|
| Marine waters | 65.91 |
| Coastal (intertidal) | 75 |
Figure 6. Percent of priority bird species that are associated with each habitat type in MBU 12 NB.
Note: The total exceeds 100% because species may be assigned to more than one habitat.
Long description for Figure 6
A horizontal bar graph indicating the percent of priority species (x axis) that are associated with each habitat type (y axis: marine waters and coastal) in MBU 12 NB Atlantic Region. Note: The total exceeds 100% because each species may be assigned to more than one habitat.
| Habitat Class | Percent |
|---|---|
| Marine waters | 50 |
| Coastal (intertidal) | 85.71 |
Element 3: Population objectives
Population objectives allow us to measure and evaluate conservation success. The objectives in this strategy are assigned to categories and are based on a quantitative or qualitative assessment of species’ population trends. If the population trend of a species is unknown, the objective is set as “assess and maintain”, and a monitoring objective is given. For any species listed under the Species at Risk Act (SARA) or under provincial/territorial endangered species legislation, Bird Conservation Strategies defer to population objectives in available Recovery Strategies and Management Plans. The ultimate measure of conservation success will be the extent to which population objectives have been reached over the next 40 years. Population objectives do not currently factor in feasibility of achievement but are held as a standard against which to measure progress.
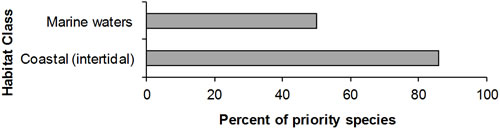
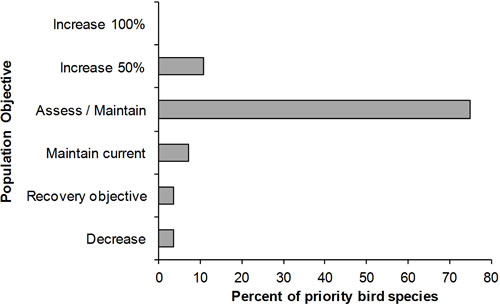
In BCR 14 NB, there are 21 priority bird species (or 30%) for which the population trend is unknown, and the population objective has been set as assess/maintain (Fig. 7). However, there are 32 priority bird species (or 45%) that have population objectives to increase current levels either by 100%, 50% or to a specific population target from the species’ recovery documents (Fig. 7). In both MBU 11 NB and MBU 12 NB, the majority of priority bird species (34 and 23 species, respectively) have unknown population trends and were therefore given a population objective of assess and maintain (Figures 8 and 9). There are 6 priority bird species in MBU 11 NB and 4 in MBU 12 NB that have population objectives to increase current levels either by 100%, 50% or to a particular target from the species’ recovery document (Figures 8 and 9). The temperate breeding Canada Goose was the only priority species in all 3 planning units where the population objective is to decrease the population size (Table 1). Because the temperate breeding Canada Goose is considered a priority species based on management concern, there are no threats, conservation objectives or conservation actions listed for this population.
Figure 7. Percent of priority bird species that are associated with each population objective category in BCR 14 NB.

Long description for Figure 7
A horizontal bar graph indicating the percent of priority species (x axis) that are associated with each population objective (y axis; increase 100%, increase 50%, assess/maintain, maintain current, recovery objective and decrease) in BCR 14 NB Atlantic Region.
| Population objective | Percent |
|---|---|
| Increase 100% | 26.76 |
| Increase 50% | 15.49 |
| Assess / Maintain | 29.58 |
| Maintain current | 23.94 |
| Recovery objective | 2.82 |
| Decrease | 1.41 |
Figure 8. Percent of priority bird species that are associated with each population objective category in MBU 11 NB.
Long description for Figure 8
A horizontal bar graph indicating the percent of priority species (x axis) that are associated with each population objective (y axis; increase 100%, increase 50%, assess/maintain, maintain current, recovery objective and decrease) in MBU 11 NB Atlantic Region.
| Population objective | Percent |
|---|---|
| Increase 100% | 2.27 |
| Increase 50% | 6.82 |
| Assess / Maintain | 77.27 |
| Maintain current | 6.82 |
| Recovery objective | 4.55 |
| Decrease | 2.27 |
Figure 9. Percent of priority bird species that are associated with each population objective category in MBU 12 NB.
Long description for Figure 9
A horizontal bar graph indicating the percent of priority species (x axis) that are associated with each population objective (y axis; increase 100%, increase 50%, assess/maintain, maintain current, recovery objective and decrease) in MBU 12 NB Atlantic Region.
| Population Objective | Percent |
|---|---|
| Increase 100% | 0 |
| Increase 50% | 10.71 |
| Assess / Maintain | 75 |
| Maintain current | 7.14 |
| Recovery objective | 3.57 |
| Decrease | 3.57 |
Element 4: Threat assessment for priority species
The threats assessment process identifies threats believed to have a population-level effect on individual priority species. These threats are assigned a relative magnitude (Low, Medium, High or Very High), based on their scope (the proportion of the species’ range within the subregion that is impacted) and severity (the relative impact on the priority species’ population). This allows us to target conservation actions towards threats with the greatest effects on suites of species or in broad habitat classes. Some well-known conservation issues (such as predation by domestic cats or climate change) may not be identified in the literature as significant threats to populations of an individual priority species and therefore may not be captured in the threat assessment. However, they merit attention in conservation strategies because of the large numbers of individual birds affected in many regions of Canada. We have incorporated them in a separate section on Widespread Issues in the full strategy, but, unlike other threats, they are not ranked.
In BCR 14 NB, MBU 11 NB and MBU 12 NB, a threat category was added to the threat classification scheme to allow for the inclusion of inadequate monitoring or research information (category 12 “other direct threats” and sub-category 12.1 “information lacking”). However, this threat category was not ranked since the lack of information could not be given a score for scope or severity.
Some of the threats identified are not unique to a particular habitat. For instance, urban development occurs in many habitat types in New Brunswick. There are, however, other threats that are more specific to a particular habitat, such as the loss of rooftops for nesting, which is a specific threat in urban habitats. Threats are categorized as per Salafsky et al. (2008), and when their rankings are rolled-up for each habitat class (Table 4), the overall threat magnitude is highest in the coniferous forests of BCR 14 NB and the coastal (intertidal) habitats of MBU 11 NB. Most other habitat classes have an overall threat magnitude of medium except for the shrub and early successional and the herbaceous habitats of BCR 14 NB, which have a threat magnitude of low (Table 4).
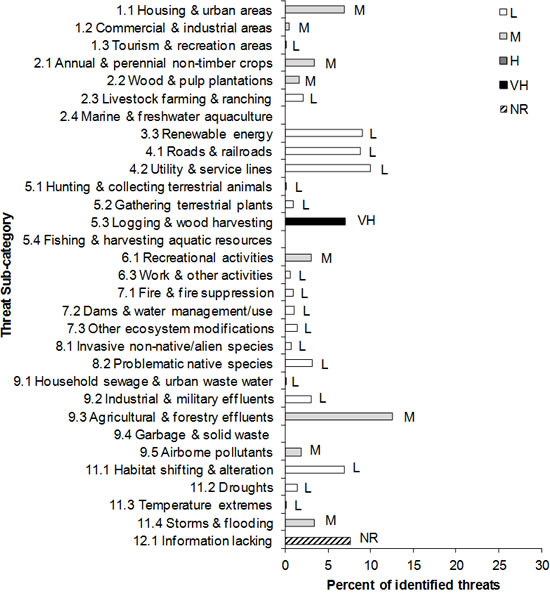
In BCR 14 NB, the only threats given a very high rank were threats due to the loss or fragmentation of coniferous and deciduous forests as a result of logging activities (5.3 Logging and wood harvesting). These threats were ranked high in mixed wood forests, riparian forests and forested wetlands (Fig. 10). For instance, the loss or fragmentation of cedar swamps because of logging activities ranked as a high threat to Canada Warbler. The most frequently identified threats were decreases in diet quality, in the health of birds, or in prey availability due to the contamination of food sources from biocides such as pesticides, herbicides or fungicides used by the forestry or agricultural industries (9.3 Agricultural and forestry effluents; Fig. 10). These threats were widespread across all habitat classes (except urban habitat) in BCR 14 NB.
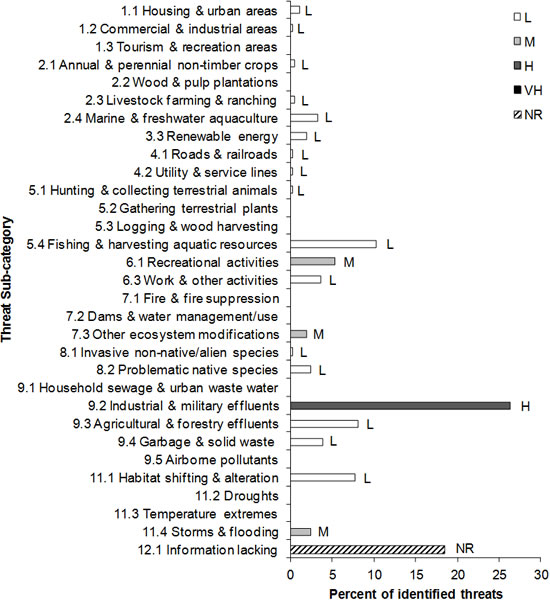
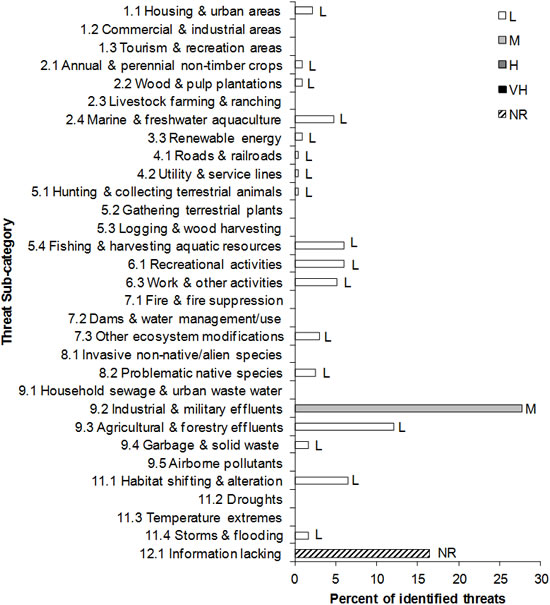
In MBU 11 NB and MBU 12 NB, decreased prey availability due to chemical or heavy metal contamination, from oil spills and discharges or hypothermia caused by oil on plumage (9.2 Industrial and military effluents) were the most frequently identified and highest ranked threats. These were ranked high in MBU 11 NB (Fig. 11) and medium in MBU 12 NB (Fig. 12). There are over 20 different threats identified for priority birds in 17 different threat sub-categories in MBU 11 NB and MBU 12 NB; however, they were all ranked as low (Figures 11 and 12). Low-ranked threats are not discussed further in this strategy.
Threats to priority species while they are outside Canada during the non-breeding season were also assessed and are presented in the full strategy in the Threats Outside Canada section.
Figure 10. Percent of identified threats to priority bird species within BCR 14 NB by threat sub-category.
Each bar represents the percent of the total number of threats identified in each threat sub-category in BCR 14 NB (for example, if 100 threats were identified in total for all priority species in BCR 14 NB, and 10 of those threats were in the category 1.1 Housing and urban areas, the bar on the graph would represent this as 10%). The letter at the end of the bars (from L: low, M: medium, H: high, to VH: very high) represents the rolled-up magnitude of all threats in each threat subcategory in the BCR. Threats that are unranked due to lack of information are indicated with “NR”.
Long description for Figure 10
A horizontal bar graph indicating the percent of identified threats to priority species (x axis) within BCR 14 NB Atlantic Region by threat subcategory (y axis; Recreational activities, Droughts, etc.).
Each bar represents the percent of the total number of threats identified in each sub-threat category in BCR 14 NB (for example, if 100 threats were identified in total for all priority species in BCR 14 NB, and 10 of those threats were in the category 1.1 “Housing and urban areas”, the bar on the graph would represent this as 10%). Shading in the bars (VH = very high, H = high, M = medium and L = low) represents the rolled-up magnitude of all threats in each threat subcategory in the BCR. Threats that are unranked due to lack of information are indicated with “NR”.
| Threat sub-category | L | M | H | VH | NR |
|---|---|---|---|---|---|
| 1.1 Housing and urban areas | 6.99 | ||||
| 1.2 Commercial and industrial areas | 0.55 | ||||
| 1.3 Tourism and recreation areas | 0.11 | ||||
| 2.1 Annual and perennial non-timber crops | 3.5 | ||||
| 2.2 Wood and pulp plantations | 1.75 | ||||
| 2.3 Livestock farming and ranching | 2.18 | ||||
| 2.4 Marine and freshwater aquaculture | |||||
| 3.3 Renewable energy | 9.06 | ||||
| 4.1 Roads and railroads | 8.85 | ||||
| 4.2 Utility and service lines | 10 | ||||
| 5.1 Hunting and collecting terrestrial animals | 0.11 | ||||
| 5.2 Gathering terrestrial plants | 0.98 | ||||
| 5.3 Logging and wood harvesting | 7.1 | ||||
| 5.4 Fishing and harvesting aquatic resources | |||||
| 6.1 Recreational activities | 3.06 | ||||
| 6.3 Work and other activities | 0.66 | ||||
| 7.1 Fire and fire suppression | 0.98 | ||||
| 7.2 Dams and water management/use | 1.09 | ||||
| 7.3 Other ecosystem modifications | 1.42 | ||||
| 8.1 Invasive non-native/alien species | 0.76 | ||||
| 8.2 Problematic native species | 3.28 | ||||
| 9.1 Household sewage and urban waste water | 0.22 | ||||
| 9.2 Industrial and military effluents | 3.06 | ||||
| 9.3 Agricultural and forestry effluents | 12.6 | ||||
| 9.4 Garbage and solid waste | |||||
| 9.5 Airborne pollutants | 1.96 | ||||
| 11.1 Habitat shifting and alteration | 6.99 | ||||
| 11.2 Droughts | 1.42 | ||||
| 11.3 Temperature extremes | 0.22 | ||||
| 11.4 Storms and flooding | 3.49 | ||||
| 12.1 Information lacking | 7.64 |
Figure 11. Percent of identified threats to priority bird species within MBU 11 NB by threat sub-category.
Each bar represents the percent of the total number of threats identified in each threat sub-category in MBU 11 NB (for example, if 100 threats were identified in total for all priority species in MBU 11 NB, and 10 of those threats were in the category 1.1 Housing and urban areas, the bar on the graph would represent this as 10%). The letter at the end of the bars (from L: low, M: medium, to H: high) represents the rolled-up magnitude of all threats in each threat subcategory in the BCR. Threats that are unranked due to lack of information are indicated with “NR”.
Long description for Figure 11
A horizontal bar graph indicating the percent of identified threats to priority species (x axis) within MBU 11 NB Atlantic Region by threat subcategory (y axis; Recreational activities, Droughts, etc.).
Each bar represents the percent of the total number of threats identified in each sub-threat category in MBU 11 NB (for example, if 100 threats were identified in total for all priority species in MBU 11 NB, and 10 of those threats were in the category 1.1 “Housing and urban areas”, the bar on the graph would represent this as 10%). Shading in the bars (VH = very high, H = high, M = medium and L = low) represents the rolled-up magnitude of all threats in each threat subcategory in the MBU. Threats that are unranked due to lack of information are indicated with “NR”.
| Threat sub-category | L | M | H | VH | NR |
|---|---|---|---|---|---|
| 1.1 Housing and urban areas | 1.12 | ||||
| 1.2 Commercial and industrial areas | 0.28 | ||||
| 1.3 Tourism and recreation areas | |||||
| 2.1 Annual and perennial non-timber crops | 0.56 | ||||
| 2.2 Wood and pulp plantations | |||||
| 2.3 Livestock farming and ranching | 0.56 | ||||
| 2.4 Marine and freshwater aquaculture | 3.36 | ||||
| 3.3 Renewable energy | 1.96 | ||||
| 4.1 Roads and railroads | 0.28 | ||||
| 4.2 Utility and service lines | 0.28 | ||||
| 5.1 Hunting and collecting terrestrial animals | 0.28 | ||||
| 5.2 Gathering terrestrial plants | |||||
| 5.3 Logging and wood harvesting | |||||
| 5.4 Fishing and harvesting aquatic resources | 10.4 | ||||
| 6.1 Recreational activities | 5.32 | ||||
| 6.3 Work and other activities | 3.64 | ||||
| 7.1 Fire and fire suppression | |||||
| 7.2 Dams and water management/use | |||||
| 7.3 Other ecosystem modifications | 1.96 | ||||
| 8.1 Invasive non-native/alien species | 0.28 | ||||
| 8.2 Problematic native species | 2.52 | ||||
| 9.1 Household sewage and urban waste water | |||||
| 9.2 Industrial and military effluents | 26.3 | ||||
| 9.3 Agricultural and forestry effluents | 8.12 | ||||
| 9.4 Garbage and solid waste | 3.92 | ||||
| 9.5 Airborne pollutants | |||||
| 11.1 Habitat shifting and alteration | 7.84 | ||||
| 11.2 Droughts | |||||
| 11.3 Temperature extremes | |||||
| 11.4 Storms and flooding | 2.52 | ||||
| 12.1 Information lacking | 18.5 |
Figure 12. Percent of identified threats to priority bird species within MBU 12 NB by threat sub-category.
Each bar represents the percent of the total number of threats identified in each threat sub-category in MBU 12 NB (for example, if 100 threats were identified in total for all priority species in MBU 12 NB, and 10 of those threats were in the category 1.1 Housing and urban areas, the bar on the graph would represent this as 10%). The letter at the end of the bars (from L: low to M: medium) represents the rolled-up magnitude of all threats in each threat subcategory in the BCR. Threats that are unranked due to lack of information are indicated with “NR”.
Long description for Figure 12
A horizontal bar graph indicating the percent of identified threats to priority species (x axis) within MBU 12 NB Atlantic Region by threat subcategory (y axis; Recreational activities, Droughts, etc.).
Each bar represents the percent of the total number of threats identified in each sub-threat category in MBU 12 NB (for example, if 100 threats were identified in total for all priority species in MBU 12 NB, and 10 of those threats were in the category 1.1 “Housing and urban areas”, the bar on the graph would represent this as 10%). Shading in the bars (VH = very high, H = high, M = medium and L = low) represents the rolled-up magnitude of all threats in each threat subcategory in the MBU. Threats that are unranked due to lack of information are indicated with “NR”.
| Threat sub-category | L | M | H | VH | NR |
|---|---|---|---|---|---|
| 1.1 Housing and urban areas | 2.16 | ||||
| 1.2 Commercial and industrial areas | |||||
| 1.3 Tourism and recreation areas | |||||
| 2.1 Annual and perennial non-timber crops | 0.87 | ||||
| 2.2 Wood and pulp plantations | 0.87 | ||||
| 2.3 Livestock farming and ranching | |||||
| 2.4 Marine and freshwater aquaculture | 4.76 | ||||
| 3.3 Renewable energy | 0.87 | ||||
| 4.1 Roads and railroads | 0.43 | ||||
| 4.2 Utility and service lines | 0.43 | ||||
| 5.1 Hunting and collecting terrestrial animals | 0.43 | ||||
| 5.2 Gathering terrestrial plants | |||||
| 5.3 Logging and wood harvesting | |||||
| 5.4 Fishing and harvesting aquatic resources | 6.06 | ||||
| 6.1 Recreational activities | 6.06 | ||||
| 6.3 Work and other activities | 5.19 | ||||
| 7.1 Fire and fire suppression | |||||
| 7.2 Dams and water management/use | |||||
| 7.3 Other ecosystem modifications | 3.03 | ||||
| 8.1 Invasive non-native/alien species | |||||
| 8.2 Problematic native species | 2.6 | ||||
| 9.1 Household sewage and urban waste water | |||||
| 9.2 Industrial and military effluents | 27.7 | ||||
| 9.3 Agricultural and forestry effluents | 12.1 | ||||
| 9.4 Garbage and solid waste | 1.73 | ||||
| 9.5 Airborne pollutants | |||||
| 11.1 Habitat shifting and alteration | 6.49 | ||||
| 11.2 Droughts | |||||
| 11.3 Temperature extremes | |||||
| 11.4 Storms and flooding | 1.73 | ||||
| 12.1 Information lacking | 16.5 |
Table 4. Relative magnitude of identified threats to priority species within BCR 14 NB, MBU 11 NB and MBU 12 NB by threat category and broad habitat class. Table 4 is presented here in 3 parts.
Overall ranks were generated through a roll-up procedure described in (Kennedy et al. 2012). L represents Low magnitude threats; M = Medium; H = High; VH = Very High. Blank cells indicate that no priority bird species had threats identified in the threat category / habitat combination.
| Threat Category | Coniferous | Deciduous | Mixed | Shrub/ Early Successional |
Herbaceous | Cultivated and Managed Areas | Urban | Wetlands | Inland Water- bodies |
Coastal - Above High Tide | Riparian | Wide- spread |
Overall |
|---|---|---|---|---|---|---|---|---|---|---|---|---|---|
| Overall | H | M | M | L | L | M | M | M | M | M | M | M | |
| 1. Residential and commercial development | L | L | L | L | L | M | H | M | L | M | M | L | M |
| 2. Agriculture and aquaculture | L | M | M | H | M | L | L | M | |||||
| 3. Energy production and mining | L | L | L | L | L | L | |||||||
| 4. Transportation and service corridors | M | L | L | L | L | L | L | L | L | ||||
| 5. Biological resource use | VH | VH | H | H | L | L | H | VH | |||||
| 6. Human intrusions and disturbance | L | L | L | M | M | L | M | ||||||
| 7. Natural system modifications | L | L | L | L | L | L | L | M | L | L | |||
| 8. Invasive and other problematic species and genes | L | L | L | L | L | L | L | L | M | L | L | ||
| 9. Pollution | H | M | M | L | L | M | L | M | M | M | M | M | |
| 11. Climate change and severe weather | H | H |
| Threat Category | Marine Waters | Coastal - Intertidal | Widespread | Overall |
|---|---|---|---|---|
| Overall | M | H | L | |
| 1. Residential and commercial development | L | L | L | |
| 2. Agriculture and aquaculture | M | L | L | |
| 3. Energy production and mining | L | L | L | |
| 4. Transportation and service corridors | L | L | ||
| 5. Biological resource use | M | L | L | |
| 6. Human intrusions and disturbance | L | H | M | |
| 7. Natural system modifications | M | L | ||
| 8. Invasive and other problematic species and genes | L | M | L | |
| 9. Pollution | H | H | H | |
| 11. Climate change and severe weather | M | M |
Threat Category |
Marine Waters | Coastal - Intertidal | Widespread | Overall |
|---|---|---|---|---|
| Overall | M | M | L | |
| 1. Residential and commercial development | L | L | ||
| 2. Agriculture and aquaculture | M | L | L | |
| 3. Energy production and mining | L | L | L | |
| 4. Transportation and service corridors | L | L | ||
| 5. Biological resource use | L | L | L | |
| 6. Human intrusions and disturbance | M | L | ||
| 7. Natural system modifications | M | L | ||
| 8. Invasive and other problematic species and genes | L | L | L | |
| 9. Pollution | M | H | M | |
| 11. Climate change and severe weather | M | M |
Element 5: Conservation objectives
Conservation objectives were designed to address threats and information gaps that were identified for priority species. They describe the environmental conditions and research and monitoring that are thought to be necessary for progress towards population objectives and to understand underlying conservation issues for priority bird species. As conservation objectives are reached, they will collectively contribute to achieving population objectives. Whenever possible, conservation objectives were developed to benefit multiple species and/or respond to more than one threat.
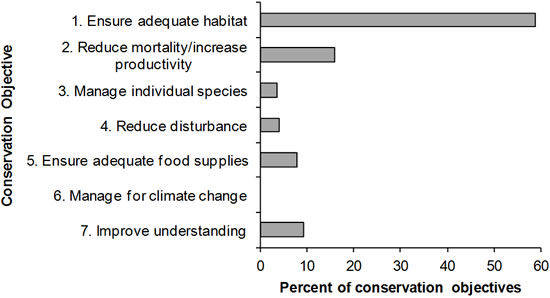
Ensuring adequate habitat availability for priority bird species is the most frequently identified conservation objective in the terrestrial habitats of BCR 14 NB (Fig. 13), while in MBU 11 NB and in MBU 12 NB, the most frequently identified conservation objective is to reduce mortality (Figs. 14, 15). Although conservation objective category 2 in Figures 13-15 includes “increase productivity,” given that most priority bird species do not breed within the MBUs, the bulk of the conservation objectives in this strategy refer only to reducing mortality. Due to our general lack of understanding of factors affecting priority bird species in the marine environment, another frequently identified conservation objective for both MBUs is to improve our understanding of these factors (Figures 14, 15).
Figure 13. Percent of all conservation objectives assigned to each conservation objective category in BCR 14 NB.
Note: Widespread issues (including climate change) were excluded from this calculation as these are detailed in Section 3 of the full strategy.
Long description for Figure 13
A horizontal bar graph indicating the percent of all conservation objectives (x axis) assigned to each conservation objective category (y axis; Ensure adequate habitat, Reduce disturbance, etc.) in BCR 14 NB Atlantic Region.
| Conservation objective | Percent |
|---|---|
| 1. Ensure adequate habitat | 58.83 |
| 2. Reduce mortality/increase productivity | 16.07 |
| 3. Manage individual species | 3.72 |
| 4. Reduce disturbance | 4.12 |
| 5. Ensure adequate food supplies | 7.97 |
| 6. Manage for climate change | 0.00 |
| 7. Improve understanding | 9.30 |
Figure 14. Percent of all conservation objectives assigned to each conservation objective category in MBU 11 NB.
Note: Widespread issues (including climate change) were excluded from this calculation as these are detailed in Section 3 of the full strategy.
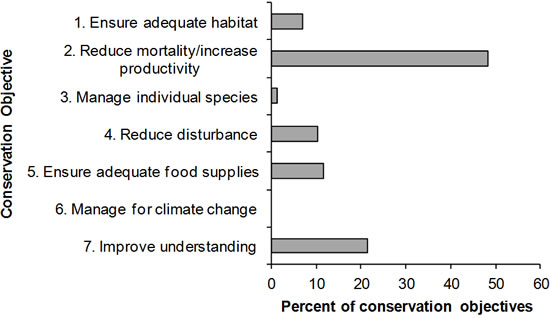
Long description for Figure 14
A horizontal bar graph indicating the percent of all conservation objectives (x axis) assigned to each conservation objective category (y axis; Ensure adequate habitat, Reduce disturbance, etc.) in MBU 11 NB Atlantic Region.
| Conservation objective | Percent |
|---|---|
| 1. Ensure adequate habitat | 6.94 |
| 2. Reduce mortality/increase productivity | 48.26 |
| 3. Manage individual species | 1.26 |
| 4. Reduce disturbance | 10.41 |
| 5. Ensure adequate food supplies | 11.67 |
| 6. Manage for climate change | 0.00 |
| 7. Improve understanding | 21.45 |
Figure 15. Percent of all conservation objectives assigned to each conservation objective category in MBU 12 NB.
Note: Widespread issues (including climate change) were excluded from this calculation as these are detailed in Section 3 of the full strategy.
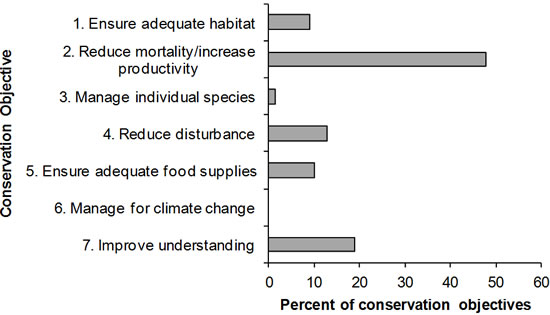
Long description for Figure 15
A horizontal bar graph indicating the percent of all conservation objectives (x axis) assigned to each conservation objective category (y axis; Ensure adequate habitat, Reduce disturbance, etc.) in MBU 12 NB Atlantic Region.
| Conservation objective | Percent |
|---|---|
| 1. Ensure adequate habitat | 9.00 |
| 2. Reduce mortality/increase productivity | 47.87 |
| 3. Manage individual species | 1.42 |
| 4. Reduce disturbance | 12.80 |
| 5. Ensure adequate food supplies | 9.95 |
| 6. Manage for climate change | 0.00 |
| 7. Improve understanding | 18.96 |
Element 6: Recommended actions
Recommended actions indicate on-the-ground activities that will help to achieve the conservation objectives (listed in Figs. 13, 14 and 15). Actions are strategic rather than highly detailed and prescriptive. Whenever possible, recommended actions benefit multiple species and/or respond to more than one threat. Recommended actions defer to or support those provided in recovery documents for species at risk at the federal, provincial or territorial level, but will usually be more general than those developed for individual species.
The recommended conservation actions are categorized as per the International Union for Conservation of Nature - Conservation Measures Partnership with the addition of categories for research and monitoring. In BCR 14 NB, the most frequently recommended conservation actions fall under the sub-categories of: 2.1 Site/area management and 5.3 Private sector standards and codes (Fig. 16). Examples of recommended conservation actions in sub-category 2.1 Site/area management include specific recommendations to maintain patch sizes, configuration and connectivity of different types of forests; to reduce fragmentation of habitats within wetlands to reduce the extent of edges; to maintain large trees; and to define and provide a minimum number, size and condition of residual snags and living trees for priority bird species in forested habitats. Examples of recommended conservation actions in sub-category 5.3 Private sector standards and codes include the development and implementation of guidelines for the protection of priority bird species; and the development of beneficial management practices for peat harvesting, renewable energy development, forestry and agriculture.
In New Brunswick, the Department of Natural Resources (DNR) manages roughly 50% of the province’s forested land. The DNR provides objectives, planning requirements, habitat descriptions and planning guidelines to guide Crown forest management. The objectives, set every five years, are based on very specific habitat requirements of vertebrates associated with particular forest types (New Brunswick Department of Natural Resources 2005b). The habitat requirements for the management of Crown forests have been incorporated into this document as recommended conservation actions wherever possible and appropriate.
In MBU 11 NB and in MBU 12 NB, the most frequently recommended conservation actions fall in the conservation action sub-categories 5.3 Private sector standards and codes and 5.4 Compliance and enforcement (Figures 17 and 18). Examples of recommended conservation actions in sub-category 5.3 Private sector standards and codes specific to MBUs include the implementation of beneficial management practices for aquaculture, fisheries and other coastal resource harvesting industries; and the development of beneficial management practices and avoidance guidelines to manage renewable energy developments and minimize habitat degradation. Examples of recommended conservation actions under action sub-category 5.4 Compliance and enforcement include continuing to monitor and enforce compliance with laws, policies and regulations to minimize seabird bycatch; and those related to the release of oil and other wastes into marine waters.
Recommended conservation actions related to increasing awareness and communications (sub-category 4.3 Awareness and communications) are frequently recommended for both MBU 11 NB and MBU 12 NB (Figures 17 and 18). Examples of recommended conservation actions related to awareness and communications include raising public awareness of shorebird habitat needs and the impacts of disturbance from recreational activities in coastal habitats; about issues surrounding human disturbance at seabird colonies or in other nesting areas; and about the impacts on shorebirds and seabirds when the shoreline is modified to protect infrastructure in coastal areas.
Figure 16. Percent of recommended actions assigned to each sub-category in BCR 14 NB.
“Research” and “monitoring” refer to specific species where additional information is required. For a discussion of broad-scale research and monitoring requirements, see Research and Population Monitoring Needs in Section 3 of the full strategy.
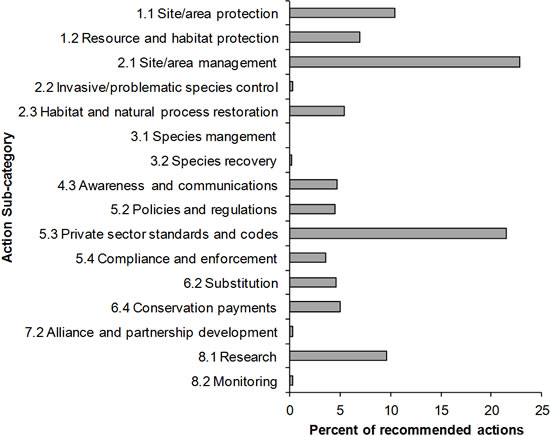
Long description for Figure 16
A horizontal bar graph indicating the percent of recommended action (x axis) assigned to each sub-category of recommended actions (y axis; Site/area protection, Species Management, etc.) in BCR 14 NB Atlantic Region.
| Conservation action | Percent |
|---|---|
| 1.1 Site/area protection | 10.40 |
| 1.2 Resource and habitat protection | 6.90 |
| 2.1 Site/area management | 22.82 |
| 2.2 Invasive/problematic species control | 0.28 |
| 2.3 Habitat and natural process restoration | 5.40 |
| 3.1 Species management | 0.00 |
| 3.2 Species recovery | 0.16 |
| 4.3 Awareness and communications | 4.68 |
| 5.2 Policies and regulations | 4.52 |
| 5.3 Private sector standards and codes | 21.55 |
| 5.4 Compliance and enforcement | 3.57 |
| 6.2 Substitution | 4.56 |
| 6.4 Conservation payments | 5.00 |
| 7.2 Alliance and partnership development | 0.32 |
| 8.1 Research | 9.60 |
| 8.2 Monitoring | 0.24 |
Figure 17. Percent of recommended actions assigned to each sub-category in MBU 11 NB.
“Research” and “monitoring” refers to specific species where additional information is required. For a discussion of broad-scale research and monitoring requirements, see Research and Population Monitoring Needs in Section 3 of the full strategy.
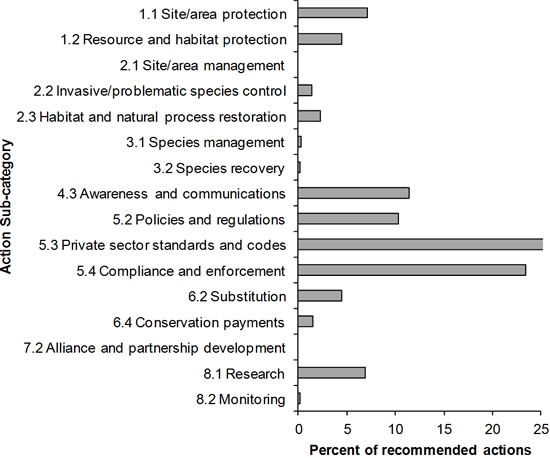
Long description for Figure 17
A horizontal bar graph indicating the percent of recommended action (x axis) assigned to each sub-category of recommended actions (y axis; Site/area protection, Species recovery, etc.) in MBU 11 NB Atlantic Region.
| Conservation action | Percent |
|---|---|
| 1.1 Site/area protection | 7.08 |
| 1.2 Resource and habitat protection | 4.46 |
| 2.1 Site/area management | 0.00 |
| 2.2 Invasive/problematic species control | 1.38 |
| 2.3 Habitat and natural process restoration | 2.31 |
| 3.1 Species management | 0.31 |
| 3.2 Species recovery | 0.15 |
| 4.3 Awareness and communications | 11.38 |
| 5.2 Policies and regulations | 10.31 |
| 5.3 Private sector standards and codes | 26.15 |
| 5.4 Compliance and enforcement | 23.38 |
| 6.2 Substitution | 4.46 |
| 6.4 Conservation payments | 1.54 |
| 7.2 Alliance and partnership development | 0.00 |
| 8.1 Research | 6.92 |
| 8.2 Monitoring | 0.15 |
Figure 18. Percent of recommended actions assigned to each sub-category in MBU 12 NB.
“Research” and “monitoring” refers to specific species where additional information is required. For a discussion of broad-scale research and monitoring requirements, see Research and Population Monitoring Needs in Section 3 of the full strategy.
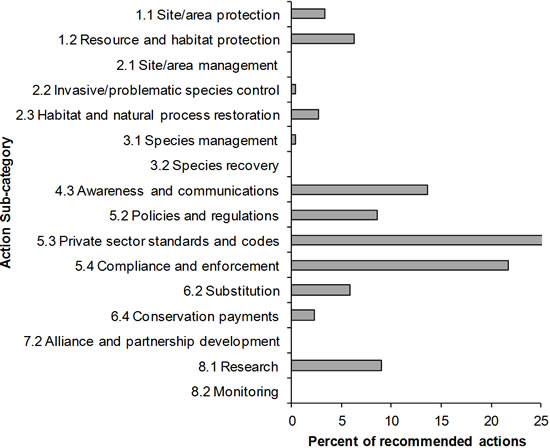
Long description for Figure 18
A horizontal bar graph indicating the percent of recommended action (x axis) assigned to each sub-category of recommended actions (y axis; Site/area protection, Species recovery, etc.) in MBU 12 NB Atlantic Region.
| Conservation action | Percent |
|---|---|
| 1.1 Site/area protection | 3.37 |
| 1.2 Resource and habitat protection | 6.32 |
| 2.1 Site/area management | 0.00 |
| 2.2 Invasive/problematic species control | 0.42 |
| 2.3 Habitat and natural process restoration | 2.74 |
| 3.1 Species management | 0.42 |
| 3.2 Species recovery | 0.00 |
| 4.3 Awareness and communications | 13.68 |
| 5.2 Policies and regulations | 8.63 |
| 5.3 Private sector standards and codes | 25.47 |
| 5.4 Compliance and enforcement | 21.68 |
| 6.2 Substitution | 5.89 |
| 6.4 Conservation payments | 2.32 |
| 7.2 Alliance and partnership development | 0.00 |
| 8.1 Research | 9.05 |
| 8.2 Monitoring | 0.00 |
References
Aboriginal Affairs and Northern Development Canada. 2012. Aboriginal Affairs and Northern Development Canada. 05 30, 2012. Accessed November 2012.
Andres, B.A. 2009. Analysis of Shorebird Population Trend Datasets. Unpublished document for the North American Bird Conservation Initiative, U.S. Committee. State of the Birds. 36 pp., Washington, D.C.: U.S. Department of Interior.
Andres, B.A., P.A. Smith, C.L. Gratto-Trevor and R.I.G. Morrison. 2012. Population estimates of North American shorebirds, 2012. Unpublished document.
Benoît, A.R. 2007. Aboriginal harvest of waterfowl in the Maritimes. CWS Technical Report Series No.488, Sackville, NB.: Environment and Climate Change Canada. Canadian Wildlife Service.
Benoît, H.P., J.A. Gagné, C. Savenkoff, P. Ouellet and M.N. Bourassa. 2012. State-of-the-Ocean Report for the Gulf of St.Lawrence Integrated Management (GOSLIM) Area. Can. Manuscr. Rep. Fish. Aquat. Sci. 2986: xi + 73 pp.
Berneshawi, S. 1997. Resource Management and the Mi'kmaq Nation. Can. J. Native Studies, 17(1) 1997: 115-148.
Canadian Council on Ecological Areas. 2011., Conservation Areas Reporting and Tracking System. Accessed October 2012.
Conservation Council of NB. 2010. Snapshots of Deforestation and Forest Degradation in NB. Accessed October 2012.
COSEWIC. 2012. Committee on Status of Endangered Wildlife in Canada. Accessed August 2012.
Dettmers, R. 2006. A Blueprint for the Design and Delivery of Bird Conservation in the Atlantic Northern Forest (PDF 7.7MB). Vers. 1.0. US Fish and Wildlife Service.
Donaldson, G.M., C. Hyslop, I. G. Morrison, H. L. Dickson and I. Davidson. 2000. Canadian Shorebird Conservation Plan. Ottawa, ON.: Canadian Wildlife Service, Environment and Climate Change Canada. 27 pp.
Fisheries and Oceans Canada. 2010. 2010 Canadian Marine Ecosystem Status and Trends Report. Version revised. Science Advisory Report. Accessed June 2012.
Food and Agriculture Organization (FAO). 2000. Land cover classification system. United Nations Food and Agriculture Organization, Rome.
Gulf of Maine Council on the Marine Environment. No date. State of the Gulf of Maine. Accessed June 2012.
Kennedy, J.A., E.A. Krebs and A.F. Camfield. 2012. A Manual for Completing All-bird Conservation Plans in Canada. April 2012 version, Ottawa, ON.: Canadian Wildlife Service, Environment and Climate Change Canada.
McMillan, A.D. 1995. Native Peoples and Cultures of Canada: An Anthropological Overview. Vancouver, Toronto: Douglas and McIntyre, 2nd edition.
Milko, R., L. Dickson, R. Elliot and G. Donaldson. 2003. Wings Over Water: Canada's Waterbird Conservation Plan. Canadian Wildlife Service, Environment and Climate Change Canada. 28 pp.
New Brunswick. 2004. Endangered Species Act. Canadian Legal Information Institute. Accessed 19 March 2013.
New Brunswick Department of Agriculture, Aquaculture and Fisheries. No date. New Brunswick's Agriculture and Agri-Food Industry (PDF 177KB). Government of New Brunswick. Accessed October 2010.
New Brunswick Department of Culture, Tourism and Healthy Living. 2012. New Brunswick Tourism Indicators - Summary Report 2011 (PDF 2.32MB). Government of New Brunswick. Accessed October 2012.
New Brunswick Department of Natural Resources. 2005b. Objectives and Standards for the New Brunswick Crown Forest for the 2007-2012 period. New Brunswick Government. 40 pp.
New Brunswick Eastern Habitat Joint Venture (NB-EHJV). 2008. Five Year Implementation Plan for the North American Waterfowl Management Plan. New Brunswick Eastern Habitat Joint Venture: Fredericton, NB. 66 p..
North American Waterfowl Management (NAWMP) Plan Committee. 2004. Implementation Framework: Strengthening the Biological Foundation. North American Waterfowl Management Plan.
Rich, T.D., C.J. Beardmore, H. Berlanga, P.J. Blancher, M.S.W. Bradstreet, G.S. Butcher, D.W. Demarest, E.H. Dunn, W.C. Hunter, E.E. Iñigo-Elias, J.A. Kennedy, A.M. Martell, A.O. Panjabi, D.N. Pashley, K.V. Rosenberg, C.M. Rustay, J.S. Wendt and T.C. Will. 2004. Partners in Flight North American Landbird Conservation Plan. Cornell Lab of Ornithology. Ithaca, NY. 85 pp + appendices.
Salafsky, N., D. Salzer, A. J. Stattersfield, C. Hilton-Taylor, R. Neugarten, S. H. M. Butchart, B. Collen, N. Cox, L. L. Master, S. O’Connor and D. Wilkie. 2008. A standard lexicon for biodiversity conservation: Unified classifications of threats and actions. Conservation Biology 22(4):897-911.
Species at Risk Public Registry. Accessed 4 April 2012. Schedule 1: List of Wildlife Species at Risk.
Statistics Canada. 2008. Total farm area, land tenure and land in crops, by province (Census of Agriculture, 1986 to 2006) (New Brunswick).
Stewart, R.L.M., K.A. Bredin, A.R. Couturier, A.G. Horn, D. Lepage, S. Makepeace, P.D. Taylor, M.-A. Villard and R.M. Whittam (eds.). Second Atlas of Breeding Birds of the Maritime Provinces.Expected to be published in 2014: Bird Studies Canada and Environment and Climate Change Canada, in preparation.
Therriault, J.C. 1991. The Gulf of St.Lawrence: small ocean or big estuary? Can. Spec. Publ. Fish. Aquat. Sci. 113: 359 pp.
Vasarhelyi, C. and D.A. Kirk. 2007. Scan of Atlantic Canada Provincial Policies, Regulations and Land Use Planning for Resource Industries that May Impact Incidental Take. Report prepared for Canadian Wildlife Service, Atlantic Region, Ottawa, ON.: Aquila Applied Ecologists.