
Bird Conservation Strategy for region 14 in Nova Scotia and select marine units
- Abridged version -
October 2013

The abridged version of the strategy available here contains a summary of the results, but does not include an analysis of conservation needs by habitat, a discussion of widespread conservation issues, or the identification of research and monitoring needs.
Other formats available for this document:
Table of contents
- Preface
- Acknowledgements
- Bird Conservation Strategy for Bird Conservation Region 14 and Marine Biogeographic Units 11 and 12 in Nova Scotia: Atlantic Northern Forest, Scotian Shelf and Bay of Fundy, and Gulf of St. Lawrence
- Executive summary
- Introduction: Bird Conservation Strategies
- Section 1: Summary of results - All Birds, All Habitats
- Element 1: Priority species assessment
- Element 2: Habitats important to priority species
- Element 3: Population objectives
- Element 4: Threat assessment for priority species
- Element 5: Conservation objectives
- Element 6: Recommended actions
- References
List of figures
- Figure 1: Land cover in BCR 14 in Nova Scotia.
- Figure 2: Map of protected and designated areas in BCR 14 in Nova Scotia.
- Figure 3: Map of the protected and designated areas in MBU 11 NS (M11) and MBU 12 NS (M12).
- Figure 4: Percent of priority bird species that are associated with each habitat type in BCR 14 NS.
- Figure 5: Percent of priority bird species that are associated with each habitat type in MBU 11 NS.
- Figure 6: Percent of priority bird species associated with each habitat type in MBU 12 NS.
- Figure 7: Percent of priority bird species associated with each population objective category in BCR 14 NS.
- Figure 8: Percent of priority bird species associated with each population objective category in MBU 11 NS.
- Figure 9: Percent of priority bird species associated with each population objective category in MBU 12 NS.
- Figure 10: Percent of identified threats to priority bird species within BCR 14 NS by threat sub-category.
- Figure 11: Percent of identified threats to priority bird species within MBU 11 NS by threat sub-category.
- Figure 12: Percent of identified threats to priority bird species within MBU 12 NS by threat sub-category.
- Figure 13: Percent of all conservation objectives assigned to each conservation objective category in BCR 14 NS.
- Figure 14: Percent of all conservation objectives assigned to each conservation objective category in MBU 11 NS.
- Figure 15: Percent of all conservation objectives assigned to each conservation objective category in MBU 12 NS.
- Figure 16: Percent of recommended actions assigned to each sub-category in BCR 14 NS.
- Figure 17: Percent of recommended actions assigned to each sub-category in MBU 11 NS.
- Figure 18: Percent of recommended actions assigned to each sub-category in MBU 12 NS.
List of tables
- Table 1: Priority bird species in BCR 14 NS, MBU 11 NS and MBU 12 NS, population objective, and the reason for priority status.
- Table 2: Summary of priority bird species, by bird group, in BCR 14 NS, MBU 11 NS, and MBU 12 NS.
- Table 3: Number of priority bird species in BCR 14 NS, MBU 11 NS, and MBU 12 NS by reason for priority status.
- Table 4: Relative magnitude of identified threats to priority species within BCR 14 NS, MBU 11 NS and MBU 12 NS by threat category and broad habitat class.
Preface
Environment and Climate Change Canada led the development of bird conservation strategies in each of Canada’s Bird Conservation Regions (BCRs) by drafting new strategies and integrating new and existing strategies into an all-bird framework. These integrated bird conservation strategies will serve as a basis for implementing bird conservation across Canada, and will also guide Canadian support for conservation work in other countries important to Canada’s migrant birds. Input to the strategies from Environment and Climate Change Canada’s conservation partners is as essential as their collaboration in implementing their recommendations.
Environment and Climate Change Canada has developed national standards for strategies to ensure consistency of approach across BCRs. Bird Conservation Strategies will provide the context from which specific implementation plans can be developed for each BCR, building on the programs currently in place through Joint Ventures or other partnerships. Landowners including Aboriginal peoples will be consulted prior to implementation.
Conservation objectives and recommended actions from the conservation strategies will be used as the biological basis to develop guidelines and beneficial management practices that support compliance with regulations under the Migratory Birds Convention Act, 1994.
Acknowledgements
This document follows templates developed by Alaine Camfield, Judith Kennedy and Elsie Krebs with the help of the BCR planners in each of the Canadian Wildlife Service regions throughout Canada. However, work of this scope cannot be accomplished without the contribution of many colleagues who provided or validated technical information, commented on earlier draft versions of the strategy, and supported the planning process. We would like to extend a sincere thank-you to Doug Bliss, Andrew Boyne, Paul Chamberland, Kevin Davidson, Michael Elliot, Carina Gjerdrum, Alan Hanson, Christie MacDonald, Bryan Martin, Keith McAloney, Bruce Pollard, Martin Raillard, Isabelle Robichaud, Dane Stuckel, Kyle Wellband, Becky Whittam, and other reviewers.
Bird Conservation Strategy for Bird Conservation Region 14 and Marine Biogeographic Units 11 and 12 in Nova Scotia: Atlantic Northern Forest, Scotian Shelf and Bay of Fundy, and Gulf of St. Lawrence

Long description for BCR 14 NS Map
Map of the Bird Conservation Regions (BCRs) of Canada with BCR 14 NS, Atlantic Region: Atlantic Northern Forest highlighted. The extent of the map includes Canada, with Alaska, Greenland and the northern portion of the U.S. also appearing. The map is divided by BCR (12 Canadian BCRs in total), with various colours, and their exact locations and sizes are indistinguishable, aside from BCR 14 NS.
The highlighted BCR 14 NS encompasses all of Nova Scotia and its surrounding waters.
Legend: Bird Conservation Regions of Canada. 14 NS - Atlantic Northern Forest; Environment and Climate Change Canada logo, and Government of Canada logo.
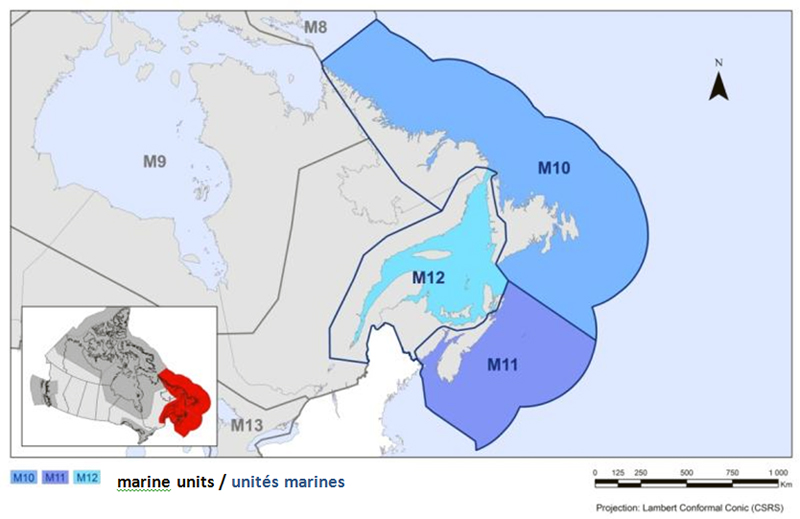
Long description for Marine Unit Map
Map of the Marine Biogeographical Units (MBUs) of eastern Canada. The map’s extent includes the western shore of Hudson Bay to Newfoundland’s offshore areas. M10, M11 and M12 are highlighted, while the adjoining borders of M8, M9 and M13 are visible. M10 covers most of the waters off Labrador and Newfoundland, M11 covers the waters off Nova Scotia, and M12 covers the Gulf of St Lawrence. There is a small map of Canada inset lower left, with the maritime region highlighted. The bilingual legend, along with the scale and projection of the map, appear below.
Executive summary
The landscape of Nova Scotia is a combination of mountainous terrain, lowland plains and coastal landforms typical of the Atlantic Northern Forest. Northern temperate forests dominate a large portion of Nova Scotia, and the most predominant forest types include spruce-fir conifer followed by mixed deciduous-coniferous forests. None of the resource-extraction industries in Nova Scotia are particularly dominant in terms of their impact on birds: forestry and agriculture are equally important, followed by commercial fisheries, electrical generation and marine transportation.
There are 62 priority bird species on land and 32 priority bird species in marine habitats. Wetlands are used by the greatest number of priority bird species (45%), while 35% use forests and 34% use cultivated and managed areas. There is a variety of current and potential threats to the region’s avifauna. Many of these threats are related to land use and, in particular, forestry and agricultural activities and include loss or fragmentation of all forest types because of logging activities; loss or fragmentation of habitats due to conversion into farmlands; and decreases in diet quality, in the health of birds, or in prey availability due to the contamination of food sources from biocides used in the forestry or agricultural industries. There is also a variety of threats related to urban or recreational housing expansion along the coastline including loss of habitat, human disturbances along the coast and shoreline protection of coastal infrastructure (such as roads and houses).
The most frequently identified conservation objective for priority birds in this region is to ensure adequate habitat availability. To meet this conservation objective, 40% of recommended actions are related to either land (or site) management, land (or site) protection, habitat restoration or protection. In Atlantic Canada, Nova Scotia is the province with the largest proportion of land (8%) designated as protected area. Furthermore, in 2007, the provincial government committed to protecting 12% of its land base by 2015.
Nova Scotia has 5 934 km of coastline along three main marine water bodies: the Gulf of St. Lawrence, the Atlantic Ocean and the Bay of Fundy. There are 45 priority bird species that use the coastal habitats of the three planning units: 17 use habitat above the high tide line, 32 use the intertidal coast of the Scotian Shelf and Bay of Fundy, and 28 use the intertidal coast of the Gulf of St. Lawrence.
Common threats to priority bird species in all three coastal habitats include disturbances due to ATV traffic, dogs walking off-leash and other human uses of beaches, and loss of specific habitat features due to changes in sedimentation patterns caused by installation of riprap. Priority birds in coastal habitats are also threatened by ocean oil-spill events and oil discharges from shipping activities. Recommended conservation actions to address these threats include managing coastal recreational and commercial activities to minimize disturbance to priority species; raising public awareness of priority birds and their habitat needs and the impacts of disturbance in coastal areas; and developing beneficial management practices and avoidance guidelines to manage shipping activities and minimize accidental oil discharges.
The Gulf of Maine and Scotian Shelf Ecozone is largely characterized by waters ≥ 30 m in depth. This marine unit also encompasses the Bay of Fundy, which is one of the largest semi-enclosed coastal seas in North America and is recognized as one of the world’s richest marine ecosystems with various marine and estuarine habitats.
The Gulf of St. Lawrence is part of one of the largest and most productive estuaries in Canada. It is highly influenced by humans as it is downstream to some of the largest urban and industrial centres and emitters of industrial and agricultural contaminants. This area is significantly warmer and shallower than the rest of the Gulf of St. Lawrence, although in winter this portion of the Gulf is predominantly ice-covered.
There are 31 priority bird species found in the Scotian Shelf and Bay of Fundy waters, and 20 priority bird species in the Gulf of St. Lawrence waters.
There is a variety of common threats to avifauna in both marine regions. Current threats include pollution from boat traffic, oil and gas exploration and exploitation, mineral mining, fishing, and aquaculture activities. A combination of beneficial management practices, public education, changes in legislation and clean-up programs could help alleviate many of these threats.
This conservation strategy builds on existing bird conservation strategies and complements those created for the other BCRs across Canada. Collectively, the strategies will serve as a framework for implementing bird conservation nationally and also identify international conservation issues for Canada’s priority birds. Strategies are not highly prescriptive, but rather are intended to guide future implementation efforts undertaken by various partners and stakeholders. More specifically, information presented in this document is based on an extensive and systematic literature review that, in turn, was reviewed by key regional experts on bird conservation. Planning and implementing conservation actions for priority birds in Nova Scotia will necessitate further discussion and work in order to prioritize the recommended actions with key partners.
Introduction: Bird Conservation Strategies
Context
This document is one of a suite of Bird Conservation Region strategies (BCR strategies) that have been drafted by Environment and Climate Change Canada for all regions of Canada. These strategies respond to Environment and Climate Change Canada’s need for integrated and clearly articulated bird conservation priorities to support the implementation of Canada’s migratory birds program, both domestically and internationally. This suite of strategies builds on existing conservation plans for the four “bird groups” (waterfowlFootnote[1], waterbirdsFootnote[2], shorebirdsFootnote[3] and landbirdsFootnote[4]) in most regions of Canada, as well as on national and continental plans, and includes birds under provincial/territorial jurisdiction. These new strategies also establish standard conservation planning methods across Canada and fill gaps, as previous regional plans do not cover all areas of Canada or all bird groups.
These strategies present a compendium of required actions based on the general philosophy of achieving scientifically based desired population levels as promoted by the four pillar initiatives of bird conservation. Desired population levels are not necessarily the same as minimum viable or sustainable populations, but represent the state of the habitat/landscape at a time prior to recent dramatic population declines in many species from threats known and unknown. The threats identified in these strategies were compiled using currently available scientific information and expert opinion. The corresponding conservation objectives and actions will contribute to stabilizing populations at desired levels.
The BCR strategies are not highly prescriptive. In most cases, practitioners will need to consult additional information sources at local scales to provide sufficient detail to implement the recommendations of the strategies. Tools such as beneficial management practices will also be helpful in guiding implementation. Partners interested in participating in the implementation of these strategies, such as those involved in the habitat Joint Ventures established under the North American Waterfowl Management Plan (NAWMP), are familiar with the type of detailed implementation planning required to coordinate and undertake on-the-ground activities.
Strategy structure
This strategy includes three distinct planning units: Bird Conservation Region 14 in Nova Scotia (BCR 14 NS) as well as the Marine Biogeographic Units 11 and 12 around Nova Scotia (MBU 11 NS and MBU 12 NS). All three units have a distinctive list of priority bird species. The MBUs have two habitat classes based on the IUCN land cover categories: the waterbodies, snow and ice habitat class and the coastal habitat class. In order to distinguish these from the equivalent habitat classes in the BCR 14 NS, they are renamed as follows: for the Gulf of St. Lawrence (MBU 12 NS) - marine waters and coastal (intertidal); for the Scotia Shelf and Bay of Fundy (MBU 11 NS) - marine waters and coastal (intertidal). In BCR 14 NS these habitat classes are: inland waterbodies and coastal (above high tide).
Section 1 of this strategy, published here, presents general information about the BCR and MBUs and the subregion, with an overview of the six elementsFootnote[5] that provide a summary of the state of bird conservation at the sub-regional level. Section 2, included in the full version of the strategy, provides more detail on the threats, objectives and actions for priority species grouped by each of the broad habitat types in the subregion. Section 3, also in the full version, presents additional widespread conservation issues that are not specific to a particular habitat or were not captured by the threat assessment for individual species, as well as research and monitoring needs, and threats to migratory birds while they are outside Canada. The approach and methodology are summarized in the appendices of the full strategy, but details are available in a separate document (Kennedy et al. 2012). A national database houses all the underlying information summarized in this strategy and is available from Environment and Climate Change Canada.
Characteristics of Bird Conservation Region 14: Atlantic Northern Forest in Nova Scotia
Bird Conservation Region 14 (Atlantic Northern Forest) encompasses an area greater than 35.6 million ha and includes the Maritime provinces, Quebec’s Gaspe Peninsula and Eastern Townships in Canada and most of the states of Maine, New Hampshire and Vermont and parts of New York, Massachusetts and Connecticut in the United States (Dettmers 2006). Most of this BCR is low-mountainous or open hilly country interspersed with valleys and plains, with nearly 85% of it classified as some type of forest (including regenerating forest; Dettmers 2006). Geologically, Bird Conservation Region 14 (or the Atlantic Maritime Ecozone) is a mix of sedimentary and igneous bedrock (Canadian Biodiversity Website, Redpath Museum, McGill University 2012).
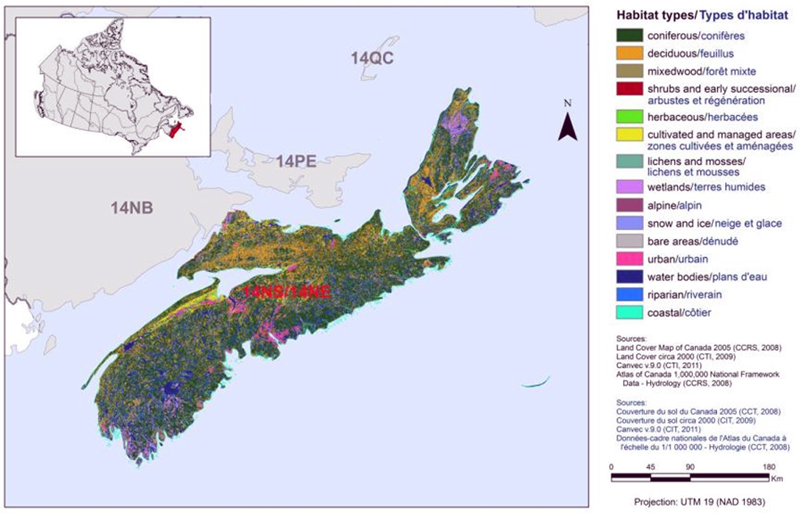
The portion of BCR 14 in the province of Nova Scotia extends over 52 841 km2 and reflects the combination of mountainous, lowland plain and coastal landforms found within the Atlantic Northern Forest (Fig. 1). While the maps in this document are drawn at scales and resolutions that differ from the land cover percentage we provide, Dettmers (2006) has estimated 15 different land cover types in all of BCR 14 and within each province and state. While these estimates may not be current, they do provide a relative idea of the importance (in terms of size) of a particular habitat type within BCR 14 NS.
Figure 1: Land cover in BCR 14 in Nova Scotia.
Long description for Figure 1
Map of the landcover in BCR 14 NS Region: Atlantic Northern Forest. The map’s extent includes eastern New Brunswick, all of PEI and Nova Scotia, along with the Magdalen Islands and the southwestern tip of Newfoundland; adjoining BCRs are also shown.
BCR 14 NS covers all of Nova Scotia. The various habitat types that exist in the BCR are shown on the map, and are explained in the following bilingual legend (appearing to the right of the map):
- Coniferous/conifères
- Deciduous/feuillus
- Mixedwood/forêt mixte
- Shrubs and early successional/arbustes et régénération
- Herbaceous/herbacées
- Cultivated and managed areas/zone cultivées et aménagées
- Lichens and mosses/lichens et mousses
- Wetlands/terres humides
- Alpine/alpin
- Snow and ice/neige et glace
- Bare areas/denude
- Urban/urbain
- Water bodies /plans d’eau
- Riparian/riverain
- Coastal/côtier
The remaining text in the legend provides the data sources for the map (i.e. Land Cover Map of Canada 2005 (CCRS, 2008), the projection of the map (i.e. UTM 9 (NAD 1983)) and there is a visual representation of the scale of the map.
For BCR 14 NS, the most common habitat type is coniferous forest, followed by deciduous forest and wetlands.
Northern temperate forests dominate a large portion of BCR 14 NS, and the most predominant forest types include spruce-fir conifer (21 877 km2), northern hardwood (5 246 km2) and mixed deciduous-coniferous forests (10 122 km2). Early successional / shrubland habitat is another widespread habitat type, including regenerating forests (5 080 km2) and natural shrublands (846 km2). Nova Scotia also encompasses considerable amounts of wetland habitats, including 5 934 km of mainland (including Cape Breton) coastline (e.g., emergent saltmarsh, mud flats, sandy beaches, and rocky shoreline, and open water areas associated with estuaries and bays), freshwater emergent marshes (2 494 km2), freshwater forested wetlands (1 278 km2), and a large number of open freshwater lakes (over 3000), streams and rivers (3 273 km2; Dettmers 2006; Natural Resources Canada 2010).
Nova Scotia’s climate is typified by large seasonal temperature differences, with warm (and often humid) summers and cold winters. Due to the ocean's moderating effect, this is the warmest province in Canada (Environment and Climate Change Canada 2013).
Vasarhelyi and Kirk (2007) ranked the main resource-based industries (forestry, agriculture, fisheries/hunting/trapping, mining and oil/gas extraction, and electrical generation and transmission) in each province based on a composite assessment of their potential impact on the incidental take of migratory birds. In Nova Scotia, both the forestry and agriculture industries ranked highest, followed by electrical generation, marine transport and commercial fisheries (see Table 8 in Vasarhelyi and Kirk 2007). The contribution of these industries to the provincial Gross Domestic Product is highest from the electrical generation industry, followed by mining and oil/gas exploration, fisheries, agriculture and forestry (Vasarhelyi and Kirk 2007).
The aquaculture industry in Nova Scotia is quite different from the other two Maritime provinces in part due to the coastal exposure of Nova Scotia to the cold waters of the Atlantic Ocean. Despite this cold water, there are over 630 aquaculture licences (Vasarhelyi and Kirk 2007), which make this industry relatively more important in Nova Scotia than in Newfoundland and Labrador (the other province exposed to cold water).
Nova Scotia is within the traditional Mi’kmaq territory (Aboriginal Affairs and Northern Development Canada 2013). In fact, the traditional Mi’kmaq territory covers much of BCR 14. At the time prior to European contact, the Mi’kmaq were semi-nomadic and harvested the wildlife available to them: seafood, big and small mammals, fish, seabirds and their eggs. While the current traditions of the Mi’kmaq have changed and evolved over time, much of it through French and British colonization of what is now Canada (McMillan 1995), they value and hold precious all wildlife and life forms within and beyond their territory (Berneshawi 1997).
There is a variety of current and potential threats to the region’s avifauna. Many of these threats are related to land use and, in particular, forestry and agricultural activities and include: loss or fragmentation of all forest types because of logging activities; loss or fragmentation of habitats due to conversion into farmlands; decreases in diet quality, in the health of birds, or in prey availability due to the contamination of food sources from biocides used in the forestry or agricultural industries. There is also a variety of threats related to urban or recreational housing expansion along the coastline including loss of habitat, human disturbances along the coast and shoreline protection of coastal infrastructure (such as roads and houses).
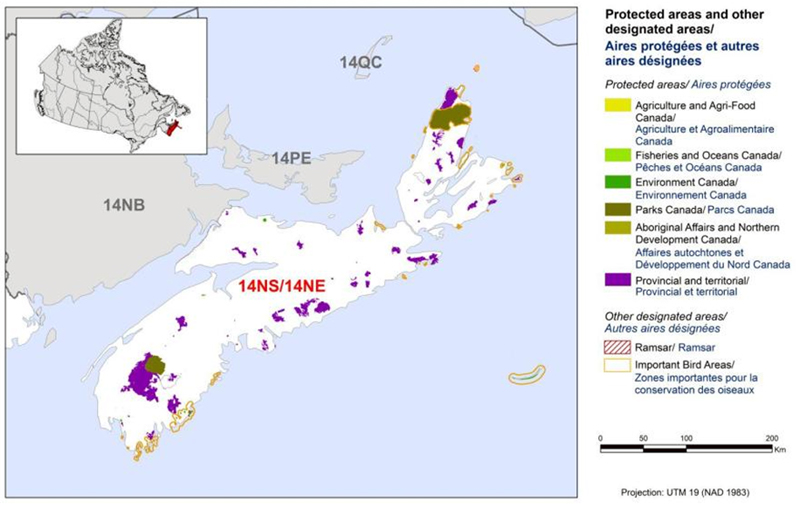
In Atlantic Canada, Nova Scotia has the highest proportion of its land base (8%) designated as protected areas (Canadian Council on Ecological Areas 2011; Fig. 2). Environment and Climate Change Canada manages six National Wildlife Areas and eight Migratory Bird Sanctuaries (51.32 km2 on land and 19.47 km2 in water) and Parks Canada Agency manages three areas (1 349 km2 on land and 2.7 km2 in water). The bulk of the protected areas in Nova Scotia are provincially managed (3 197 km2 ). In 2007, the provincial government passed legislation that commits to protecting 12% of Nova Scotia’s land by 2015 (Nova Scotia Government 2012a). The ability of governments to establish protected areas is limited by the amount and location of Crown Land. In Nova Scotia, nearly 70% of the land base is privately owned. In addition to protected areas, there are a number of environmental non-governmental organizations engaged in securing and managing lands for conservation. The major organizations engaged in these activities in Nova Scotia are:
- Ducks Unlimited Canada with 184 km2 of waterfowl habitat in N.S., either owned or with restrictive covenants;
- Nova Scotia Nature Trust with 23 km2; and
- Nature Conservancy Canada, which owns or has easements on 70 km2.
In addition, designations that recognize ecological uniqueness have elevated public awareness and promoted the conservation of ecological significant habitats such as:
- 2 Biosphere Reserves: 18 167 km2 (including Southwest Nova Biosphere Reserve, the largest in Canada);
- the Bay of Fundy Western Hemisphere Shorebird Reserve Network site: 620 km2;
- 3 wetlands recognized as Ramsar sites under the Ramsar Convention on Wetlands of International Importance: 268 km2; and
- 16 Important Bird Areas: 3 691 km2.
Figure 2: Map of protected and designated areas in BCR 14 in Nova Scotia.
Long description for Figure 2
Map of protected and other designated areas in BCR 14 NS Region: Atlantic Northern Forest. The map’s extent includes eastern New Brunswick, all of PEI and Nova Scotia, along with the Magdalen Islands and the southwestern tip of Newfoundland; adjoining BCRs are also shown. BCR 14 NS covers all of Nova Scotia.
The various types of protected areas that exist in the BCR are shown on the map, and are explained in the following bilingual legend (appearing to the right of the map):
Protected areas/Aires protégées
- Agriculture and Agri-Food Canada/Agriculture et Agroalimentaire Canada
- Fisheries and Oceans Canada/Pêches et Océans Canada
- Environment and Climate Change Canada/Environnement et Changement climatique Canada
- Parks Canada/Parcs Canada
- Aboriginal Affairs and Northern Development Canada/Affaires autochtones et Développement du Nord Canada
- Provincial/Provincial
Other designated areas/autres aires désignées
- Important Bird Areas/ Aires d’importance pour les oiseaux
- Ramsar/Ramsar
There is also a visual representation of scale for the map in the legend and the projection of the map (i.e. UTM 9 (NAD 1983)).
The most common type of protected area shown is provincial. There are also three National Parks visible. Several Important Bird Areas of varying sizes can be seen throughout.
Characteristics of Marine Biogeographic Unit 11: Scotian Shelf and Bay of Fundy of Nova Scotia
The Gulf of Maine and Scotian Shelf Ecozone (corresponding to Marine Biogeographic Unit 11, Fig. 3) is bounded by the Hague Line to the southwest (defining the international border with the United States) and by the southern edge of the Laurentian Channel to the northeast (Fisheries and Oceans Canada 2010). It includes coastal portions of Nova Scotia and New Brunswick, and extends beyond the edge of the continental shelf to the 200 nm limit of the Canadian Exclusive Economic Zone (total area 417 000 km2). MBU 11 includes shelf margin/continental slope and abyssal plain as the distance from the coast increases, and largely is characterized by waters ≥30 m in depth (Fisheries and Oceans Canada 2010). The North Atlantic Oscillation is the dominant atmospheric pattern in the North Atlantic Ocean and a significant large-scale abiotic driver in this ecozone (Fisheries and Oceans Canada 2010). The circulation patterns on the Scotian Shelf are governed largely by its complex topography and the influence of three major currents: i) the warm, salty Gulf Stream over the continental slope to the south, ii) the downstream influence of the cold Labrador Current from the north, and iii) the cool, fresh Scotian Shelf Current derived from the outflow of the Gulf of St. Lawrence (Fisheries and Oceans Canada 2010).
MBU 11 has experienced a major shift in ecosystem structure (Fisheries and Oceans Canada 2010). For example, some ground fish species have shown declines in the size and condition of individual fish in the past decades, the grey seal population has increased exponentially, and increased stratification has resulted in reduced nutrient and energy flow between bottom and surface waters. Ocean acidification is expected to affect primary productivity and higher organisms that form shells. Fisheries are also expected to continue to result in large-scale ecosystem effects. Certain alien invasive species (e.g. tunicates and green crab) have already contributed to the displacement of native species and change in community structures.
Figure 3: Map of the protected and designated areas in MBU 11 NS (M11) and MBU 12 NS (M12).

Long description for Figure 3
Map of the Marine Biogeographical Units of eastern Canada. The map’s extent includes the western shore of Hudson Bay to Newfoundland’s offshore areas. M10, M11 and M12 are highlighted, while the adjoining borders of M8, M9 and M13 are visible. M10 covers most of the waters off Labrador and Newfoundland, M11 covers the waters off Nova Scotia, and M12 covers the Gulf of St Lawrence. North is indicated with an arrow in the upper left corner of the map. There is a small map of Canada inset lower left, with the area of interest highlighted.
The various types of protected areas that exist in the BCR are shown on the map, and are explained in the following bilingual legend (appearing to the right of the map):
Protected areas/Aires protégées
- Agriculture and Agri-Food Canada/Agriculture et Agroalimentaire Canada
- Fisheries and Oceans Canada/Pêches et Océans Canada
- Environment and Climate Change Canada/Environnement et Changement climatique Canada
- Parks Canada/Parcs Canada
- Aboriginal Affairs and Northern Development Canada/Affaires autochtones et Développement du Nord Canada
- Provincial/Provincial
Other designated areas/autres aires désignées
- Important Bird Areas/ Aires d’importance pour les oiseaux
- Ramsar/Ramsar
There is also a visual representation of scale for the map in the legend and the projection of the map (i.e. UTM 9 (NAD 1983)).
The most common type of protected/designated area visible at this scale in MBUs 11 and 12 are Important Bird Areas, which occur fairly frequently in patches along the coasts. There is also a large Fisheries and Oceans Canada protected area east of the Nova Scotian coast.
MBU 11 also encompasses the Bay of Fundy and part of the Gulf of Maine, which is one of the largest semi-enclosed coastal seas in North America and is recognized as one of the world’s richest marine ecosystems with various marine and estuarine habitats (Gulf of Maine Council on the Marine Environment 2010). Some extensive saltmarsh estuaries associated with outflow from important river systems are located on both the New Brunswick and the Nova Scotia coasts.
Nova Scotia MBU 11 has a total area of approximately 408 000 km2 (Fig. 3). The coastline of MBU 11 NS is varied and includes significant intertidal mudflats, some of which are among the most extensive in North America. Some extensive saltmarsh estuaries are associated with outflow from important river systems located on the Nova Scotia coast. The coastline also hosts large beaches, areas of cliffs and bedrock ledges.
There is a variety of current and potential threats to the region’s avifauna. Current threats include pollution from shipping and other boat traffic, oil and gas exploration and exploitation, mineral mining, fishing, and aquaculture activities (e.g., competition for resources, fisheries by-catch mortality, and increased boat traffic and disturbance to specific areas important to birds). Coastal development affects the shoreline through transformation of coastal habitat for housing and infrastructure development (in-filling of coastal wetlands, irrigation and erosion control, etc.). The impacts of measures currently used to prevent the erosion of the coastline will be further exacerbated by sea-level rise due to changing climate. Climate change is expected to result in a general warming of atmospheric temperatures at these latitudes, with consequences that could include changes in ocean temperatures, ocean currents, ice regimes, frequency of severe weather events, and abundance and distribution of prey and predators (Fisheries and Oceans Canada 2010). Other poorly understood factors, with the potential to severely affect bird survival, include the arrival or changes in occurrence patterns of alien invasive species (such as tunicates and green crab), ecto- and endoparasites, and diseases. A combination of beneficial management practices, public education, changes in legislation and clean-up programs could help alleviate many of these threats.
On the Scotian Shelf, 200 km off the Nova Scotia coast, the Gully was established as a Marine Protected Area in 2004 by Fisheries and Oceans Canada (Fig. 3). The Gully is the largest marine canyon on the east coast of North America. It is 80 km long and at its mouth is almost 50 km wide. It has depths ranging from 200 to 2500 m. Sable Island, near the Gully, is currently a Migratory Bird Sanctuary and a National Park Reserve and hosts important seabirds and landbirds (including the only known breeding site in Canada for the Ipswich Sparrow) and has the largest grey seal colony in the world (Fig. 3). The Bay of Fundy is recognized both as a Biosphere Reserve (4 300 km2) and as a site of hemispheric importance (620 km2) within the Western Hemisphere Shorebird Reserve Network.
Characteristics of Marine Biogeographic Unit 12: Gulf of St. Lawrence of Nova Scotia
The Estuary and Gulf of Saint Lawrence (corresponding to Marine Biogeographic Unit 12, Fig. 3) represents one of the largest and most productive estuarine/marine ecosystems in Canada, and in the world (total area of approximately 247 000 km2; Therriault 1991). With a drainage basin that includes the Great Lakes, the St. Lawrence marine ecosystem receives more than half of the freshwater inputs from the Atlantic Coast of North America. This ecosystem is also strongly influenced by ocean and climate variability in the North Atlantic, of both Arctic (Labrador Current) and tropical (Gulf Stream) origin. As a result, this area exhibits large spatial and temporal variations in environmental conditions and oceanographic processes (Benoît et al. 2012). This unique setting provides the conditions for a highly diverse and productive biological community and trophic structure (Benoît et al. 2012).
MBU 12 is situated downstream of some of the largest urban and industrial centres, areas of pronounced development on the continent and emitters of industrial and agricultural-based contaminants (Benoît et al. 2012). The massive influx of fresh water, especially during springtime and summer wet seasons, lowers salinity levels in the Gulf and Estuary. Increasing commercial, ecotourism and recreational navigation are vectors for the propagation of aquatic invasive species (Benoît et al. 2012). Shoreline development and associated nutrient and sediment loading as well as a large and expanding shellfish aquaculture industry have transformed large portions of the coast, the estuarine and lagoon waters into aquaculture farms (Benoît et al. 2012). Benoît et al. (2012) reviewed evidence that suggested important aspects of the food-web in MBU 12 changed in the early 1990s. Also, increasing average sea surface temperature and hypoxia, partly as a result of climate change and coastal zone deterioration related to anthropogenic pressures (e.g., coastal eutrophication), may be causing physiological stress in marine organisms (Benoît et al. 2012).
The Nova Scotia portion of MBU 12 (MBU 12 NS) is approximately 27 000 km2 (Fig. 3) and has a complex coastline resulting from glacial processes, which includes cliffs, cobble and sand beaches, and exposed bedrock. These features are interspersed with estuaries hosting salt marshes and wetlands of varying size and influence. Spatial and temporal variation in environmental conditions and oceanographic processes result in a diverse and productive biological community and trophic structure.
There is a variety of current and potential threats to the region’s avifauna. Current threats include pollution from shipping and other boat traffic, fishing and aquaculture activities (e.g., competition for resources, fisheries by-catch mortality, increased boat traffic and disturbance to specific areas important to birds). Coastal development affects the shoreline by transforming coastal habitat for housing and infrastructure development (in-filling of coastal wetlands, irrigation and erosion control, etc.). The measures used to prevent erosion of the coastline will be further exacerbated by sea-level rise due to changing climate. Climate change is expected to result in a general warming of atmospheric temperatures at these latitudes, with consequences that could include changes in ocean temperatures, ocean chemistry (e.g., eutrophication, hypoxia and salinity), ocean currents, ice regimes, frequency of severe weather events, and abundance and distribution of prey and predators (Benoît et al. 2012). Other poorly understood factors with the potential to severely affect bird survival include the arrival or changes in occurrence patterns of alien invasive species (such as tunicates and green crab), ecto- and endoparasites, and diseases. A combination of beneficial management practices, public education, changes in legislation and clean-up programs could help alleviate many of these threats.
Section 1: Summary of results - All Birds, All Habitats
Element 1: Priority species assessment
These Bird Conservation Strategies identify “priority species” from all regularly occurring bird species in each BCR subregion. Species that are vulnerable due to population size, distribution, population trend, abundance and threats are included because of their “conservation concern”. Some widely distributed and abundant “stewardship” species are also included. Stewardship species are included because they typify the national or regional avifauna and/or because they have a large proportion of their range and/or continental population in the subregion; many of these species have some conservation concern, while others may not require specific conservation effort at this time. Species of management concern are also included as priority species when they are at (or above) their desired population objectives but require ongoing management because of their socio-economic importance as game species or because of their impacts on other species or habitats.
The purpose of the prioritization exercise is to focus implementation efforts on the issues of greatest significance for Canadian avifauna. Table 1 provides a full list of all priority species and their reason for inclusion in BCR 14 NS, MBU 11 NS or MBU 12 NS. Tables 2 and 3 summarize the number of priority species in BCR 14 NS, MBU 11 NS or MBU 12 NS by bird group and by the reason for priority status.
There are 62 priority species in BCR 14 NS. The list of priority birds is dominated by landbirds (40 species) but also includes 9 species of shorebirds, 6 species of waterbirds and 7 species of waterfowl (Table 1). However, overall 33% of all shorebird species found in BCR 14 NS were identified as priority species, compared with 24% of waterbird species, 26% of waterfowl species and 25% of landbird species (Table 2). Nineteen percent (19%) of the priority species in BCR 14 NS are species at risk, and are protected by federal or provincial legislation (Table 3).
There are 46 priority species in MBU 11 NS. The list of priority birds is dominated by waterbirds (21 species) and includes 15 species of shorebirds and 10 species of waterfowl (Table 1). Forty-eight percent (48%) of all shorebirds found in MBU 11 NS are priority species compared with 38% of waterbirds and 34% of waterfowl (Table 2). Thirteen percent (13%) of the priority bird species in MBU 11 NS are considered at risk, and are protected by federal or provincial legislation (Table 3).
There are 35 priority species in MBU 12 NS. There are 13 species of waterbirds, 13 species of shorebirds and 9 species of waterfowl (Table 1). Fifty-four percent (54%) of all shorebirds found in MBU 12 NS are priority species compared with 28% of waterbirds and 32% of waterfowl (Table 2). Fourteen percent (14%) of the priority bird species in MBU 12 NS are considered at risk and are protected by federal or provincial legislation (Table 3).
Table 1: Priority bird species in BCR 14 NS, MBU 11 NS and MBU 12 NS, population objective, and the reason for priority status. Accessible Version of Table 1.
Table 2: Summary of priority bird species, by bird group, in BCR 14 NS, MBU 11 NS and MBU 12 NS. Table 2 is presented here in 3 parts.
| Bird Group | Total Species |
Total Priority Species | Percent Listed as Priority | Percent of Priority List |
|---|---|---|---|---|
| BCR 14 NS | ||||
| Landbird | 163 (67%) | 40 | 25% | 64% |
| Shorebird | 27 (11%) | 9 | 33% | 15% |
| Waterbird | 25 (10%) | 6 | 24% | 10% |
| Waterfowl | 27 (11%) | 7 | 26% | 11% |
| Total BCR 14 NS | 242 | 62 | 100% |
| Bird Group | Total Species |
Total Priority Species | Percent Listed as Priority | Percent of Priority List |
|---|---|---|---|---|
| MBU 11 NS | ||||
| Landbird | 0 | 0 | 0 | 0 |
| Shorebird | 31 (27%) | 15 | 48% | 32% |
| Waterbird | 55 (48%) | 21 | 38% | 46% |
| Waterfowl | 29 (25%) | 10 | 34% | 22% |
| Total MBU 11 NS | 115 | 46 | 100% |
| Bird Group | Total Species |
Total Priority Species | Percent Listed as Priority | Percent of Priority List |
|---|---|---|---|---|
| MBU 12 NS | ||||
| Landbird | 0 | 0 | 0 | 0 |
| Shorebird | 24 (24%) | 13 | 54% | 37% |
| Waterbird | 46 (47%) | 13 | 28% | 37% |
| Waterfowl | 28 (29%) | 9 | 32% | 26% |
| Total MBU 12 NS | 98 | 35 | 100% |
Table 3: Number of priority bird species in BCR 14 NS, MBU 11 NS, and MBU 12 NS by reason for priority status. Table 3 is presented here in 3 parts.
| Reason for Priority Listinga | Landbirds | Shorebirds | Waterbirds | Waterfowl |
|---|---|---|---|---|
| BCR 14 NS | ||||
| COSEWICb | 12 | 1 | 0 | 1 |
| Federal SARA listedc | 10 | 1 | 0 | 1 |
| Provincially listedd | 4 | 1 | 0 | 0 |
| NAWMPe | - | - | - | 6 |
| National/Continental Concern | 20 | 7 | 5 | 4 |
| Regional/ Sub-regional Concern | 11 | 2 | 2 | 1 |
| National/Continental Stewardship | 12 | 0 | 0 | 0 |
| Regional/Sub-regional Stewardship | 17 | 1 | 1 | 1 |
| Management Concern | 0 | 0 | 0 | 2 |
| Expert review | 7 | 0 | 0 | 1 |
| Reason for Priority Listinga | Landbirds | Shorebirds | Waterbirds | Waterfowl |
|---|---|---|---|---|
| MBU 11 NS | ||||
| COSEWICb | 0 | 2 | 2 | 2 |
| Federal SARA listedc | 0 | 2 | 3 | 2 |
| Provincially listedd | 0 | 2 | 1 | 0 |
| NAWMPe | - | - | - | 8 |
| National/Continental Concern | 0 | 11 | 11 | 9 |
| Regional/ Sub-regional Concern | 0 | 4 | 10 | 1 |
| National/Continental Stewardship | 0 | 0 | 0 | 0 |
| Regional/ Sub-regional Stewardship | 0 | 0 | 0 | 0 |
| Management Concern | 0 | 0 | 0 | 1 |
| Expert review | 0 | 0 | 0 | 2 |
| Reason for Priority Listinga | Landbirds | Shorebirds | Waterbirds | Waterfowl |
|---|---|---|---|---|
| MBU 12 NS | ||||
| COSEWICb | 0 | 2 | 1 | 1 |
| Federal SARA listedc | 0 | 2 | 2 | 1 |
| Provincially listedd | 0 | 2 | 0 | 0 |
| NAWMP5e | - | - | - | 7 |
| National/Continental Concern | 0 | 9 | 7 | 8 |
| Regional/ Sub-regional Concern | 0 | 4 | 6 | 1 |
| National/Continental Stewardship | 0 | 0 | 0 | 0 |
| Regional/ Sub-regional Stewardship | 0 | 0 | 0 | 0 |
| Management Concern | 0 | 0 | 0 | 1 |
| Expert review | 0 | 0 | 0 | 2 |
a A single species can be on the priority list for more than one reason. Note that not all reasons for inclusion apply to every bird group (indicated by “-”).
b COSEWIC indicates species assessed by the Committee on the Status of Endangered Wildlife in Canada as Endangered, Threatened, or Special Concern (COSEWIC 2012).
c Species listed on Schedule 1 of the Species at Risk Act as Endangered, Threatened, or Special Concern (Species at Risk Public Registry 2012).
d Provincially listed indicates species listed as Endangered, Threatened or Vulnerable under the Nova Scotia Endangered Species Act (Nova Scotia Government 2007a).
e NAWMP indicates ”key species” in the NS EHJV 5-year Implementation Plan (2008), or ranked under NAWMP (NAWMP Plan Committee 2004) as having “High” or “Highest” breeding or non-breeding conservation/monitoring needs in the BCR.
Element 2: Habitats important to priority species
Identifying the broad habitat requirements for each priority species within the BCR and the MBUs allowed species to be grouped by shared habitat-based conservation issues and actions. If many priority species associated with the same habitat face similar conservation issues, then conservation action in that habitat may support populations of several priority species. BCR strategies use a modified version of the standard land cover classes developed by the United Nations (Food and Agriculture Organization, FAO 2000) to categorize habitats, and species were often assigned to more than one habitat class.
The assignment of habitat associations for priority bird species was primarily done through literature review and expert consultation. For each priority species in BCR 14 NS, MBU 11 NS and MBU 12 NS, all of their known habitat associations were considered, not just the primary habitat associations. Because of the variability and the availability of information related to species-habitat associations, quantifying the relative importance of any given habitat was not possible. In this document, statements regarding the importance of habitat types for priority bird species are related to the number of priority birds associated with each habitat and may not reflect the overall importance of the habitat to all bird species in the planning unit. For more quantitative and qualitative field-based information on habitat associations of all breeding birds species in Nova Scotia, please consult the Second Maritimes Breeding Bird Atlas (Stewart et al. in prep.).
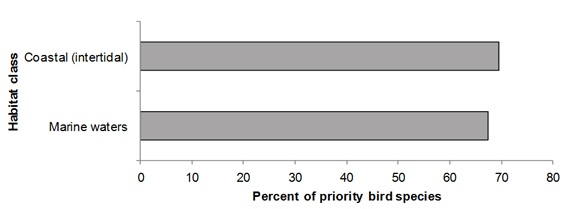
In BCR 14 NS, wetlands are used by the greatest number of priority bird species (45%, 28 priority bird species; Fig. 4). A high percentage of priority bird species is also found in coniferous and mixed forests and cultivated and managed areas. Thirty-five percent (35%) of priority species use forested habitats (22 species), and 34% use cultivated and managed areas (21 species). In the Scotian Shelf and Bay of Fundy (MBU 11 NS), 15 priority species use the coastal (intertidal) habitats exclusively, and 14 use the marine waters exclusively. Seventeen priority species use both the coastal (intertidal) habitats and marine waters (Fig. 5).
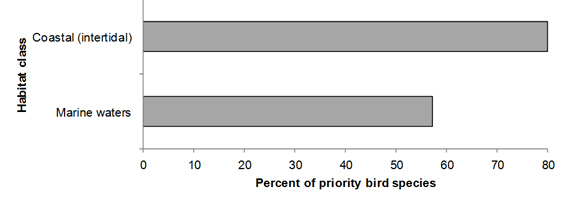
In the Gulf of St. Lawrence (MBU 12 NS), 15 priority species use the coastal (intertidal) habitats, and seven species use marine waters, while 13 priority species use both of these habitats (Fig. 6).
Figure 4: Percent of priority bird species that are associated with each habitat type in BCR 14 NS.
Note: The total exceeds 100% because species may be assigned to more than one habitat.
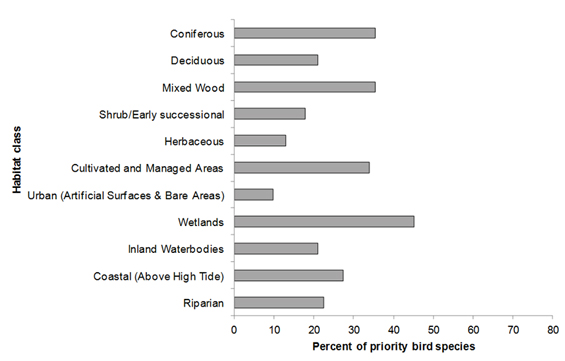
Long description for Figure 4
A horizontal bar graph indicating the percent of priority species (x axis) that are associated with each habitat type (y axis: coniferous, deciduous, mixed wood, shrub/early successional, herbaceous, cultivated and managed areas, urban, wetlands, inland waterbodies, coastal and riparian) in BCR 14 NS Atlantic Region. Note: The total exceeds 100% because each species may be assigned to more than one habitat.
| Habitat class | Percent |
|---|---|
| Coniferous | 35.48 |
| Deciduous | 20.97 |
| Mixed Wood | 35.48 |
| Shrub/Early successional | 17.74 |
| Herbaceous | 12.9 |
| Cultivated and Managed Areas | 33.87 |
| Urban (Artificial Surfaces and Bare Areas) | 9.68 |
| Wetlands | 45.16 |
| Inland Waterbodies | 20.97 |
| Coastal (Above High Tide) | 27.42 |
| Riparian | 22.58 |
Figure 5: Percent of priority bird species that are associated with each habitat type in MBU 11 NS.
Note: The total exceeds 100% because species may be assigned to more than one habitat.
Long description for Figure 5
A horizontal bar graph indicating the percent of priority species (x axis) that are associated with each habitat type (y axis: coastal and marine waters) in MBU 11 NS Atlantic Region. Note: The total exceeds 100% because each species may be assigned to more than one habitat.
| Habitat Class | Percent |
|---|---|
| Coastal (intertidal) | 69.57 |
| Marine waters | 67.39 |
Figure 6: Percent of priority bird species associated with each habitat type in MBU 12 NS.
Note: The total exceeds 100% because species may be assigned to more than one habitat.
Long description for Figure 6
A horizontal bar graph indicating the percent of priority species (x axis) that are associated with each habitat type (y axis: coastal and marine waters) in MBU 12 NS Atlantic Region. Note: The total exceeds 100% because each species may be assigned to more than one habitat.
| Habitat Class | Percent |
|---|---|
| Coastal (intertidal) | 80 |
| Marine waters | 57.14 |
Element 3: Population objectives
Population objectives allow us to measure and evaluate conservation success. The objectives in this strategy are assigned to categories and are based on a quantitative or qualitative assessment of species’ population trends. If the population trend of a species is unknown, the objective is set as “assess and maintain”, and a monitoring objective is given. For any species listed under the Species at Risk Act (SARA) or under provincial/territorial endangered species legislation, Bird Conservation Strategies defer to population objectives in available Recovery Strategies and Management Plans. The ultimate measure of conservation success will be the extent to which population objectives have been reached over the next 40 years. Population objectives do not currently factor in feasibility of achievement, but are held as a standard against which to measure progress.
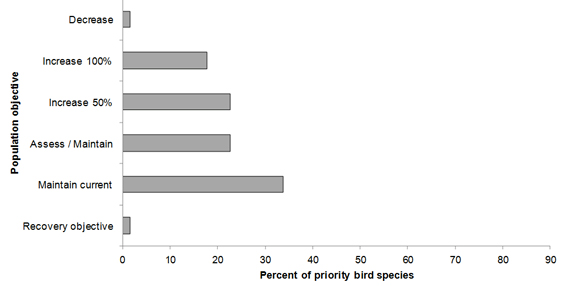
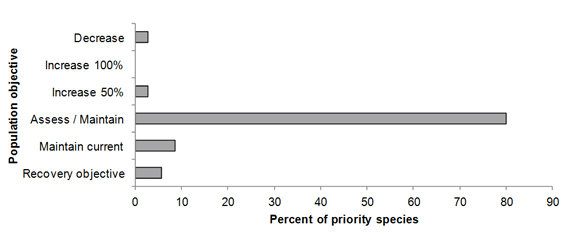
In BCR 14 NS, the population objective for 21 priority bird species (34%) is to maintain current population levels (Fig. 7). However, 26 species (42%) of priority birds have population objectives to increase current levels either by 100%, 50% or to a specific population target from the recovery documents of species at risk. There are 14 priority species (23%) for which the population trend information was insufficient to set a specific population objective; these species were given the objective as assess and maintain. In MBU 11 NS and MBU 12 NS, most priority bird species have a population objective of assess and maintain (80% or 37 species in MBU 11 NS and 80% or 28 species in MBU 12 NS; Figures 8 and 9, respectively).
Figure 7: Percent of priority bird species associated with each population objective category in BCR 14 NS.
Long description for Figure 7
A horizontal bar graph indicating the percent of priority species (x axis) that are associated with each population objective (y axis; decrease, increase 100%, increase 50%, assess/maintain, maintain current, recovery objective) in BCR 14 NS Atlantic Region.
| Population Objective | Percent |
|---|---|
| Decrease | 1.61 |
| Increase 100% | 17.74 |
| Increase 50% | 22.58 |
| Assess / Maintain | 22.58 |
| Maintain current | 33.87 |
| Recovery objective | 1.61 |
Figure 8: Percent of priority bird species associated with each population objective category in MBU 11 NS.

Long description for Figure 8
A horizontal bar graph indicating the percent of priority species (x axis) that are associated with each population objective (y axis; decrease, increase 100%, increase 50%, assess/maintain, maintain current, recovery objective) in MBU 11 NS Atlantic Region.
| Population Objective | Percent |
|---|---|
| Decrease | 2.17 |
| Increase 100% | 0 |
| Increase 50% | 2.17 |
| Assess / Maintain | 80.43 |
| Maintain current | 8.7 |
| Recovery objective | 6.52 |
Figure 9: Percent of priority bird species associated with each population objective category in MBU 12 NS.
Long description for Figure 9
A horizontal bar graph indicating the percent of priority species (x axis) that are associated with each population objective (y axis; decrease, increase 100%, increase 50%, assess/maintain, maintain current, recovery objective) in MBU 12 NS Atlantic Region.
| Population Objective | Percent |
|---|---|
| Decrease | 2.86 |
| Increase 100% | 0 |
| Increase 50% | 2.86 |
| Assess / Maintain | 80 |
| Maintain current | 8.57 |
| Recovery objective | 5.71 |
Element 4: Threat Assessment for Priority Species
The threats assessment process identifies threats believed to have a population-level effect on individual priority species. These threats are assigned a relative magnitude (Low, Medium, High), based on their scope (the proportion of the species’ range within the subregion that is impacted) and severity (the relative impact on the priority species’ population). This allows us to target conservation actions towards threats with the greatest effects on suites of species or in broad habitat classes. Some well-known conservation issues (such as predation by domestic cats or climate change) may not be identified in the literature as significant threats to populations of an individual priority species and therefore may not be captured in the threat assessment. However, they merit attention in conservation strategies because of the large numbers of individual birds affected in many regions of Canada. We have incorporated them in a separate section on Widespread Issues in the full strategy, but unlike other threats, they are not ranked.
In BCR 14 NS, MBU 11 NS and MBU 12 NS, a threat category was added to allow for the inclusion of inadequate monitoring or research information in the threats classification scheme (category 12 “other direct threats” and sub-category 12.1 “information lacking”). However, this threat category was not ranked.
Some threats are not unique to a particular planning unit or habitat type (for example, fragmentation or loss of habitat to urban development) while others are unique to a particular habitat (for example, loss of rooftops for nesting is a specific threat in urban habitats). Threats are categorized following Salafsky et al. (2008); when their rankings are rolled up for each habitat class (Table 4), the overall magnitude of threats is highest in the deciduous and mixed forests of BCR 14 NS and the intertidal coast of MBU 11 NS. Most other habitat classes have an overall threat magnitude of medium except for the shrub and early successional, the herbaceous and the inland waterbodies habitats of BCR 14 NS, which have a threat magnitude of low (Table 4).
In BCR 14 NS, the highest ranked threats to priority species were related to logging and wood harvesting in all three forest types and in forested wetlands (5. Biological resource use); agricultural practices such as early haying (2. Agriculture and aquaculture); pesticide, fungicide and insecticide uses by the forestry industry (or drifting from the agriculture industry) in deciduous and mixed forests (9. Pollution; Table 4). The most frequently identified threats were decreases in diet quality, in the health of birds, or in prey availability due to the contamination of food sources from biocides such as pesticides, herbicides or fungicides used by the forestry and agricultural industries (9.3 Agricultural and forestry effluents; Fig. 10). These threats were found in all habitat classes except urban areas in BCR 14 NS.
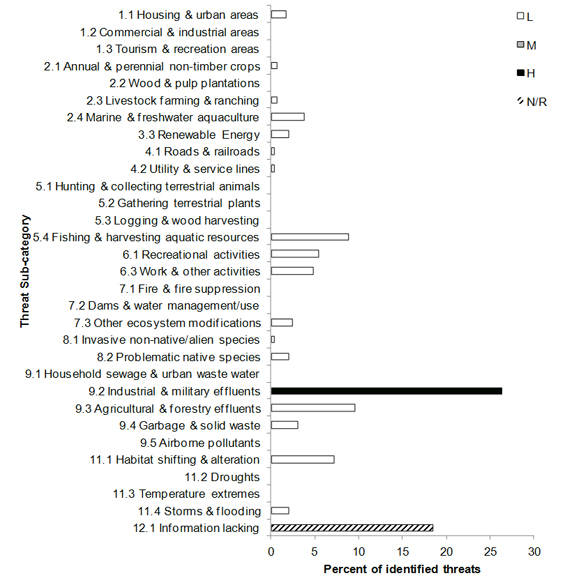
In MBU 11 NS, the highest ranked threats to priority species were related to disturbances at foraging or nest sites from recreational activities in the intertidal coast (6. Human intrusion and disturbance) and oil spills and discharges in both the marine waters and the intertidal coast (9. Pollution; Table 4). Threats associated with 9.2 Industrial and military effluents were the most frequently identified and highest ranked threats in both MBU 11 NS and MBU 12 NS. Examples of these types of threats include decreased prey availability due to chemical or heavy metal contamination, oil spills and discharges, and hypothermia caused by oil on plumage (Figures 11 and 12). Lack of information was the second most-frequently identified threat in MBU 11 NS (Fig. 11) and in MBU 12 NS (Fig. 12). The remainder of threats identified for priority birds in MBU 11 NS and MBU 12 NS were ranked as low and are not discussed further.
Threats to priority species while they are outside Canada during the non-breeding season were also assessed and are presented in the Threats Outside Canada section of the full strategy.
Figure 10: Percent of identified threats to priority bird species within BCR 14 NS by threat sub-category.
Each bar represents the percent of the total number of threats identified in each threat sub-category in BCR 14 NS (for example, if 100 threats were identified in total for all priority species in BCR 14 NS, and 10 of those threats were in the category 1.1 Housing and urban areas, the bar on the graph would represent this as 10%). Shading in the bars (high, medium and low) represents the rolled-up magnitude of all threats in each threat subcategory in the BCR. N/R are unranked threats due to lack of information (12.1).
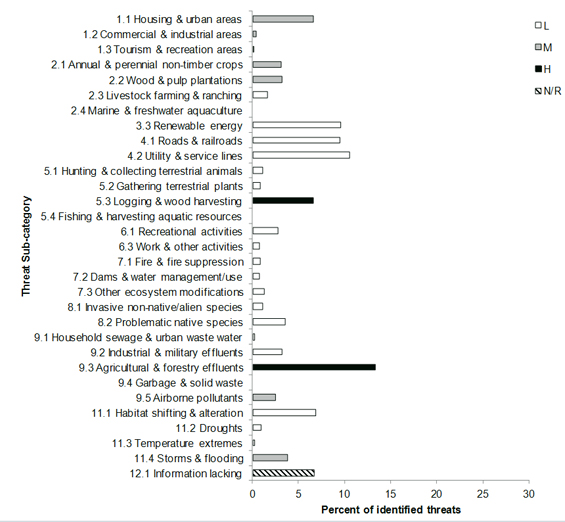
Long description for Figure 10
A horizontal bar graph indicating the percent of identified threats to priority species (x axis) within BCR 14 NS Atlantic Region by threat subcategory (y axis; Recreational Activities, Droughts, etc.).
Each bar represents the percent of the total number of threats identified in each sub-threat category in BCR 14 NS (for example, if 100 threats were identified in total for all priority species in BCR 14 NS, and 10 of those threats were in the category 1.1 “Housing and urban areas”, the bar on the graph would represent this as 10%). Shading in the bars (VH = very high, H = high, M = medium and L = low) represents the rolled-up magnitude of all threats in each threat subcategory in the BCR.
| Threat Sub-category | L | M | H | VH |
|---|---|---|---|---|
| 1.1 Housing and urban areas | 6.61 | |||
| 1.2 Commercial and industrial areas | 0.36 | |||
| 1.3 Tourism and recreation areas | 0.12 | |||
| 2.1 Annual and perennial non-timber crops | 3.07 | |||
| 2.2 Wood and pulp plantations | 3.18 | |||
| 2.3 Livestock farming and ranching | 1.65 | |||
| 2.4 Marine and freshwater aquaculture | ||||
| 3.3 Renewable energy | 9.55 | |||
| 4.1 Roads and railroads | 9.43 | |||
| 4.2 Utility and service lines | 10.5 | |||
| 5.1 Hunting and collecting terrestrial animals | 1.06 | |||
| 5.2 Gathering terrestrial plants | 0.83 | |||
| 5.3 Logging and wood harvesting | 6.6 | |||
| 5.4 Fishing and harvesting aquatic resources | ||||
| 6.1 Recreational activities | 2.71 | |||
| 6.3 Work and other activities | 0.71 | |||
| 7.1 Fire and fire suppression | 0.83 | |||
| 7.2 Dams and water management/use | 0.71 | |||
| 7.3 Other ecosystem modifications | 1.3 | |||
| 8.1 Invasive non-native/alien species | 1.06 | |||
| 8.2 Problematic native species | 3.54 | |||
| 9.1 Household sewage and urban waste water | 0.24 | |||
| 9.2 Industrial and military effluents | 3.18 | |||
| 9.3 Agricultural and forestry effluents | 13.3 | |||
| 9.4 Garbage and solid waste | ||||
| 9.5 Airborne pollutants | 2.48 | |||
| 11.1 Habitat shifting and alteration | 6.85 | |||
| 11.2 Droughts | 0.95 | |||
| 11.3 Temperature extremes | 0.24 | |||
| 11.4 Storms and flooding | 3.77 | |||
| 12.1 Information lacking | 6.72 |
Figure 11: Percent of identified threats to priority bird species within MBU 11 NS by threat sub-category.
Each bar represents the percent of the total number of threats identified in each threat sub-category in MBU 11 NS (for example, if 100 threats were identified in total for all priority species in MBU 11 NS, and 10 of those threats were in the category 1.1 Housing and urban areas, the bar on the graph would represent this as 10%). Shading in the bars (high, medium and low) represents the rolled-up magnitude of all threats in each threat subcategory in the BCR. N/R are unranked threats due to lack of information (12.1).

Long description for Figure 11
A horizontal bar graph indicating the percent of identified threats to priority species (x axis) within MBU 11 NS Atlantic Region by threat subcategory (y axis; Recreational Activities, Droughts, etc.).
Each bar represents the percent of the total number of threats identified in each sub-threat category in MBU 11 NS (for example, if 100 threats were identified in total for all priority species in MBU 11 NS, and 10 of those threats were in the category 1.1 “Housing and urban areas”, the bar on the graph would represent this as 10%). Shading in the bars (VH = very high, H = high, M = medium and L = low) represents the rolled-up magnitude of all threats in each threat subcategory in the MBU.
| Threat Sub-category | L | M | H | VH |
|---|---|---|---|---|
| 1.1 Housing and urban areas | 1.34 | |||
| 1.2 Commercial and industrial areas | 0.27 | |||
| 1.3 Tourism and recreation areas | ||||
| 2.1 Annual and perennial non-timber crops | 0.53 | |||
| 2.2 Wood and pulp plantations | ||||
| 2.3 Livestock farming and ranching | 0.53 | |||
| 2.4 Marine and freshwater aquaculture | 3.21 | |||
| 3.3 Renewable energy | 1.6 | |||
| 4.1 Roads and railroads | 0.27 | |||
| 4.2 Utility and service lines | 0.27 | |||
| 5.1 Hunting and collecting terrestrial animals | 0.27 | |||
| 5.2 Gathering terrestrial plants | ||||
| 5.3 Logging and wood harvesting | ||||
| 5.4 Fishing and harvesting aquatic resources | 11.8 | |||
| 6.1 Recreational activities | 5.34 | |||
| 6.3 Work and other activities | ||||
| 7.1 Fire and fire suppression | ||||
| 7.2 Dams and water management/use | ||||
| 7.3 Other ecosystem modifications | 1.87 | |||
| 8.1 Invasive non-native/alien species | 0.27 | |||
| 8.2 Problematic native species | 1.88 | |||
| 9.1 Household sewage and urban waste water | ||||
| 9.2 Industrial and military effluents | 25.7 | |||
| 9.3 Agricultural and forestry effluents | 7.75 | |||
| 9.4 Garbage and solid waste | 4.01 | |||
| 9.5 Airborne pollutants | ||||
| 11.1 Habitat shifting and alteration | 8.29 | |||
| 11.2 Droughts | ||||
| 11.3 Temperature extremes | ||||
| 11.4 Storms and flooding | 2.14 | |||
| 12.1 Information lacking | 19 |
Figure 12: Percent of identified threats to priority bird species within MBU 12 NS by threat sub-category.
Each bar represents the percent of the total number of threats identified in each threat sub-category in MBU 12 NS (for example, if 100 threats were identified in total for all priority species in MBU 12 NS, and 10 of those threats were in the category 1.1 Housing and urban areas, the bar on the graph would represent this as 10%). Shading in the bars (high, medium and low) represents the rolled-up magnitude of all threats in each threat subcategory in the BCR. N/R are unranked threats due to lack of information (12.1).
Long description for Figure 12
A horizontal bar graph indicating the percent of identified threats to priority species (x axis) within MBU 11 NS Atlantic Region by threat subcategory (y axis; Recreational Activities, Droughts, etc.).
Each bar represents the percent of the total number of threats identified in each sub-threat category in MBU 11 NS (for example, if 100 threats were identified in total for all priority species in MBU 11 NS, and 10 of those threats were in the category 1.1 “Housing and urban areas”, the bar on the graph would represent this as 10%). Shading in the bars (VH = very high, H = high, M = medium and L = low) represents the rolled-up magnitude of all threats in each threat subcategory in the MBU.
| Threat Sub-category | L | M | H | VH |
|---|---|---|---|---|
| 1.1 Housing and urban areas | 1.71 | |||
| 1.2 Commercial and industrial areas | ||||
| 1.3 Tourism and recreation areas | ||||
| 2.1 Annual and perennial non-timber crops | 0.68 | |||
| 2.2 Wood and pulp plantations | ||||
| 2.3 Livestock farming and ranching | 0.68 | |||
| 2.4 Marine and freshwater aquaculture | 3.76 | |||
| 3.3 Renewable energy | 2.05 | |||
| 4.1 Roads and railroads | 0.34 | |||
| 4.2 Utility and service lines | 0.34 | |||
| 5.1 Hunting and collecting terrestrial animals | ||||
| 5.2 Gathering terrestrial plants | ||||
| 5.3 Logging and wood harvesting | ||||
| 5.4 Fishing and harvesting aquatic resources | 8.87 | |||
| 6.1 Recreational activities | 5.46 | 5.34 | ||
| 6.3 Work and other activities | 4.78 | |||
| 7.1 Fire and fire suppression | ||||
| 7.2 Dams and water management/use | ||||
| 7.3 Other ecosystem modifications | 2.39 | |||
| 8.1 Invasive non-native/alien species | 0.34 | |||
| 8.2 Problematic native species | 2.05 | |||
| 9.1 Household sewage and urban waste water | ||||
| 9.2 Industrial and military effluents | 26.3 | |||
| 9.3 Agricultural and forestry effluents | 9.55 | |||
| 9.4 Garbage and solid waste | 3.07 | |||
| 9.5 Airborne pollutants | ||||
| 11.1 Habitat shifting and alteration | 7.17 | |||
| 11.2 Droughts | ||||
| 11.3 Temperature extremes | ||||
| 11.4 Storms and flooding | 2.05 | |||
| 12.1 Information lacking | 18.4 |
Table 4: Relative magnitude of identified threats to priority species within BCR 14 NS, MBU 11 NS and MBU 12 NS by threat category and broad habitat class. Table 4 is presented here in 3 parts.
Overall ranks were generated through a roll-up procedure described in (Kennedy et al. 2012). L represents Low Magnitude threats; M = Medium; H = High. Blank cells indicate that no priority bird species had threats identified in the threat category/habitat combination.
| Threat Category | Coniferous | Deciduous | Mixed | Shrub/ Early Success- ional |
Herbaceous | Cultivated and Managed Areas | Urban | Wetlands | Inland Water- bodies |
Coastal - Above High Tide | Riparian | Widespread | Overall |
|---|---|---|---|---|---|---|---|---|---|---|---|---|---|
| Overall | M | H | H | L | L | M | M | M | L | M | M | M | |
| 1. Residential and commercial development | L | L | L | L | L | L | H | M | L | M | M | L | M |
| 2. Agriculture and aquaculture | M | M | M | L | H | M | L | L | M | ||||
| 3. Energy production and mining | L | L | L | L | L | L | |||||||
| 4. Transportation and service corridors | M | L | L | L | L | L | L | L | L | L | |||
| 5. Biological resource use | H | H | H | L | H | L | L | M | H | ||||
| 6. Human intrusions and disturbance | L | L | L | L | M | L | L | ||||||
| 7. Natural system modifications | L | L | L | L | L | L | M | L | L | ||||
| 8. Invasive and other problematic species and genes | L | L | L | L | L | L | L | L | L | M | L | L | |
| 9. Pollution | M | H | H | L | L | M | M | M | M | M | M | H | |
| 11. Climate change and severe weather | H | - |
| Threat Category | Marine Waters | Coastal - Intertidal | Widespread | Overall |
|---|---|---|---|---|
| Overall | M | H | L | |
| 1. Residential and commercial development | L | L | L | |
| 2. Agriculture and aquaculture | M | L | L | |
| 3. Energy production and mining | L | L | L | |
| 4. Transportation and service corridors | L | L | ||
| 5. Biological resource use | M | L | L | |
| 6. Human intrusions and disturbance | L | H | M | |
| 7. Natural system modifications | M | L | ||
| 8. Invasive and other problematic species and genes | L | M | L | |
| 9. Pollution | H | H | H | |
| 11. Climate change and severe weather | M |
Threat Category |
Marine Waters | Coastal - Intertidal | Widespread | Overall |
|---|---|---|---|---|
| Overall | M | M | L | |
| 1. Residential and commercial development | L | L | ||
| 2. Agriculture and aquaculture | M | L | L | |
| 3. Energy production and mining | L | L | L | |
| 4. Transportation and service corridors | L | L | ||
| 5. Biological resource use | M | L | L | |
| 6. Human intrusions and disturbance | L | M | L | |
| 7. Natural system modifications | M | L | ||
| 8. Invasive and other problematic species and genes | L | M | L | L |
| 9. Pollution | H | H | H | |
| 11. Climate change and severe weather | M |
Element 5: Conservation objectives
Conservation objectives were designed to address threats and information gaps that were identified for priority species. They describe the environmental conditions and research and monitoring that are thought to be necessary for progress towards population objectives and to understand underlying conservation issues for priority bird species. As conservation objectives are reached, they will collectively contribute to achieving population objectives. Whenever possible, conservation objectives were developed to benefit multiple species, and/or respond to more than one threat.
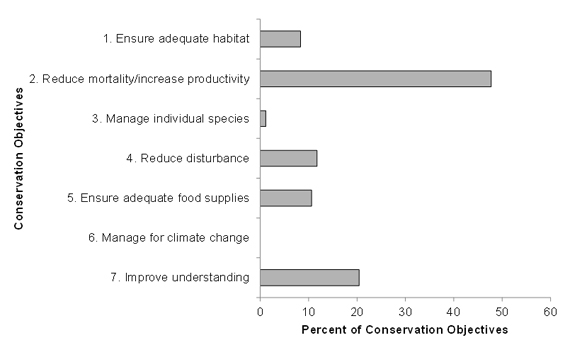
In BCR 14 NS, the most frequently identified conservation objective is to ensure adequate habitat availability for priority bird species (Fig. 13) while in MBU 11 NS and in MBU 12 NS, the most frequently identified conservation objective is to reduce mortality (Figures 14 and 15). While the conservation objective category includes both reducing mortality and increasing productivity, most priority bird species do not breed within the MBU, and therefore most of the recommended actions that follow address only the reduction of mortality. Due to our general lack of understanding of factors affecting priority bird species in the marine environment, the conservation objective to improve our understanding of priority bird species appears more frequently for MBUs than for the terrestrial portion of the BCR (Figures 13, 14, 15).
Figure 13: Percent of all conservation objectives assigned to each conservation objective category in BCR 14 NS.
Note: Conservation objectives related to climate change are discussed in Section 3 of the full strategy.
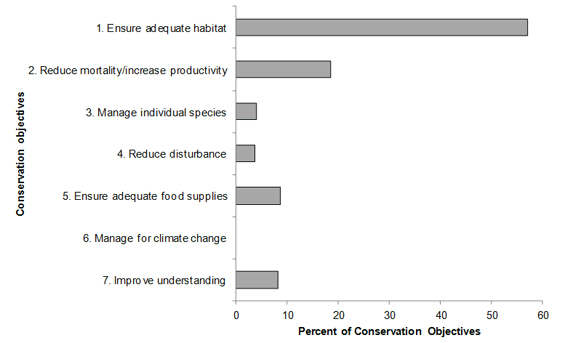
Long description for Figure 13
A horizontal bar graph indicating the percent of all conservation objectives (x axis) assigned to each conservation objective category (y axis; ensure adequate habitat, reduce disturbance, etc.) in BCR 14 NS Atlantic Region.
| Conservation objective | Percent |
|---|---|
| 1. Ensure adequate habitat | 56.98 |
| 2. Reduce mortality/increase productivity | 18.56 |
| 3. Manage individual species | 4.03 |
| 4. Reduce disturbance | 3.60 |
| 5. Ensure adequate food supplies | 8.63 |
| 6. Manage for climate change | 0.00 |
| 7. Improve understanding | 8.20 |
Figure 14: Percent of all conservation objectives assigned to each conservation objective category in MBU 11 NS.
Note: Conservation objectives related to climate change are discussed in Section 3 of the full strategy.
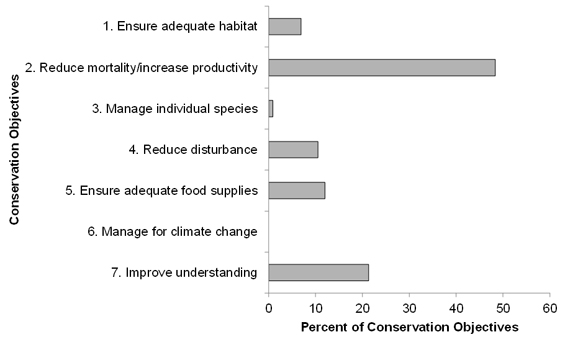
Long description for Figure 14
A horizontal bar graph indicating the percent of all conservation objectives (x axis) assigned to each conservation objective category (y axis; ensure adequate habitat, reduce disturbance, etc.) in MBU 11 NS Atlantic Region.
| Conservation Objective | Percent |
|---|---|
| 1. Ensure adequate habitat | 6.91 |
| 2. Reduce mortality/increase productivity | 48.35 |
| 3. Manage individual species | 0.9 |
| 4. Reduce disturbance | 10.51 |
| 5. Ensure adequate food supplies | 12.01 |
| 6. Manage for climate change | 0 |
| 7. Improve understanding | 21.32 |
Figure 15: Percent of all conservation objectives assigned to each conservation objective category in MBU 12 NS.
Note: Conservation objectives related to climate change are discussed in Section 3 of the full strategy.
Long description for Figure 15
A horizontal bar graph indicating the percent of all conservation objectives (x axis) assigned to each conservation objective category (y axis; ensure adequate habitat, reduce disturbance, etc.) in MBU 12 NS Atlantic Region.
| Conservation objective | Percent |
|---|---|
| 1. Ensure adequate habitat | 8.33 |
| 2. Reduce mortality/increase productivity | 47.73 |
| 3. Manage individual species | 1.14 |
| 4. Reduce disturbance | 11.74 |
| 5. Ensure adequate food supplies | 10.61 |
| 6. Manage for climate change | 0 |
| 7. Improve understanding | 20.45 |
Element 6: Recommended actions
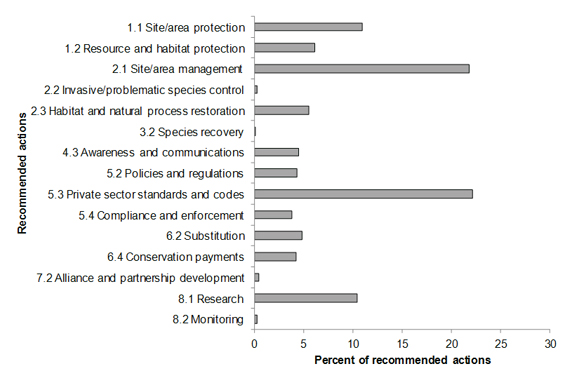
Recommended actions indicate on-the-ground activities that will help to achieve the conservation objectives (listed in Figures 16, 17 and 18). Actions are strategic rather than highly detailed and prescriptive. Whenever possible, recommended actions benefit multiple species and/or respond to more than one threat. Recommended actions defer to or support those provided in recovery documents for species at risk at the federal, provincial or territorial level, but will usually be more general than those developed for individual species.
Recommended conservation actions follow the categories outlined in Salafsky et al. 2008. In BCR 14 NS, the most frequently recommended conservation actions fall under 2.1 Site/area management and 5.3 Private sector standards and codes (Fig. 16). Examples of recommended conservation actions under 2.1 Site/area management include specific recommendations to maintain patch sizes, the configuration and connectivity of different types of forests; to reduce fragmentation of habitats within wetlands to reduce the extent of edges; to maintain large trees in forests, to define and provide minimum number, size and condition of residual snags and living trees for priority bird species. Examples of recommended conservation actions under 5.3 Private sector standards and codes include the development and implementation of guidelines for the protection of priority bird species and development of beneficial management practices for peat harvesting, renewable energy development, forestry and agriculture.
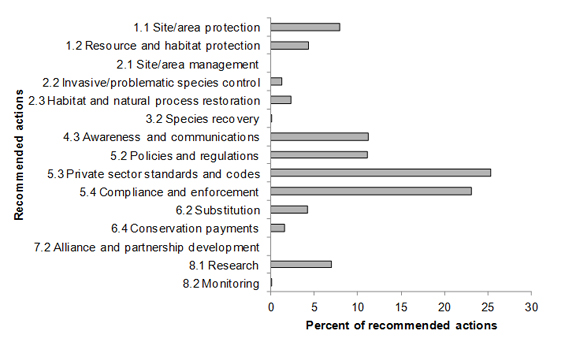
In MBU 11 NS and MBU 12 NS, the most frequently recommended conservation actions fall in the law and policy category (5.3 Private sector standards and codes; 5.4 Compliance and enforcement; and 5.2 Policies and regulations; Figures 17 and 18, respectively). Examples of recommended conservation actions under 5.3 Private sector standards and codes that are specific to MBUs include the implementation of beneficial management practices for aquaculture, fisheries and other coastal resource harvesting industries; the development of beneficial management practices and avoidance guidelines to manage renewable energy developments and minimize habitat degradation. Examples of recommended conservation actions under 5.4 Compliance and enforcement include continuing to monitor and enforce compliance with laws, policies and regulations to minimize seabird bycatch or those related to the release of oil and other wastes into marine waters. Examples of recommended conservation actions under 5.2 Policies and regulations include management of recreational activities to minimize disturbances to priority bird species; management of coastal development to limit habitat degradation and development of policies, regulations and beneficial management practices that minimize seabird bycatch, such as the modification of fishing gear.
Actions related to 4.3 Awareness and communications are also frequently recommended for both MBU 11 NB and MBU 12 NB (Figures 17 and 18). Examples of recommended conservation actions related to awareness and communications include raising public awareness of shorebird habitat needs and the impacts of disturbance from recreational activities in coastal habitats; of human disturbance at seabird colonies or in other nesting areas; and of the impact on shorebirds and seabirds when riprap is installed in coastal areas.
Figure 16: Percent of recommended actions assigned to each sub-category in BCR 14 NS.
Research” and “monitoring” refers to specific species where additional information is required. For a discussion of broad-scale research and monitoring requirements, see Research and Population Monitoring Needs in Section 3 of the full strategy.
Long description for Figure 16
A horizontal bar graph indicating the percent of recommended action (x axis) assigned to each sub-category of recommended actions (y axis; Site/area protection, Species recovery, etc.) in BCR 14 NS Atlantic Region.
| Conservation action | Percent |
|---|---|
| 1.1 Site/area protection | 10.97 |
| 1.2 Resource and habitat protection | 6.17 |
| 2.1 Site/area management | 21.81 |
| 2.2 Invasive/problematic species control | 0.31 |
| 2.3 Habitat and natural process restoration | 5.55 |
| 3.2 Species recovery | 0.04 |
| 4.3 Awareness and communications | 4.54 |
| 5.2 Policies and regulations | 4.32 |
| 5.3 Private sector standards and codes | 22.16 |
| 5.4 Compliance and enforcement | 3.83 |
| 6.2 Substitution | 4.89 |
| 6.4 Conservation payments | 4.27 |
| 7.2 Alliance and partnership development | 0.44 |
| 8.1 Research | 10.44 |
| 8.2 Monitoring | 0.26 |
Figure 17: Percent of recommended actions assigned to each sub-category in MBU 11 NS.
“Research” refers to specific species where additional information is required. For a discussion of broad-scale research and monitoring requirements, see Research and Population Monitoring Needs in Section 3 of the full strategy.
Long description for Figure 17
A horizontal bar graph indicating the percent of recommended action (x axis) assigned to each sub-category of recommended actions (y axis; Site/area protection, Species recovery, etc.) in MBU 11 NS Atlantic Region.
| Conservation Action | Percent |
|---|---|
| 1.1 Site/area protection | 7.91 |
| 1.2 Resource and habitat protection | 4.39 |
| 2.1 Site/area management | 0 |
| 2.2 Invasive/problematic species control | 1.32 |
| 2.3 Habitat and natural process restoration | 2.34 |
| 3.2 Species recovery | 0.15 |
| 4.3 Awareness and communications | 11.27 |
| 5.2 Policies and regulations | 11.13 |
| 5.3 Private sector standards and codes | 25.33 |
| 5.4 Compliance and enforcement | 23.13 |
| 6.2 Substitution | 4.25 |
| 6.4 Conservation payments | 1.61 |
| 7.2 Alliance and partnership development | 0 |
| 8.1 Research | 7.03 |
| 8.2 Monitoring | 0.15 |
Figure 18: Percent of recommended actions assigned to each sub-category in MBU 12 NS.
Research” and “monitoring” refers to specific species where additional information is required. For a discussion of broad-scale research and monitoring requirements, see Research and Population Monitoring Needs in Section 3 of the full strategy.

Long description for Figure 18
A horizontal bar graph indicating the percent of recommended action (x axis) assigned to each sub-category of recommended actions (y axis; Site/area protection, Species recovery, etc.) in MBU 12 NS Atlantic Region.
| Conservation Action | Percent |
|---|---|
| 1.1 Site/area protection | 6.07 |
| 1.2 Resource and habitat protection | 5.36 |
| 2.1 Site/area management | 0 |
| 2.2 Invasive/problematic species control | 1.25 |
| 2.3 Habitat and natural process restoration | 2.86 |
| 3.2 Species recovery | 0 |
| 4.3 Awareness and communications | 11.96 |
| 5.2 Policies and regulations | 10.18 |
| 5.3 Private sector standards and codes | 25.36 |
| 5.4 Compliance and enforcement | 22.32 |
| 6.2 Substitution | 5 |
| 6.4 Conservation payments | 1.96 |
| 7.2 Alliance and partnership development | 0 |
| 8.1 Research | 7.68 |
| 8.2 Monitoring | 0 |
References
Aboriginal Affairs and Northern Development Canada. Aboriginal and Treaty Rights Information System (ATRIS). Accessed Jan 23 2013.
Andres, B.A. 2009. Analysis of Shorebird Population Trend Datasets. Unpublished document for the North American Bird Conservation Initiative, U.S. Committee. 2009. State of the Birds. U.S. Department of Interior, Washington, D.C., 36 pp.
Andres, B.A., P.A. Smith, C.L. Gratto-Trevor and R.I.G. Morrison. 2012. Population estimates of North American shorebirds, 2012. Unpublished.
Benoît, H.P., J.A. Gagné, C. Savenkoff, P. Ouellet and M.N. Bourassa. 2012. State-of-the-Ocean Report for the Gulf of St.Lawrence Integrated Management (GOSLIM) Area. Can. Manuscr. Rep. Fish. Aquat. Sci. 2986: xi + 73 pp.
Berneshawi, S. 1997. Resource Management and the Mi'kmaq Nation. Can. J. Native Studies, 17(1): 115-148.
Canadian Council on Ecological Areas. 2011. Conservation Areas Reporting and Tracking System.
Canadian Biodiversity Website (Redpath Museum, McGill University). 2012. Atlantic Maritime Ecozone. Accessed: October 2012.
COSEWIC. 2012. Committee on the Status of Endangered Wildlife in Canada. Accessed: April 2012.
Dettmers, R. 2006. A Blueprint for the Design and Delivery of Bird Conservation in the Atlantic Northern Forest. US Fish and Wildlife Service. Vers. 1.0. Accessed: October 2012.
Donaldson, G. M., C. Hyslop, R. I. G. Morrison, H. L. Dickson and I. Davidson (editors). 2000. Canadian Shorebird Conservation Plan. Canadian Wildlife Service, Environment and Climate Change Canada, Ottawa, Ontario. 27pp.
Environment and Climate Change Canada. 2013. Province-Territory Weather Winners. Accessed: March 2013.
Fisheries and Oceans Canada. 2010. Canadian Marine Ecosystem Status and Trends Report. Vers. revised. Science Advisory Report. October 2010. Accessed June 2012.
Food and Agriculture Organization (FAO). 2000. Land cover classification system. United Nations Food and Agriculture Organization, Rome.
Gulf of Maine Council on the Marine Environment. 2010. State of the Gulf of Maine. Accessed: June 2012.
Kennedy, J.A., E.A. Krebs and A.F. Camfield. 2012. A Manual for Completing All-bird Conservation Plans in Canada, April 2012 version. Canadian Wildlife Service, Environment and Climate Change Canada. Ottawa, ON
McMillan, A.D. 1995. Native Peoples and Cultures of Canada: An Anthropological Overview. Vancouver, Toronto: Douglas and McIntyre, 2nd Edition.
Milko, R., L. Dickson, R. Elliot and G. Donaldson. 2003. Wings Over Water: Canada’s Waterbird Conservation Plan. Canadian Wildlife Service, Environment and Climate Change Canada, Ottawa, Ontario. 28pp.
Natural Resources Canada. 2010. The Atlas of Canada - Coastline and Shoreline. Accessed: June 2012.
North American Waterfowl Management Plan, Plan Committee. 2004. North American Waterfowl Management Plan 2004. Implementation Framework: Strengthening the Biological Foundation. Canadian Wildlife Service, U.S. Fish and Wildlife Service, Secretaria de Medio Ambiente y Recursos Naturales, 106pp.
Nova Scotia Eastern Habitat Joint Venture. 2008. Eastern Habitat Joint Venture Five Year (2007-2012) Plan for the Implementation of the North American Waterfowl Management Plan in Nova Scotia. North American Waterfowl Management Plan.
Nova Scotia Government. 2012a. Our Wild Spaces: Protected Areas: 12 Percent. (PDF ; 188 MB) April 2012. Accessed: August 2012.
Nova Scotia Government. 2007a. Species at Risk List. Accessed: June 2012.
Rich, T.D., C.J. Beardmore, H. Berlanga, P.J. Blancher, M.S.W. Bradstreet, G.S. Butcher, D.W. Demarest, E.H. Dunn, W.C. Hunter, E.E. Iñigo-Elias, J.A. Kennedy, A.M. Martell, A.O. Panjabi, D.N. Pashley, K.V. Rosenberg, C.M. Rustay, J.S. Wendt and T.C. Will. 2004. Partners in Flight North American Landbird Conservation Plan. Cornell Lab of Ornithology. Ithaca, NY. 85 pp. + appendices.
Salafsky, N., D. Salzer, A. J. Stattersfield, C. Hilton-Taylor, R. Neugarten, S. H. M. Butchart, B. Collen, N. Cox, L. L. Master, S. O’Connor and D. Wilkie. 2008. A standard lexicon for biodiversity conservation: Unified classifications of threats and actions. Conservation Biology 22(4):897-911.
Species at Risk Public Registry. Accessed 4 April 2012. Schedule 1: List of Wildlife Species at Risk.
Stewart, R.L.M., K.A. Bredin, A.R. Couturier, A.G. Horn, D. Lepage, S. Makepeace, P. Taylor, R.M. Whittam and P.D. Taylor (Editors). In preparation. The Second Atlas of Breeding Birds of the Maritime Provinces. Expected to be published in 2013 by Bird Studies Canada and Environment and Climate Change Canada.
Therriault, J.C. 1991. The Gulf of St.Lawrence: small ocean or big estuary? Can. Spec. Publ. Fish. Aquat. Sci. 113: 359pp.
Vasarhelyi, C. and D.A. Kirk. 2007. Scan of Atlantic Canada Provincial Policies, Regulations and Land Use Planning for Resource Industries that May Impact Incidental Take. Unpublished Report prepared by Aquila Applied Ecologists for Canadian Wildlife Service, Atlantic Region.