
Bird conservation strategy for region 14 in Prince Edward Island and select marine units
- Abridged version -
June 2013

The abridged version of the strategy available here contains a summary of the results, but does not include an analysis of conservation needs by habitat, a discussion of widespread conservation issues, or the identification of research and monitoring needs.
Other formats available for this document:
Table of contents
- Preface
- Acknowledgements
- Bird Conservation Strategy for Bird Conservation Region 14 in Prince Edward Island and Marine Biogeographic Unit 12: Atlantic Northern Forest and Gulf of St. Lawrence
- Executive summary
- Introduction: Bird Conservation Strategies
- Section 1: Summary of results - All Birds, All Habitats
- References
Preface
Environment and Climate Change Canada led the development of all-bird conservation strategies in each of Canada's Bird Conservation Regions (BCRs) by drafting new strategies and integrating new and existing strategies into an all-bird framework. These integrated all-bird conservation strategies will serve as a basis for implementing bird conservation across Canada, and will also guide Canadian support for conservation work in other countries important to Canada's migrant birds. Input to the strategies from Environment and Climate Change Canada's conservation partners is as essential as their collaboration in implementing their recommendations.
Environment and Climate Change Canada has developed national standards for strategies to ensure consistency of approach across BCRs. Bird Conservation Strategies will provide the context from which specific implementation plans can be developed for each BCR, building on the programs currently in place through Joint Ventures or other partnerships. Landowners including Aboriginal peoples will be consulted prior to implementation.
Conservation objectives and recommended actions from the conservation strategies will be used as the biological basis to develop guidelines and beneficial management practices that support compliance with regulations under the Migratory Birds Convention Act, 1994.
Acknowledgements
This document follows templates developed by Alaine Camfield, Judith Kennedy and Elsie Krebs with the help of the BCR planners in each of the Canadian Wildlife Service regions throughout Canada. However, work of this scope cannot be accomplished without the contribution of many colleagues who provided or validated technical information, commented on earlier draft versions of the strategy, and supported the planning process. We would like to extend a sincere thank-you to Doug Bliss, Andrew Boyne, Paul Chamberland, Kevin Davidson, Carina Gjerdrum, Alan Hanson, Christie MacDonald, Bryan Martin, Keith McAloney, Bruce Pollard, Martin Raillard, Isabelle Robichaud, Dane Stuckel, Kyle Wellband, Becky Whittam, and other reviewers.
Bird Conservation Strategy for Bird Conservation Region 14 in Prince Edward Island and Marine Biogeographic Unit 12: Atlantic Northern Forest and Gulf of St. Lawrence
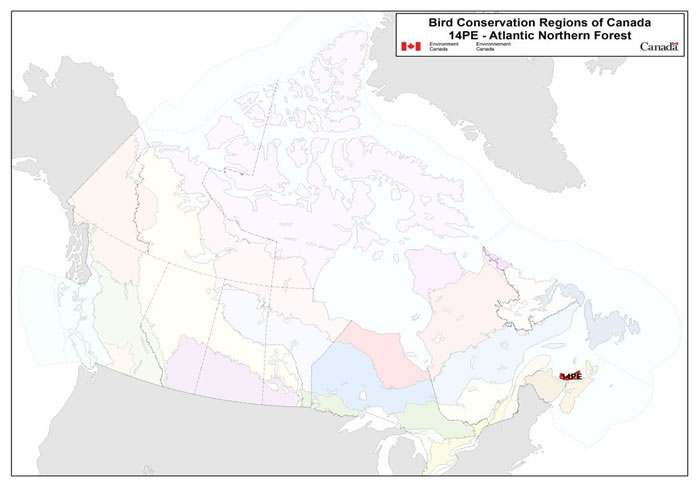
Long description for the BCR 14 Prince Edward Island (PEI) map.
Map of the Bird Conservation Regions (BCR's) of Canada with BCR 14 PEI, Atlantic Region: Atlantic Northern Forest highlighted. Canada (with Alaska, Greenland and the northern portion of the United States of America also appearing) is shown very washed out, as it is only present to provide context for the location of the highlighted BCR 14 PEI. The washed out Canadian map is divided by BCR (12 Canadian BCRs in total), showing differently, and their exact locations and sizes are indistinguishable, aside from BCR 14 PEI.
The highlighted BCR 14 PEI encompasses all of Prince Edward Island and its surrounding waters.
The following legend appears in the top right corner of the map: “Bird Conservation Regions of Canada. 14 PE - Atlantic Northern Forest” and includes the Environment and Climate Change Canada logo, and the Government of Canada logo.
Long description for the MBU map.
Map of the Marine Biogeographical Units of eastern Canada. The map's extent includes the western shore of Hudson Bay to Newfoundland's offshore areas. M10, M11 and M12 are highlighted differently, while the adjoining borders of M8, M9 and M13 are visible. M10 covers most of the waters off Labrador and Newfoundland, M11 covers the waters off Nova Scotia, and M12 covers the Gulf of St Lawrence. North is indicated with an arrow in the upper right corner of the map. There is a small map of Canada inset lower left, with the highlighted area appearing. Below the map there is a scale that indicates 1, 125, 250, 500, 750 and 1000 km. The projection is Lambert Conformal Conic (CSRS).
Executive summary
Prince Edward Island is dominated by a low-lying landscape that is only slightly above sea level in the west, is hilly in the central region and has gently rolling hills in the east. Almost half of the area is cultivated, while most of the other half is dominated by mixed temperate forests. The vast majority of the land (90%) is privately owned.
The Island is famous for its agriculture (potatoes, soybeans and blueberries are the main crops), and as a tourist destination. It is relatively densely populated with few areas remaining untouched by human disturbance. Aquaculture is increasingly important along the coastline.
Within the terrestrial portion of Bird Conservation Region 14 on Prince Edward Island (BCR 14 PEI), there are 52 priority bird species. Wetlands are used by the greatest number of priority bird species (46%), while mixed wood forests are used by 33%, coniferous forests by 27% and deciduous forests by 17%. An additional 33% of priority species use cultivated areas.
No threats to priority birds of Prince Edward Island have been ranked as very high, and most are ranked medium or low. The most frequently identified threats on land in Prince Edward Island are related to agricultural and forestry practices: early haying, extensive use of pesticides, fungicides and insecticides. Other threats identified are related to tourism and recreational activities, such as cottage development along the shorelines and intensive use of beaches, but these threats are not thought to limit populations.
Given the importance of the agricultural industry and the extent of land used for agriculture on Prince Edward Island, key conservation actions for priority birds address issues related to this industry. For example, recommended conservation actions include: increasing awareness of the impacts of agricultural practices on priority bird species, developing beneficial management practices and encouraging bird-friendly practices through economic and other incentives.
Agricultural lands have displaced old-growth forests on Prince Edward Island. While it is important to focus on conservation actions relating to the agricultural industry, which dominates the landscape, key conservation actions for forestry-related activities focus on protecting areas of existing old-growth and late-successional forest habitat, and developing beneficial management practices and guidelines to limit degradation of habitat features that are important to priority birds.
Prince Edward Island has 1100 km of coastline deeply indented by marine estuaries along the Gulf of St. Lawrence and the Northumberland Strait. The shoreline generally alternates between headlands of steep sandstone bluffs and extensive sandy beaches. Coastal habitats are treated in both the terrestrial and marine components of this strategy.
The threats most often identified for priority bird species in the coastal habitats of both marine planning units and the terrestrial planning unit include: disturbance due to recreational and commercial activities (ATVs, dogs off-leash, beach access to aquaculture leases, disturbances to roost and nesting sites), habitat loss from residential developments (cottages and shoreline armouring), mortality from ocean oil-spill events, and contamination from agricultural runoff.
Recommended actions to address threats to priority species in coastal habitat include managing recreational activities to minimize disturbance of birds, and securing and managing key coastal habitat through the creation of protected areas, private land acquisitions, conservation easements, community conservation plans and stewardship agreements. Pesticides and other biocides should be used for agriculture only when necessary and should be replaced by alternative products to minimize exposure of birds to potentially toxic chemicals. It is also important to raise public awareness about shorebirds and their habitat needs as well as the impacts of disturbance in coastal areas. Management of coastal off-bottom oyster aquaculture activities to minimize disturbance to priority birds is also recommended.
The Gulf of St. Lawrence marine unit (Marine Biogeographic Unit 12 Prince Edward Island - MBU 12 PEI) surrounding Prince Edward Island is part of one of the largest and most productive estuaries in Canada. It is highly influenced by humans, as it is downstream to some of the largest urban and industrial centres and emitters of industrial and agricultural contaminants. This area is significantly warmer and shallower than the rest of the Gulf of St. Lawrence, although in winter this portion of the Gulf is predominantly ice-covered.
Thirty priority bird species were identified in MBU 12 PEI. The most frequently identified and highest ranked threats to the 16 priority bird species that use the marine waters of Prince Edward Island are: mortality of birds due to oil spills and discharge from shipping activities; decreases in prey availability due to oil spills and discharge, and other heavy metal contamination; and the decrease in diet quality and health of priority birds due to heavy metal contamination of their food sources. In addition, these birds must compete with aquaculture operations for access to foraging areas.
Key recommended actions in marine habitats focus on managing the aquaculture industry to minimize the degradation and loss of priority habitat for aquatic species. Recommended actions include monitoring and enforcing compliance with laws, policies and regulations regarding the release of oil, oily waste and garbage into the ocean, and developing beneficial management practices and avoidance guidelines to manage shipping activities and minimize the occurrence and potential impacts of accidental oil discharges on priority birds.
This conservation strategy builds on existing bird conservation strategies and complements those created for the other Bird Conservation Regions across Canada. Collectively, the strategies will serve as a framework for implementing bird conservation nationally, and also identify international conservation issues for Canada's priority birds. Strategies are not highly prescriptive, but rather are intended to guide future implementation efforts undertaken by various partners and stakeholders. More specifically, information presented in this document is based on an extensive and systematic literature review, which in turn was reviewed by key regional experts on bird conservation. Planning and implementing conservation actions for priority birds on Prince Edward Island will necessitate further discussion and work in order to prioritize the recommended actions with key partners.
Introduction: Bird Conservation Strategies
Context
This document is one of a suite of Bird Conservation Region Strategies (BCRstrategies) that have been drafted by Environment and Climate Change Canada for all regions of Canada. These strategies respond to Environment and Climate Change Canada's need for integrated and clearly articulated bird conservation priorities to support the implementation of Canada's migratory birds program, both domestically and internationally. This suite of strategies builds on existing conservation plans for the four “bird groups” (waterfowlFootnote 1, waterbirdsFootnote 2, shorebirdsFootnote 3, and landbirdsFootnote 4) in most regions of Canada, as well as on national and continental plans, and includes birds under provincial/territorial jurisdiction. These new strategies also establish standard conservation planning methods across Canada, and fill gaps, as previous regional plans do not cover all areas of Canada or all bird groups.
These strategies present a compendium of required actions based on the general philosophy of achieving scientifically based desired population levels as promoted by the four pillar initiatives of bird conservation. Desired population levels are not necessarily the same as minimum viable or sustainable populations, but represent the state of the habitat/landscape at a time prior to recent dramatic population declines in many species from threats known and unknown. The threats identified in these strategies were compiled using currently available scientific information and expert opinion. The corresponding conservation objectives and actions will contribute to stabilizing populations at desired levels.
The BCRstrategies are not highly prescriptive. In most cases, practitioners will need to consult additional information sources at local scales to provide sufficient detail to implement the recommendations of the strategies. Tools such as beneficial management practices will also be helpful in guiding implementation. Partners interested in participating in the implementation of these strategies, such as those involved in the habitat Joint Ventures established under the North American Waterfowl Management Plan (NAWMP), are familiar with the type of detailed implementation planning required to coordinate and undertake on-the-ground activities.
Strategy structure
This strategy includes two distinct planning units, the Bird Conservation Region 14 in Prince Edward Island (BCR 14 PEI) as well as the Marine Biogeographic Unit 12 around Prince Edward Island (MBU 12 PEI). Both units have their own list of priority bird species. Given that MBU 12 PEI has two habitat classes (the waterbodies, snow and ice habitat class, and the coastal habitat class), and to distinguish these from the equivalent habitat classes in BCR 14 PEI, they are renamed marine waters and coastal (intertidal). These habitat classes in BCR 14 PEI are renamed inland waterbodies and coastal (above high tide).
Section 1 of this strategy, published here, presents general information about the BCR, the MBU and the subregion, with an overview of the six elementsFootnote 5 that provide a summary of the state of bird conservation at the sub-regional level. Section 2, included in the full strategy, provides more detail on the threats, objectives and actions for priority species grouped by each of the broad habitat types in the subregion. Section 3, also part of the full strategy, presents additional widespread conservation issues that are not specific to a particular habitat or were not captured by the threat assessment for individual species, as well as research and monitoring needs, and threats to migratory birds while they are outside of Canada. The approach and methodology are summarized in the appendices of the full strategy, but details are available in a separate document (Kennedy et al. 2012). A national database houses all the underlying information summarized in this strategy and is available from Environment and Climate Change Canada.
Characteristics of Bird Conservation Region 14: Atlantic Northern Forest in Prince Edward Island
Bird Conservation Region 14 (Atlantic Northern Forest; BCR 14) encompasses an area greater than 356 000 km2 and includes the Maritime provinces, and Quebec's Gaspé Peninsula and Eastern Townships in Canada, and most of the states of Maine, New Hampshire and Vermont, and parts of New York, Massachusetts and Connecticut in the United States. Most of this BCR is low-mountainous or open hilly country interspersed with valleys and plains, and nearly 85% of it is classified as some type of forest (including regenerating forest) (Dettmers 2006). Geologically, BCR 14 (or the Atlantic Maritime Ecozone) is a mix of sedimentary and igneous bedrock (Canadian Heritage 2012).
The portion of BCR 14 in the province of Prince Edward Island extends over 5656 km2 and differs somewhat from the rest of the Atlantic Northern Forest (Figure 1). The land surface of the Island ranges from nearly sea level in the west to hilly in the central region and to gently rolling hills in the east. The coastal lowlands overlying sedimentary bedrock are far more accessible, have better soils for agriculture and a milder climate than the inhospitable igneous highlands, with acid soils supporting vast forest that are poor for agriculture (Canadian Heritage 2012).
Figure 1. Landcover in BCR 14 PEI: Atlantic Northern Forest (labeled 14PE).
Long description for Figure 1
Map of the landcover in BCR 14 PEI, Atlantic Region: Atlantic Northern Forest. The map's extent includes Prince Edward Island and northern New Brunswick and northern Nova Scotia. The borders of BCR 14NB and 14NS are delineated. BCR 14 PEI appears differently while the others appear. Inset in the upper right corner is a map of Canada with BCR 14 PEI highlighted.
The highlighted BCR 14 PEI encompasses all of Prince Edward Island.
The various habitat types that exist in the BCR are shown on the map differently, which are explained in the following bilingual legend (appearing to the right of the map):
- Coniferous/conifères
- Deciduous/feuillus
- Mixedwood/forêt mixte
- Shrubs and early successional/arbustes et regeneration
- Herbaceous/herbacées
- Cultivated and managed areas/zone cultivées et aménagées
- Lichens and mosses/lichens et mousses
- Wetlands/terres humides
- Alpine/alpin
- Snow and ice/neige et glace
- Bare areas/denude
- Urban/urbain
- Water bodies /plans d'eau
- Riparian/riverain
- Coastal/côtier
The most common habitat types visible at this scale in BCR 14 PEI are cultivated and managed areas throughout, coniferous forests mostly in the east, and deciduous forests. There are two obvious urban areas, and coastal areas surround the whole island.
The remaining text in the legend is the following: Sources: Land Cover Map of Canada 2005 (CCRS, 2008), Land Cover circa 2000 (CTI, 2009), Canvec v 9.0 (CTI, 2011), Atlas of Canada 1,000,000 National Framework Data - Hydrology (CCRS, 2008). Sources: Couverture du sol du Canada 2005 (CCT, 2008), Couverture du sol circa 2000 (CIT, 2009), Canvec v 9.0 (CIT, 2011), Cartographe thématique de base - Utilisation du sol actuelle Version 1 couche spatiale (Yazdani, 1992), Données-cadre nationales de l'Atlas du Canada à l'échelle du 1/1 000 000 - Hydrologie (CCT, 2008). There is also a visual representation of scale for the map in the legend which indicates 0, 15, 30 and 60 kms. The Projection is UTM20 (NAD 1983).
While the maps in this document are drawn at scales and resolutions that differ from the land cover percentages provided, Dettmers (2006) has estimated 15 different land cover types in all of BCR 14 and within each province and state. While these estimates may not be current, they do provide a relative idea of the importance (in terms of size) of a particular habitat type within the BCR 14 PEI.
Unlike the other Maritimes provinces, on Prince Edward Island, agricultural and cultivated lands (2263 km2) share the landscape in equal proportion with northern temperate forests (2322 km2). Mixed deciduous-coniferous forest is the most predominant forest type (1145 km2), followed by northern hardwood forest (722 km2) and spruce-fir conifer forest (455 km2). The bulk of Prince Edward Island's forested habitat (90%) is privately owned. Only 300 km2 of forest are publicly owned (Hutchinson 2012). Shrub and early successional habitat is another predominant habitat type, including regenerating forests (342 km2) and natural shrublands (126 km2). Prince Edward Island also encompasses wetland habitats, including 1107 km of coastline (e.g., emergent saltmarsh, mud flats, sandy beaches, and rocky shoreline, open water areas associated with estuaries and bays), freshwater emergent marshes (85 km2), freshwater forested wetlands (216 km2), and open freshwater lakes, streams and rivers (52 km2) (Dettmers 2006).
Prince Edward Island's climate is typified by large seasonal temperature differences, with warm (and often humid) summers and cold winters. However, the Northumberland Strait running along the south and west coasts and the Gulf of St. Lawrence encompassing the north and east portions of the Island have a moderating impact on the Island's climate.
In BCR 14 PEI there are approximately 345 km2 of urban habitat (Dettmers 2006). The major urban centre on Prince Edward Island is the provincial capital of Charlottetown (58 625 inhabitants in the metropolitan area). Summerside, the next-largest city, has a population of 14 500 inhabitants. Prince Edward Island is the most densely populated province in Canada (23 persons per km2), with an estimated population of 141 232 in 2010 (Statistics Canada 2011a). In spite of its high population density, it is the second-most rural province in the nation (after Nunavut). However, 44.8% of the population is classed as urban. Prince Edward Island is highly praised and valued for its beaches, which attract a large number of users each summer (reported peak of 1.2 million visitors in 1997 by the Prince Edward Island Tourism department) (Prince Edward Island 2012a). Recreational activity on beaches is at its highest during July and August, which overlaps with the incubation and chick rearing period for a number of priority bird species (e.g., Piping Plover (melodus), Common Tern).
In Prince Edward Island, there are fewer but bigger farms in 2011 than there were in 2006: the number of farms and the total farmed area decreased by 12% and 4%, respectively, while the average area per farm increased to 1.6 km2 (Statistics Canada 2011b). Prince Edward Island (and New Brunswick) farmers were the only ones in Canada to report a decrease in gross farm receipts (products sold, program payments and custom work). For Prince Edward Island, there was a 15% decrease from 2005 to 2010, or a loss of $76.5 million (Statistics Canada 2011b).
In 2011, more than 69% of the total farmed area was cropland, and Prince Edward Island continued to report the largest area cultivated for potatoes in Canada with 350 km2 (Statistics Canada 2011b). The agricultural area used for soybeans increased 350% since 2006 to 207 km2, making it one of the major field crops in the province and accounts for 72% of the Maritimes province's total for soybean production in 2011 (Statistics Canada 2011b). The area used for blueberry production also increased 25% between 2006 and 2011 to 50 km2 (Statistics Canada 2011b). Increased prices for cash crops coupled with declining beef cattle (34% decrease) and pig (56% decrease) numbers led to a shift from forage and crops traditionally used for feed to more profitable cash crops (Statistics Canada 2011b). The number of dairy cows increased (0.2%) as well as the sheep flock (104%) since 2006 (Statistics Canada 2011b). According to the Agricultural Census 2011, 3% of Prince Edward Island farms have certified organic (or in transition to become organic) production of field crops, fruits, vegetables and greenhouse products.
Early successional habitat is fairly common and widespread, occurring whenever disturbances such as agricultural clearings have created successional openings within forests. Generally, this habitat type is lost as succession continues and young forests mature. Given the changes in land tenure and agricultural practices, the shrub and early successional habitat in agricultural areas is declining and reverting to forest habitats.
Little is left of the original Acadian (mixedwood) forests of the Island; three centuries of clearing for agriculture and shipbuilding, as well as fire and disease, have radically transformed the forests of Prince Edward Island (MacDonald 2001). A large-scale forest harvesting industry is relatively undeveloped on the Island, mainly because the bulk of forested land is privately owned and managed. The government of Prince Edward Island has made a number of policy and legislative efforts to increase its forestry cover, such as the Agricultural Rehabilitation Development Act (1950s) and the Canada-PEI Forestry Agreements (ended in 1990s), all of which raised the overall forest cover on the Island to nearly 50% (MacDonald 2001). Effort has been made to protect remaining forests on unploughed land, which are important sources of native soils and seeds, and which account for much of the remnant Acadian forest species including American beech (Fagus grandifolia), yellow birch (Betula alleghaniensis), sugar maple (Acer saccharum), eastern hemlock (Tsuga canadensis), white cedar (Thuja occidentalis) and black ash (Fraxinus nigra) (Prince Edward Island 2004; Prince Edward Island Department of Environment, Energy and Forestry 2004). These forest management efforts will positively influence bird populations (Hutchinson 2012).
Since 1800, an estimated 200 000km2, almost 15% of Canada's total wetland base, has been drained or lost. In the Maritimes, 65% of coastal salt marshes have been converted to non-wetland functions (North American Wetlands Conservation Council). Many of Prince Edward Island's salt marshes and coastal wetlands have been lost through drainage, flooding and infilling for urban, industrial or agricultural purposes, and salt marshes continue to be threatened by coastal developments, particularly cottage subdivisions. Three of the Island's largest bogs at Black Banks, Bideford and Miscouche are being mined commercially for peat moss. Additional pressures have been exerted through interest in developing bogs for cranberry (Vaccinium (Oxycoccus) production (Prince Edward Island 2003). As a result of such interests, areas under cranberry production increased 47% since 2006 to 0.45 km2 in 2011 (Statistics Canada 2011b).
Historically, most streams in Prince Edward Island were dammed to serve industry (grist mill, lumber, power, etc.) and over time, many of these mill sites were redeveloped for recreational, cultural, and aesthetic or wildlife enhancement purposes (Prince Edward Island 2012b).
There are two First Nation reserves on Prince Edward Island: Lennox Island and Abegweit. Prince Edward Island is within the traditional Mi'kmaq territory (Aboriginal Affairs and Northern Development 2013). In fact, the traditional Mi'kmaq territory covers much of the BCR 14. At the time prior to European contact, the Mi'kmaq were semi-nomadic and harvested the wildlife available to them: seafood, large and small mammals, fish, seabirds and their eggs. While the current traditions of the Mi'kmaq have changed and evolved over time, much of it through French and British colonization of what is now Canada (McMillan 1995), they hold dear and precious all wildlife and life forms within and beyond their territory (Berneshawi 1997). The Mi'kmaq of Prince Edward Island have been concerned over an apparent loss of their traditions such as waterfowl hunting (Gerald MacDougall, personal observation). As demonstrated by Benoît (2007), the Maritimes Aboriginal harvest for waterfowl has decreased dramatically and is now a peripheral activity.
There are a variety of current and potential threats to the region's avifauna. Many of these threats are related to land uses and, in particular, agricultural activities: early haying; extensive use of pesticides, fungicides and insecticides; and mainly the extensive transformation of the landscape to cultivated and managed lands. In addition to these threats, tourism and recreational activities have significant effects on the coastal habitats of priority birds of BCR 14 PEI and of MBU 12 PEI. Threats related to tourism and recreational activities include the increase of visitors attracted to the Island for its beaches and the summer cottage development along the shorelines, coupled with coastal erosion that leads to further degradation of the shorelines as a result of armouring to protect roads and dwellings.
Prince Edward Island has nearly 3% of its land area designated as protected areas (Canadian Council on Ecological Areas 2011; Figure 2). Environment and Climate Change Canada manages one Migratory Bird Sanctuary, Black Pond (1.3 km2), which protects fall staging habitat for waterfowl. Parks Canada Agency manages the Prince Edward Island National Park (18 km2). However, the bulk (in both numbers and total surface area) of the protected areas, 97 km2 (terrestrial) and 15 km2 (marine), are provincially managed. The ability of governments to establish protected areas is limited by the amount and location of Crown land. On Prince Edward Island, nearly 92% of the land base is privately owned. In addition to government-protected areas, there are a number of environmental non-governmental organizations engaged in the securement and management of conservation lands, such as:
- Ducks Unlimited Canada, with 55 km2 of waterfowl habitat either owned or with restrictive covenants;
- Island Nature Trust, with 12 km2; and
- Nature Conservancy Canada owns six properties, totalling 1.8 km2.
In addition, designations that recognize ecological uniqueness have elevated public awareness and promoted the conservation of ecologically significant habitats such as:
- The Malpeque Bay (and Provincial Wildlife Management Area), which is recognized as a Ramsar site under the Ramsar Convention on Wetlands of International Importance: 244 km2; and
- Two Important Bird Areas: Malpeque Bay (570 km2) and Prince Edward Island National Park (114 km2).
Figure 2. Map of protected and designated areas in BCR 14 PEI (14PE).
Long description for Figure 2
Map of protected and other designated areas in BCR 14 PEI, Atlantic Region: Atlantic Northern Forest. The map's extent includes Prince Edward Island and northern New Brunswick and northern Nova Scotia. The borders of BCR 14NB and 14NS are delineated. BCR 14 PEI appears differently and the others appear too. Inset in the upper right corner is a map of Canada with BCR 14 PEI highlighted.
The highlighted BCR 14 PEI encompasses all of Prince Edward Island.
The various types of protected areas that exist in the BCR are shown on the map differently, which are explained in the following bilingual legend (appearing to the right of the map):
Protected areas/Aires protégées
- Agriculture and Agri-Food Canada/Agriculture et Agroalimentaire Canada
- Fisheries and Oceans Canada/Pêches et Océans Canada
- Environment and Climate Change Canada/Environnement et Changement climatique Canada
- Parks Canada/Parcs Canada
- Aboriginal Affairs and Northern Development Canada/Affaires autochtones et Développement du Nord Canada
- Provincial/Provincial
Other designated areas/Autres aires designees
- Important Bird Areas/ Aires d'importance pour les oiseaux
- Ramsar/Ramsar
The most common type of protected area shown is provincial, appearing as a patchwork throughout the whole BCR, with the highest concentrations in the east. There is a linear section of the north coast that is a series of National Parks and Important bird areas.
There is also a visual representation of scale for the map in the legend which indicates 0, 15, 30 and 60 kms. The Projection is UTM 20 (NAD 1983).
Characteristics of Marine Biogeographic Unit 12: Gulf of St.Lawrence of Prince Edward Island
The Estuary and Gulf of Saint Lawrence (corresponding to M12 in Figure 3) represent one of the largest and most productive estuarine/marine ecosystems in Canada, and in the world (total area of approximately 247 000 km2) (Therriault 1991). With a drainage basin that includes the Great Lakes, the St. Lawrence marine ecosystem receives more than half of the freshwater inputs from the Atlantic Coast of North America. This ecosystem is also strongly influenced by ocean and climate variability in the North Atlantic, of both Arctic (Labrador Current) and tropical (Gulf Stream) origin. As a result, this area exhibits large spatial and temporal variations in environmental conditions and oceanographic processes (Benoît et al. 2012). This unique setting provides the conditions for a highly diverse and productive biological community and trophic structure (Benoît et al. 2012).
Figure 3. Map of MBU 12 (M12) and its marine protected and designated areas.
Long description for Figure 3
Map of the protected and designated areas in the Marine Biogeographical Units of eastern Canada. The map's extent includes the eastern shore of Quebec, Newfoundland, New Brunswick, Nova Scotia, Prince Edward Island and also Maine in the US. The borders of M12 covers the Gulf of St Lawrence.
A small map of Canada is inset in the upper left corner, and highglighted is a large portion of Atlantic Canada, namely the maritimes and eastern Quebec, and their waters.
The various types of protected areas that exist in the MBU are shown on the map differently, which are explained in the following bilingual legend (appearing to the right of the map):
Protected areas/Aires protégées
- Agriculture and Agri-Food Canada/Agriculture et Agroalimentaire Canada
- Fisheries and Oceans Canada/Pêches et Océans Canada
- Environment and Climate Change Canada/Environnement et Changement climatique Canada
- Parks Canada/Parcs Canada
- Aboriginal Affairs and Northern Development Canada/Affaires autochtones et Développement du Nord Canada
- Provincial/Provincial
Other designated areas/Autres aires designees
- Important Bird Areas/ Aires d'importance pour les oiseaux
- Ramsar/Ramsar
The most common type of protected/designated area visible at this scale in MBU 12 are important bird areas, which occur fairly frequently in small patches along the coasts. Though outside the M12 area, and therefore not the focus of this map, there is a large Fisheries and Oceans protected area off Nova Scotia. There are several provincial protected areas in PEI and Nova Scotia.
North is indicated with an arrow in the upper right corner of the map. The legend includes a scale that indicates 0, 150, 300 and 600 km. The projection is Lambert Conformal Conic (CSRS).
MBU 12 is situated downstream of some of the largest urban and industrial centres, areas of pronounced development on the continent and emitters of industrial and agricultural-based contaminants (Benoît et al. 2012). The massive influx of fresh water, especially during springtime and summer wet seasons, lowers salinity levels in the Gulf and Estuary. Increasing commercial, ecotouristic and recreational navigation are vectors for the propagation of aquatic invasive species (Benoît et al. 2012). Shoreline development and associated nutrient and sediment loading as well as a large and expanding shellfish aquaculture industry have transformed large portions of the coast, the estuarine and lagoon waters into farms (Benoît et al.2012). Benoît et al. (2012) reviewed evidence that suggested important aspects of the food-web in MBU 12 changed in the early 1990s. Also, increasing average sea-surface temperature and hypoxia, partly as a result of climate change and coastal zone deterioration related to anthropogenic pressures (e.g., coastal eutrophication), may be causing physiological stress in marine organisms (Benoît et al. 2012).
The Prince Edward Island portion of MBU 12 encompasses an area of approximately 21 400 km2 (Figure 3). This system is strongly influenced by ocean and climate variability. While colder, low saline Arctic waters (Labrador Current) enter the Gulf from the north and east, prevailing west and southwest winds moderate the influence of ocean on climate. This moderated influence in conjunction with shallower waters surrounding Prince Edward Island can lead to significantly warmer ocean temperatures. In winter, this portion of the Gulf is predominantly ice-covered. MBU 12 PEI exhibits complex coastlines, which are the result of glacial processes and include extensive sand beaches, exposed bedrock, but are largely lacking in cliffs. These features are interspersed with large estuaries hosting salt marshes and wetlands of varying size and influence. Spatial and temporal variation in environmental conditions and oceanographic processes result in diverse and productive biological communities and trophic structure. The high productivity in estuaries and lagoons has attracted and continues to attract shellfish aquaculture industries in Prince Edward Island.
There are a variety of present and potential threats to the region's avifauna. Current threats in MBU 12 PEI include oil pollution from shipping and other boat traffic, drifting of agricultural effluents in the marine waters, and competition for foraging and roosting areas with the aquaculture industry in many of Prince Edward Island's estuaries. As a whole, these likely encompass the most important anthropogenic threats to avian survival in the Gulf of St. Lawrence surrounding Prince Edward Island.
There are few protected areas in MBU 12 PEI (Figure 3). The Department of Fisheries and Oceans established the Basin Head Marine Protected Area in 2005 (9 km2) because of its unique biodiversity, including a unique form of Irish Moss (Fisheries and Oceans Canada 2008). It is a shallow coastal lagoon, approximately 5 km long, located on the eastern tip of Prince Edward Island. This is the only federally protected area in MBU 12 PEI (Canadian Council on Ecological Areas 2011). The Province of Prince Edward Island manages a 15 km2 marine area, which it protects under several legislative tools (Canadian Council on Ecological Areas 2011).
Section 1: Summary of results - All Birds, All Habitats
Element 1: Priority species assessment
These Bird Conservation Strategies identify “priority species” from all regularly occurring bird species in each BCR subregion. Species that are vulnerable due to population size, distribution, population trend, abundance and threats are included because of their “conservation concern”. Some widely distributed and abundant “stewardship” species are also included. Stewardship species are included because they typify the national or regional avifauna and/or because they have a large proportion of their range and/or continental population in the subregion; many of these species have some conservation concern, while others may not require specific conservation effort at this time. Species of management concern are also included as priority species when they are at (or above) their desired population objectives but require ongoing management because of their socio-economic importance as game species or because of their impacts on other species or habitats.
The purpose of the prioritization exercise is to focus implementation efforts on the issues of greatest significance for Canadian avifauna. Table 1 provides a full list of all priority species in BCR 14 PEI and MBU 12 PEI and their reason for inclusion. Tables 2 and 3 summarize the number of priority species by bird group and by the reason for priority status.
In BCR 14 PEI, there are 52 priority species, most of which are landbirds (31 species). The list also includes shorebirds (9 species), waterbirds (6 species) and waterfowl (6 species; Table 2). However, 35% of all shorebirds and 32% of waterbirds found in BCR 14 in PEI are priority species, compared to only 26% of waterfowl and 26% of landbirds (Table 2). Fourteen percent (14%) of the priority species are formally protected under the federal Species at Risk Act (SARA; Species at Risk Public Registry 2012), most of which are landbirds (Table 3). The most frequent reasons for considering landbirds as priority species for BCR 14 PEI are because of regional concerns or stewardship, whereas the reasons for considering shorebirds or waterbirds as priority species are almost always because of national or continental concerns (Table 3). The main reason for this difference is due to a lack of information at the regional level for many of the shorebirds and waterbirds. Waterfowl are included as priority species when designated as a “key waterfowl species” in the PEI Eastern Habitat Joint Venture (EHJV) Implementation Plan (2008), or when ranked “high” or “highest” in terms of conservation/monitoring needs under the North American Waterfowl Management Plan (NAWMP Plan Committee 2004; Table 3).
In MBU 12 PEI, there are 30 priority species. The list includes 13 species of shorebirds, 7 species of waterbirds and 10 species of waterfowl. However, 50% of all shorebirds found in MBU 12 PEI are priority species compared to 18% of waterbirds and 33% of waterfowl. There are 4 priority species that are protected under the federal SARA (Species at Risk Public Registry 2012), 2 shorebirds, one waterbird and 1 waterfowl (Table 3). As in BCR 14 PEI, the most frequent reason for considering shorebirds and waterbirds as priority species in MBU 12 PEI is because of national or continental concerns, whereas waterfowl were primarily added to the list of priority species when designated as a “key waterfowl species” in the PEI-EHJV Implementation Plan (2008), or when ranked “high” or “highest” in terms of conservation/monitoring needs under the NAWMP (Table 3).
Table 1. Priority bird species in BCR 14 PEI and MBU 12 PEI, population objective, and the reason for their priority status. Accessible Version of Table 1.
Table 2. Summary of priority bird species, by bird group, in BCR 14 PEI and MBU 12 PEI. The table is presented here in two parts.
| Bird Group | Total Species | Total Priority Species | Percent Priority | Percent of Priority List |
|---|---|---|---|---|
| Landbird | 119 | 31 | 26% | 60% |
| Shorebird | 26 | 9 | 35% | 17% |
| Waterbird | 19 | 6 | 32% | 11% |
| Waterfowl | 23 | 6 | 26% | 11% |
| Total BCR 14 PEI | 187 | 52 | - | 100% |
| Bird Group | Total Species | Total Priority Species | Percent Priority | Percent of Priority List |
|---|---|---|---|---|
| Landbird | 4 | 0 | 0% | 0% |
| Shorebird | 26 | 13 | 50% | 45% |
| Waterbird | 40 | 7 | 18% | 23% |
| Waterfowl | 30 | 10 | 33% | 33% |
| Total MBU 12 PEI | 100 | 30 | - | 100% |
Table 3. Number of priority species in BCR 14 PEI and in MBU 12 PEI by reason for priority status. The table is presented here in two parts.
| Reason for Priority Listinga | Landbird | Shorebird | Waterbird | Waterfowl |
|---|---|---|---|---|
| COSEWICb | 7 | 1 | 0 | 1 |
| Federal SARA listedc | 5 | 1 | 0 | 1 |
| NAWMPd | - | - | - | 5 |
| National/Continental Concern | 5 | 14 | 5 | - |
| National/Continental Stewardship | 2 | 0 | 0 | - |
| Regional/Subregional Concern | 15 | 0 | 3 | 0 |
| Regional/Subregional Stewardship | 11 | 0 | 0 | 0 |
a A single species can be on the priority list for more than one reason. Note that not all reasons for inclusion apply to every bird group (indicated by “-”).
b COSEWIC indicates species assessed by the Committee on the Status of Endangered Wildlife in Canada as Endangered, Threatened, or Special Concern (COSEWIC 2012).
c Species listed on Schedule 1 of the Species at Risk Act as Endangered; Threatened; or Special Concern (Species at Risk Public Registry 2012).
d Insérez note c du tableau 1 ici.
| Reason for Priority Listinge | Landbird | Shorebird | Waterbird | Waterfowl |
|---|---|---|---|---|
| COSEWICf | - | 2 | 1 | 1 |
| Federal SARA listedg | - | 2 | 1 | 1 |
| NAWMPh | - | - | - | 7 |
| National/Continental Concern | - | 13 | 5 | 1 |
| National/Continental Stewardship | - | 0 | 0 | - |
| Regional/Subregional Concern | - | 4 | 2 | 2 |
| Regional/Subregional Stewardship | - | 0 | 0 | 0 |
e A single species can be on the priority list for more than one reason. Note that not all reasons for inclusion apply to every bird group (indicated by “-”).
f COSEWIC indicates species assessed by the Committee on the Status of Endangered Wildlife in Canada as Endangered, Threatened, or Special Concern (COSEWIC2012).
g Species listed on Schedule 1 of the Species at Risk Act as Endangered; Threatened; or Special Concern (Species at Risk Public Registry 2012).
h Insérez note c du tableau 1 ici.
Element 2: Habitats important to priority species
Identifying the broad habitat requirements for each priority species within the BCR and the MBU allowed species to be grouped by shared habitat-based conservation issues and actions for details on how species were assigned to standard habitat categories). If many priority species associated with the same habitat face similar conservation issues, then conservation action in that habitat may support populations of several priority species. BCRstrategies use a modified version of the standard land cover classes developed by the United Nations (Food and Agriculture Organization 2000) to categorize habitats, and species were often assigned to more than one habitat class.
The assignment of habitat associations to priority bird species was primarily done through a literature review and expert consultations. For each priority species in BCR 14 PEI and MBU 12 PEI, all habitat associations were included in the database. Because of the variability and the availability of information related to species-habitat associations, quantifying relative importance (i.e., preference) of any given habitat was not possible. In this document, statements regarding the importance of habitat to priority bird species are related to the number of priority birds associated with that habitat and may not reflect that habitat's overall importance to all bird species in the planning unit. For more quantitative and qualitative field-based information on habitat associations of all breeding birds species in Prince Edward Island, please consult the Second Maritimes Breeding Bird Atlas (Stewart et al., in prep.)
Wetlands are used by the greatest number of priority bird species (24 species or 46%; Fig. 4). Of the 3 forest types, there are more priority bird species that use mixed wood forests (17 species or 33%) than either coniferous (14 species or 27%) or deciduous forests (9 species or 17%; Figure 4). Seventeen (17) species use cultivated and managed areas (33%) and coastal (above high tide) habitat (33%). Urban habitat is used by only 4 species (8%; Figure 4).
Figure 4. Percent of priority bird species that are associated with each habitat type in BCR 14 PEI.
Note: The total exceeds 100% because each species may be assigned to more than one habitat.
Long description for Figure 4
A horizontal bar graph indicating the percent of priority species (x axis) that are associated with each habitat type (y axis, coniferous, deciduous, mixed wood, shrub/early successional, herbaceous, cultivated and managed areas, urban, wetlands, inland waterbodies, coastal (above high tide), riparian) in BCR 14 PEI, Atlantic region. Note: The total exceeds 100% because each species may be assigned to more than one habitat.
| Habitat class | Percent of Priority Species |
|---|---|
| Coniferous | 26.92 |
| Deciduous | 17.31 |
| Mixed Wood | 32.69 |
| Shrub/Early Successional | 21.15 |
| Herbaceous | 13.46 |
| Cultivated and Managed Areas | 32.69 |
| Urban | 7.69 |
| Wetlands | 46.15 |
| Inland Waterbodies | 23.08 |
| Coastal (Above high tide) | 32.69 |
| Riparian | 19.23 |
For MBU 12 PEI, only 2 habitats were considered. Coastal habitats (intertidal) are used by 23 (77%) priority bird species and 16 (53%) priority bird species use marine waters (nearshore waters and continental shelf; Figure 5).
Figure 5. Percent of priority bird species that are associated with each habitat type in MBU 12 PEI.
Note: The total exceeds 100% because each species may be assigned to more than one habitat.
Long description for Figure 5
A horizontal bar graph indicating the percent of priority species (x axis) that are associated with each habitat type (y axis, marine waters and coastal) in MBU 12. Note: The total exceeds 100% because each species may be assigned to more than one habitat.
| Habitat | Percent priority species |
|---|---|
| Marine Waters | 53.33 |
| Coastal (intertidal) | 76.67 |
Element 3: Population objectives
Population objectives allow us to measure and evaluate conservation success. The objectives in this strategy are assigned to categories and are based on a quantitative or qualitative assessment of species' population trends. If the population trend of a species is unknown, the objective is set as “assess and maintain”, and a monitoring objective is given. For any species listed under the Species at Risk Act (SARA) or under provincial/territorial endangered species legislation, Bird Conservation Strategies defer to population objectives in available Recovery Strategies and Management Plans. The ultimate measure of conservation success will be the extent to which population objectives have been reached over the next 40 years. Population objectives do not currently factor in feasibility of achievement, but are held as a standard against which to measure progress.
In BCR 14 PEI, 20 priority bird species (38%) have a population objective of assess/maintain, which means there is not enough data to reliably assess a trend. However, for those species for which there is enough data to reliably assess a trend, 20 species have an objective of increase by 50% or 100% or are species at risk with a specific recovery objective (Figure 6). The remaining 11 priority bird species (21%) have a population objective to maintain current levels, and the temperate breeding Canada Goose is the only priority species of management concern and should be decreased (Figure 6). As a result, there are no threats, conservation objectives or actions listed for the North Atlantic population of Canada Goose.
There are 4 population objectives for priority bird species identified for MBU12 PEI (Figure 7). For the majority (25 species, 83%) we do not have enough data to reliably assess a trend and the population objective was set as assess/maintain (Figure 7). While 3 species (10%) have a population objective of maintain current; 1 species (Piping plover) has a specific recovery objective in a recovery strategy (see Table 1) and for 1 species (Green-winged Teal, see Table 1), the objective is to increase by 50% (Figure 7).
Figure 6. Percent of priority bird species that are associated with each population objective category in BCR 14 PEI.
Long description for Figure 6
A horizontal bar graph indicating the percent of priority species (x axis) that are associated with each population objective (y axis; increase 100%, increase 50%, assess/maintain, maintain current, recovery objective, decrease) in BCR 14 PEI, Atlantic Region.
| Population objective | Percent of priority species |
|---|---|
| Increase 100% | 13.5 |
| Increase 50% | 23.1 |
| Assess / Maintain | 38.5 |
| Maintain current | 21.2 |
| Recovery objective | 1.9 |
| Decrease | 1.9 |
Figure 7. Percent of priority bird species that are associated with each population objective category in MBU 12 PEI.
Long description for Figure 7
A horizontal bar graph indicating the percent of priority species (x axis) that are associated with each population objective (y axis; increase 100%, increase 50%, assess/maintain, maintain current, recovery objective, decrease) in MBU 12.
| Population Objective | Percent of priority species |
|---|---|
| Increase 100% | 0.00 |
| Increase 50% | 3.33 |
| Assess / Maintain | 83.33 |
| Maintain current | 10.00 |
| Recovery objective | 3.33 |
| Decrease | 0.00 |
Element 4: Threat assessment for priority species
The threats assessment process identifies threats believed to have a population-level effect on individual priority species. These threats are assigned a relative magnitude (Low, Medium, High, Very High), based on their scope (the proportion of the species' range within the subregion that is impacted) and severity (the relative impact on the priority species' population). This allows us to target conservation actions towards threats with the greatest effects on suites of species or in broad habitat classes. Some well-known conservation issues (such as predation by domestic cats or climate change) may not be identified in the literature as significant threats to populations of an individual priority species and therefore may not be captured in the threat assessment. However, they merit attention in conservation strategies because of the large numbers of individual birds affected in many regions of Canada. We have incorporated them in a separate section on Widespread Issues in the full strategy, but, unlike other threats, they are not ranked.
For both planning units of Prince Edward Island, there were no threats ranked as very high. The following discussion focuses mainly on the highest ranked threats and notes a few medium and low threats when appropriate. In BCR 14 PEI and MBU 12 PEI, a category was added to allow for the inclusion of inadequate monitoring or research information in the threats classification scheme (category 12 “other direct threats” and sub-category 12.1 “information lacking”). However, this threat category was not ranked due to its incompatibility with the threat assessment method.
Some of the threats identified are not unique to a particular planning unit or a type of habitat (for example, fragmentation or loss of a particular habitat to urban development), while others are unique to a particular habitat (for example, loss of rooftops for nesting is a specific threat in urban habitats). These threats are categorized as per Salafsky et al. (2008). When the ranked threats are rolled up for each habitat class (Table 4), there are only three threat categories ranked high in BCR 14 PEI (Figure 8): 11.4 Storms and flooding (the threats include reductions in survival of adults or chicks, flooding of nests due to heavy rains, and habitat loss due to increased severity or frequency of storms leading to coastal erosion) and 2.0 Agriculture and aquaculture in Cultivated and managed areas (the threats include fragmentation or loss of habitat due to conversion to cropland and destruction of nests due to early haying); and for MBU 12 PEI (Figure 9), 9.0 Pollution in Coastal (intertidal) habitats (the threats include the decrease in diet quality, prey availability and therefore the health of birds due to chemical or heavy metal contamination or to oil spills and discharges and hypothermia caused by oil on plumage).
In BCR 14 PEI, the most frequently identified threats were related to Agricultural and forestry effluents (sub-category 9.3), such as decreases in diet quality and health of birds due to the consumption of contaminated food or the decrease in prey availability due to chemical contamination from biocides (Figure 8).
Inadequate monitoring or research was the second most frequently identified threat for priority bird species in MBU 12 PEI (Figure 9). The most frequent (and, as mentioned above, highest ranked threats) were contamination of prey or decreases in prey availability due to chemical contamination or hypothermia caused by oil on plumage due to oil spills and discharges in coastal (intertidal) habitats (Figure 9 and Table 4).
Threats to priority species while they are outside Canada during the non-breeding season were also assessed and are presented in the section: Threats Outside Canada of the full strategy.
Figure 8. Percent of identified threats to priority bird species within BCR 14 PEI by threat sub-category.
Each bar represents the percent of the total number of threats identified in each threat sub-category in BCR 14 PEI (for example, if 100 threats were identified in total for all priority species in BCR 14 PEI, and 10 of those threats were in the category 1.1 Housing and urban areas, the bar on the graph would represent this as 10%). Shading in the bars (H = high, M= medium, L = low and NR = not ranked) represents the rolled up magnitude of all threats in each threat sub-category in the BCR.
Long description for Figure 8
A horizontal bar graph indicating the percent of identified threats to priority species (x axis) within BCR 14 PEI, Atlantic Region by threat subcategory (y axis; i.e. Recreational Activities, Droughts, etc.)
Each bar represents the percent of the total number of threats identified in each threat sub-category in BCR 14 PEI (for example, if 100 threats were identified in total for all priority species in BCR 14 PEI, and 10 of those threats were in the category 1.1 Housing and urban areas, the bar on the graph would represent this as 10%). Shading in the bars (VH = very high, H = high, M = medium and L = low) represents the rolled up magnitude of all threats in each threat subcategory in the BCR.
| Threat Sub-category | Low | Medium | High | Not Ranked |
|---|---|---|---|---|
| 1.1 Housing and urban areas | 0 | 7.9 | 0 | 0 |
| 1.2 Commercial and industrial areas | 0.3 | 0 | 0 | 0 |
| 1.3 Tourism and recreation areas | 0.2 | 0 | 0 | 0 |
| 2.1 Annual and perennial non-timber crops | 0 | 3.5 | 0 | 0 |
| 2.2 Wood and pulp plantations | 0 | 2.1 | 0 | 0 |
| 2.3 Livestock farming and ranching | 1.8 | 0 | 0 | 0 |
| 2.4 Marine and freshwater aquaculture | 0 | 0 | 0 | 0 |
| 3.3 Renewable Energy | 8.3 | 0 | 0 | 0 |
| 4.1 Roads and railroads | 0 | 8.9 | 0 | 0 |
| 4.2 Utility and service lines | 9.9 | 0 | 0 | 0 |
| 4.3 Shipping lanes | 0 | 0 | 0 | 0 |
| 5.1 Hunting and collecting terrestrial animals | 0.7 | 0 | 0 | 0 |
| 5.2 Gathering terrestrial plants | 1.1 | 0 | 0 | 0 |
| 5.3 Logging and wood harvesting | 0 | 5.3 | 0 | 0 |
| 5.4 Fishing and harvesting aquatic resources | 0 | 0 | 0 | 0 |
| 6.1 Recreational activities | 3.2 | 0 | 0 | 0 |
| 6.3 Work and other activities | 0.6 | 0 | 0 | 0 |
| 7.1 Fire and fire suppression | 1 | 0 | 0 | 0 |
| 7.2 Dams and water management/use | 0.7 | 0 | 0 | 0 |
| 7.3 Other ecosystem modifications | 1.8 | 0 | 0 | 0 |
| 8.1 Invasive non-native/alien species | 0.3 | 0 | 0 | 0 |
| 8.2 Problematic native species | 2.1 | 0 | 0 | 0 |
| 9.1 Household sewage and urban waste water | 0.3 | 0 | 0 | 0 |
| 9.2 Industrial and military effluents | 3.4 | 0 | 0 | 0 |
| 9.3 Agricultural and forestry effluents | 0 | 13.3 | 0 | 0 |
| 9.4 Garbage and solid waste | 0.2 | 0 | 0 | 0 |
| 9.5 Airborne pollutants | 0.9 | 0 | 0 | 0 |
| 11.1 Habitat shifting and alteration | 6.6 | 0 | 0 | 0 |
| 11.2 Droughts | 0 | 1 | 0 | 0 |
| 11.3 Temperature extremes | 0.2 | 0 | 0 | 0 |
| 11.4 Storms and flooding | 0 | 0 | 3.8 | 0 |
| 12.1 Information lacking | 0 | 0 | 0 | 11 |
Figure 9. Percent of identified threats to priority bird species within MBU 12 PEI by threat sub-category.
Each bar represents the percent of the total number of threats identified in each threat sub-category in MBU 12 PEI (for example, if 100 threats were identified in total for all priority species in MBU 12 PEI, and 10 of those threats were in the category 1.1 Housing and urban areas, the bar on the graph would represent this as 10%). Shading in the bars (H = high, M = medium, L = low and NR = not ranked) represents the rolled up magnitude of all threats in each threat sub-category in the BCR.
Long description for Figure 9
A horizontal bar graph indicating the percent of identified threats to priority species (x axis) within MBU12 by threat subcategory (y axis; i.e. Recreational Activities, Droughts, etc.)
Each bar represents the percent of the total number of threats identified in each threat sub-category in MBU 12 (for example, if 100 threats were identified in total for all priority species in MBU 12, and 10 of those threats were in the category 1.1 Housing and urban areas, the bar on the graph would represent this as 10%). Shading in the bars (VH = very high, H = high, M = medium and L = low) represents the rolled up magnitude of all threats in each threat subcategory in the MBU.
| Threat Sub-category | Low | Medium | High | Not Ranked |
|---|---|---|---|---|
| 1.1 Housing and urban areas | 1.26 | 0.00 | 0.00 | 0.00 |
| 1.2 Commercial and industrial areas | 0.00 | 0.00 | 0.00 | 0.00 |
| 1.3 Tourism and recreation areas | 0.00 | 0.00 | 0.00 | 0.00 |
| 2.1 Annual and perennial non-timber crops | 0.84 | 0.00 | 0.00 | 0.00 |
| 2.2 Wood and pulp plantations | 0.00 | 0.00 | 0.00 | 0.00 |
| 2.3 Livestock farming and ranching | 0.84 | 0.00 | 0.00 | 0.00 |
| 2.4 Marine and freshwater aquaculture | 0.00 | 4.20 | 0.00 | 0.00 |
| 3.3 Renewable energy | 1.26 | 0.00 | 0.00 | 0.00 |
| 4.1 Roads and railroads | 0.42 | 0.00 | 0.00 | 0.00 |
| 4.2 Utility and service lines | 0.42 | 0.00 | 0.00 | 0.00 |
| 4.3 Shipping lanes | 0.13 | 0.03 | 0.01 | 0.00 |
| 5.1 Hunting and collecting terrestrial animals | 0.42 | 0.00 | 0.00 | 0.00 |
| 5.2 Gathering terrestrial plants | 0.00 | 0.00 | 0.00 | 0.00 |
| 5.3 Logging and wood harvesting | 0.00 | 0.00 | 0.00 | 0.00 |
| 5.4 Fishing and harvesting aquatic resources | 5.04 | 0.00 | 0.00 | 0.00 |
| 6.1 Recreational activities | 7.14 | 0.00 | 0.00 | 0.00 |
| 6.3 Work and other activities | 5.04 | 0.00 | 0.00 | 0.00 |
| 7.1 Fire and fire suppression | 0.00 | 0.00 | 0.00 | 0.00 |
| 7.2 Dams and water management/use | 0.00 | 0.00 | 0.00 | 0.00 |
| 7.3 Other ecosystem modifications | 2.94 | 0.00 | 0.00 | 0.00 |
| 8.1 Invasive non-native/alien species | 0.00 | 0.00 | 0.00 | 0.00 |
| 8.2 Problematic native species | 1.68 | 0.00 | 0.00 | 0.00 |
| 9.1 Household sewage and urban waste water | 0.00 | 0.00 | 0.00 | 0.00 |
| 9.2 Industrial and military effluents | 0.00 | 26.47 | 0.00 | 0.00 |
| 9.3 Agricultural and forestry effluents | 11.34 | 0.00 | 0.00 | 0.00 |
| 9.4 Garbage and solid waste | 2.10 | 0.00 | 0.00 | 0.00 |
| 9.5 Airborne pollutants | 0.00 | 0.00 | 0.00 | 0.00 |
| 11.1 Habitat shifting and alteration | 7.56 | 0.00 | 0.00 | 0.00 |
| 11.2 Droughts | 0.00 | 0.00 | 0.00 | 0.00 |
| 11.3 Temperature extremes | 0.00 | 0.00 | 0.00 | 0.00 |
| 11.4 Storms and flooding | 0.00 | 1.68 | 0.00 | 0.00 |
| 12.1 Information lacking | 0.00 | 0.00 | 0.00 | 19.33 |
Table 4. Relative magnitude of identified threats to priority species within BCR 14 PEI by threat category and broad habitat class. Accessible Version of Table 4.
Element 5: Conservation objectives
Conservation objectives were designed to address threats and information gaps that were identified for priority species. They describe the environmental conditions and research and monitoring that are thought to be necessary for progress towards population objectives and to understand underlying conservation issues for priority bird species. As conservation objectives are reached, they will collectively contribute to achieving population objectives. Whenever possible, conservation objectives were developed to benefit multiple species, and/or respond to more than one threat.
In BCR 14 PEI, the majority of the conservation objectives fell into the category of ensuring adequate habitat is available for priority bird species (Figure 10), while in MBU 12 PEI, the majority of conservation objectives fell in the category of reducing mortality of priority bird species (Figure 11). While conservation objective category 2 includes objectives to both reduce mortality and increase productivity, most priority bird species in MBU 12 PEI do not breed within the MBU, and therefore most of the recommended objectives and actions address the reduction of mortality in MBU 12 PEI. However, in BCR 14 PEI, either reducing mortality or increasing productivity of priority birds was the second-most frequent conservation objective (Figure 10). Improving our understanding of priority bird species in MBU 12 PEI is the second-most frequent conservation objective category (Figure 11) and the third in BCR 14 PEI (Figure 10); this is consistent with the fact that for the majority of priority bird species of MBU 12 PEI, we do not have enough information on population trends to set specific population objectives (Figure 7), while for most priority birds in BCR 14 PEI, there is more information regarding population trends.
Figure 10. Percent of all conservation objectives assigned to each conservation objective category in BCR 14 PEI.
Conservation objectives related to climate change are discussed in Section 3: Widespread Issues of the full strategy.
Long description for Figure 10
A horizontal bar graph indicating the percent of all conservation objectives (x axis) assigned to each conservation objective category (y axis; i.e. ensure adequate habitat, reduce disturbance, etc.) in BCR 14 PEI, Atlantic Region.
| Conservation Objective | Percent of Conservation Objectives |
|---|---|
| 1 Ensure adequate habitat | 56.0 |
| 2 Reduce mortality/increase productivity | 15.8 |
| 3 Manage individual species | 2.3 |
| 4 Reduce disturbance | 4.4 |
| 5 Ensure adequate food supplies | 7.8 |
| 6 Manage for climate change | 0.0 |
| 7 Improve understanding | 13.5 |
Figure 11. Percent of all conservation objectives assigned to each conservation objective category in MBU 12 PEI.
Conservation objectives related to climate change are discussed in Section 3: Widespread Issues of the full strategy.
Long description for Figure 11
A horizontal bar graph indicating the percent of all conservation objectives (x axis) assigned to each conservation objective category (y axis; i.e. ensure adequate habitat, reduce disturbance, etc.) in MBU 12.
| Conservation Objective | Percent of Conservation Objectives |
|---|---|
| 1 Ensure adequate habitat | 8.4 |
| 2 Reduce mortality/increase productivity | 46.5 |
| 3 Manage individual species | 1.4 |
| 4 Reduce disturbance | 13.5 |
| 5 Ensure adequate food supplies | 8.8 |
| 6 Manage for climate change | 0.0 |
| 7 Improve understanding | 21.4 |
Element 6: Recommended actions
Recommended actions indicate on-the-ground activities that will help to achieve the conservation objectives (Figs. 10 and 11). Actions are strategic rather than highly detailed and prescriptive. Whenever possible, recommended actions benefit multiple species, and/or respond to more than one threat. Recommended actions defer to or support those provided in recovery documents for species at risk at the federal, provincial or territorial level, but will usually be more general than those developed for individual species.
The recommended conservation actions are categorized as per World Conservation Union-Conservation Measures Partnership (IUCN-CMP) with the addition of categories for research and monitoring. In BCR 14 PEI, the most frequently recommended conservation actions fall under the sub-categories of 2.1 Site/area management and 5.3 Private sector standards and codes (Figure 12). Examples of recommended conservation actions under site or area management include specific recommendations to maintain patch sizes, configuration and connectivity of different types of forests; to reduce fragmentation of habitats within wetlands to reduce the extent of edges; to maintain large trees, to define and provide minimum number, size and condition of residual snags and living trees for priority bird species. Examples of recommended conservation actions under 5.3 Private sector standards and codes include the development and implementation of guidelines for the protection of priority bird species and development of beneficial management practices for peat harvesting, renewable energy development, forestry and agriculture.
In MBU 12 PEI, the most frequently recommended conservation actions fall in the 5 Law and policy category as 5.3 Private sector standards and codes and 5.4 Compliance and enforcement (Figure 13). Examples of recommended conservation actions under private sector standards and codes, specific to MBUs include the implementation of beneficial management practices for aquaculture, fisheries and other coastal resource harvesting industries; the development of beneficial management practices and avoidance guidelines to manage renewable energy developments and minimize habitat degradation. Examples of recommended conservation actions under compliance and enforcement include monitoring and enforcing compliance with laws, policies and regulations to minimize seabird bycatch and/or laws, policies and regulations related to the release of oil and other wastes into marine waters.
In MBU 12 PEI, 4.3 Awareness and communications is another sub-category of frequently recommended conservation actions (Figure 13). Examples of recommended conservation actions include raising public awareness of shorebirds and their habitat needs as well as the impacts of disturbance from recreational activities in coastal habitats; or raising public awareness of issues surrounding human disturbance at seabird colonies or in other nesting areas; or of the impacts on shorebirds and seabirds of installing riprap in coastal areas.
Figure 12. Percent of recommended actions assigned to each sub-category in BCR 14 PEI.
“8.2 Monitoring” refers to specific species where monitoring is required. “8.1 Research” refers to specific species where additional information is required. For more information, see Research and Population Monitoring Needs in Section 3 of the full strategy.
Long description for Figure 12
A horizontal bar graph indicating the percent of recommended action (x axis) assigned to each sub-category of recommended actions (y axis; i.e. Site/area protection, Species Management, etc.) in BCR 14 PEI, Atlantic Region.
| Action Sub-category | Percent of Recommended Actions |
|---|---|
| 1.1 Site/area protection | 9.75744212 |
| 1.2 Resource and habitat protection | 7.55237045 |
| 2.1 Site/area management | 20.6174201 |
| 2.2 Invasive/problematic species control | 0.27563396 |
| 2.3 Habitat and natural process restoration | 5.8985667 |
| 3.2 Species recovery | 0.05512679 |
| 4.3 Awareness and communications | 5.34729879 |
| 5.2 Policies and regulations | 4.18963616 |
| 5.3 Private sector standards and codes | 22.1058434 |
| 5.4 Compliance and enforcement | 4.13450937 |
| 6.2 Substitution | 4.90628445 |
| 6.4 Conservation payments | 5.12679162 |
| 7.2 Alliance and partnership development | 0.22050717 |
| 8.1 Research | 9.59206174 |
| 8.2 Monitoring | 0.22050717 |
Figure 13. Percent of recommended actions assigned to each sub-category in MBU 12 PEI.
“8.2 Monitoring” refers to specific species where monitoring is required. “8.1 Research” refers to specific species where additional information is required. For more information, see Research and Population Monitoring Needs in Section 3 of the full strategy.
Long description for Figure 13
A horizontal bar graph indicating the percent of recommended action (x axis) assigned to each sub-category of recommended actions (y axis; i.e. Site/area protection, Species Management, etc.) in MBU 12.
| Action Sub-category | Percent of Recommended Actions |
|---|---|
| 1.1 Site/area protection | 3.3 |
| 1.2 Resource and habitat protection | 6.3 |
| 2.1 Site/area management | 0.0 |
| 2.2 Invasive/problematic species control | 0.9 |
| 2.3 Habitat and natural process restoration | 2.0 |
| 3.2 Species recovery | 0.0 |
| 4.3 Awareness and communications | 12.5 |
| 5.2 Policies and regulations | 9.6 |
| 5.3 Private sector standards and codes | 25.4 |
| 5.4 Compliance and enforcement | 22.1 |
| 6.2 Substitution | 5.9 |
| 6.4 Conservation payments | 2.0 |
| 7.2 Alliance and partnership development | 0.0 |
| 8.1 Research | 10.1 |
| 8.2 Monitoring | 0.0 |
References
Aboriginal Affairs and Northern Development Canada. Aboriginal and Treaty Rights Information System (ATRIS). Accessed Jan. 23, 2013.
Benoît, A.R. 2007. Aboriginal harvest of waterfowl in the Maritimes. Technical Report Series No. 488. Canadian Wildlife Service, Environment and Climate Change Canada, Atlantic Region. Benoît, H.P., J.A. Gagné, C. Savenkoff, P. Ouellet, and M.N. Bourassa. 2012. State-of-the-Ocean Report for the Gulf of St. Lawrence Integrated Management (GOSLIM) Area. Can. Manuscr. Rep. Fish. Aquat. Sci. 2986: xi + 73 pp.
Benoît, H.P., J.A. Gagné, C. Savenkoff, P. Ouellet, and M.N. Bourassa. 2012. State-of-the-Ocean Report for the Gulf of St. Lawrence Integrated Management (GOSLIM) Area. Can. Manuscr. Rep. Fish. Aquat. Sci. 2986: xi + 73 pp.
Berneshawi, S. 1997. Resource Management and the Mi'kmaq Nation. Can. J.Native Studies, 17(1): 115-148.
Canadian Council on Ecological Areas. 2011. Conservation Areas Reporting and Tracking System. Accessed: October 2012.
Canadian Heritage. 2012. Atlantic Maritime Ecozone. Accessed: October 2012.
COSEWIC. 2012. Committee on the Status of Endangered Wildlife in Canada. Accessed: May 2012.
Dettmers, R. 2006. A Blueprint for the Design and Delivery of Bird Conservation in the Atlantic Northern Forest.US Fish and Wildlife Service. Vers. 1.0. www.acjv.org/documents/BCR14%20Blueprint.pdf. Accessed: October 2012.
Donaldson, G. M., C. Hyslop, R. I. G. Morrison, H. L. Dickson, and I. Davidson (editors). 2000. Canadian Shorebird Conservation Plan. Canadian Wildlife Service, Environment and Climate Change Canada, Ottawa, Ontario. 27 pp.
Fisheries and Oceans Canada. 2008. Marine Protected Area: Basin Head. Accessed: September 2012.
Food and Agriculture Organization (FAO). 2000. Land cover classification system. United Nations Food and Agriculture Organization, Rome.
Hutchinson, J. 2012. Prince Edward Island`s ecosystem forest management, certification and agreements, the island way?Presentation to ASFWBSpring Seminar. Sackville, NB.
Kennedy, J.A., E.A. Krebs and A.F. Camfield. 2012. A Manual for Completing All-bird Conservation Plans in Canada, May 2012 version. Canadian Wildlife Service, Environment and Climate Change Canada. Ottawa, ON
MacDonald, W. 2001. Forests and Forestry in Prince Edward Island. Vers. condensed. Accessed: September 2012.
McMillan, A.D. 1995. Native Peoples and Cultures of Canada: An Anthropological Overview. Vancouver, Toronto: Douglas and McIntyre, 2nd Edition.
Milko, R., L. Dickson, R. Elliot, and G. Donaldson. 2003. Wings Over Water: Canada's Waterbird Conservation Plan. Canadian Wildlife Service, Environment and Climate Change Canada, Ottawa, Ontario. 28 spp.
North American Waterfowl Management Plan, Plan Committee. 2004. North American Waterfowl Management Plan 2004. Implementation Framework: Strengthening the Biological Foundation Canadian Wildlife Service, U.S. Fish and Wildlife Service, Secretaria de Medio Ambiente y Recursos Naturales, 106 pp.
North American Wetlands Conservation Council. A Wetland Conservation Vision for Canada. Wetlands Canada: Accessed: September 2012.
PEI Eastern Habitat Joint Venture. 2008. Five Year Plan for the Implementation of the North American Waterfowl Management Plan in Prince Edward Island. North American Waterfowl Management Plan.
Prince Edward Island. 2012a. Tourism Department. Accessed: September 2012.
Prince Edward Island. 2012b. Streams and Estuaries. Accessed: September 2012.
Prince Edward Island. 2004. Discussion paper: Forest Policy for Prince Edward Island(PDF; 5.32 MB). Prepared by Department of Environment, Energy and Forestry. November 30, 2004. Accessed: September 2012.
Prince Edward Island. 2003. A Wetland Conservation Policy for Prince Edward Island(PDF; 191 KB). Accessed: September 2012.
Rich, T.D., C.J. Beardmore, H. Berlanga, P.J. Blancher, M.S.W. Bradstreet, G.S. Butcher, D.W. Demarest, E.H. Dunn, W.C. Hunter, E.E. Iñigo-Elias, J.A. Kennedy, A.M. Martell, A.O. Panjabi, D.N. Pashley, K.V. Rosenberg, C.M. Rustay, J.S. Wendt, T.C. Will. 2004. Partners in Flight North American Landbird Conservation Plan. Cornell Lab of Ornithology. Ithaca, NY.
Salafsky, N., D. Salzer, A. J. Stattersfield, C. Hilton-Taylor, R. Neugarten, S. H. M. Butchart, B. Collen, N. Cox, L. L. Master, S. O'Connor, and D. Wilkie. 2008. A standard lexicon for biodiversity conservation: Unified classifications of threats and actions. Conservation Biology 22(4):897-911.
Species at Risk Public Registry. Accessed 4 May 2012. Schedule 1: List of Wildlife Species at Risk.
Statistics Canada. 2011a. 2011 Census: Population and dwelling counts. Vers. date modified: 2012-02-08. Accessed: October 2012.
Statistics Canada. 2011b. 2011 Census of Agriculture. Accessed: October 2012.
Stewart, R.L.M., Bredin, K.A., Couturier, A.R., Horn, A.G., Lepage, D., Makepeace, S., Taylor, P., Whittam, R.M., Taylor, P.D. Editors. In preparation. The Second Atlas of Breeding Birds of the Maritime Provinces. Expected to be published in 2013 by Bird Studies Canada and Environment and Climate Change Canada.
Therriault, J.C. 1991. The Gulf of St. Lawrence: small ocean or big estuary?Can. Spec. Publ. Fish. Aquat. Sci. 113: 359 pp.