
Chapter 7: Changes in the oceans
Authors
Coordinating Lead Authors
Blair J. W. Greenan, Fisheries and Oceans Canada
Roberta C. Hamme, University of Victoria
Lead Authors
Mercè Casas-Prat, Environment and Climate Change Canada
Charles G. Hannah, Fisheries and Oceans Canada
Thomas S. James, Natural Resources Canada
Li Zhai, Fisheries and Oceans Canada
Contributing Authors
Kumiko Azetsu-Scott, Fisheries and Oceans Canada
James R. Christian, Fisheries and Oceans Canada
Leah Cicon, Environment and Climate Change Canada
Andrea Hilborn, Fisheries and Oceans Canada
Debby Ianson, Fisheries and Oceans Canada
Jennifer Jackson, Fisheries and Oceans Canada
Mathilde Jutras, Institut des Sciences de la Mer (ISMER), Université du Québec à Rimouski
Pengcheng Wang, Environment and Climate Change Canada
Zeliang Wang, Fisheries and Oceans Canada
Acknowledgements
Connor Brierley-Green, Natural Resources Canada
Patrick Cummins, Fisheries and Oceans Canada
Frédéric Cyr, Memorial University of Newfoundland
Brendan DeTracey, Fisheries and Oceans Canada
Peter Galbraith, Fisheries and Oceans Canada
Chantelle Layton, Fisheries and Oceans Canada
Recommended chapter citation:
Greenan, B.J.W., Hamme, R.C., Casas-Prat, M., Hannah, C.G., James, T.S. & Zhai, L. (2026). Changes in the oceans. In Canada’s Changing Climate Report 2026. (pp. xx–xx). Government of Canada.
Chapter key messages
Key message 7.1
Ocean temperatures around Canada have increased in ice-free periods since the mid-20th century (high confidence). This increase is consistent with the warming observed in the global upper ocean, for which human influence is extremely likely to be the main driver. The largest increase in annual average sea surface temperatures has been observed adjacent to southern Atlantic Canada (high confidence). By season, the greatest warming has occurred in summer and extends throughout the ocean bordering eastern Canada, including Hudson Bay (high confidence).
Key message 7.2
Continued warming is projected for the oceans around Canada, with the magnitude increasing with higher greenhouse gas emissions (high confidence). The increase in annual average sea surface temperatures is expected to be greater in the waters next to Atlantic Canada and British Columbia than in the Arctic (medium confidence). During the summer period, sea surface temperatures are expected to increase the most in the Beaufort Sea and Hudson Bay, in part due to the decline of seasonal sea ice cover there (medium confidence).
Key message 7.3
More frequent and intense marine heatwaves have been observed in the Pacific and Atlantic oceans around Canada since the 1980s and are expected to continue to increase in all oceans, including the Arctic, because of human-caused climate change (high confidence).
Key message 7.4
The surface waters of the oceans around Canada are characterized by relatively low salinity and have become even fresher since the 1950s (high confidence). The increasing freshwater input to these oceans results from warming-driven increases in precipitation and runoff from land, which includes glacier and ice sheet meltwater (high confidence). Ocean freshening is projected to continue throughout the 21st century; however, the limited number of emissions scenarios studied and the variability among model projections have resulted in low confidence for the Arctic and medium confidence for the Atlantic and Pacific.
Key message 7.5
Increased stratification, or layering of the upper ocean according to water density, in the northeast Pacific and southern Atlantic Canada regions has resulted from warming and freshening of the sea surface (high confidence). Increased stratification reduces the vertical mixing of nutrients and other chemical compounds in the upper ocean, which is an important process in the marine ecosystem.
Key message 7.6
Global mean sea level has risen by about 20 cm since 1900 as a result of human influence on the climate system (very high confidence). The main contributions to this rise have been thermal expansion of the warming ocean and widespread melting of ice on land, which results in runoff into the ocean (very high confidence). In regions of Canada where the land is subsiding, the relative mean sea level has risen more than would be expected from global sea level rise alone (very high confidence). Rates of up to 34 cm per century in southern Atlantic Canada and the western Arctic have been observed, with smaller rates in British Columbia (very high confidence). In contrast, the sea level in western Hudson Bay has fallen by 88 cm per century, owing to rapid land uplift (very high confidence). Land uplift and subsidence are caused by the continuing adjustment of the land surface, due to the loss of ice mass after the last continental glaciation.
Key message 7.7
Global mean sea level is projected to rise by many tens of centimetres in the 21st century under a low emissions scenario and is unlikely to be more than a metre under a very high emissions scenario (medium confidence). Relative sea levels in different parts of Canada are, however, projected to rise or fall depending on local vertical land motion as well as the amount of global sea-level rise. Owing to land subsidence, parts of Atlantic Canada and the western Arctic are projected to experience increases in relative sea level that are larger than the change in the global mean sea level during the coming century (high confidence).
Key message 7.8
Mean and extreme wave heights have increased in Arctic and sub-Arctic regions, primarily as a result of the warming-driven reduction in sea ice (high confidence). Wave heights in the northwest Atlantic have also increased over the last few decades (medium confidence), but the changes in ice-free areas that would result in increased wave heights cannot be directly attributed to human-caused climate change. Wave height trends in the northeast Pacific are not statistically significant. Extreme storm surges have increased in areas of the western Arctic, Hudson Bay, and Atlantic Canada (low confidence).
Key message 7.9
The projected lengthening of the Arctic ice-free season will cause increases in mean and extreme wave heights (high confidence) and storm surges (medium confidence). In areas of Atlantic Canada not affected by sea ice, mean wave heights are projected to decrease (medium confidence), while weak changes are projected in the northeast Pacific (low confidence). Projections of extreme wave heights in areas without sea ice provide limited evidence of increases in Atlantic Canada (low confidence).
Key message 7.10
Extreme sea-level events have increased in frequency and magnitude in places along Canada’s coastline where the relative sea level has risen over the past century, such as southern Atlantic Canada, the western Arctic, and British Columbia (high confidence).
Key message 7.11
Extreme sea-level events are projected to occur more often and to become larger because of future increases in relative sea-level rise in many parts of Canada (high confidence). The projected decline of sea ice along Canada’s Arctic and Atlantic coasts will result in increased waves and storm surges, which will exacerbate extreme sea-level events (high confidence).
Key message 7.12
At the surface, observations over the last three decades show that the oceans around Canada have absorbed anthropogenic carbon dioxide from the atmosphere, causing ocean acidification (very high confidence). This higher-carbon, acidified water is carried beneath the surface by ocean circulation.
Key message 7.13
Beneath the surface, oxygen has declined over many decades in the offshore and coastal waters of the northeast Pacific, in the Estuary and Gulf of St. Lawrence, and on the Scotian Shelf (high confidence), but the processes responsible vary by region and are not fully understood. Since biological respiration both consumes oxygen and adds carbon dioxide, acidification is exacerbated in regions experiencing oxygen declines (high confidence). Year-to-year variations in water circulation and biological activity have caused extreme low-oxygen and high-acidity events in the subsurface oceans around Canada (medium confidence).
Key message 7.14
Over the rest of the 21st century, the oceans around Canada are projected to continue to absorb anthropogenic carbon dioxide, to increase in acidity (very high confidence), and to lose oxygen in the subsurface (medium confidence). The level of projected acidification in the latter half of this century will strongly depend on the level of future carbon dioxide emissions (very high confidence).
Key message 7.15
The oceans slow the rate of climate-driven atmospheric warming by absorbing heat and carbon dioxide; however, this absorption, in turn, warms and acidifies the oceans around Canada (very high confidence). Impacts on the ocean include more frequent and intense marine heatwaves, increasing stratification, rising sea levels in many regions, more frequent coastal flooding events, and decreasing ocean oxygen levels (high confidence). Continued emissions will intensify these changes, but with impacts varying substantially along Canada’s coastlines, which will result in differing needs for climate change adaptation (high confidence).
Plain language summaryFootnote 1
(This plain language summary includes chapter findings that are stated without calibrated uncertainty terms and use wording that may differ slightly from that in the chapter key messages. The chapter key messages appear at the start of each section in the body of the chapter and include the authors’ assessment of certainty in the findings using calibrated uncertainty terms that are explained in detail in Chapter 1 of this report and in footnotes in this chapter.)
Climate change is impacting the oceans around Canada, changing their temperature and salt content, as well as the connections between shallower and deeper waters. Observed changes show that the sea surface has been warming since the mid-20th century, with the greatest changes occurring in summer in southern Atlantic Canada and throughout eastern Canada, including Hudson Bay. This warming is projected to continue, but to occur faster under the high and very high emissions scenarios (SSP3-7.0 and SSP5-8.5 [shared socio-economic pathways]). New analyses since the first edition of CCCR (CCCR2019) show that the largest annual average increase in ocean warming is projected for the waters around Atlantic Canada and British Columbia, with Hudson Bay and the Beaufort Sea projected to have the greatest increases in summer. Rising ocean temperatures have led to more frequent and intense marine heatwave events, a trend expected to continue with future ocean warming. New scientific literature has allowed us to robustly assess marine heatwaves in this report, which could not be done in CCCR2019. Surface ocean waters have become fresher off the coast of British Columbia and southern Atlantic Canada since the mid-20th century. In contrast, the deep water of the Gulf of St. Lawrence has become saltier because of the increasing presence of subtropical water. These salinity trends are expected to continue through the 21st century. The warming and freshening of the sea surface around Canada resulting from climate change have generally led to the increased stratification of the upper ocean. This increased stratification can reduce the vertical transport of heat, carbon, oxygen, and nutrients between the surface and deeper ocean that are crucial for the marine ecosystem.
Global sea-level rise, totalling about 20 cm since 1900, is impacting Canada’s coastlines, with rates accelerating in the past three decades as glaciers and ice sheets melt. At specific locations along Canada’s coastlines, sea levels have either risen or fallen as local vertical land motion either adds to or subtracts from the global sea-level rise. Over the last century, local sea levels have risen in Atlantic Canada at a rate of more than 30 cm per century at Halifax, while they have increased at lower rates in British Columbia. The local sea level actually fell at Churchill, Manitoba, on Hudson Bay, by nearly 100 cm per century, due to substantial ongoing land uplift since the last continental glaciation. Globally, the projected amount of sea-level rise in the 21st century is many tens of centimetres, but is unlikely to exceed a full metre. During the coming century, local sea levels are projected to rise faster than the global average in parts of Atlantic Canada and the western Arctic, because the land itself is sinking.
In the Arctic, mean and extreme wave heights are projected to increase as the ice-free season gets longer. In contrast, in ice-free regions of Atlantic Canada, mean wave heights are projected to decrease. In places where the relative sea level has risen along Canada’s coastlines, the frequency and magnitude of extreme events involving high water levels have increased, resulting in more coastal flooding; these trends are projected to continue as a result of increased local sea-level rise in many parts of Canada.
The ocean is rapidly absorbing carbon dioxide from the atmosphere and has the capacity to store large amounts of carbon. However, this absorption is causing ocean acidification, with higher acidity levels now observed in all oceans around Canada. Beneath the surface, dissolved oxygen levels have been declining over the last several decades, in a process known as deoxygenation, which has been observed in the St. Lawrence Estuary and Gulf, Atlantic shelf, and Pacific fjords, shelves, and offshore waters. Episodes of extremely low oxygen and high acidity have also been detected in these areas. However, the causes of deoxygenation vary by region and are the subject of active scientific investigation. In the coming century, the oceans are projected to continue to absorb excess carbon and acidify as atmospheric carbon dioxide continues to rise. Beneath the surface, oxygen is also expected to decline, but with less certainty and greater spatial variation. Acidification and deoxygenation are expected to affect the Pacific and Arctic oceans and estuaries the most, as the waters there are already naturally higher in acidity and lower in oxygen.
7.1: Introduction
The ocean is a key part of the Earth’s climate system and is crucial in shaping global climate and weather, regulating temperature, and sequestering carbon. Making sense of the interactions between the ocean and the other parts of the Earth system is essential for understanding climate dynamics and addressing the challenges posed by climate change. The large expanses of ocean around Canada also pose daunting logistical challenges for climate monitoring, especially in the remote Arctic.
The ocean acts as a massive heat reservoir, absorbing and storing vast amounts of thermal energy. It also has greater thermal inertia than Earth’s land masses, which means that it absorbs and releases heat more slowly. The upper layers of the ocean play a vital role in moderating global air temperatures, absorbing most of the Earth system’s increasing heat. It is virtually certainFootnote 2 that the global upper ocean (i.e., depths of 0–700 m) has warmed since the 1970s ( Figure 7.1 ) and extremely likely that human influence is the main driver, according to the Summary for Policymakers (SPM) in the Working Group I contribution to the Intergovernmental Panel on Climate Change (IPCC) Sixth Assessment Report (IPCC AR6 WGI) (IPCC AR6 WGI SPM A.1.6) (IPCC, 2021). Ocean warming accounted for 91% of the heating in the climate system during the 1971–2018 period, with land warming, ice loss, and atmospheric warming accounting for about 5%, 3%, and 1%, respectively (high confidence) (IPCC AR6 WGI SPM A.4.2) (IPCC, 2021). The amount of ocean warming observed since 1971 is likely to at least double by 2100 under a low emissions scenario (SSP1-2.6; see Chapter 3, section 3.3.1, for more information on shared socio-economic pathway scenarios) and to increase fourfold to eightfold under a very high emissions scenario (SSP5-8.5) (IPCC AR6 WGI TS.2.4) (Arias et al., 2021). Long-term changes in temperature in the oceans around Canada vary regionally owing to the complex nature of ocean mixing and circulation, as well as internal climate variability at the regional scale (section 7.2).
Figure take-away: Heat has accumulated in the upper part of the global ocean over the last seven decades.
Figure title: Ocean heat content (upper 700 m of the global ocean)
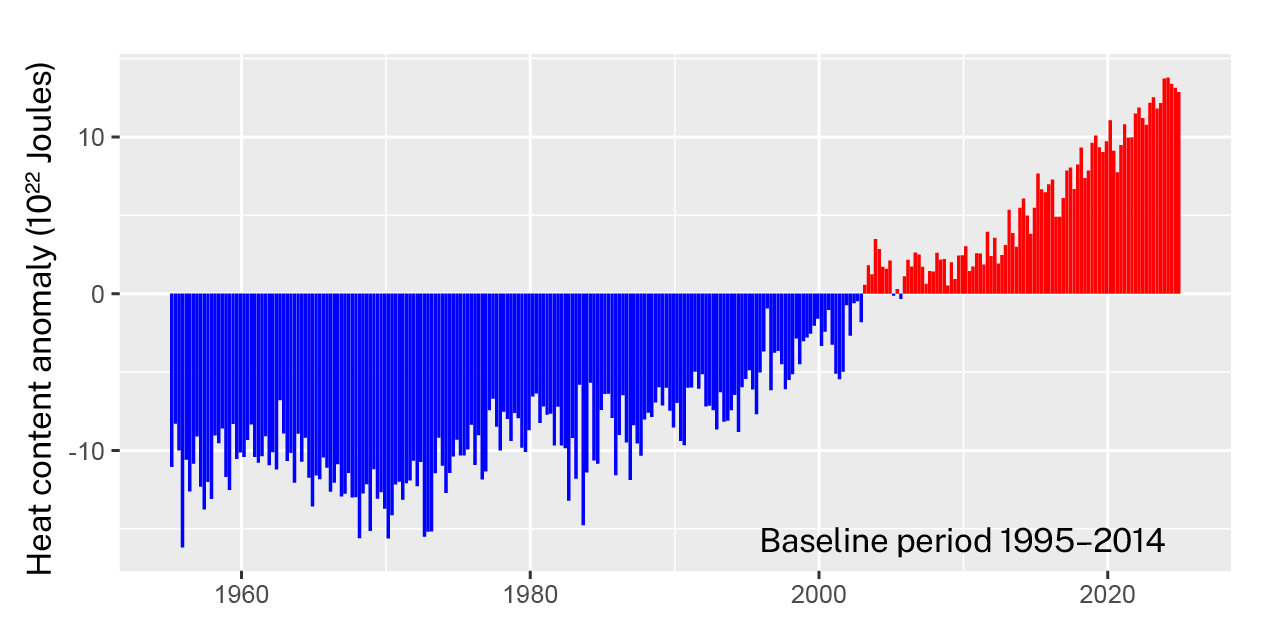
Figure 7.1 : Heat content anomalyFootnote 3 (in 1022 joules) in the upper 700 m of the global ocean, relative to the 1995–2014 average (the baseline period for the Coupled Model Intercomparison Project Phase 6 [CMIP6]Footnote 4). Blue bars indicate average heat content below the baseline and red bars, average heat content above the baseline. Global ocean heat has been consistently above the baseline average since the early 2000s. Adapted from: NOAA Climate.gov (Lindsey & Dahlman, 2025).
In the vast majority of the global ocean, the upper part has warmed and, at high latitudes, the salinity has declined (very high confidence) (IPCC AR6 WGI TS.2.4) (Arias et al., 2021). As a result, since at least the 1970s, the upper ocean has become more stratified. In other words, the ocean layers have become more stable and less prone to mixing, due to greater increases in water density with depth. Changes in ocean stratification affect the vertical exchange of surface water and thus the vertical transport of heat, carbon, oxygen, and nutrients and, at larger scales, ocean circulation itself (for details, see Box 7.4 in CCCR2019) (Greenan et al., 2019). We will discuss past and future changes in sea surface salinity and stratification in the oceans around Canada in section 7.3.
Ocean currents, formed primarily by wind blowing across the surface of the ocean and by spatial differences in the temperature, salinity, and pressure of seawater, play a key role in redistributing heat around the planet. Major currents, such as the Gulf Stream in the North Atlantic and the Kuroshio Current in the North Pacific, transport warm water from the tropics toward higher latitudes. This transfer of heat has a profound effect on regional climates, influencing temperature and weather patterns along Canada’s coastlines. Changes in ocean currents can lead to shifts in atmospheric circulation, affecting climate variability on a global scale (Chapter 4, section 4.7). Ocean currents also connect the waters surrounding Canada to each other (Figure 7.2 ), by transporting waters from the Pacific to the Arctic oceans via the Bering Strait and between the Atlantic and the Arctic oceans via Davis and Fram straits (Fisheries and Oceans Canada, 2025d). These inter-ocean connections result in exchanges of heat, freshwater (section 7.3), carbon, and nutrients among Canada’s three oceans. Major coastal and shelf-edge currents (in the waters above the continental shelf and along its edge, respectively) around Canada include the Labrador, Alaska and California currents. Internal climate variability markedly influences these regional currents, and therefore it is difficult to infer the role of anthropogenic climate change in these dynamic systems. For additional background information on ocean circulation in the waters surrounding Canada, see Section 7.1 and Box 7.2 of CCCR2019.
Figure take-away: Ocean circulation connects the Pacific, Arctic, and Atlantic ocean waters adjacent to Canada.
Figure title: Ocean circulation around Canada
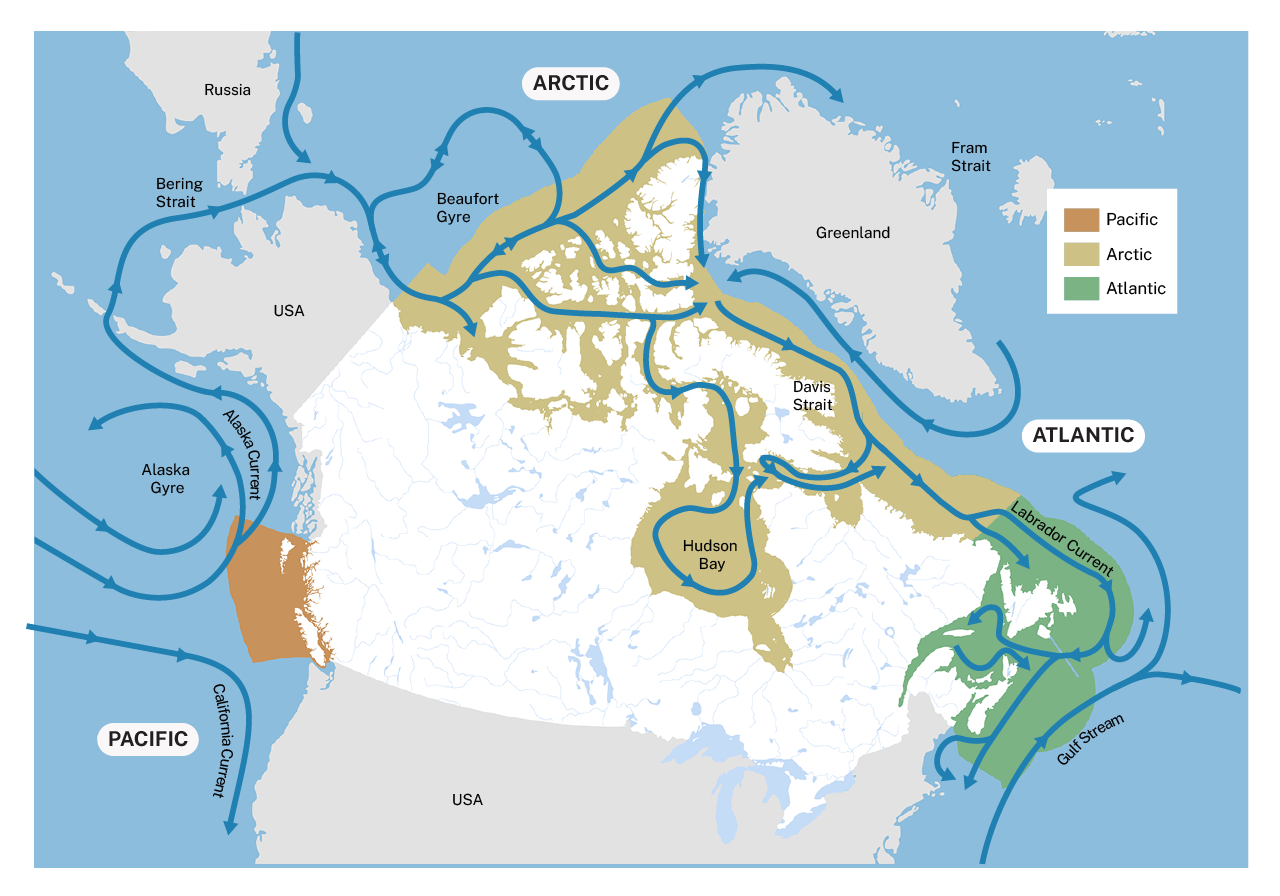
Figure 7.2 : Map showing the circulation of the upper-ocean waters, illustrating the connections between the Pacific, Arctic, and Atlantic oceans. The solid blue lines with arrowheads represent major currents and show the normal direction of the flow. Shaded areas represent Canada’s Exclusive Economic Zone in the Pacific, Arctic, and Atlantic oceans. Adapted from: Canada’s Oceans Now 2020 (Fisheries and Oceans Canada, 2020a).
Over the more than five-decade period beginning in 1971, global mean sea-level rise has accelerated as a result of the anthropogenic heating of the Earth system (Figure 7.3 ). This phenomenon is driven by thermal expansion (i.e., an increase in water volume as temperature rises) from ocean warming (50% contribution), ice loss from glaciers (22%) and ice sheets (20%), and changes in land water storage (storage of water on land by dams, groundwater extraction, and others) (8%) (IPCC AR6 WGI Table 9.5) (Fox-Kemper et al., 2021). More recently, glacier and ice sheet losses have accelerated; these processes were the dominant contributors to global mean sea-level rise between 2006 and 2018 (high confidence) (IPCC AR6 WGI SPM A.4.3) (IPCC, 2021). It is virtually certain that the global mean sea level will continue to rise throughout the rest of the 21st century (IPCC AR6 WGI SPM B.5.3) (IPCC, 2021). Regional rates of sea-level change can be considerably different from the rate of global mean rise because of ocean dynamics and gravitational effects. Relative sea level at the coastline is affected by vertical land motion (crustal uplift and subsidence), which also varies across Canada (section 7.4). Understanding these processes is crucial for assessing the impacts of climate change, especially in vulnerable coastal regions.
Figure take-away: The rate of global sea-level change has accelerated in the last half century.
Figure title: Global mean sea-level change
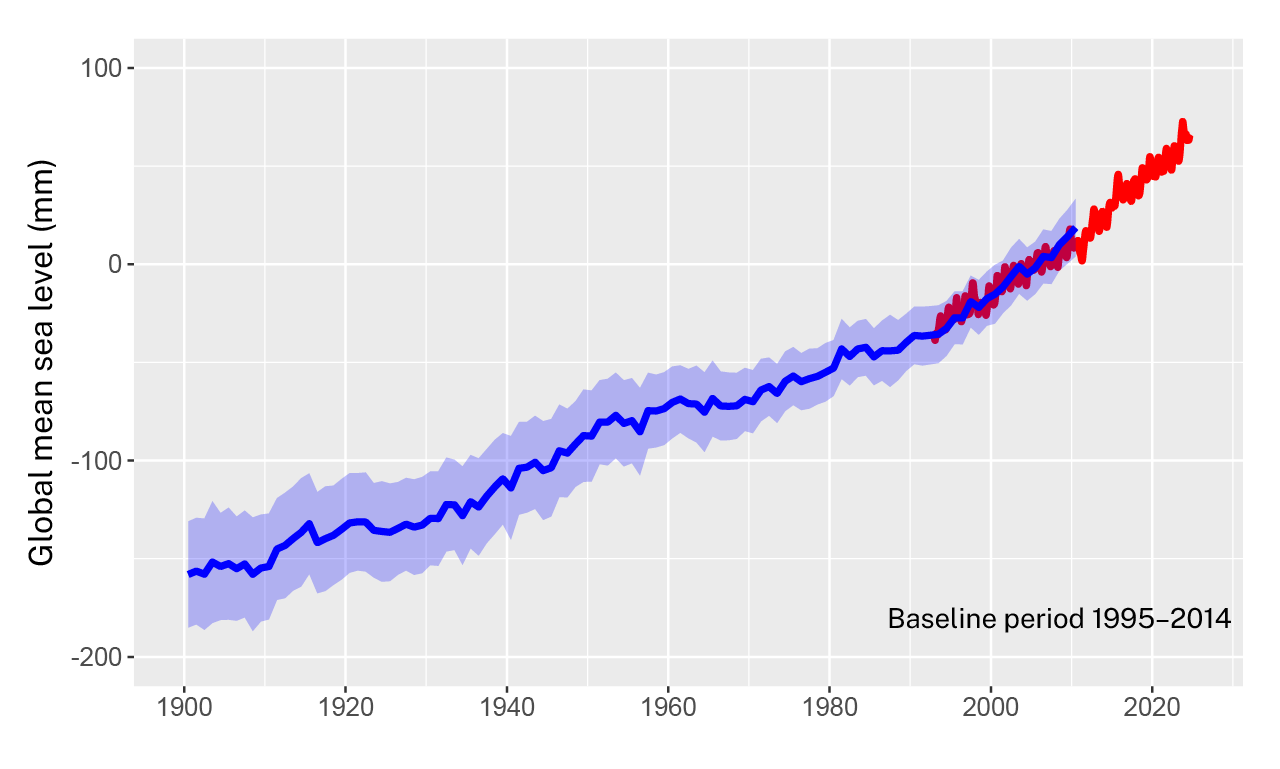
Figure 7.3 : Change in global mean sea level (in mm) using the 1995–2014 average as a baseline. Measurements in blue are based on tide gauge observations from 1900 to 2010, and measurements in red are based on satellite data from 1993 to 2024, with a glacial isostatic adjustment applied. The average rate of global sea-level rise was 1.3 mm (0.6–2.1 mm) per year between 1901 and 1971, increasing to 1.9 mm (0.8–2.9 mm) per year between 1971 and 2006, and further increasing to 3.7 mm (3.2–4.2 mm) per year between 2006 and 2018. Source: Figure 2.28 in Gulev et al. (2021) and NASA’s Goddard Space Flight Center in NASA (2025).
Canada’s coastline is vast—approximately 230,000 km long—with over half bordering the Arctic Ocean. In portions of the coastline where sea levels are rising, coastal flooding and erosion have increased even without any increase in the number of storms. This is exacerbated in locations where seasonal sea ice has declined due to the warming climate system (Chapter 6, section 6.3). Increases in these phenomena, along with the associated physical impacts, are expected in regions like the Arctic, where sea ice is declining in the summer and the open-water season is extending further into the spring and fall (section 7.5). Nevertheless, detection and attribution of the human influence on climate-related changes in storm surges and waves remain a challenge (Ceres et al., 2017). Together, rising coastal sea levels, storm surge, and waves are causing an increase in extreme sea-level events along many portions of Canada’s coastline, and this trend is projected to continue regardless of the emissions scenario (section 7.6).
In addition to storing most of the heat in the Earth system, the ocean stores vast amounts of its carbon. As atmospheric carbon dioxide (CO2) levels have increased, the ocean has responded by absorbing 25% of anthropogenic CO2 emissions. This absorption helps mitigate warming and other effects of anthropogenic carbon emissions by slowing the rate at which atmospheric CO2 levels are increasing. The ability of the ocean to absorb and store carbon highlights its importance in global efforts to assess climate change. However, this absorption also leads to ocean acidification, a serious concern for marine ecosystems, as it makes it more difficult for marine life to form and maintain skeletons and shells. It is virtually certain that human-caused CO2 emissions are the main driver of current global acidification of the upper ocean (IPCC AR6 WGI SPM A.1.6) (IPCC, 2021). At the same time, climate change is altering ocean oxygen levels, with potentially profound consequences for marine ecosystems and the services that oceans provide to humanity. There is high confidence that oxygen levels have decreased in the global upper ocean since the mid-20th century, and medium confidence that human influence has been a contributing factor (IPCC AR6 WGI SPM A.1.6) (IPCC, 2021). Monitoring of carbon and oxygen in the oceans around Canada is much more limited than that of temperature, but there is robust evidence of long-term changes (section 7.7).
In summary, this chapter describes physical and chemical changes in the oceans around Canada over decades and longer, as well as changes in ocean-related extreme events caused by climate change. We present past and future changes, focusing both on areas within Canada’s Exclusive Economic Zone (EEZ) and adjacent areas monitored by Canada, which together are referred to as “the oceans around Canada.” A visual guide to this chapter and cross-chapter linkages are provided (Figure 7.4 ) to aid in navigating the report.
Figure take-away: A visual snapshot of the contents of this chapter and of important cross-chapter linkages.
Figure title: Visual guide to the content of Chapter 7 and key cross-chapter linkages.
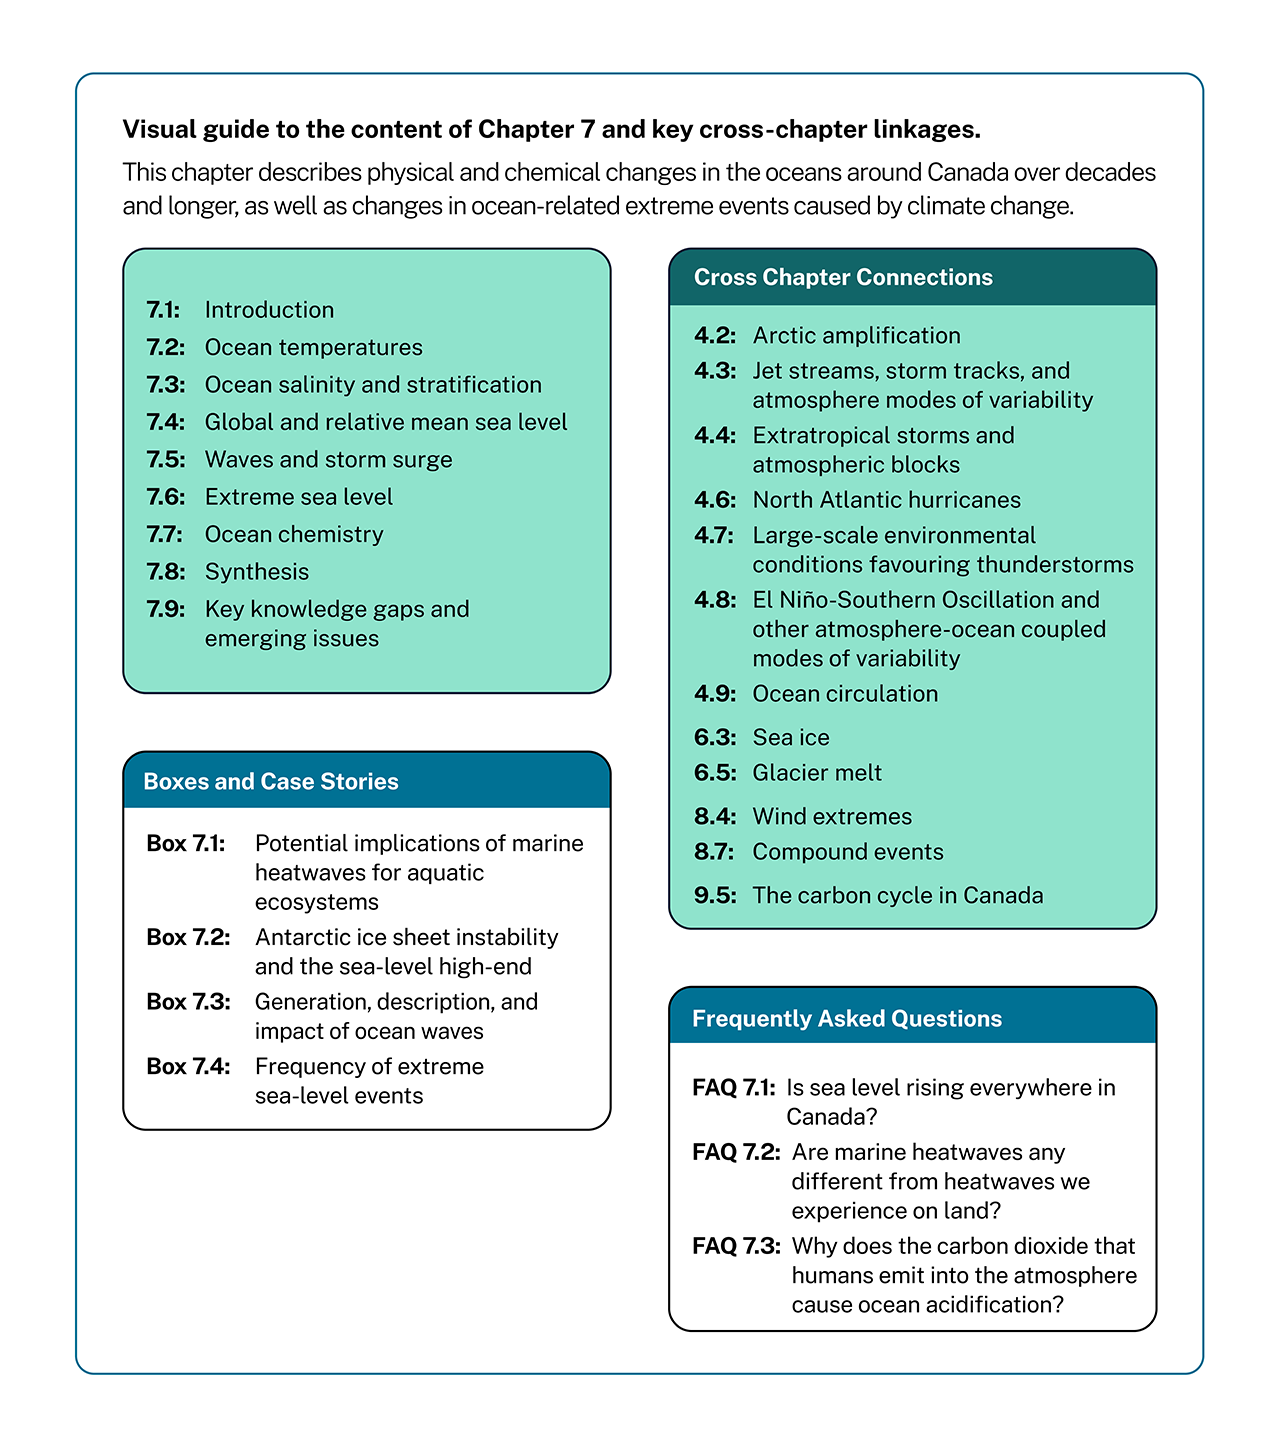
Figure 7. 4 : Visual guide to Chapter 7 content and cross-chapter linkages
7.2: Ocean temperatures
Key Message 7.1: Ocean temperatures around Canada have increased in ice-free periods since the mid-20th century (high confidence). This increase is consistent with the warming observed in the global upper ocean, for which human influence is extremely likely to be the main driver. The largest increase in annual average sea surface temperatures has been observed adjacent to southern Atlantic Canada (high confidence). By season, the greatest warming has occurred in summer and extends throughout the ocean bordering eastern Canada, including Hudson Bay (high confidence).
Key Message 7.2: Continued warming is projected for the oceans around Canada, with the magnitude increasing with higher greenhouse gas emissions (high confidence). The increase in annual average sea surface temperatures is expected to be greater in the waters next to Atlantic Canada and British Columbia than in the Arctic (medium confidence). During the summer period, sea surface temperatures are expected to increase the most in the Beaufort Sea and Hudson Bay, in part due to the decline of seasonal sea ice cover there (medium confidence).
Key Message 7.3: More frequent and intense marine heatwaves have been observed in the Pacific and Atlantic oceans around Canada since the 1980s and are expected to continue to increase in all oceans, including the Arctic, because of human-caused climate change (high confidence).
The accumulation of thermal energy in the Earth system has become established as a robust measure of the rate of global climate change on a timescale of years to decades. This heat build-up is quantified through observations of melting ice, along with the warming of the ocean, atmosphere, and land. Global-scale changes in ocean warming can be summarized as follows (IPCC AR6 WGI TS.2.4) (Arias et al., 2021):
“It is virtually certain that the global ocean has warmed since at least 1971, representing about 90% of the increase in the global energy inventory. The ocean is currently warming faster than at any other time since at least the last deglacial transition (medium confidence), with warming extending to depths well below 2000 m (very high confidence). It is extremely likely that human influence was the main driver of this recent ocean warming. Ocean warming will continue over the 21st century (virtually certain) and will likely continue until at least to 2300, even for low CO2 emissions scenarios. Ocean warming is irreversible over centuries to millennia (medium confidence), but the magnitude of warming is scenario-dependent from about the mid-21st century (medium confidence). The warming will not be globally uniform. ” – Technical Summary, IPCC AR6 WGI Global ocean heat content has increased throughout the water column since 1960, with 40%, 24%, 28%, and 8% of heat accumulated in the 0–300 m, 300–700 m, 700–2000 m, and below-2000 m layers, respectively (Cheng et al., 2024). Because of the ocean’s substantial thermal inertia (it absorbs and releases heat slowly), the deep ocean is expected to continue to warm for at least hundreds of years, even if greenhouse gas (GHG) emissions are mitigated to a considerable degree. Thus, the consequences of ocean warming, such as contributions to global sea-level rise, are expected to become even more severe in future years.
Since the beginning of the 20th century, the global average sea surface temperature (SST) has increased by 0.88°C (0.68−1.01°C),Footnote 5 and it is virtually certain to continue to do so throughout the 21st century, exacerbating the hazards to marine ecosystems (medium confidence) (IPCC AR6 WGI TS.2.4) (Arias et al., 2021). Since the 1980s, marine heatwaves have roughly doubled in frequency (high confidence) and have become more intense and longer lasting (medium confidence) (IPCC AR6 WGI TS.2.4) (Arias et al., 2021). Most of the marine heatwaves observed globally during the 2006–2015 period have been attributed to anthropogenic warming (very likely) (IPCC AR6 WGI TS.2.4) (Arias et al., 2021). With additional global warming, the frequency of marine heatwaves will continue to increase (high confidence), particularly in the tropical oceans and the Arctic (medium confidence) (IPCC AR6 WGI SPM B.2.3) (IPCC, 2021).
In this section, we will present the changes observed in SST values, as well as in subsurface temperatures, in the oceans around Canada. The availability of subsurface temperature data is much more limited than that of SST data, which became more widely available in the early 1980s with the advent of satellite SST measurements. Therefore, observed changes in subsurface temperatures will be presented only for locations with long time series of data. SSTs are influenced by modes of internal climate variability, such as the Atlantic Multidecadal Oscillation, North Atlantic Oscillation, Pacific Decadal Oscillation, and El Niño–Southern Oscillation. These variability modes generally involve large-scale patterns in atmospheric or oceanic circulation, which result in changes in surface winds over the ocean, as well as in transfers of heat across the air-sea interface (see Chapter 4 for additional information about large-scale climate variability).
We will also present projected changes in SST values and subsurface and bottom temperatures. The complex bathymetry (sea floor topography) of the continental shelves around Canada presents a challenge for using coarse-resolution global Earth system models, and limits confidence in ocean subsurface and bottom temperature projections for these shallower ocean regions. Regional downscaling, which provides higher-resolution projections (see the first edition of CCCR [CCCR2019] Section 3.5) (Flato et al., 2019), is improving our knowledge of how climate change is affecting ocean subsurface and bottom temperatures in the oceans around Canada, but further progress is urgently needed in this area of research.
7.2.1: Past changes
The ocean temperature observations presented here come from two primary sources: first, long-term ocean monitoring programs managed by Fisheries and Oceans Canada (DFO) and, second, the Hadley Centre Sea Ice and Sea Surface Temperature (HadISST) global data product. DFO data include records of both sea surface and subsurface temperatures in the waters around Canada. HadISST is a widely used data product that compiles historical records of SST values and sea ice concentrations from various sources, including ships, buoys, and satellites (Rayner et al., 2003). HadISST then uses these observations in combination with statistical methods to create a gridded data product (see Chapter 2, section 2.3.3, for a detailed explanation of the gridding process). Areas of the global ocean that are covered by seasonal or year-round sea ice are assigned a default value of -1.8°C (the approximate freezing temperature of seawater) for the purposes of calculating SST values. Although the HadISST dataset covers the period from 1870 to the present, this section focuses on data available from the 1950s onward, when the amount of temperature data collected and the geographical area covered increased substantially.
To provide a broader context for SST values in the oceans around Canada, global anomalies (deviations from average conditions) are shown in Figure 7.5 , along with anomalies in the North Atlantic and North Pacific basins (Z. Wang et al., 2025). As this figure illustrates, SST values in the individual ocean basins varied more from year to year (interannually) and from decade to decade (decadally) than the values for the global ocean as a whole. This indicates that SST has considerable spatial variability. Global average SST values began to increase more rapidly after the 1960s, except during a roughly one-decade hiatus in the early 2000s when values were stable. In contrast to these global trends, North Atlantic and North Pacific SST data showed different patterns at timescales of decades (Figure 7.5). In the North Atlantic, a cooling trend started in the 1950s and continued into the early 1970s, before a strong warming trend was established, which continues today. In the North Pacific, a similar cooling trend started later in the mid-1960s, and then continued into the mid-1970s, after which a warming trend began. This interannual and decadal variability between the two areas was greater than the variability in global values. These greater variations demonstrate the concept that internal variability is smaller when you average results for large areas, with internal variability increasing from the global to regional and local scales (Hawkins & Sutton, 2009).
Figure take-away: Sea surface temperatures have increased in the global, North Atlantic, and North Pacific oceans since the 1970s.
Figure title: Sea surface temperature anomalies
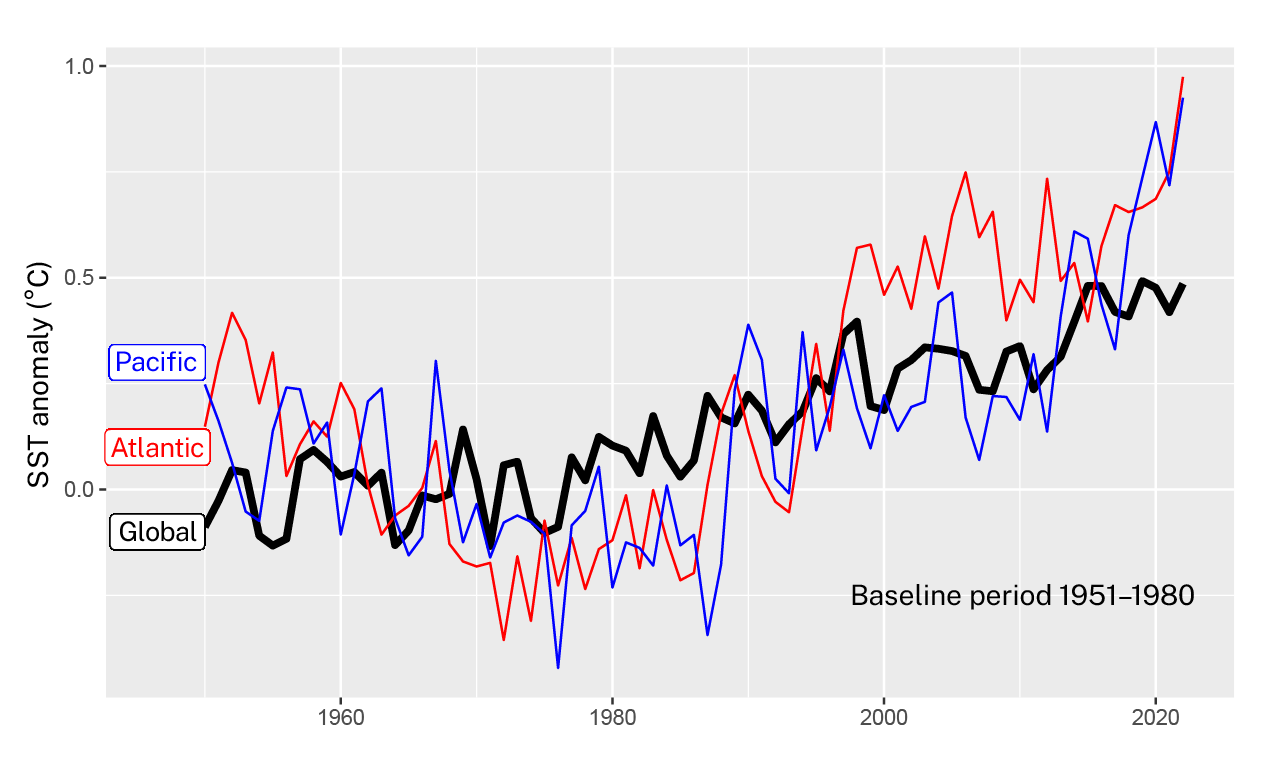
Figure 7.5 : Sea surface temperature (SST) anomaly (in °C) derived from the Hadley Centre Sea Ice and Sea Surface Temperature (HadISST) data product, for the global ocean (60° N to 60° S) (shown in black), North Atlantic (30° N to 60° N) (shown in red), and North Pacific (30° N to 60° N) (shown in blue). Deviations from the 1951–1980 average were chosen because historical data are available for most of this period. Source: HadISST in Rayner et al. (2003).
DFO has two long-term monitoring programs on the west coast of Canada that provide ongoing ocean temperature data. The British Columbia Shore Station Oceanographic Program (Fisheries and Oceans Canada, 2025c) collects data at lighthouses and other stations that are representative of near-surface shelf waters and has time series dating back to 1914 (Boldt et al., 2024). The Line P program (Fisheries and Oceans Canada, 2024) (see Figure 7.2 in CCCR2019) (Greenan et al., 2019) has been monitoring the deep ocean since 1956, from coastal shelf waters to farther offshore, at the former Ocean Weather Station Papa (also known as Station P) (Cummins & Ross, 2020). The variability in SST values in Canada’s Pacific coastal waters is strongly influenced by large-scale climate processes, as well as local wind forcing (Cummins & Masson, 2014). According to the composite lighthouse data, a long-term rising trend can be discerned in SST values, which have increased at a rate of 0.9°C (0.5−1.2°C) per century (Figure 7.6). At Station Papa, which is about 1400 km offshore (50°N 145°W), the near-surface trend for the period from 1956 to 2018 was an increase of 1.9°C (0.9−2.9°C) per century, while the trend for the period from 1956 to 2013, which excludes the marine heatwave from 2013 to 2016 (referred to as “the Blob”), is substantially weaker at 1.0°C (-0.1 to 2.1°C) per century, and more closely resembles the lighthouse data trend (Cummins & Ross, 2020). The recent occurrence of the Blob event makes it more difficult to draw conclusions on long-term temperature trends in the upper ocean layer at Station Papa.
Figure take-away: Sea surface temperatures along the British Columbia coast have increased over the past eight decades, while exhibiting strong decadal variability.
Figure title: Sea surface temperature anomalies along the British Columbia coast
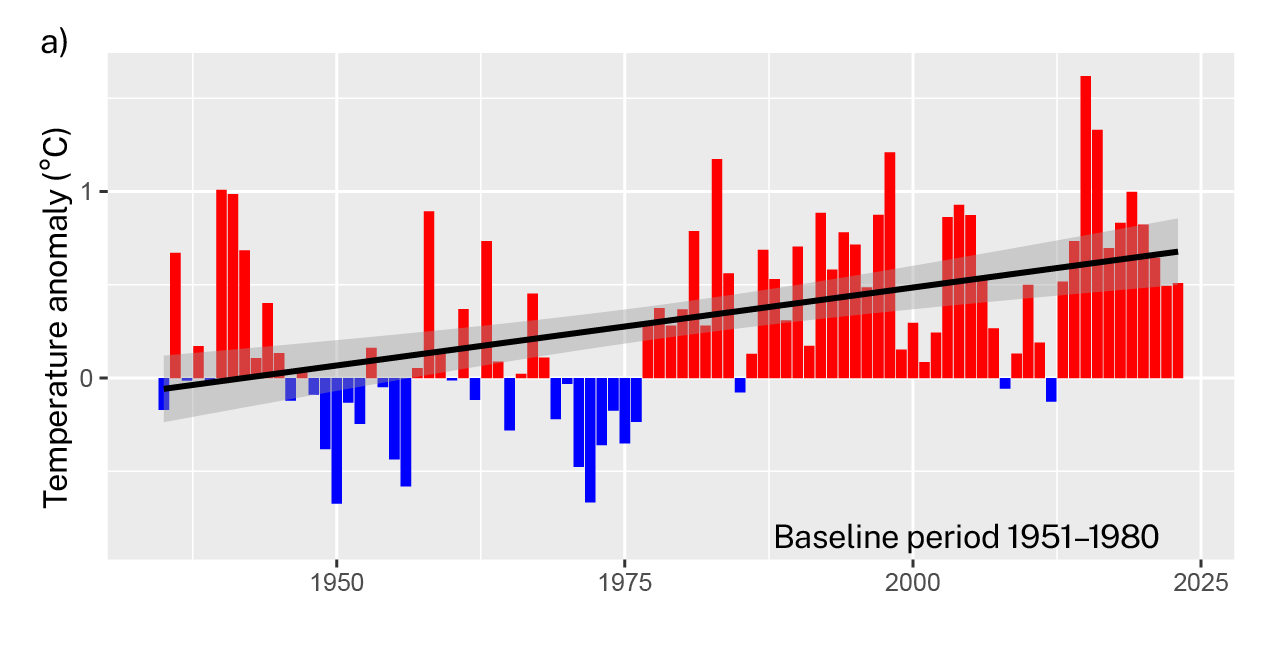
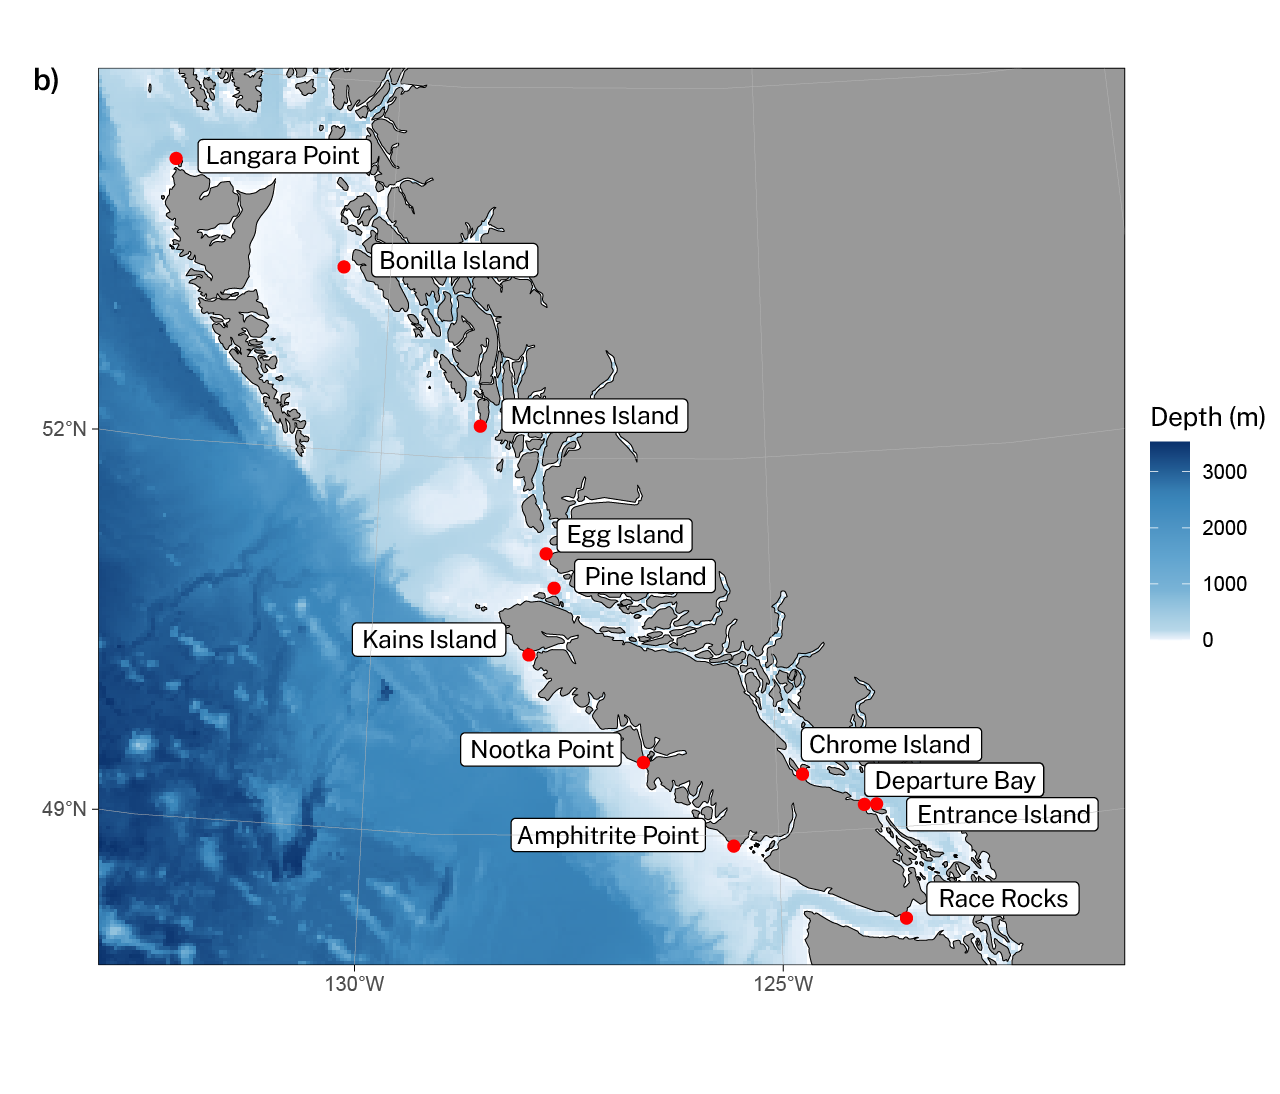
Figure 7.6 : a) Annual sea surface temperature (SST) anomaly (in °C) along the British Columbia coast, based on a composite of observations from b) British Columbia lighthouse stations. In a), the vertical bars represent the average anomalies for all locations, with the red bars indicating temperatures above the 1951–1980 baseline average and the blue bars, temperatures below the baseline average. The grey shaded area represents the 95% confidence interval for the trend line (black line, 0.9°C per century). The trend is significant at the 5% level (i.e., there is ≤ a 5% chance of concluding that an effect or trend exists when it does not). Source: Fisheries and Oceans Canada (2020b); SST anomaly figure adapted from Boldt et al. (2023, 2024).
DFO’s Atlantic Zone Monitoring Program (Fisheries and Oceans Canada, 2025a) and Atlantic Zone Off-Shelf Monitoring Program (Fisheries and Oceans Canada, 2025b) carry out long-term monitoring of the waters off the east coast of Canada. These programs primarily involve repeated ship-based surveys of the waters above the continental shelves and slopes of Atlantic Canada, as well as in the deep waters of the Labrador Sea. One example of a region covered by the Atlantic Zone Monitoring Program is the Scotian Shelf, a relatively shallow (less than 300 m deep) continental shelf that extends about 200 km south of Nova Scotia and supports a lucrative Atlantic lobster fishery. On the Scotian Shelf, SST has increased at a rate of 1.8°C (1.0–2.6°C) per century, and this region has experienced unusually warm conditions for the last two decades (Figure 7.7 ). The region undergoes natural decadal variations due to the strong influence of oceanic and atmospheric dynamics, which control the amount of cold northern water flowing southward from the Labrador Shelf to the Scotian Shelf (Brickman et al., 2018). Other ocean regions in Atlantic Canada, such as the Gulf of St. Lawrence and the Newfoundland and Labrador Shelves, also have increasing SST trends (Cyr et al., 2024; Galbraith et al., 2024).
Figure take-away: Sea surface temperatures on the Scotian Shelf have increased over the past seven decades, while exhibiting strong decadal variability.
Figure title: Sea surface temperature anomalies on the Scotian Shelf
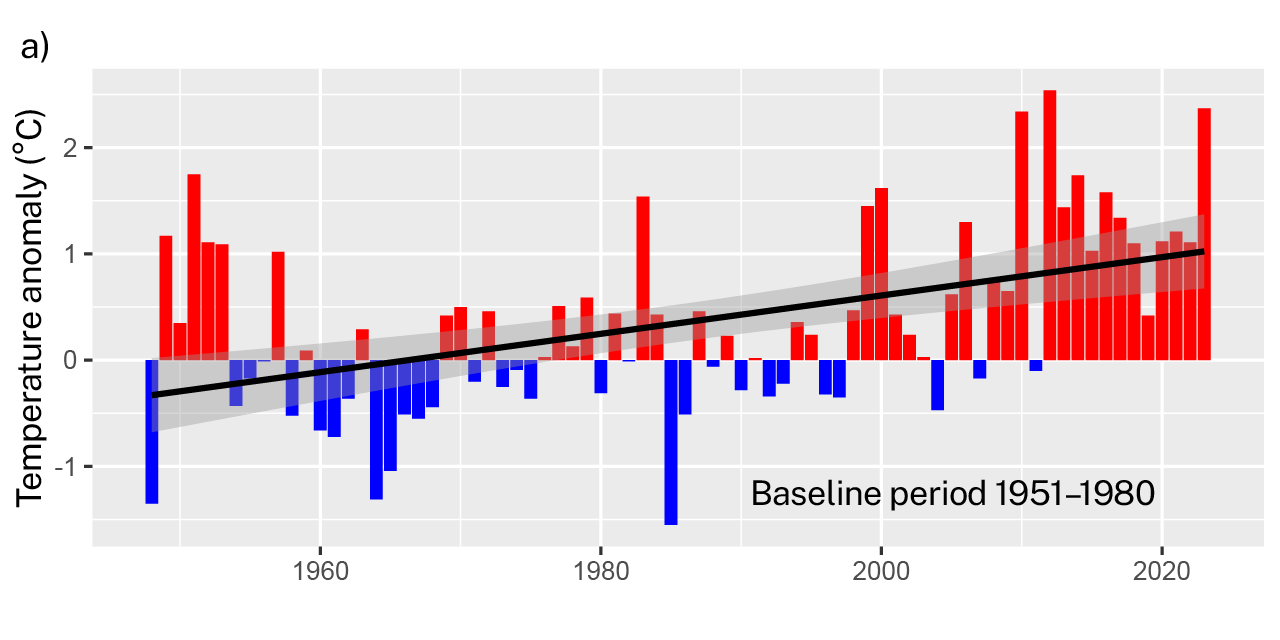
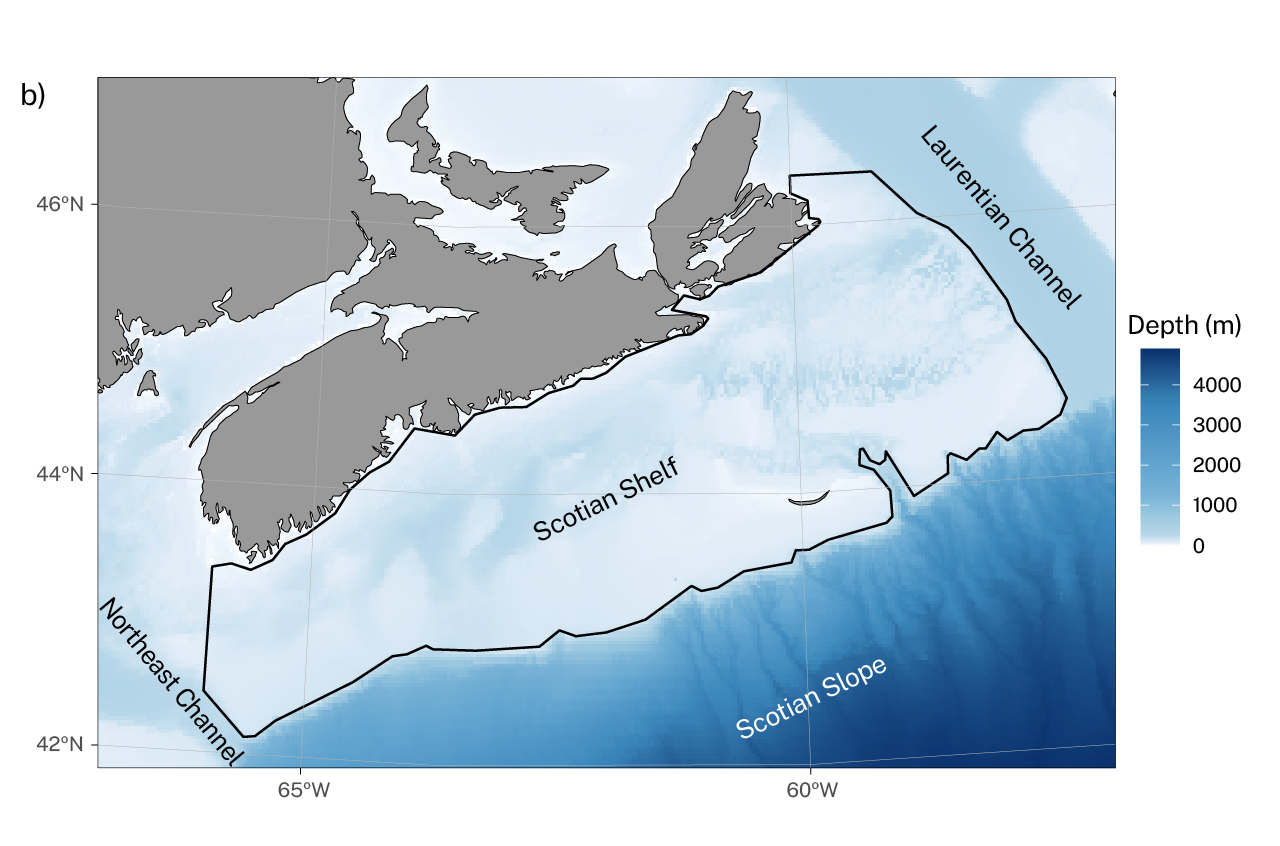
Figure 7.7 : a) Annual sea surface temperature (SST) anomaly (in °C), based on in situ observations on the Scotian Shelf and b) map showing the location of the Scotian Shelf in relation to the Laurentian Channel, Northeast Channel, and Scotian Slope. In a), the vertical bars represent the average anomalies for all locations, with the red bars indicating temperatures above the 1951–1980 baseline average and the blue bars, temperatures below that average. The grey shaded area represents the 95% confidence interval for the linear fit. The trend of 1.8°C per century (black line) is significant at the 5% level (i.e., there is ≤ a 5% chance of concluding that an effect or trend exists when it does not). Adapted from: Hebert et al. (2024).
Ocean warming has consequences for not just the health of marine ecosystems, but also the health of the people that depend on them. Read how First Nations-led adaptation actions are being developed to confront the health consequences of climate change impacts on marine food systems in Box 8.2 of theHealth of Canadians in a Changing Climate Report.
SST values in 10 ocean regions around Canada, obtained from the HadISST dataset and averaged over the 2012–2022 period, showed an increase relative to the 30-year baseline (1951–1980) (Figure 7.8) (Z. Wang et al., 2025). Increases in summer (July–September; 0.8–2.6°C) outpaced the increases in the annual average (0.4–1.9°C). The analysis was limited to the Atlantic and Pacific continental shelves off Canada, but included all of Hudson Bay and Baffin Bay, as well as the seasonally ice-free southern Beaufort Sea region. The changes observed in SST differed by region, with parts of southern Atlantic Canada experiencing the greatest changes, both annually and in summer. In addition, Hudson Bay, which is seasonally ice covered, experienced considerable summer warming. While SST varies by year and by decade, all 10 regions have experienced an increase in temperature since the early 1970s.
Figure take-away: Sea surface temperatures have increased in all oceans around Canada since the 1950s, with greater increases in summer compared to the annual averages.
Figure title: Historical changes in sea surface temperatures around Canada
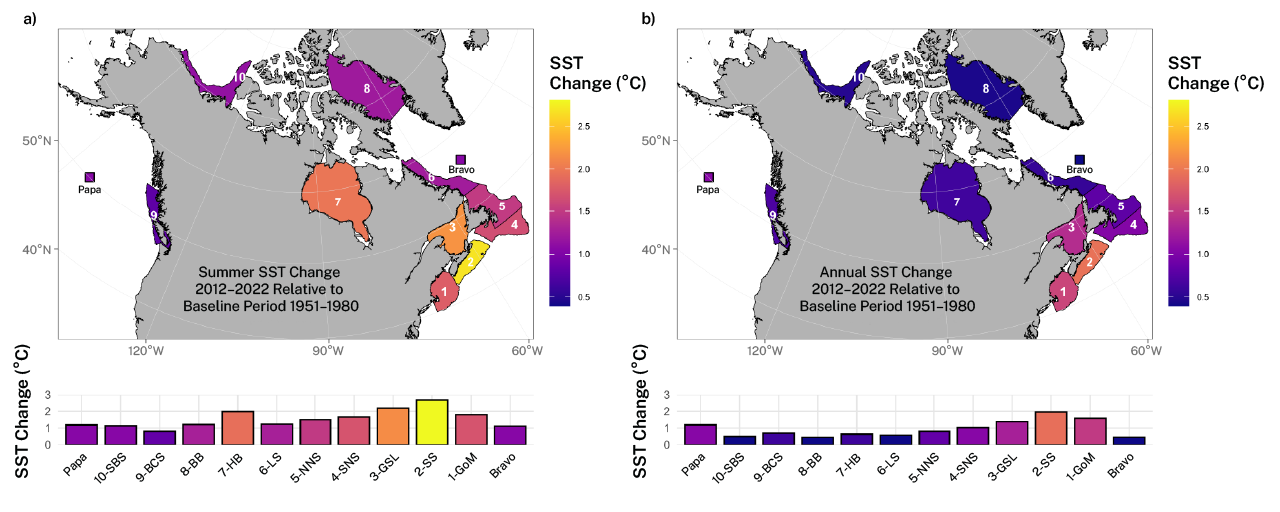
Figure 7.8 : Map showing changes (in °C) in a) the summer (July–September) and b) annual sea surface temperature (SST) during the period from 2012 to 2022 relative to the baseline period (1951–1980) at 12 locations, derived from the HadISST data product. The SST changes shown on each map are also summarized in the associated bar chart. Data were collected at two long-term ocean monitoring sites, stations Bravo and Papa, as well as in the following areas adjacent to Canada’s coastlines: 1-GoM – Gulf of Maine, 2-SS – Scotian Shelf, 3-GSL – Gulf of St. Lawrence, 4-SNS – Southern Newfoundland Shelf, 5-NNS – Northern Newfoundland Shelf, 6-LS – Labrador Shelf, 7-HB – Hudson Bay, 8-BB – Baffin Bay, 9-BCS – British Columbia Shelf, and 10-SBS – Southern Beaufort Sea. Adapted from: Z. Wang et al. (2025).
The Gulf Stream is a western boundary current that plays a major role in the global climate system. As it flows northward along the east coast of North America, this powerful ocean current influences weather patterns and storms and carries heat from the tropics to higher latitudes as part of the Atlantic Meridional Overturning Circulation (Chapter 4, section 4.9). Western boundary currents and subtropical gyres have shifted toward the poles since 1993 (medium confidence) (IPCC AR6 WGI TS.2.4) (Arias et al., 2021). A northward shift in the Gulf Stream is consistent with the greater increases in SST values observed in the Scotian Shelf and Gulf of Maine regions relative to other regions (Figure 7.8 ). In the North Atlantic and Arctic, sea ice may cover the ocean seasonally or permanently. Amplified atmospheric warming in northern Canada (Chapter 4, section 4.2) has reduced sea ice extent (Chapter 6, section 6.3), but in regions of the Arctic where sea ice is seasonal, the increase in SST values during the ice-free season has not been as great as that in southern Atlantic Canada (Carvalho & Wang, 2020).
Subsurface ocean temperature observations over Canada’s continental shelves are more limited, in both space and time, than SST observations. Subsurface data are primarily acquired by research vessels lowering instruments into the water column at discrete points, supplemented by moored instruments, which collect time series of data at fixed locations over longer periods. New, autonomous underwater technologies, such as gliders and Argo floats, have started to augment ship-based measurements, and are able to take continuous profiles of numerous ocean variables in the water column while travelling long distances.
Long-term ocean temperature observations collected in DFO monitoring programs are the primary source of subsurface data for climate change research and assessments in Canada’s three oceans. On the Atlantic coast of Canada, the deep water (> 150 m below the ocean surface) in the Gulf of St. Lawrence (GSL) originates at the entrance to the Laurentian Channel, at the continental shelf break south of Newfoundland, and circulates northward without much exchange with the upper layers (Figure 7.9 ). Linear trends (calculated over 1915–2023) in ocean temperatures at depths below 150 m indicate warming of approximately 2.5°C per century (Figure 7.9 ), which is faster than the rate of surface warming in this region. This higher near-bottom warming rate is related to the increased presence of subtropical waters from the Gulf Stream transported at depth into the Laurentian Channel (Gilbert et al., 2005; Jutras et al., 2020). A rising trend in bottom temperatures has also been observed on the Newfoundland Shelf (Cyr et al., 2024), and in the deep basins of the Scotian Shelf and Gulf of Maine (Hebert et al., 2024). However, the physical processes driving these changes (e.g., changes in regional ocean circulation) are complex and poorly understood.
Figure take-away: Subsurface ocean temperatures in the Gulf of St. Lawrence have increased by more than 2 degrees per century since 1915.
Figure title: Ocean temperatures at three depth horizons in the Gulf of St. Lawrence
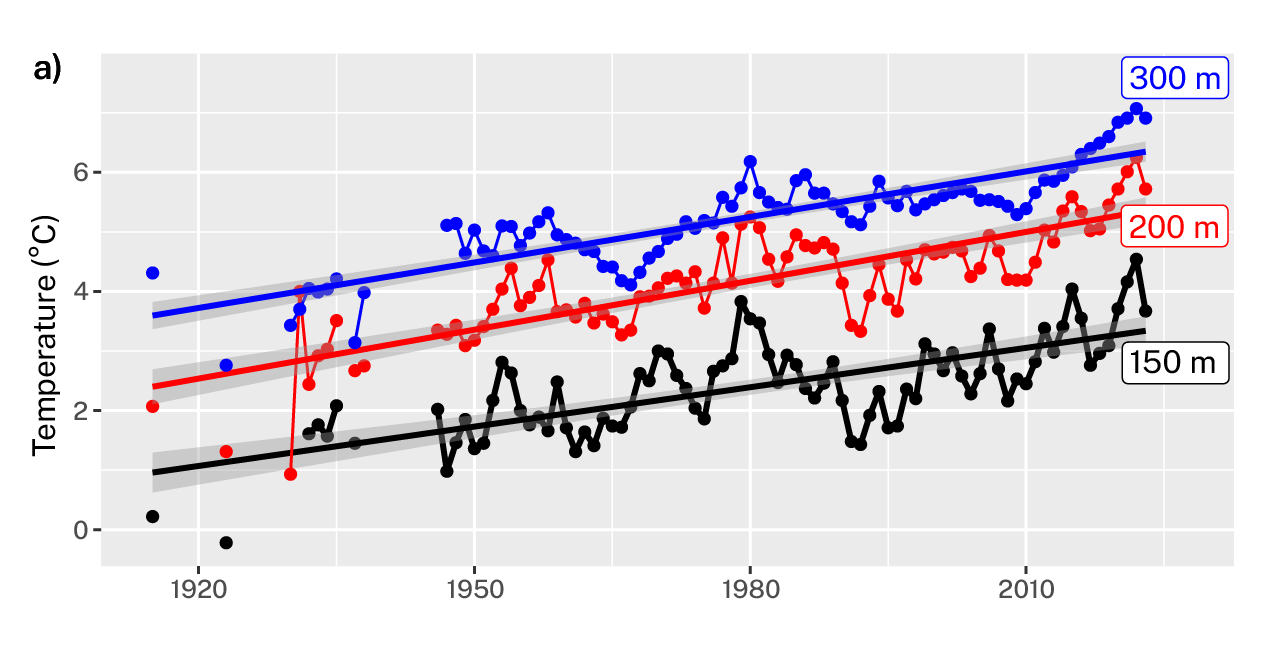
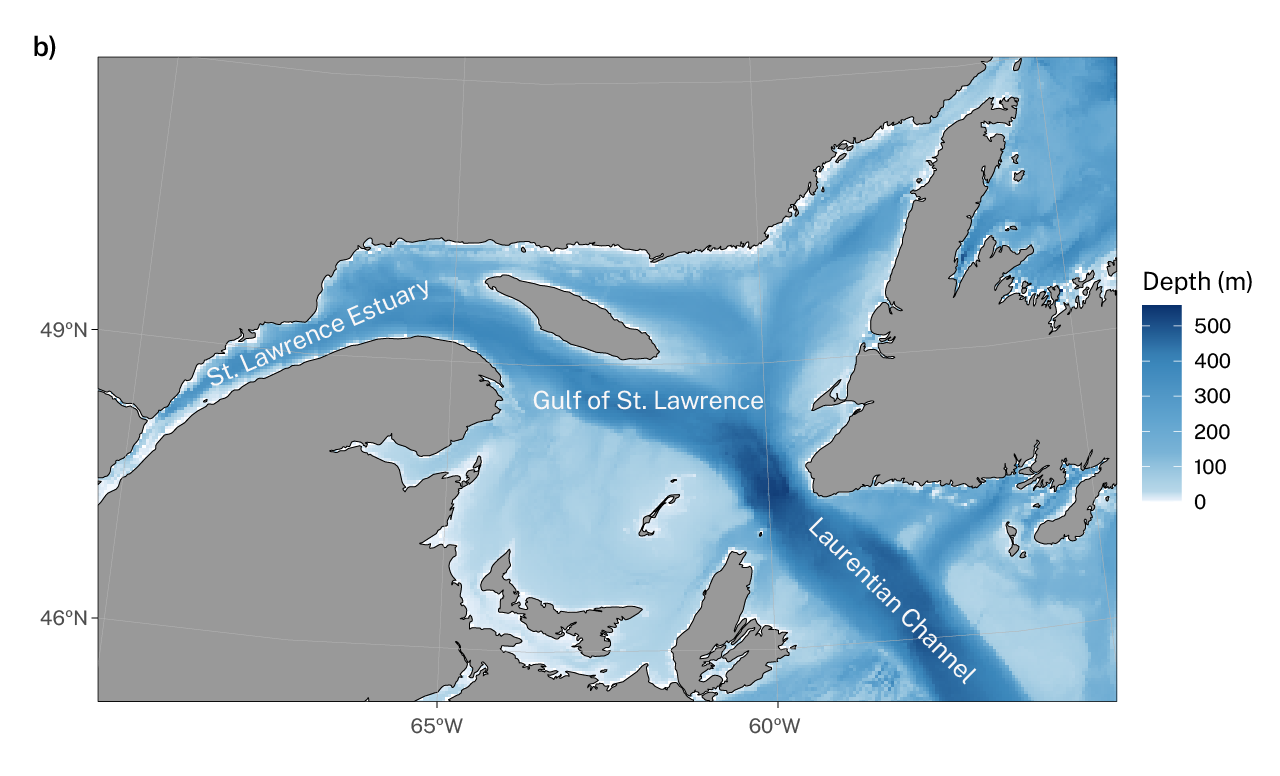
Figure 7.9 : Annual seawater temperatures (in °C) a) in three depth horizons in the Gulf of St. Lawrence, averaged by layer, with the b) map showing the location and overall depths in the Estuary and Gulf of St. Lawrence (in m). The slopes of the trend lines, calculated by linear regression, represent rates of increase of 2.2°C (1.7–2.7°C), 2.7°C (2.3–3.2°C), and 2.6°C (2.2–2.9°C) per century at depths of 150 m, 200 m, and 300 m, respectively. Values in round brackets represent the 95% confidence intervals for the trends. The grey shaded area represents the 95% confidence interval for the linear fits. The trends are significant at the 5% level (i.e., there is ≤ a 5% chance of concluding that the effect or trend exists when it does not). Adapted from: Galbraith et al. (2024).
On Canada’s Pacific coast, deep-water temperatures (i.e., below sill depthFootnote 6) in three mainland fjords (Rivers, Knight, and Bute inlets) in British Columbia have increased at a rate of 0.9°C (0.6−1.2°C) per century over the past seven decades (Figure 7.10). The same rate was observed in SST values at the lighthouse stations along the British Columbia coast (Figure 7.6). However, the potential causal link between the warming trends in ocean surface water and in the deep water of the fjords is poorly understood. Changes in deep-water temperatures in these fjords have been attributed to the warming of offshore waters, which reach the fjords through coastal upwelling, and to the reduced cooling of fjord surface waters in winter (Jackson et al., 2021). In Bute Inlet, this warm anomaly was reduced following 2020 after a landslide, caused by rapid deglaciation in the mountains above the inlet, cooled the deep-water temperature by approximately 0.5°C (Geertsema et al., 2022). In the offshore waters at Station Papa, evidence exists for smaller but statistically significant warming (< 0.3°C per century) below the main pycnoclineFootnote 7, which is typically located at a depth of about 120 m at this location (Cummins & Ross, 2020).
Figure take-away: Deep waters in British Columbia fjords have warmed over the last seven decades.
Figure title: Deep water temperature anomalies in British Columbia fjords
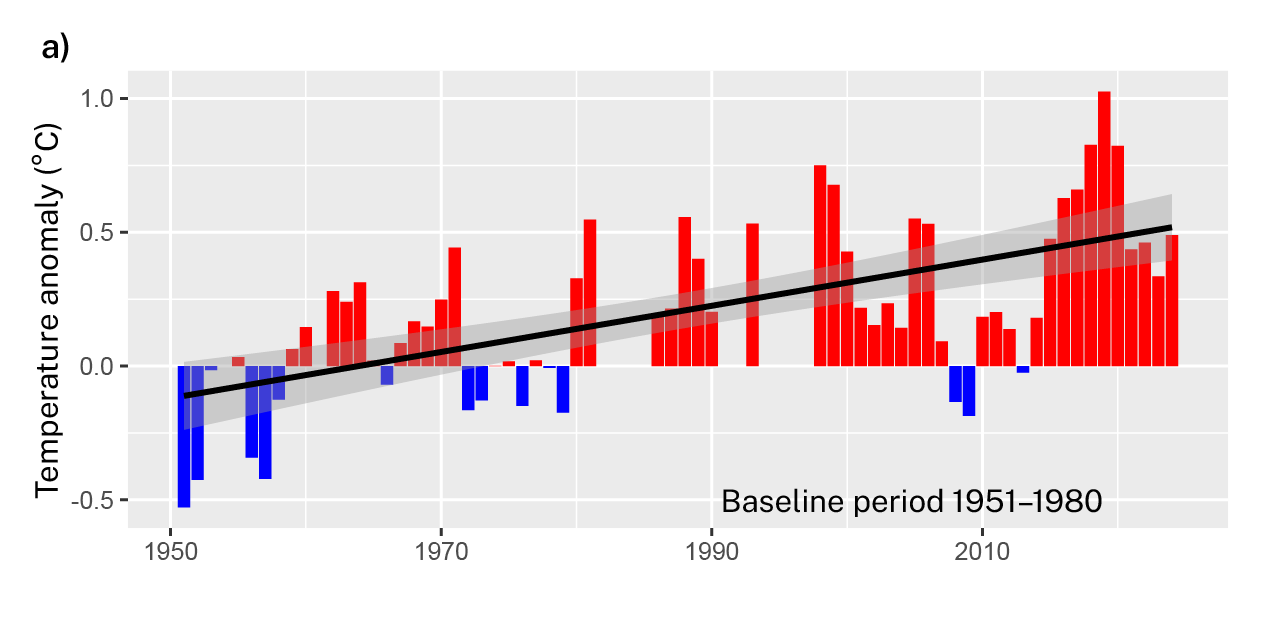
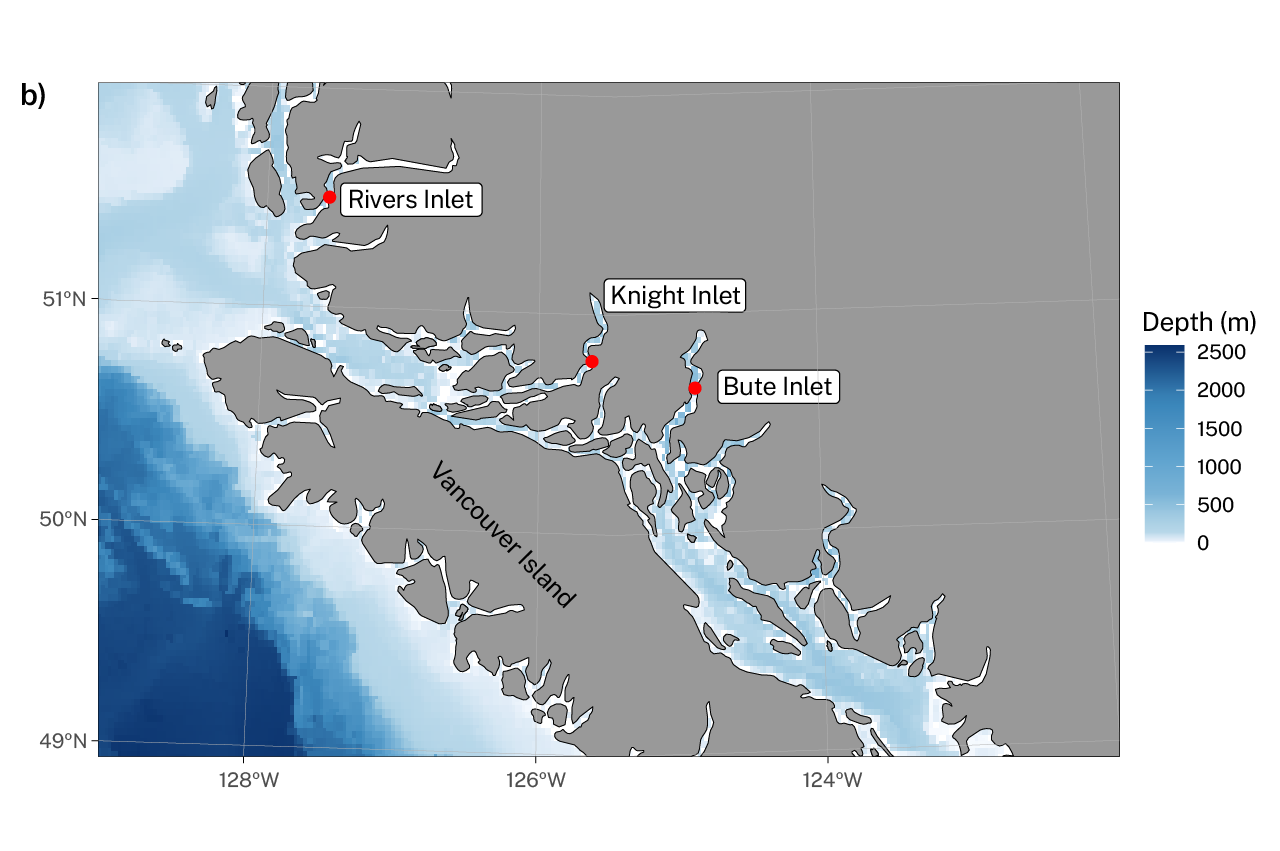
Figure 7.10 : a) Composite temperature anomaly (in °C) in deep water in fjords in mainland British Columbia (Rivers Inlet, Knight Inlet, and Bute Inlet), b) as shown on the map. The vertical bars represent the average anomalies for all locations, with the red bars indicating temperatures above the 1951–1980 baseline average and the blue bars, temperatures below that baseline average. Temperatures warmed at 0.9°C per century (black line). The grey shaded area represents the 95% confidence interval for the linear fit. The trend is significant at the 5% level (i.e., there is ≤ a 5% chance of concluding that an effect or trend exists when it does not). Adapted from: Jackson et al. (2021).
In the Arctic Ocean, the logistical challenges of collecting data in this remote region and the resulting lack of sustained ocean observations make it difficult to determine long-term trends. The longest-running record of subsurface ocean temperatures (1985–2023) in the region is from the Mackenzie Shelf in the western Canadian Arctic; a warming trend of 0.8°C per century was found there, but is not statistically significant given the interannual and decadal variability observed (Niemi et al., 2024). Similar warming trends (1998–2022) of between 0.7°C and 1°C per century were found at two depths in the water column (35–50 m and 135–155 m) in Barrow Strait (Canadian Arctic Archipelago) (Niemi et al., 2024).
7.2.2: Future changes
We projected changes in annual and summer SST values for the oceans around Canada, based on a 22‑member ensemble of CMIP6 models (Z. Wang et al., 2025). The results, presented in Figure 7.11, provide the estimated changes in SST values projected for the mid-century (2040–2059) and late-century (2080–2099) periods, relative to the historical average modelled for the 1990–2014 period. These projections cover the continental shelf waters off Canada’s Atlantic and Pacific coasts, all of Hudson and Baffin bays, and the seasonally ice-free portion of the southern Beaufort Sea.
Under the intermediate emissions scenario (SSP2-4.5) (Figure 7.11), all regions of the oceans around Canada are projected to experience annual increases in SST ranging from 0.6 to 1.9°C by mid-century and from 1.2 to 3.2°C by late century, and summer increases ranging from 1.5 to 2.6°C by mid-century and 2.6 to 4.2°C by late century. The regional pattern of projected annual temperature changes is similar to the observed historical changes, with the waters around southern Atlantic Canada and along the coast of British Columbia expected to warm the most. However, substantial changes are projected in summer in Hudson Bay and the southern Beaufort Sea, since the increasing losses of seasonal sea ice in these areas (Chapter 6, section 6.3) will allow greater heat transfer from the atmosphere to the newly open surface waters. SST values are projected to rise gradually in most marine regions in tandem with increasing GHG emissions. However, the variability among the individual CMIP6 model results limits the statistical significance of the differences projected between regions. There is lower confidence in the projected SST changes in regions with seasonal ice cover than in those that are ice-free year-round, owing to the difficulty of accurately simulating seasonal sea ice conditions. For the Arctic, CMIP6 model projections agree on the inevitability of warming, but not on its magnitude, with dramatic differences found among individual models beginning in the mid-21st century (Langehaug et al., 2023). In addition, all models project that, in all Arctic regions, subsurface ocean temperatures (at depths of both 0–50 m and 50–200 m) will be consistently higher under the very high emissions scenario (SSP5-8.5) than under the intermediate emissions scenario (SSP2-4.5) (Steiner & Reader, 2024).
Regional downscaling of the modelling results (for a description of this method, see CCCR2019, Section 3.5) for the oceans around Canada is currently limited to the emissions scenarios featured in the IPCC’s Fifth Assessment Report (IPCC AR5), with only a small subset of the CMIP5 global models used to determine boundary conditionsFootnote 8 Two studies of Canada’s Pacific coast project that SSTs will increase by 2.5–3.0°C per century under the intermediate emissions scenario (RCP4.5) and by 4.0–4.2°C per century under the very high emissions scenario (RCP8.5). These are consistent with our estimates from the CMIP6 model ensemble (Figure 7.11 ) (Holdsworth et al., 2021; Peña & Fine, 2024). One study in Atlantic Canada experimented with the use of two CMIP5 models to define boundary conditions under the intermediate (RCP4.5) and very high (RCP8.5) emissions scenarios (Han et al., 2025). In a second study, the regional model was downscaled using three CMIP5 models and the very high emissions scenario exclusively (Lavoie et al., 2020). These regional downscaling studies provided similar results to those from our 22-member CMIP6 ensemble, with SSTs increasing in the Gulf of St. Lawrence, Scotian Shelf, and the Gulf of Maine at a rate of about 4–6°C per century under the very high emissions scenario. However, under this same scenario, warming is projected to occur at a slower rate (2.5–4.5°C per century) in the waters adjacent to Newfoundland and Labrador. A slower rate of SST increase is also projected under the intermediate emissions scenario (Atlantic Canada, 1.5–5.5°C per century; Newfoundland and Labrador, 1.5–2.7°C per century) than under the very high emissions scenario (Han et al., 2025).
Figure take-away: Sea surface temperatures in the oceans around Canada are projected to increase throughout the 21st century, with the magnitude of the increase depending on the region and emissions scenario.
Figure title: Projected changes in sea surface temperatures in the oceans around Canada
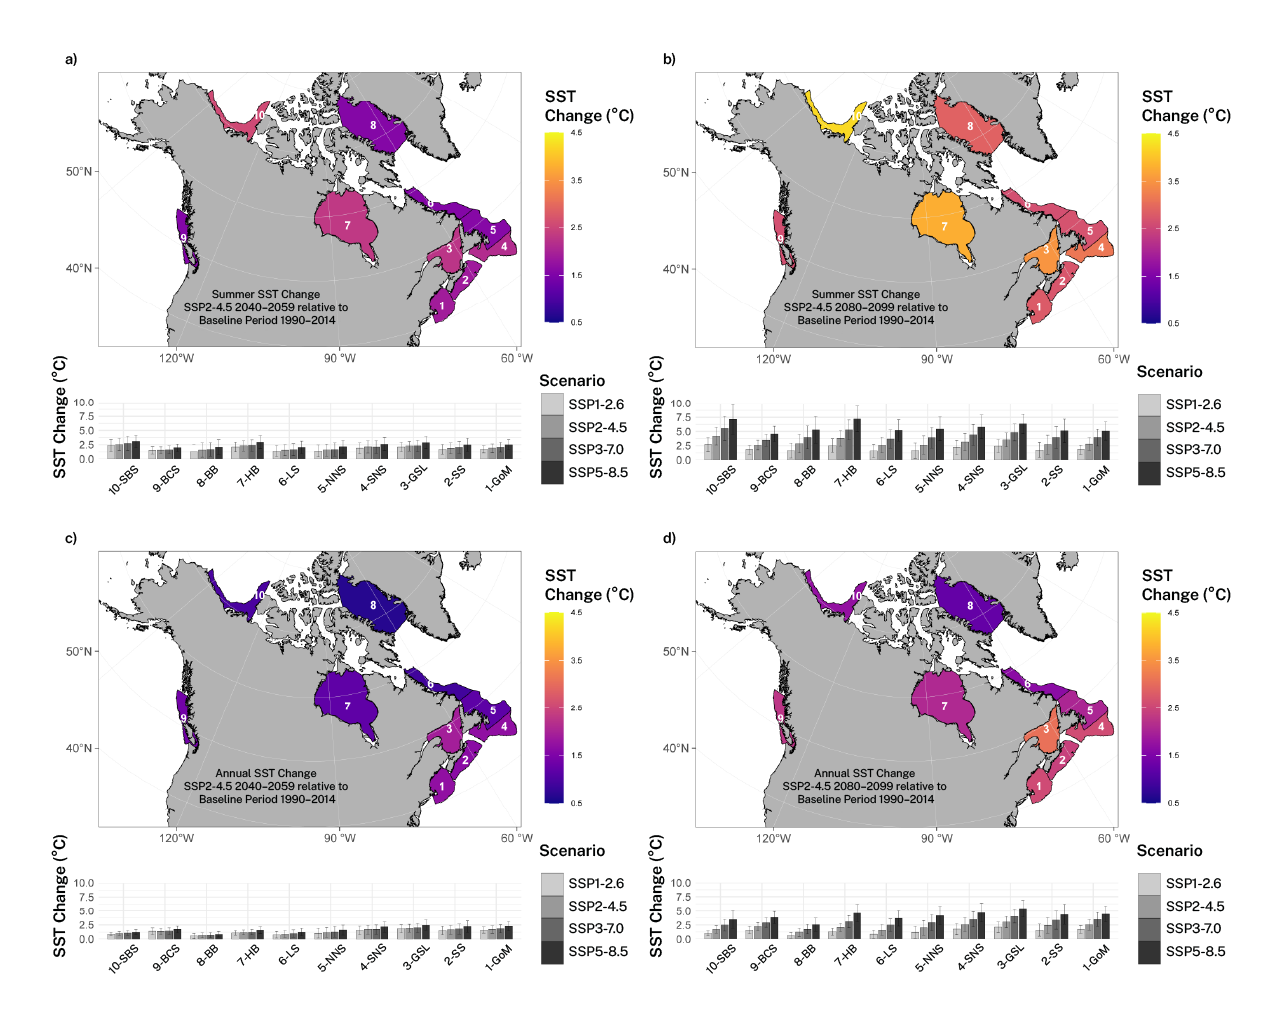
Figure 7.11 : Projected changes in sea surface temperature (SST) (in °C) in the ocean regions of Canada under the intermediate emissions scenario (SSP2-4.5) in a) and b) summer, and c) and d) annually by mid-century (2040–2059; left column) and late century (2080–2099; right column), relative to the 1990–2014 baseline period. The bar chart below the map shows the annual change expected in each region on the map under four emissions scenarios, with the error bars representing the standard error of the mean, based on the ensemble of 22 CMIP6 models. Area names: 1-GoM – Gulf of Maine, 2-SS – Scotian Shelf, 3-GSL – Gulf of St. Lawrence, 4-SNS – Southern Newfoundland Shelf, 5-NNS – Northern Newfoundland Shelf, 6-LS – Labrador Shelf, 7-HB – Hudson Bay, 8-BB – Baffin Bay, 9-BCS – British Columbia Shelf, and 10-SBS – Southern Beaufort Sea. Adapted from: Z. Wang et al. (2025).
7.2.3: Marine heatwaves and cold spells
Marine heatwaves are extended periods of unusually high ocean temperatures, when the temperature exceeds the 90th percentile threshold of the historically observed values at a specific location and time of the year. While these types of events are not new, they have occurred with increasing frequency and duration over the past century (Oliver et al., 2018). Marine heatwave characteristics (frequency, intensity, and duration) are strongly affected by anthropogenic climate change and are projected to exceed the range of natural variability in the early to mid-21st century (Oliver et al., 2021). The increased prevalence of marine heatwaves in the oceans around Canada (Figure 7.12) is a matter of particular concern, as these heatwaves may harm marine ecosystems. However, the extent to which they affect fish and other marine species remains unclear (Box 7.1). Marine cold spells, on the other hand, are extended periods of cooler than usual ocean temperatures. Marine cold spells are typically defined as a long stretch of ocean temperatures below the 10th percentile of historically observed values during the same period of the year. The topic of marine heatwaves and cold spells is an emerging research area that was not assessed in CCCR2019.
On the west coast of Canada, marine heatwaves became a topic of increased concern among the broader public with the onset of a record-breaking event in 2013 (Figure 7.12) referred to as “the Blob” (Bond et al., 2015). Anthropogenic GHG emissions have been shown to be partially responsible for this event, but there is also evidence that internal climate variability played a role (Weller et al., 2015). The cause of the Blob was a static high-pressure region in the atmosphere that created a heat dome (a blocking high; for more information on the 2021 Pacific Northwest heatwave on land, see Chapter 8, Box 8.2). This resulted in lower than normal rates of heat loss from the sea to the atmosphere, compounded by weaker than usual water circulation. The lack of air movement in the high-pressure area reduced the stirring of ocean surface waters by the winds and wind-forced currents (Bond et al., 2015). The Blob persisted into 2016, with unusually high ocean temperatures throughout the northeast Pacific, including coastal waters (Figure 7.12). This marine heatwave abated in 2017, but, in the summer of 2019, another extensive marine heatwave returned to the region and lasted three years, with temperatures 1.6°C above the 1983–2012 baseline (Barkhordarian et al., 2022). The likelihood is below 1% that the 2019–2021 heatwave could have occurred without the effects of anthropogenic GHGs (Barkhordarian et al., 2022). Natural variability over decades is evident in the heatwave record, with events recorded throughout the time series of satellite SST data. This may be related to large-scale climate processes (see Chapter 4), although this variability is less apparent in Atlantic Canada. In the future, feedback processes are projected to further amplify the intensity and spatial extent of summer marine heatwaves in the northeast Pacific (Athanase et al., 2024).
Box 7.1: Potential implications of marine heatwaves for aquatic ecosystems
Marine heatwaves have been observed in many parts of the global ocean, but their potential implications for coastal and ocean ecosystems, as well as the coastal and Indigenous communities that depend on the resources found there, remain poorly understood. Increases in the intensity, frequency, and duration of marine heatwaves are projected to accelerate under the intermediate (RCP4.5) and very high (RCP8.5) emissions scenarios, with nearly permanent heatwave conditions occurring in many parts of the global ocean by the late 21st century (Oliver et al., 2019). On the basis of these projections, effects on marine ecosystems are expected to be widespread, substantial, and persistent. Biological responses to marine heatwaves occur at the individual, population, and community levels, and typically intensify toward the edges of species’ geographical ranges, where species are likely to already be near the limit of their thermal tolerance (Smith et al., 2023).
In particular, the 2013–2016 marine heatwave in the northeast Pacific—nicknamed “the Blob”—has attracted a great deal of attention. The Blob resulted in, among others, shifts in the geographical distribution of more than 200 marine species, the closure of commercially important fisheries, and mass strandings of marine mammals and seabirds (Cavole et al., 2016; Starko et al., 2025). In addition, this heatwave drove kelp forest declines, reorganized plankton communities, altered offshore oceanographic productivity, and impacted seagrass meadows and intertidal habitats (Starko et al., 2025). Pacific Cod, which accounts for one third of the value of the groundfish harvest in the Gulf of Alaska, experienced a 71% decline in abundance between 2015 and 2017 (Barbeaux et al., 2020). The species may have had greater calorie requirements during this extended marine heatwave, and this, combined with reduced prey supply, could explain the population decline. The fact that the heatwave coincided with a period of historically low abundance of young cod (larvae and juveniles) suggests that the stock’s recovery will be slow (Barbeaux et al., 2020). In addition, an unexpected collapse of the eastern Bering Sea Snow Crab population in 2021 in this region has been linked to a marine heatwave in 2018 and 2019 (Szuwalski et al., 2023).
Ecosystem models have been used to examine the cascading effects of marine heatwaves on ecosystem structure and function in the northeast Pacific Ocean before and after the onset of recent heatwaves (Gomes et al., 2024). Following the heatwaves, the species composition of the marine community changed and included the addition of some northward-expanding species. The altered food web relationships and energy flux resulting from marine heatwaves have potentially profound consequences on ecosystem structure and function, and raise concerns for populations of threatened and harvested species. Projections for the 21st century in the northeast Pacific indicate that, under a very high emissions scenario (RCP8.5), marine heatwaves will result in both decreases in fish biomass and shifts in the geographic distribution of fish stocks that will be greater in magnitude and will occur faster than under the effects of long-term average changes in temperature alone (Cheung & Frölicher, 2020).
Not all studies have found exclusively negative impacts on marine species from marine heatwaves. Fredston et al. (2023) investigated the effects of sea-bottom heatwaves from 1993 to 2019 on marine fishes by analyzing samples from long-term scientific surveys of continental shelf ecosystems from the subtropics to the Arctic. They showed that the effects of marine heatwaves on fish biomass were often minimal and could not be distinguished from natural and sampling variability. Furthermore, marine heatwaves were not consistently associated with changes in ecosystem structure (i.e., a gain of warm-water species and loss of cold-water species). Although steep declines in biomass occasionally occurred after marine heatwaves, they were the exception rather than the rule.
On the northwest Atlantic continental shelf, nearly half of observed marine heatwaves have been initiated by the transfer of heat to the ocean from the overlying atmosphere, but less than one fifth of marine heatwaves have ended because of the inverse process. This suggests that oceanic processes such as ocean currents and mixing are the primary drivers of the collapse of most marine heatwaves in this region. Three primary large-scale weather patterns are correlated with the onset of marine heatwaves in the northwest Atlantic: low-pressure cyclonic autumn-winter systems, high-pressure anticyclonic spring-summer blocking, and mild but long-lasting summer blocking (see Chapter 4, section 4.4, for definitions) (Schlegel et al., 2021). The Gulf Stream’s proximity to southern Atlantic Canada may also be a factor, as was observed in 2015–2016, when warm water from the Gulf Stream created marine heatwave conditions (Perez et al., 2021). The number of days per year with heatwave events has been consistently greater in the Scotian Shelf and Gulf of Maine region since 2012 compared to the 1991–2020 baseline period, except in 2019 (Figure 7.12). The annual number of marine heatwave days in the Gulf of St. Lawrence and Newfoundland and Labrador regions peaked in 2012, or thereabouts, before declining for about seven years and then increasing again starting in 2019.
In the Arctic Ocean, marine heatwaves are influenced by the complex relationship between sea ice, the atmosphere, and the ocean. Most Arctic marine heatwaves are generated by the transfer of heat from the atmosphere to the ocean’s surface layer during periods when there is no sea ice. Some of this heat may then be transported to the subsurface ocean. Oceanic circulation can also propagate marine heatwaves along the continental shelf and toward the marginal ice zone (the transitional area between open ocean and sea ice). When sea ice melts, it creates a thin, fresh, buoyant upper layer on the ocean, which inhibits vertical mixing, and thereby contributes to longer and more intense marine heatwaves at the ocean surface. The additional heat stored in the subsurface ocean as a result of climate change can be expected to resurface later in the season, in turn delaying the formation of new sea ice (Richaud et al., 2024). Barkhordarian et al. (2024) assessed Arctic heatwaves since the beginning of the 21st century, analyzing four heatwaves in the Arctic Ocean in 2007, 2012, 2019, and 2020 using event attribution methods (see Chapter 8, section 8.1, for a description of the methods). They concluded that marine heatwaves of the intensity observed would be unlikely without human-caused climate change and that the 2007 and 2020 heatwaves, which were the warmest on record, would be exceptionally unlikely. They also suggested that, if greenhouse gas emissions continued to increase, marine heatwaves of moderate intensity would very likely consistently reoccur in the Arctic Ocean. Projections based on an ensemble of CMIP6 models indicate that the increase in the average intensity of marine heatwaves in the Arctic is expected to exceed the average global increase, with the ratio being as high as 7.6 times under the very high emissions scenario (SSP5-8.5) (He et al., 2024).
Marine heatwaves do occur below the ocean surface and can affect the seabed on relatively shallow continental shelves. Our understanding of the intensity, frequency, and duration of subsurface heatwaves is limited by the paucity of temperature observations in this part of the ocean. Many species spend much of their life cycle in the water column or on the seabed, so subsurface heatwaves may have important implications for marine ecosystems. In one study, a high-spatial-resolution reanalysis, which combined observed data and computer models, was used to assess bottom marine heatwaves on the continental shelves of North America (Amaya et al., 2023). A key finding of this research is that heatwave intensity and duration during the study period (1993–2019) varied strongly with bottom depth, with typical intensities ranging from 0.5 to 3.0°C. In addition, bottom heatwaves can be more intense and persist longer than those at the surface (Jackson et al., 2018). While bottom and surface marine heatwaves often co-occur, this is not always the case, especially in deeper regions (Amaya et al., 2023). In regions with complex bathymetry (sea floor topography) such as Atlantic Canada, bottom heatwave intensities vary greatly, with more intense events typically found over shallow banks. On the Scotian Shelf, the increasing trend in bottom temperatures has been stronger than that in SSTs over the 1993–2023 period, with the total number of bottom marine heatwave days per year increasing substantially over this period (Zhai, Lu, Wang, et al., 2025).
In summary, we have assessed that the annual number of marine heatwave days in surface waters has increased in the last several decades in the oceans around Canada. While there is also evidence of an increase in marine heatwave days in the subsurface waters of some ocean regions around Canada, the paucity of data below the ocean surface poses a challenge for assessing trends in most regions.
Figure take-away: The annual number of marine heatwave days in the oceans around Canada has increased markedly in the last few decades.
Figure title: Annual number of marine heatwave days
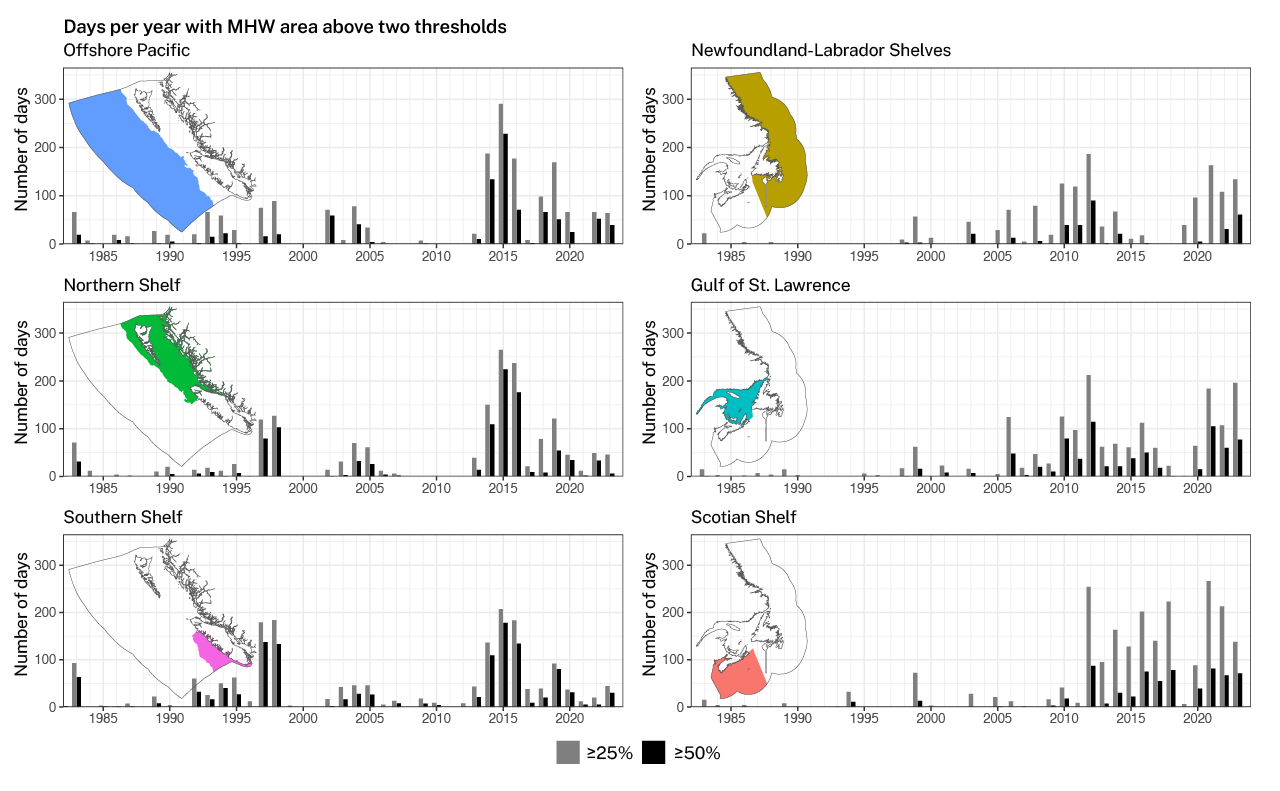
Figure 7.12 : Number of days per year in which a marine heatwave (MHW) was present in six areas along Canada’s Atlantic and Pacific coasts, each shown on a map superimposed on the graph, with Pacific and Atlantic regions shown in the left and right columns respectively, based on Optimal Interpolation Sea Surface Temperature data provided by the US National Oceanic and Atmospheric Administration (NOAA). Daily SST anomaly values were obtained, using a 1991−2020 baseline period, by employing the methodology outlined in Hilborn et al. (2025). The bars indicate the number of days per year in which 25% (grey) and 50% (black) of the area in the zone defined in the map met marine heatwave criteria (Hobday et al., 2016). Adapted from: Hilborn et al. (2025).
Marine cold spells have not been studied as intensively as marine heatwaves, and therefore the literature on which this assessment is based is more limited than that for marine heatwaves. The intensity of marine cold spells and the number of marine cold spell days per year are decreasing in most global oceans, which is largely attributable to sea surface warming due to anthropogenic climate change (Y. Wang et al., 2022). Some regional differences can be observed in the trends for the intensity of marine cold spells and marine heatwaves, which can be largely explained by changes in SST variability (Y. Wang et al., 2022). This global trend of diminishing marine cold spells is projected to continue this century as the atmosphere and ocean continue to warm; however, the average duration and total days of marine cold spells are projected to increase in the sub-polar North Atlantic (predominantly the northeastern portion) as a result of the weakening of the Atlantic Meridional Overturning Circulation, according to CMIP6 model ensemble simulations (Yao et al., 2022). While the decreasing number of marine cold spells could be viewed as beneficial to marine ecosystems owing to the reduction in cold stress, it could also alter regional temperature norms and have important consequences for ecological structure and function (Schlegel et al., 2021).
7.2.4: Confidence terms in key messages: summary of evidence
[Key messages are provided here for ease of review but may not appear in this section in final text.]
Key Message 7.1: Ocean temperatures around Canada have increased in ice-free periods since the mid-20th century (high confidence). This increase is consistent with the warming observed in the global upper ocean, for which human influence is extremely likely to be the main driver. The largest increase in annual average sea surface temperatures has been observed adjacent to southern Atlantic Canada (high confidence). By season, the greatest warming has occurred in summer and extends throughout the ocean bordering eastern Canada, including Hudson Bay (high confidence).
The evidence for historical SST values was obtained from an analysis of the HadISST data product, a gridded global dataset widely used to obtain data on SSTs and sea ice concentrations (Rayner et al., 2003). HadISST combines observations from various sources, including ships, buoys, and satellites, along with statistical spatial interpolation methods, to create global coverage of SST and sea ice data. Previous analyses comparing HadISST with other historical SST products have shown that these products have produced similar results in terms of long-term trends (i.e., since the 1950s) (Loder & Wang, 2015). The evidence base is strong for historical SST changes in the oceans around Canada during ice-free periods, leading to an assessment of high confidence in the changes observed. Although more limited coverage is available for subsurface ocean temperatures than for SSTs, the in situ subsurface data from long-term ocean monitoring programs are of high quality and support the findings of the SST analysis. The IPCC AR6 WGI SPM report assessed that human influence is extremely likely to be the main driver of the increased warming of the upper ocean (IPCC, 2021).
Key Message 7.2: Continued warming is projected for the oceans around Canada, with the magnitude increasing with higher greenhouse gas emissions (high confidence). The increase in annual average sea surface temperature is expected to be greater in the waters next to Atlantic Canada and British Columbia than in the Arctic (medium confidence). During the summer period, sea surface temperatures are expected to increase the most in the Beaufort Sea and Hudson Bay, in part due to the decline of seasonal sea ice cover there (medium confidence).
Evidence for SST projections is provided by an ensemble of 22 CMIP6 models (Z. Wang et al., 2025). We have presented the projected SST changes in Canadian shelf waters in the three oceans between the historical period of 1990–2014 and the future periods of 2040–2059 (mid-century) and 2080–2099 (late century), for 10 regions of similar oceanographic characteristics. In the Arctic Ocean, the Canadian Arctic Archipelago is mostly ice-covered, and hence has not been assessed. The southern Beaufort Sea, Hudson Bay, and Baffin Bay are seasonally ice-free and are therefore included in this assessment. The 22‑member ensemble of CMIP6 models provides consistent evidence for continued warming in the oceans around Canada during ice-free periods of the year under all emissions scenarios, leading to high confidence in the assessment for all oceans considered together. However, the ensemble’s modelled SST projections have substantial differences at the regional scale, resulting in an assessment of medium confidence in the regional comparisons of the projected increases in the Atlantic, Pacific, and Arctic oceans. The challenges of simulating seasonal sea ice in CMIP6 models also contribute to the assessment of medium confidence in the projected regional differences in summertime ocean warming.
Key Message 7.3: More frequent and intense marine heatwaves have been observed in the Pacific and Atlantic oceans around Canada since the 1980s and are expected to continue to increase in all oceans, including the Arctic, because of human-caused climate change (high confidence).
Multiple lines of evidence from the primary literature support our assessment that the frequency and magnitude of marine heatwaves are increasing in the oceans around Canada and that these increases can be expected to continue in tandem with increases in the average SST (Amaya et al., 2020, 2023; Athanase et al., 2024; Bond et al., 2015; Oliver et al., 2021; Perez et al., 2021; Schlegel et al., 2021; Weller et al., 2015). Our assessment presents a regional analysis of the number of days per year in which a marine heatwave was present in areas adjacent to the Atlantic and Pacific coasts of Canada. These results were derived from the widely used Optimal Interpolation Sea Surface Temperature data product from the US National Oceanic and Atmospheric Administration (Huang et al., 2020). The consistent evidence and agreement from multiple sources have led to an assessment of high confidence in this key message.
7.3: Ocean salinity and stratification
Key Message 7.4: The surface waters of the oceans around Canada are characterized by relatively low salinity and have become even fresher since the 1950s (high confidence). The increasing freshwater input to these oceans results from warming-driven increases in precipitation and runoff from land, which includes glacier and ice sheet meltwater (high confidence). Ocean freshening is projected to continue throughout the 21st century; however, the limited number of emissions scenarios studied and the variability among model projections have resulted in low confidence for the Arctic and medium confidence for the Atlantic and Pacific.
Key Message 7.5: Increased stratification, or layering of the upper ocean according to water density, in the northeast Pacific and southern Atlantic Canada regions has resulted from warming and freshening of the sea surface (high confidence). Increased stratification reduces the vertical mixing of nutrients and other chemical compounds in the upper ocean, which is an important process in the marine ecosystem.
The ocean is a key part of the Earth’s water cycle (see Chapter 5, Figure 5.1), and changes in rates of evaporation and precipitation are reflected in the salinity, or saltiness, of sea surface waters (Helm et al., 2010). Salinity can also change in response to freshwater runoff from land (e.g., from glaciers or precipitation), the melting and freezing of sea ice, and ocean circulation and mixing. Long-term changes in sea surface salinity (SSS) can affect deeper waters through large-scale processes such as the Atlantic Meridional Overturning Circulation (see Chapter 4 for details). Ocean salinity,Footnote 9 together with temperature and depth, determines the density of seawater, which, in turn, affects ocean circulation, vertical density stratification (see Box 7.4 in CCCR2019) (Greenan et al., 2019), and vertical mixing.
Globally, it is virtually certain that, since 1950, high-salinity near-surface regions of the ocean have become more saline, while low-salinity regions have become fresher (less saline), with medium confidence that this is linked to the intensification of the water cycle. It is extremely likely that human influence has contributed to these changes in salinity and that the large-scale pattern will increase in amplitude over the rest of the 21st century (medium confidence) (IPCC AR6 WGI TS.2.4) (Arias et al., 2021).
Changes in stratification, which refers to the difference in density between the top and bottom portions of an ocean layer, are important because increased stratification may reduce the ocean’s ability to absorb carbon dioxide from human activities, thereby amplifying global warming (see Chapter 9, section 9.5.2, for more information on the ocean carbon cycle). An increase in stratification could also reduce the transport of nutrients to the upper ocean, affecting food sources at the base of the marine food web. Observed stratification in the upper ocean (depths of 0–200 m) has increased globally since at least 1970 (virtually certain) (IPCC AR6 WGI TS.2.4) (Arias et al., 2021). The stratification of this layer is assessed to have increased by 4.9% (3.4−6.4%) over the period from 1970 to 2018 (high confidence), with even greater increases at the base of the well-mixed layer near the ocean surface, which is usually a few tens of metres thick. Upper-ocean stratification will continue to increase throughout the 21st century (virtually certain) (IPCC AR6 WGI TS.2.4) (Arias et al., 2021).
In this section, we will present observed changes in sea surface and subsurface salinity in the oceans around Canada. Long-term satellite observations of sea surface salinity (SSS) are not available (unlike those of temperature), and therefore this section will be limited to in situ data. Changes in stratification at a few representative locations will be discussed. We will also discuss projections of salinity and stratification changes.
7.3.1: Past changes
Ocean salinity observations span a more limited period than those for temperature, primarily because salinity has historically been more difficult to measure. In this assessment, we have used observations of ocean salinity on the continental shelves around Canada, primarily acquired by Fisheries and Oceans Canada research vessels and BC lighthouse stations, supplemented by a small number of moored instruments and, more recently, autonomous underwater vehicles. Since SSS observations from satellites have only become available in the last decade (unlike satellite sea surface temperature observations, which have been available for a longer time), these products are not yet suitable for exploring past changes related to climate.
In Canada’s Pacific waters, variability in coastal SSS values is strongly related to variability in freshwater runoff, and weakly related to wind forcing (Cummins & Masson, 2014). The composite lighthouse data (see section 7.2.1 for station descriptions) show a long-term declining trend in SSS values occurring at a rate of -0.17 (-0.46 to 0.11)Footnote 10 per century, but it is not significant at the 5% level (meaning that there is a ≤ 5% chance of concluding that an effect or trend exists when it does not) (Figure 7.13). The SSS in the northeast Pacific (measured at Station Papa) is also decreasing, at a rate of 0.27 (-0.42 to -0.12) per century (Cummins & Ross, 2020; Freeland, 2013). This is broadly associated with the intensification of the water cycle (Douville et al., 2021) and the considerable input of meltwater from Alaskan glaciers into the North Pacific (Slater et al., 2021; Zemp et al., 2019).
Figure take-away: Sea surface salinity along the British Columbia coast has decreased slightly over the past eight decades, but exhibits strong variability from decade to decade.
Figure title: Sea surface salinity anomalies along the British Columbia coast
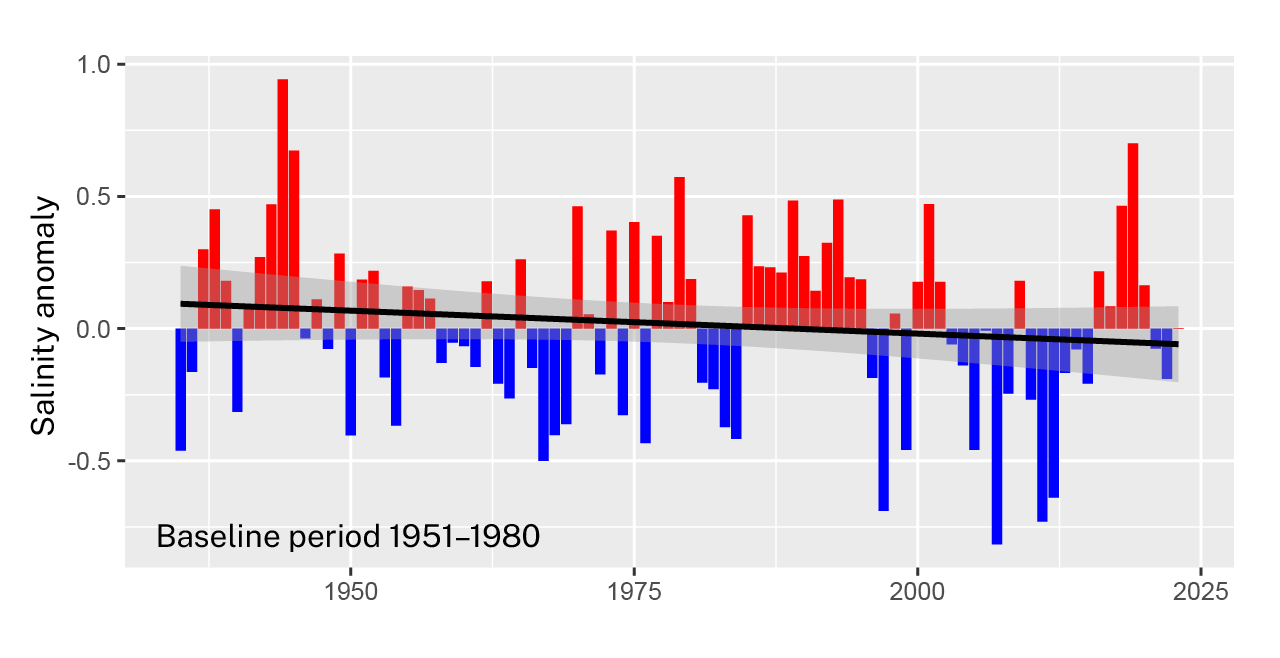
Figure 7.13: Trend in the annual average sea surface salinity (SSS) anomaly, based on a composite of observations from lighthouse stations in British Columbia, with a baseline period of 1951–1980. The vertical bars represent the average anomalies for all locations, with the red bars representing measurements above the 1951–1980 average and the blue bars, measurements below that average. The grey shaded area shows the 95% confidence interval for the linear fit (black line, -0.17 per century). The trend is not significant at the 5% level (≤ a 5% chance of concluding that an effect or trend exists when it does not). Adapted from: Boldt et al. (2023). Source: Fisheries and Oceans Canada (2020b).
The time series of stratification in the permanent pycnocline (the transitional region between the surface layer of warmer and less dense water and the deeper layer of colder and more dense water) at Station Papa shows a trend toward increased stratification, which has been particularly marked in recent decades (Figure 7.14 ). This increase is a response to the warming and freshening of the ocean’s surface layer, which makes the surface water less dense and therefore more difficult to mix down into the water column. Water density is measured in kg per m3, and the greater the difference in density between the two layers (which represents stratification), the greater the stratification. The resulting trend line (least squares) shows an increase in stratification of 0.23 kg (0.09–0.37 kg) per m3 per century. This is significant at the 5% level (meaning that there is ≤ a 5% chance of concluding that an effect or trend exists when it does not).
Figure take-away: A long-term increase in stratification, combined with decade-to-decade variability, is evident in the northeast Pacific Ocean over the last seven decades.
Figure title: Stratification in the upper ocean layer at Station Papa
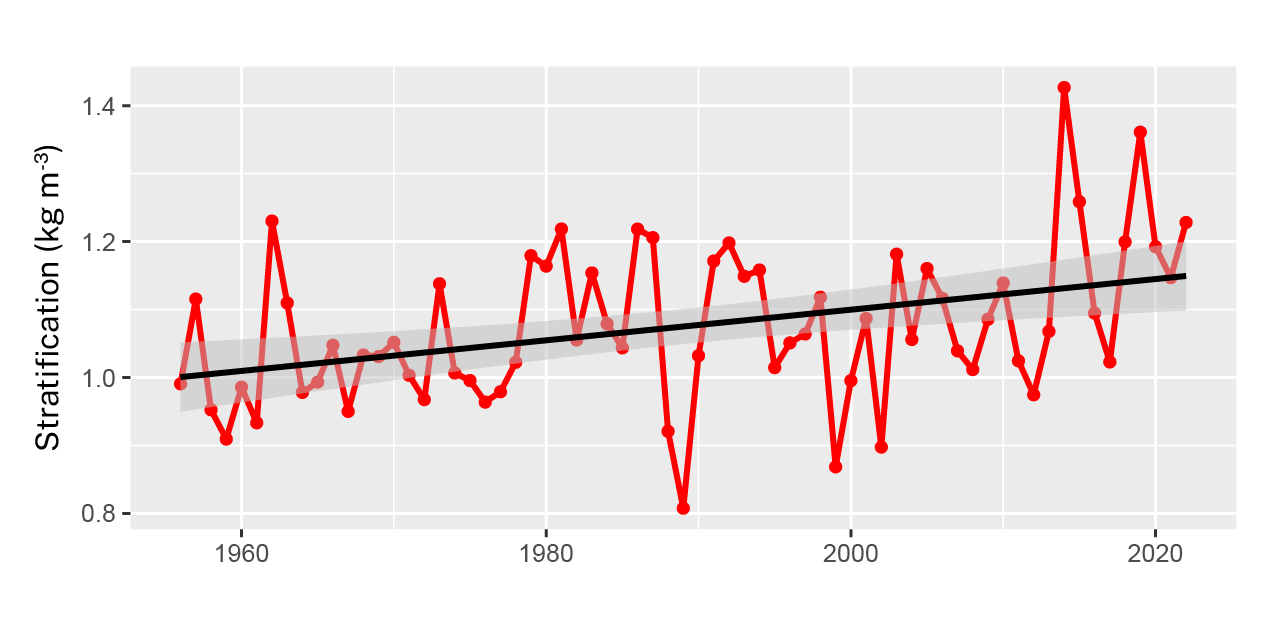
Figure 7.14 : Differences between annual average density at the depths of 70 m and 200 m (stratification) at Station Papa in the northeast Pacific Ocean, in kg m−3 (kg per m3), over the 1956–2022 period. The black line shows the overall trend. Stratification is increasing at 0.23 kg per m3 per century. The grey shaded area represents the 95% confidence interval for the linear fit. The trend is significant at the 5% level (i.e., there is ≤ a 5% chance of concluding that an effect or trend exists when it does not). Adapted from: Cummins and Ross (2020).
In the subsurface waters below the permanent pycnocline at Station Papa, annual average salinity values show a slight declining trend (significant at the 5% level, meaning that there is ≤ a 5% chance of concluding that an effect or trend exists when it does not) at the depth range of 300–1500 m (Cummins & Ross, 2020). In contrast, deep-water fjords along the British Columbia coast have experienced a slight increase in salinity, from 0.1 to 0.2, over the past 70 years, but the trend is not significant at the 5% level (≤ 5% chance of concluding that an effect or trend exists when it does not) (Jackson et al., 2021).
In the waters around Atlantic Canada, SSS values on the Scotian Shelf ( Figure 7.15 ) have decreased at a rate of 0.43 (-0.65 to -0.21) per century (Hebert et al., 2024). The presence of seasonal sea ice in the Gulf of St. Lawrence and on the Newfoundland and Labrador shelves makes it difficult to estimate long-term surface trends based on annual averages. However, the deep waters of the Gulf of St. Lawrence do show long-term changes in subsurface salinity in that region (Figure 7.16 ). All three depth layers have increased in salinity at rates ranging from 0.22 to 0.32 per century, with the deepest layer (300 m) increasing the fastest. This is a result of the increasing influence of salty subtropical water entering the Gulf of St. Lawrence through the Laurentian Channel (a deep channel that extends to the edge of the continental shelf south of Newfoundland and Nova Scotia).
Figure take-away: Sea surface salinity on the Scotian Shelf has decreased over the last eight decades, while also exhibiting year-to-year and decade-to-decade variability.
Figure title: Annual average sea surface salinity anomalies on the Scotian Shelf
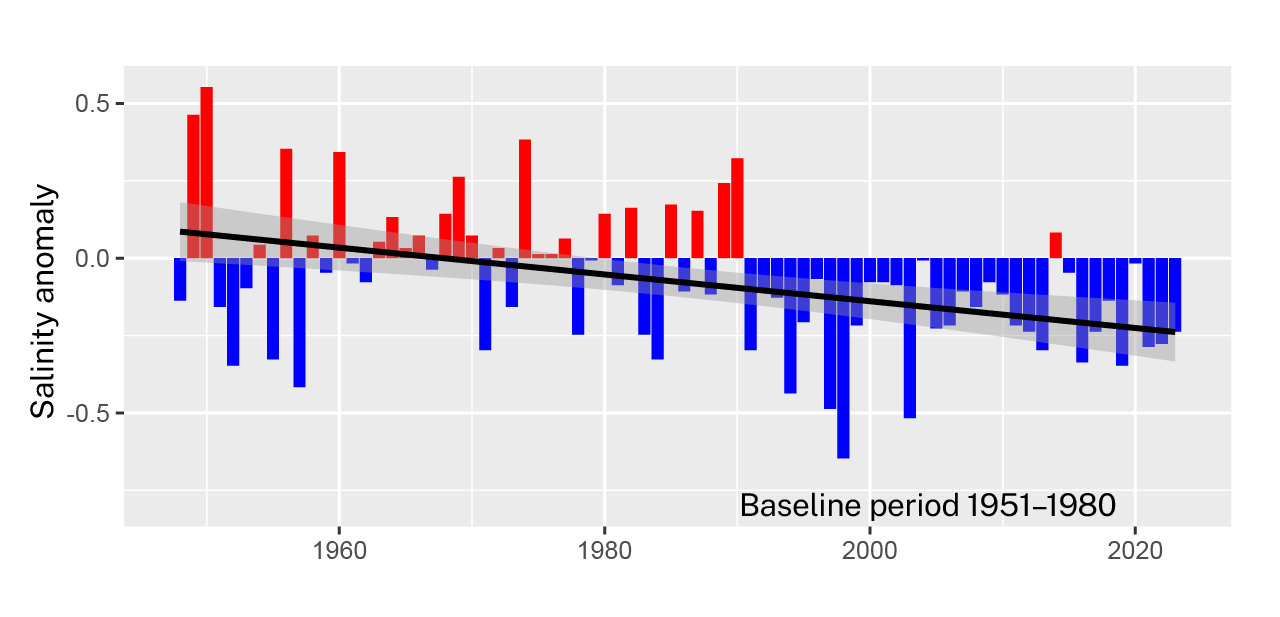
Figure 7.15 : Trend in the annual sea surface salinity (SSS) anomaly, based on a composite of observations in the Scotian Shelf region, with a baseline period of 1951–1980. The vertical bars represent the average anomalies for the region, with red bars representing measurements above the 1951–1980 average and blue bars, measurements below that average. The grey shaded area shows the 95% confidence interval for the linear fit of a declining trend of -0.43 per century (black line). The trend is significant at the 5% level (meaning that there is ≤ a 5% chance of concluding that an effect or trend exists when it does not). Adapted from: Hebert et al. (2024).
Figure take-away: Subsurface ocean salinity has increased over the long term at three depth horizons in the Gulf of St. Lawrence.
Figure title: Subsurface ocean salinity in the Gulf of St. Lawrence
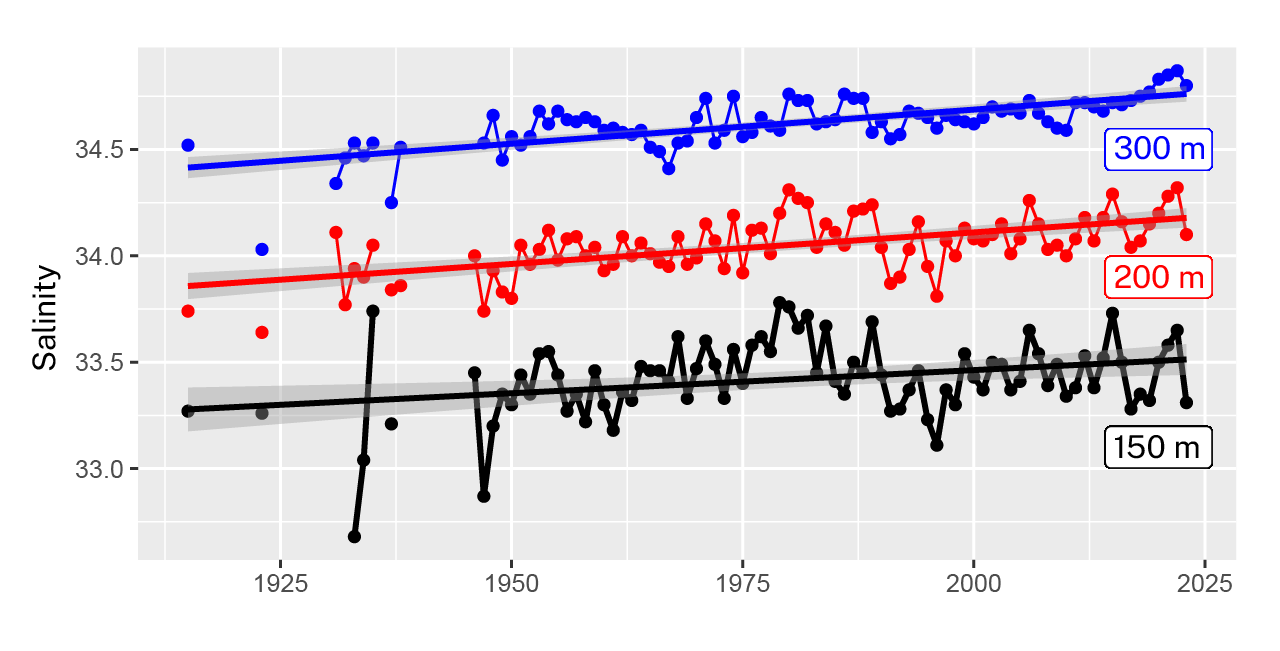
Figure 7.16 : Time series of annual average seawater salinity values at three depths in the Gulf of St. Lawrence. The linear regression slopes show changes in salinity at different depths: 0.22 (0.07–0.36) per century at a depth of 150 m, 0.30 (0.21–0.38) per century at 200 m, and 0.32 (0.25– 0.39) per century at 300 m. The grey shaded areas show the 95% confidence interval for the linear fits. The trends are significant at the 5% level (i.e., there is ≤ a 5% chance of concluding that an effect or trend exists when it does not). Adapted from: Galbraith et al. (2024).
Stratification of the upper water column in the St. Lawrence Estuary has been highly variable over the last decade, with no long-term trend observed (R. Y. Bernier et al., 2023). On the Scotian Shelf, annual average stratification has been increasing at a rate of 0.77 kg (0.51 to 1.02 kg) per m3 per century (Figure 7.17 ). This change in average stratification is due mainly to a decrease in surface density, for which warming and freshening are equally responsible (Hebert et al., 2024). Stratification on the Newfoundland Shelf has increased modestly at a rate of 0.16 kg (-0.07 to 0.38 kg) per m3 per century since the start of the data record in the late 1940s; however, this trend is not significant at the 5% level (≤ 5% chance of concluding that an effect or trend exists when it does not) (Figure 7.17 ).
Figure take-away: Upper ocean stratification has increased in the northwest Atlantic over the last seven decades, but at a faster rate on the Scotian Shelf than on the Newfoundland Shelf.
Figure title: Upper ocean stratification on the Scotian and Newfoundland shelves
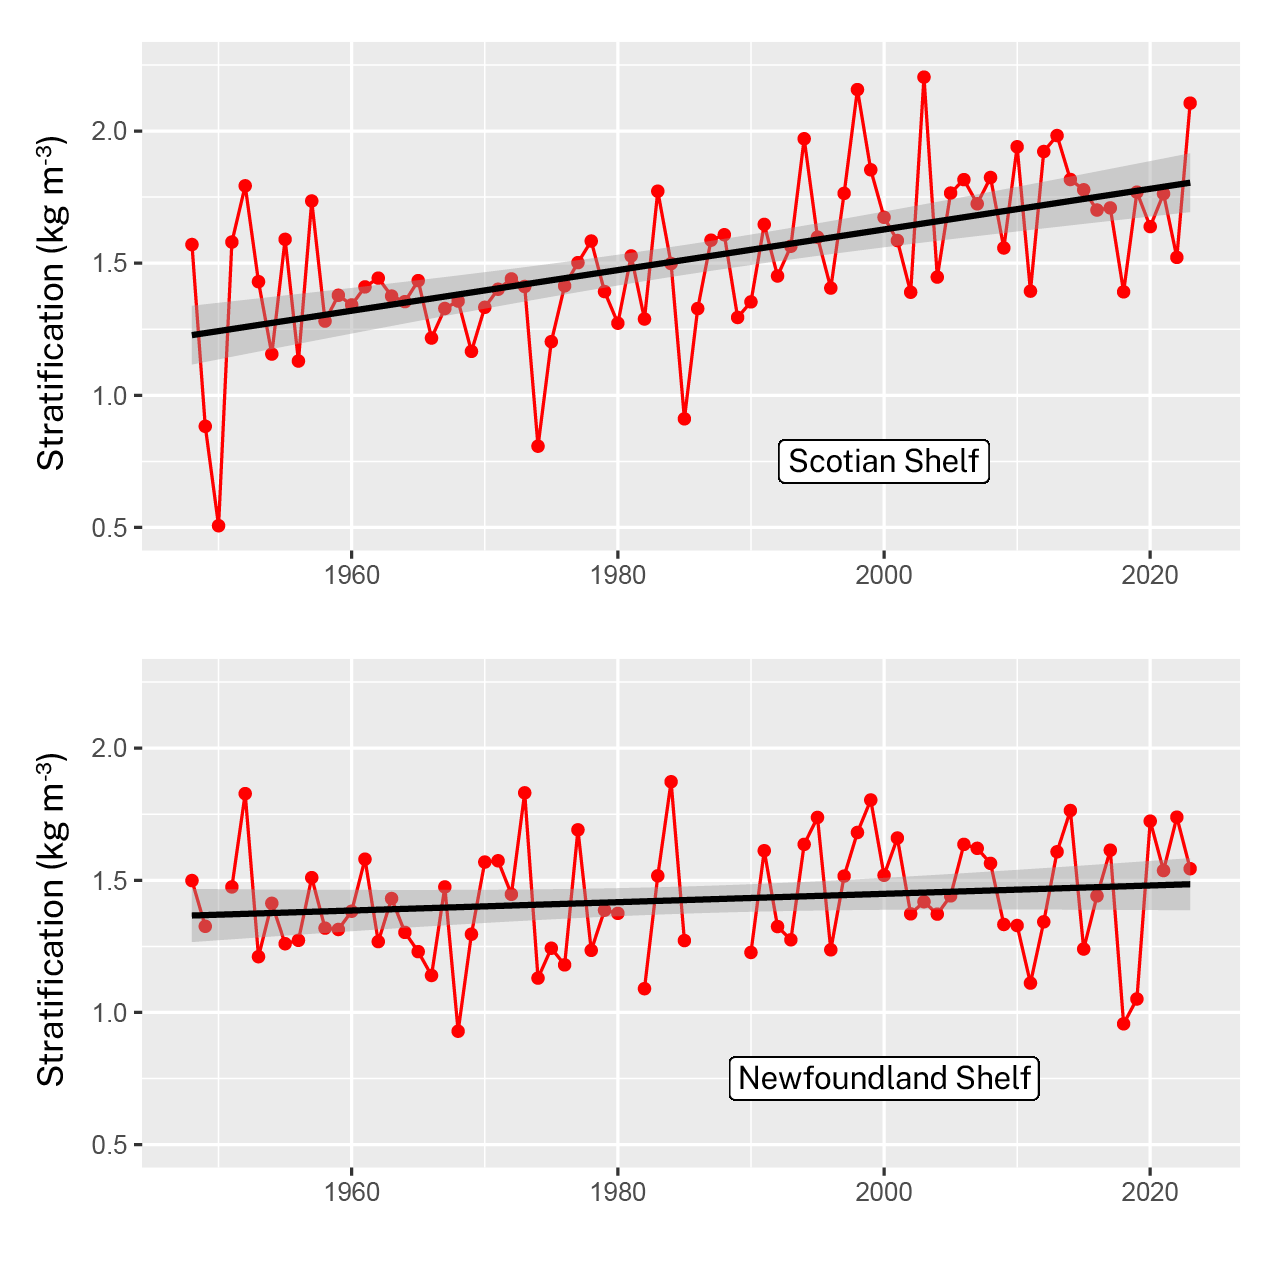
Figure 7.17 : Stratification in the upper ocean (0−50 m depths) in kg m−3 on the Scotian and Newfoundland shelves. The trend lines show linear regression slopes of 0.77 kg (0.51 to 1.02 kg) per m3 per century for the Scotian Shelf and 0.16 kg (-0.07 to 0.38 kg) per m3 per century for the Newfoundland Shelf. The trend for the Scotian Shelf is significant at the 5% level (i.e., there is ≤ a 5% chance of concluding that an effect or trend exists when it does not), but the trend for the Newfoundland Shelf is not significant at the 5% level. Adapted from: R. Y. Bernier et al. (2023); Cyr et al. (2024); Hebert et al. (2024).
In the Arctic, data collected in the waters over the Canadian Polar Shelf only cover the last two to three decades. On the Mackenzie Shelf (southern Beaufort Sea), no significant change has been observed in bottom salinity (at approximately 50 m in depth) (Niemi et al., 2024). In Barrow Strait (Canadian Arctic Archipelago), statistically significant decreasing trends have been observed (-0.33 per decade at depths of 35–50 m and -0.11 per decade at depths of 135–155 m) (Niemi et al., 2024). Moored measurements cannot be acquired near the ocean surface in the Arctic because of the hazards related to seasonal sea ice. Consequently, stratification changes in the upper ocean are hard to assess. The melting of sea ice and land-based glaciers would imply that a freshening trend is occurring; therefore, stratification would also be expected to increase. However, ship-based observations during the ice-free season provide insufficient evidence to determine long-term trends in the Arctic.
The drivers of the observed decreases in SSS values also include increased annual precipitation and runoff from land. These processes have been assessed in other chapters of this report and are summarized here. In terms of precipitation, there is very high confidence that, overall, annual average precipitation has increased in Canada since 1948, with larger percentage increases in Northern Canada (Chapter 2, section 2.5). There is less confidence in the magnitude of these changes, however (Chapter 2, section 2.5). Since the mid-2000s, the rate of mass loss from glaciers in Canada as a whole has been sustained or has increased. This has been driven mainly by warming temperatures (high confidence) and darkening ice surfaces (Chapter 6, section 6.5). Glaciers in Western Canada are among the fastest-thinning glaciers in the world (high confidence) (Chapter 6, section 6.5).
7.3.2: Future changes
Ocean salinity simulations have improved in CMIP6 (relative to CMIP5), and salinity biases have been reduced (medium confidence), although the structure of the biases strongly reflects those of CMIP5 (IPCC AR6 WGI 9.2.2.2) (Fox-Kemper et al., 2021). Regional salinity biases are at least partially the result of the challenges faced in simulating ocean dynamics in the models (Levang & Schmitt, 2020). On the global scale, projected salinity changes in the subsurface ocean reflect changes in the rates of formation of water masses or their newly formed properties and follow the pattern of “fresh gets fresher, salty gets saltier” (medium confidence) (IPCC AR6 WGI 9.2.2.2) (Fox-Kemper et al., 2021). At this point, CMIP6-based projections of changes in ocean salinity focusing on the oceans around Canada are limited.
As discussed in section 7.2.2, at the time of this assessment, regional downscaled modelling studies of the oceans around Canada were limited to the emissions scenarios featured in the IPCC AR5. Along the Pacific coast of Canada, surface salinity is projected to decrease and upper ocean stratification, to increase, under the intermediate (RCP4.5) and very high (RCP8.5) emissions scenarios (Holdsworth et al., 2021; Peña & Fine, 2024). Salinity projections for the waters around Atlantic Canada pose a major challenge because of the role of internal climate variability and the presence of seasonal sea ice. In the Atlantic region, upper ocean salinity is generally projected to decrease, which would in turn increase stratification, although there is considerable spread between the models (Han et al., 2025; Lavoie et al., 2020).
In the Arctic, CMIP6 models vary widely in projected salinity and temperature changes (Langehaug et al., 2023), particularly in shallow shelf seas with strong river inflow (Steiner & Reader, 2024). Some CMIP6 models suggest increasing salinity in the upper ocean, and thus a weakening of ocean stratification, while others indicate upper ocean freshening that is much stronger than the multi-model average, and thus a clear increase in ocean stratification (Khosravi et al., 2022). Hence, caution is needed in using global climate models for projections in this region of rapid climate change.
7.3.3: Confidence terms in key messages: summary of evidence
[Key messages are provided here for ease of review but may not appear in this section in final text.]
Key Message 7.4: The surface waters of the oceans around Canada are characterized by relatively low salinity and have become even fresher since the 1950s (high confidence). The increasing freshwater input to these oceans results from warming-driven increases in precipitation and runoff from land, which includes glacier and ice sheet meltwater (high confidence). Ocean freshening is projected to continue throughout the 21st century; however, the limited number of emissions scenarios studied and the variability among model projections have resulted in low confidence for the Arctic and medium confidence for the Atlantic and Pacific.
It is virtually certain that near-surface high-salinity regions have become more saline since 1950, while low-salinity regions have become fresher in the global oceans as a whole (IPCC AR6 WGI TS.2.4) (Arias et al., 2021). We have used multiple regional data sources and publications to assess historical changes in ocean salinity in the oceans around Canada. Our results align with the IPCC AR6 global assessment (IPCC AR6 WGI TS.2.4) (Arias et al., 2021) and demonstrate the freshening of the upper ocean in the sub-polar and Arctic waters around Canada. This combination of global and regional analyses has led to an assessment of high confidence in the historical changes in salinity. The assessment of high confidence that increases in annual precipitation and runoff from land have resulted in an increase in freshwater supply to the surface ocean around Canada is supported by cross-referencing assessments in chapters 2 and 6 of this report.
The evidence for the projected ocean salinity changes is based on the global assessment by IPCC AR6, as well as some subsequent supporting publications focused on CMIP6 projections for the Arctic Ocean. The regional projections for Canada’s Atlantic and Pacific waters are restricted to analyses based on CMIP5 models, and these studies do not use a large ensemble of global models or scenarios. The combination of high uncertainty in Arctic projections and limited regional downscaling has led to an assessment of medium confidence in future salinity changes.
Key Message 7.5: Increased stratification, or layering of the upper ocean according to water density, in the northeast Pacific and southern Atlantic Canada regions has resulted from warming and freshening of the sea surface (high confidence). Increased stratification reduces the vertical mixing of nutrients and other chemical compounds in the upper ocean, which is an important process in the marine ecosystem.
The stratification observed in the upper ocean (depths of 0–200 m) has increased globally since at least 1970 (virtually certain) (IPCC AR6 WGI TS.2.4) (Arias et al., 2021). We have used regional data sources and publications to assess historical changes in stratification in the oceans around Canada. These results align with the IPCC AR6 global assessment and demonstrate an increase in stratification of the upper ocean in sub-polar Atlantic and Pacific waters. The increase is a result of sea surface warming and freshening, which makes the surface water less dense and, therefore, more difficult to mix down into the water column. Although high-quality historical data for the Atlantic and Pacific waters around Canada are spatially limited, the data that are available show statistically significant upward trends in stratification at some key locations, such as Station Papa and the Scotian Shelf. The complex nature of the Atlantic region, with its seasonal sea ice and large freshwater input, has resulted in weak trends in stratification in some parts of the region. Since upper ocean data for the Arctic are scarce, the changes that have occurred there cannot be assessed, but increased rates of glacial and sea ice melting are expected to contribute to increased stratification during ice-free seasons. The consistency and quality of global and regional analyses of changes in upper ocean temperatures (section 7.2.1) and salinity (section 7.3.1) have led to the assessment of high confidence in the historical changes in stratification.
7.4: Global and relative mean sea level
Key Message 7.6: Global mean sea level has risen by about 20 cm since 1900 as a result of human influence on the climate system (very high confidence). The main contributions to this rise have been thermal expansion of the warming ocean and widespread melting of ice on land, which results in runoff into the ocean (very high confidence). In regions of Canada where the land is subsiding, the relative mean sea level has risen more than would be expected from global sea level rise alone (very high confidence). Rates of up to 34 cm per century in southern Atlantic Canada and the western Arctic have been observed, with smaller rates in British Columbia (very high confidence). In contrast, the sea level in western Hudson Bay has fallen by 88 cm per century, owing to rapid land uplift (very high confidence). Land uplift and subsidence are caused by the continuing adjustment of the land surface, due to the loss of ice mass after the last continental glaciation.
Key Message 7.7: Global mean sea level is projected to rise by many tens of centimetres in the 21st century under a low emissions scenario and is unlikely to be more than a metre under a very high emissions scenario (medium confidence). Relative sea levels in different parts of Canada are, however, projected to rise or fall depending on local vertical land motion as well as the amount of global sea-level rise. Owing to land subsidence, parts of Atlantic Canada and the western Arctic are projected to experience increases in relative sea level that are larger than the change in the global mean sea level during the coming century (high confidence).
Mean sea level is defined as the height of the ocean surface (relative to the centre of the Earth) at a particular location averaged over an extended period, such as a month or a year. This averaging removes the effect that tides, storm surge, and waves have on the water level. Understanding past changes in mean sea level is critical for projecting future sea-level change.
Global mean sea level, which is averaged for the entire globe and is a key ocean-related climate indicator, has increased as a result of the anthropogenic heating of the Earth system (Figure 7.3 ). This increase is being driven by thermal expansion of the oceans from warming, ice loss from glaciers and ice sheets, and changes in land water storage (e.g., dam operation, groundwater extraction, and other activities) (IPCC AR6 WGI Table 9.5) (Fox-Kemper et al., 2021). Global mean sea level will continue to rise in response to past emissions long into the future, over centuries to millennia, even with strong future reductions in greenhouse gas (GHG) emissions (IPCC AR6 WGI 9.6.3) (Fox-Kemper et al., 2021). This built-in, long-term response is referred to as committed change or long-term commitment. The reason for this delayed response is that some aspects of the climate system, including the terrestrial biosphere, the deep ocean, and the cryosphere, respond much more slowly than surface air temperatures to changes in GHG concentrations. As a result, substantial committed changes are already associated with past GHG emissions. For example, the global mean sea level will continue to rise for thousands of years, even if future carbon dioxide emissions are reduced to net zero and global warming is halted, since the excess energy from past emissions will continue to propagate into the deep ocean and as glaciers and ice sheets continue to melt (IPCC AR6 WGI Box TS.4) (Arias et al., 2021).
Relative sea-level change refers to the mean sea-level change experienced along a given coast as directly measured by tide gauges, taking vertical land motion into account (Figure 7.18 ). Relative sea-level changes are useful when considering coastal impacts and planning adaptation actions. Along the coasts of Canada, long-term trends in relative sea level vary substantially from one location to another, due mainly to the wide spatial variations in vertical land motion (section 7.4.1.2), but with important contributions from other sources.
In this section, we will present the changes observed in global mean sea level to provide context for the changes along Canada’s coastlines. We will also discuss relative mean sea-level observations from long-term tide gauge records at representative locations around Canada. Projections of global and relative mean sea level will be assessed, emphasizing changes for coastal communities in Canada.
Figure take-away: Relative sea-level change at a given location is influenced by vertical land motion.
Figure title: Relative sea-level change
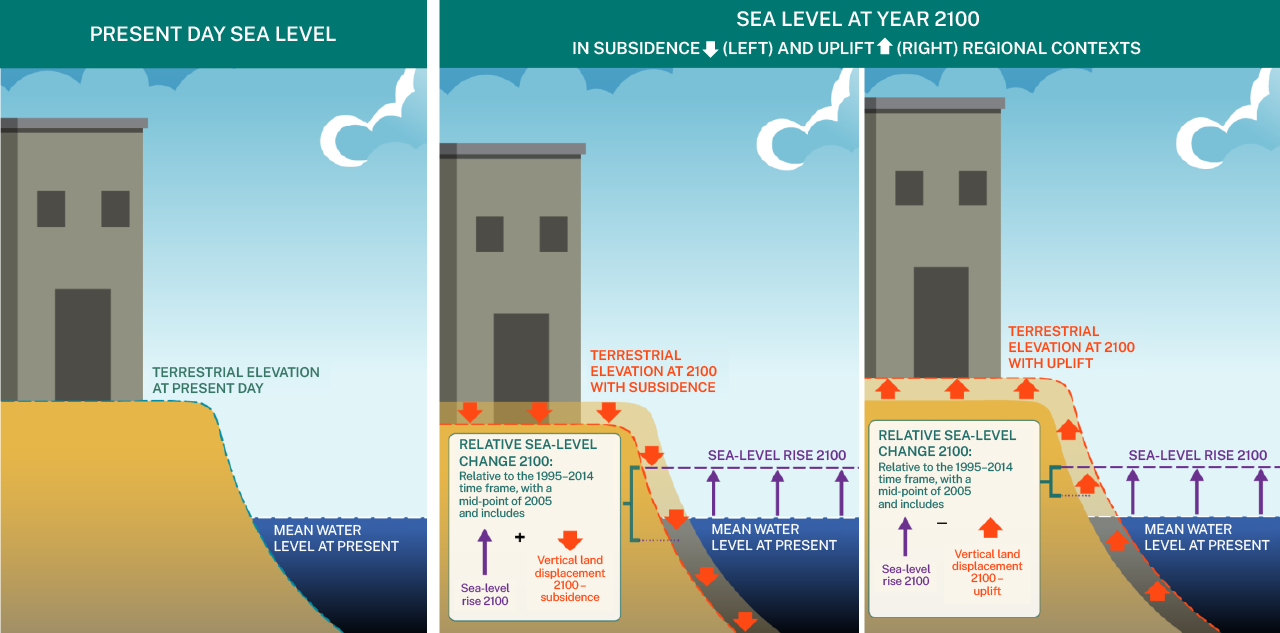
Figure 7.18 : Illustration of relative sea-level changes along Canada’s coastlines, which are determined by a combination of changes in regional mean sea level and vertical land motion (subsidence or uplift). This can result in relative sea-level changes that are larger or smaller than global sea-level changes. Adapted from: Canadian Centre for Climate Services (2025a).
7.4.1: Past changes
7.4.1.1: Global sea level
Global mean sea-level change is calculated by dividing the total change in seawater volume by the ocean surface area. This metric has been derived from tide gauge observations from the past century, as well as direct satellite altimetry measurements (remote sensing technology used to determine the height of the ocean surface) since 1993. The IPCC AR6 provided estimates of historical sea-level change based on the ensemble approach of Palmer et al. (2021) and with an updated assessment from the World Climate Research Programme Global Sea Level Budget Group (2018) (Gulev et al., 2021). According to Section A7.1 of the IPCC AR6 WGI SPM report (IPCC, 2021):
“Global mean sea level increased by 0.20 (0.15 to 0.25) m between 1901 and 2018. The average rate of sea level rise was 1.3 (0.6 to 2.1) mm year-1 between 1901 and 1971, increasing to 1.9 (0.8 to 2.9) mm year-1 between 1971 and 2006, and further increasing to 3.7 (3.2 to 4.2) mm year-1 between 2006 and 2018 (high confidence).” Footnote 11 – IPCC AR6 WGI SPM
The IPCC AR6 reported for the first time the closure of the historical sea-level budget, meaning that the sum of the individual contributions from glaciers, ice sheets, thermal expansion of the oceans, and direct anthropogenic effects is equal to the amount of sea-level rise directly observed, taking cited uncertainties into account (IPCC AR6 WGI 9.ES) (Fox-Kemper et al., 2021). From 1901 to 2018, ocean thermal expansion (38%) and mass loss from glaciers and ice sheets (41%) dominated contributions. The contribution from the Greenland and Antarctic ice sheets has increased at an accelerated rate in recent decades, and was four times larger in 2010–2019 than in 1992–1999 (Fox-Kemper et al., 2021).
7.4.1.2: Relative sea level
Large-scale land motion in Canada primarily results from glacial isostatic adjustment, which is the response of the Earth to past and present-day changes in ice mass (glacier and ice sheet). During the last continental glaciation, the weight of the ice sheets depressed the surface of the Earth, causing slow flow deep in the Earth’s mantle. At the periphery of the former ice sheets, the flow of mantle material caused land uplift. Upon the thinning and retreat of the continental ice sheets, the depressed central regions started to rise, and previously uplifted peripheral regions began to subside. The process of glacial isostatic adjustment is still occurring today because the Earth’s mantle responds slowly to past changes in surface load.
The national crustal velocity model (Robin et al., 2020) shows that the land is rising across much of Canada (Figure 7.19). This model integrates satellite observations of bedrock movements with predictions by glacial isostatic adjustment models, and includes the effects of present-day ice changes on vertical land motion. Glacial isostatic adjustment causes land subsidence in much of Atlantic Canada and along the coast of the Beaufort Sea in the western Arctic. The high rates of uplift in northern Canada are the product of present-day ice mass changes in the Queen Elizabeth Islands of the Canadian Arctic Archipelago. In addition, land is rising quickly in Southeast Alaska as a result of glacier and ice cap shrinkage following the Little Ice Age (Hu & Freymueller, 2019). The high uplift rates in Greenland result primarily from present-day mass loss from the Greenland Ice Sheet.
Vertical land motion results in strong spatial variations in relative sea-level changes along the coast of Canada (Figure 7.20). For this assessment, we selected nine representative sites across Canada with good-quality tide gauge records spanning at least three decades. At Halifax and St. John’s in Atlantic Canada, and at Tuktoyaktuk on the coast of the Beaufort Sea in the western Arctic, where the land is sinking due to glacial isostatic adjustment (Figure 7.19 ), relative sea levels are rising faster than the global mean sea level. At Alert on Ellesmere Island and Churchill on Hudson Bay, relative sea levels are falling owing to rapid land uplift caused by glacial isostatic adjustment and by present-day changes in ice mass (Figure 7.19 ). At Vancouver and Prince Rupert along the coast of the northeast Pacific, where the land is rising slowly, the increase in relative sea levels is slower than the increase in the global mean sea level. Interannual to decadal scale fluctuations are evident in the tide gauge records shown in Figure 7.20, and are caused by various natural processes, such as the El Niño–Southern Oscillation (ENSO) (Chapter 4, section 4.8), which affect the determination of short-term sea-level trends at individual gauges.
Figure take-away: Most of the land mass along Canada’s coastlines is being uplifted, except in the southern Atlantic Canada and southern Beaufort Sea regions, which are experiencing land subsidence.
Figure title: Vertical crustal velocity across the Canadian land mass
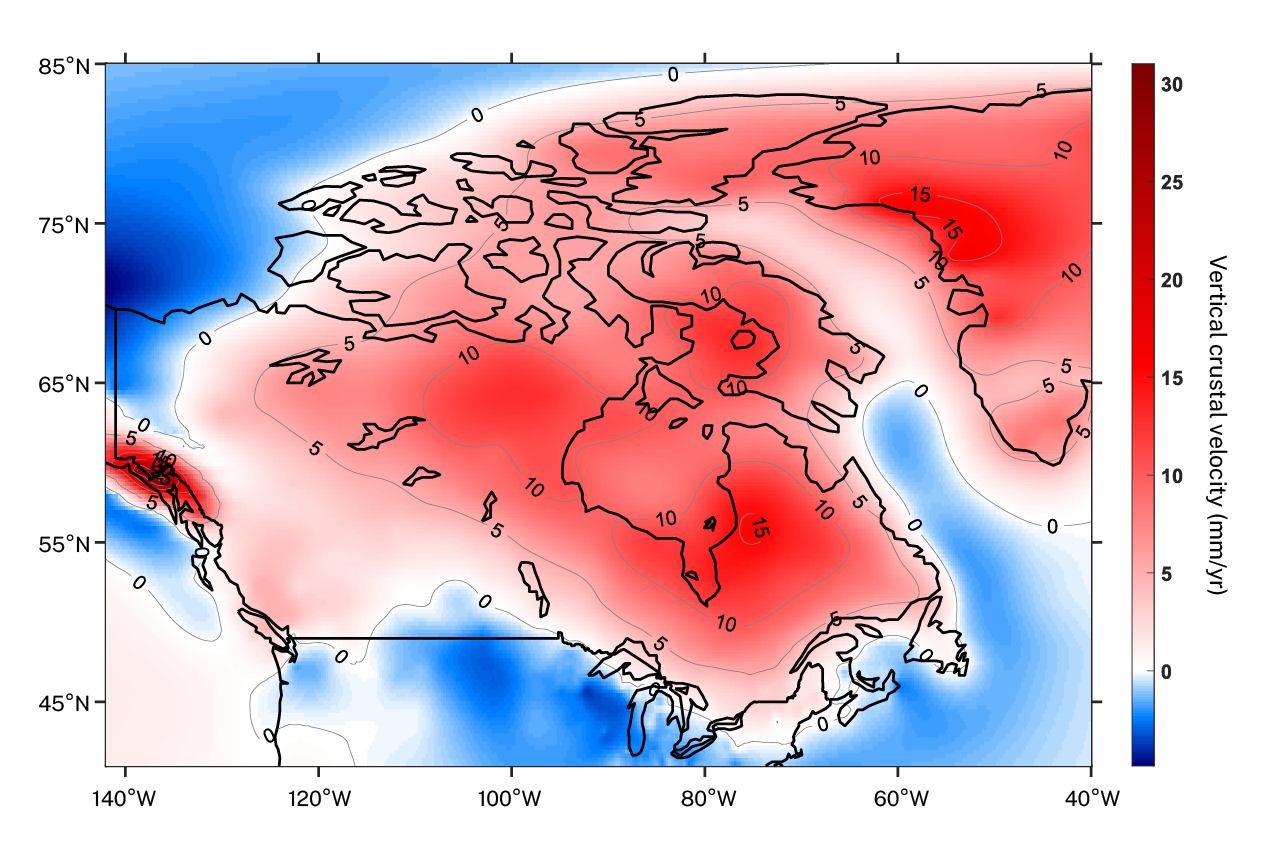
Figure 7.19 : The national crustal velocity model generated by the Canadian Geodetic Survey, showing land uplift (red) and land subsidence (blue) in mm per year. Adapted from: Robin et al. (2020).
Figure take-away: Long-term changes in relative sea levels at nine sites along Canada’s coastline show that the change can be positive or negative depending on the location.
Figure title: Historical relative sea-level changes in Canada
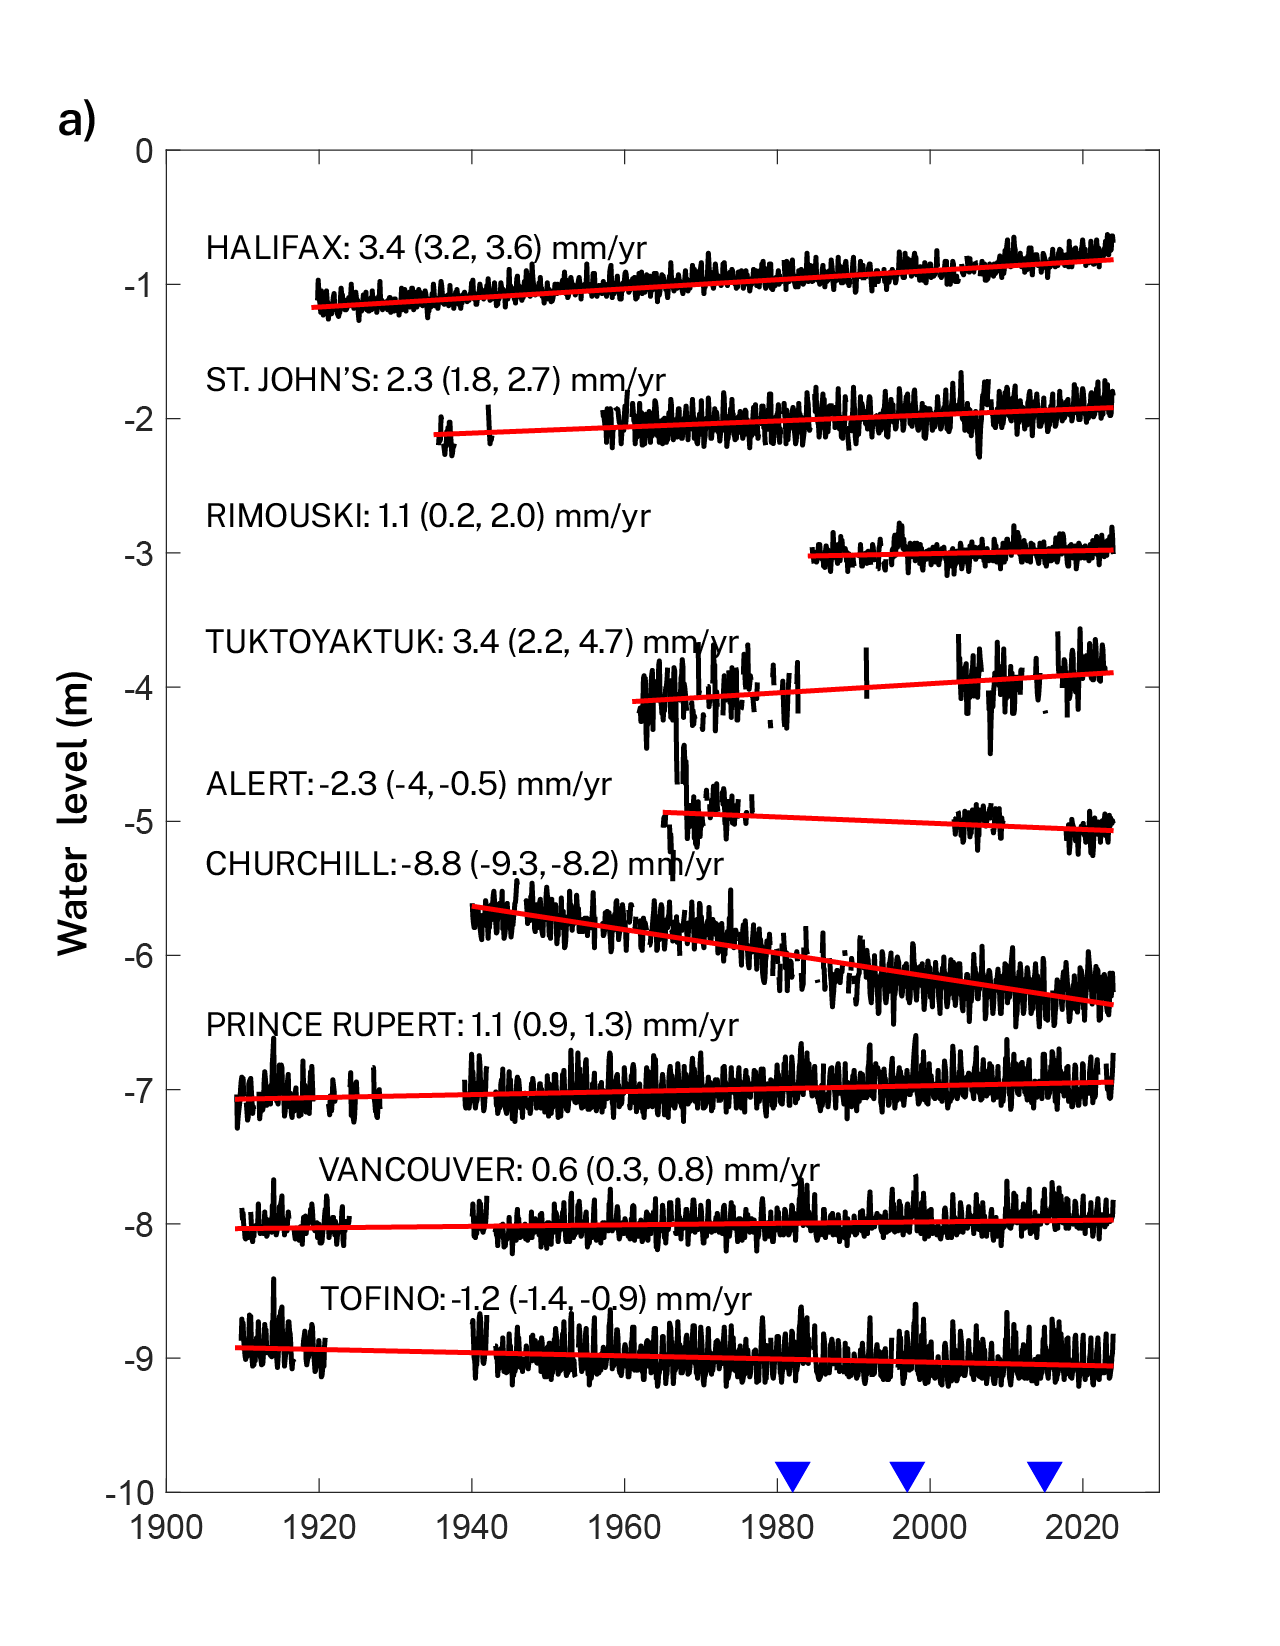
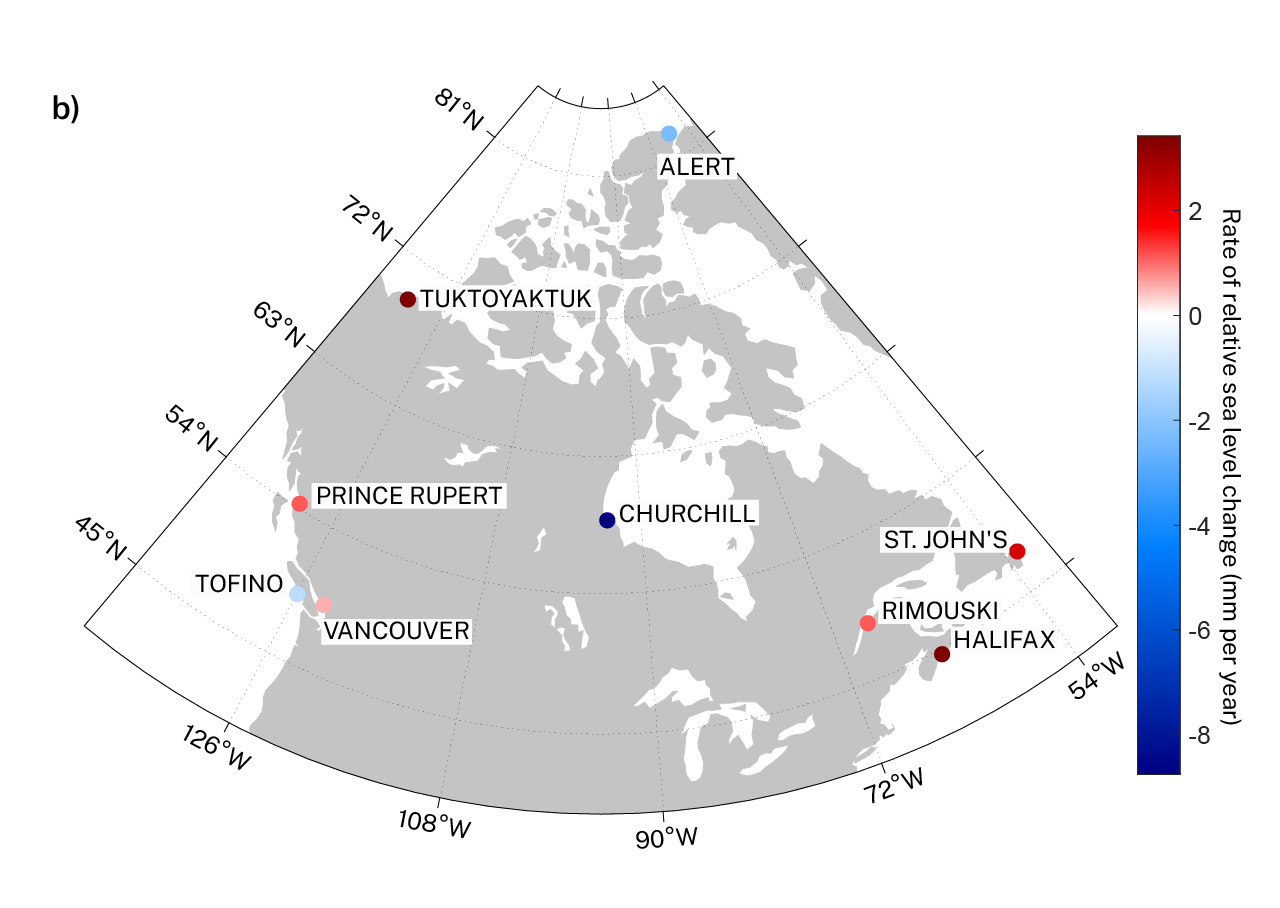
Figure 7.20 : a) Monthly tide gauge observations (commonly referred to as water levels) (in black) and associated linear trends (in red) at nine representative tide gauge sites across Canada, along with a b) map of the tide gauge locations. Trend estimates are shown in black type, followed by the 95% confidence limits in brackets. The tide gauge records at Halifax and in Bedford Basin were merged by adding the difference (Halifax value minus Bedford value) in the averages of the two time series during the period of overlap to the observations at Bedford Basin, to account for the different reference datum at each site. The individual tide gauge records are vertically offset for display purposes. Blue triangles indicate the timing of very strong El Niño events, an important phenomenon affecting sea level along the British Columbia coast. The tide gauge locations in b) are colour coded according to the long-term trend in relative sea level (in mm per year) shown in a), with the red shades indicating an increase and the blue ones, a decrease. Data source: National Oceanic Centre(2025).
In addition to vertical land motion, a variety of other processes can contribute to regional sea-level changes on scales of years to decades. These include changes in ocean circulation and ocean density, which are driven by winds, air-sea heat fluxes, precipitation, river runoff, and meltwater. The amplitude of the regional sea-level changes resulting from these ocean and atmospheric dynamics can be several times greater than the amplitude of global mean sea-level rise (Volkov et al., 2022). These processes need to be considered when planning for sea-level change along the coastline (Han et al., 2014; Han, Ma, Chen, Thomson, et al., 2015). Interannual sea-level variations along the coast of Nova Scotia have been demonstrated to be driven mainly by changes in ocean density (that is, the combination of temperature and salinity) and weather patterns (Chen et al., 2020). The latter is referred to as the inverse barometer effect. Large-scale processes such as the North Atlantic Oscillation (NAO) (Chapter 4, section 4.3) can also play an important role in short-term coastal sea-level changes (e.g., Goddard et al., 2015). Along the west coast of Canada, trends and interannual variations in sea levels are associated mainly with wind-driven ocean density changes (Lu et al., 2025). In that region, intra-seasonal to interannual changes contribute substantially to extreme sea levels, and El Niño events can amplify this contribution (Han & Lu, 2023). The Greenland and Antarctic ice sheets and the glaciers and ice caps of the Canadian High Arctic also affect regional sea-level changes through gravitational and deformational effects.
The national crustal velocity model has been found to support an improved assessment of regional sea-level budgets based on data from tide gauges in Canada, compared to the IPCC AR6 land motion model (Zhai, Lu, & Greenan, 2025). This research demonstrated the need to include interannual variations in river runoff in oceanographic models providing projections of sea-level changes in the St. Lawrence River and Estuary. In addition, the closure of the regional sea-level budget is dependent on the spatial resolution of the oceanographic models used for the Gulf of St. Lawrence and the continental shelf of Atlantic Canada. Despite their coarse spatial resolution, the global models perform well at simulating sea-level changes along the coast of British Columbia. These results provide increased support for the use of the national crustal velocity model in generating relative sea-level projections for Canada (James & Brierley-Green, 2026; James et al., 2021).
7.4.2: Future changes
7.4.2.1: Global mean sea-level projections
The IPCC AR6 reported that it is virtually certain that global mean sea level will continue to rise in the current century (Table 7.1) (Fox-Kemper et al., 2021). This rise will carry on for centuries, owing to the continued uptake of heat by the deep oceans and mass loss from the Greenland and Antarctic ice sheets, with sea levels remaining elevated for thousands of years after that (high confidence) (Fox-Kemper et al., 2021). The projected rise in global mean sea level by the year 2100 ranges from 0.38 m (0.28−0.55 m) under the very low emissions scenario (SSP1-1.9) to 0.77 m (0.63−1.01 m) under the very high emissions scenario (SSP5-8.5) (medium confidence). It is important to note that, in this section of the chapter, the values in round brackets represent the likely range (66% uncertainty range, from the 17th to 83rd percentiles). We use this range to maintain consistency with the approach adopted by the global sea-level science community, as outlined in the IPCC AR6 report (Fox-Kemper et al., 2021).
Emissions scenario |
Medianb (m) |
Likely rangec (m) |
|
|---|---|---|---|
| Very low | SSP1-1.9 |
0.38 |
0.28–0.55 |
| Low | SSP1-2.6 |
0.44 |
0.32–0.62 |
| Intermediate | SSP2-4.5 |
0.56 |
0.44–0.76 |
| High | SSP3-7.0 |
0.68 |
0.55–0.90 |
| Very high | SSP5-8.5 |
0.77 |
0.63–1.01 |
a Source: IPCC AR6 SPM B.5.3 and Table 9.9 in Fox-Kemper et al. (2021)
b Source: IPCC AR6 SPM B.5.3 and Table 9.9 in Fox-Kemper et al. (2021)
c 17th to 83rd percentile
The relative contributions of individual factors to global sea-level rise at 2100 differ according to the emissions scenario (Table 7.2). Under the low emissions scenario (SSP1-2.6), thermal expansion accounts for 32% of the total assessed median sea-level rise, while ice sheets and glaciers will collectively contribute 60%. Under the very high emissions scenario (SSP5-8.5), the thermal expansion contribution increases to 39%, while the ice mass contribution shrinks slightly, to 56%. The contribution from human water storage and management activities on land, which include groundwater pumping (which adds to global sea-level rise) and the construction of water reservoirs (which decreases global sea-level rise), remains constant at 0.03 m, but its relative contribution decreases from 7% to 4% between the low emissions and very high emissions scenarios (SSP1-2.6 and SSP5-8.5, respectively). The contribution from ocean thermal expansion is projected to be similar to or less than the historical contribution of 38% observed from 1901 to 2018 (section 7.4.1.1). In contrast, the relative contribution of glaciers will decrease to between 21% (low emissions scenario, SSP1-2.6) and 23% (high emissions scenario, SSP3-7.0) compared with the historical value of 41%.
- |
Low emissions scenario (SSP1-2.6) |
Very high emissions scenario (SSP5-8.5) |
||
|---|---|---|---|---|
Contributor |
Median (m) |
Percentage of Totala |
Median (m) |
Percentage of Total |
Thermal expansion |
0.14 |
32 |
0.30 |
39 |
Greenland ice sheet |
0.06 |
14 |
0.13 |
17 |
Antarctic ice sheet |
0.11 |
25 |
0.12 |
16 |
Glaciers |
0.09 |
21 |
0.18 |
23 |
Land water storage |
0.03 |
7 |
0.03 |
4 |
Total |
0.43 |
99 |
0.76 |
99 |
a Percentages do not add up to 100% due to rounding.
Box 7.2: Antarctic ice sheet instability and the sea-level high-end
The potential amount of sea-level change generated by the Antarctic ice sheet in the future is uncertain, owing to the poor understanding of flow and calving processes there (DeConto et al., 2021; DeConto & Pollard, 2016; Pattyn & Morlighem, 2020). To explore this uncertainty, additional projections were generated for the IPCC AR6 report (Fox-Kemper et al., 2021) to represent how a high-impact, low-probability storyline could affect global sea level. The high-end projections entailed additional modelling to incorporate instability effects from the Antarctic ice sheet (DeConto et al., 2021), as well as a structured expert judgment (Bamber et al., 2019). The resulting low confidence high-end projections predict greater changes than do the medium confidence projections outlined in Table 7.1, which are based solely on an understanding of ongoing processes.
The high-impact, low-probability storyline developed by the IPCC AR6 author team projected a global sea-level rise of 1.6 m by the year 2100 (Box 7.2, Figure 1) (IPCC AR6 WGI SPM Fig. SPM.8d) (IPCC, 2021). This storyline was intended to capture the deep uncertainty in high-end projections through a narrative (Kopp et al., 2023). An updated version of this high-end storyline (Box 7.2, Figure 1) projects a sea-level rise ranging from 1.27 to 1.55 m by 2100 (van de Wal et al., 2022), which encompasses the previous high-end estimate of 1.39 m provided in CCCR2019 (Greenan et al., 2019; estimate from T. James et al., 2014), itself based on IPCC AR5 (Church et al., 2013).
Current global climate policies align most closely with the intermediate emissions scenario (SSP2-4.5) trajectory for carbon emissions (Chapter 3, section 3.3). The high-end values, which are based on projections assessed as low confidence, may therefore provide an unnecessarily high estimate. In section 7.4.2.2, the upper bound of the updated high-end projections by van de Wal et al. (2022), under a very high emissions scenario (SSP5-8.5), is provided as a possible high-end estimate for extremely risk-averse practitioners. However, it may be appropriate to consider the upper bound of the likely range of the medium confidence, non-high-end SSP5-8.5 projections (17th to 83rd percentile; upper limit of the pink band in Box 7.2 Figure 1) as a suitable margin of safety for nearly all other situations where the future flooding hazard is a concern.
Figure take-away: Global sea level is projected to increase under all emissions scenarios, with the greatest increases under the very high emissions scenario (SSP5-8.5).
Figure title: Projected global sea-level change relative to the baseline period of 1995–2014
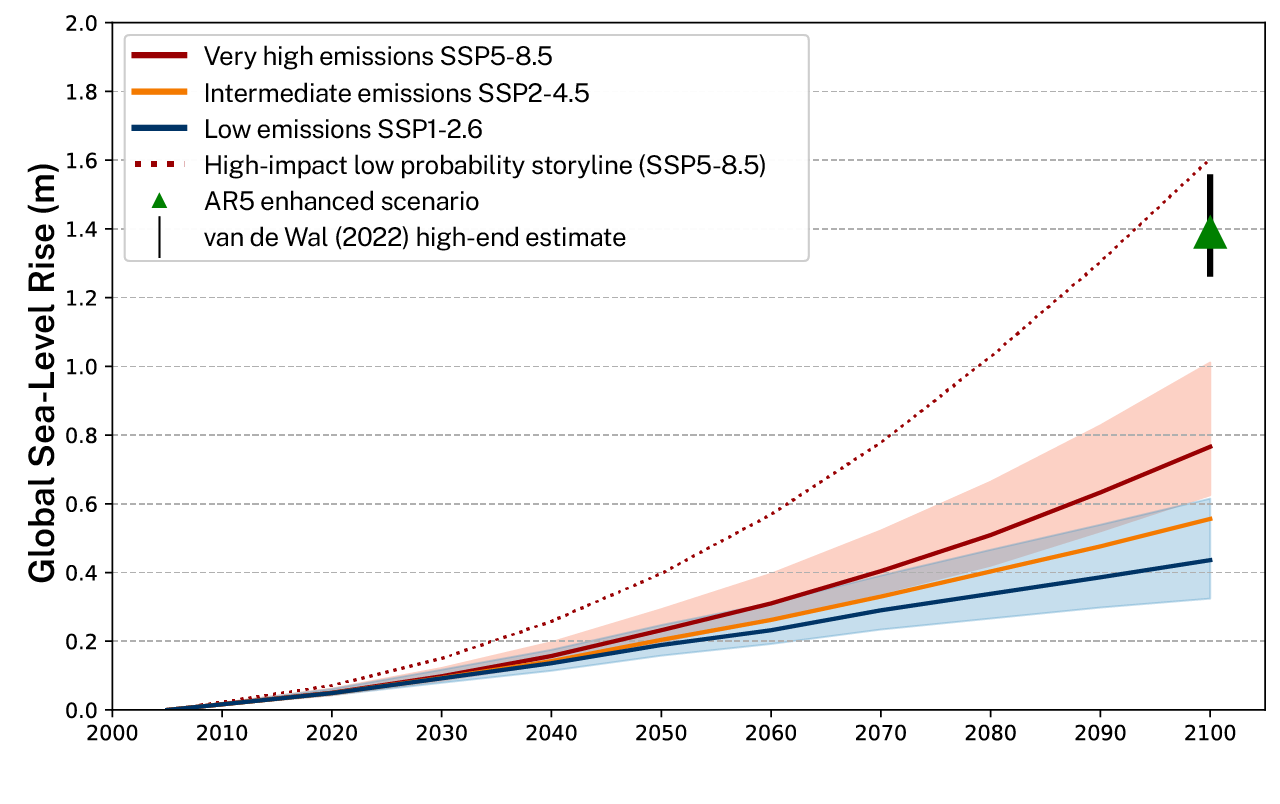
Box 7.2 Figure 1: Projected global sea-level rise (in m) to 2100, relative to a baseline of 1995–2014, under three shared socio-economic pathways (SSP), with the red line representing a very high emissions scenario (SSP5-8.5); the orange line, an intermediate emissions scenario (SSP2-4.5); and the blue line, a low emissions scenario (SSP1-2.6) (Fox-Kemper et al., 2021). In addition, three other scenarios are shown. The high-impact, low-probability storyline (red dotted line) (IPCC, 2021) is based on a low confidence sea-level projection under a very high emissions scenario (SSP5-8.5), which also incorporates the effects of the potential future instability of the Antarctic ice sheet. The high-end estimate by van de Wal et al. (black vertical line) (2022) and the estimate from an enhanced scenario (green triangle) (Greenan et al., 2019; T. James et al., 2014) based on the IPCC AR5 (Church et al., 2013) at 2100 are also provided.
7.4.2.2: Relative sea-level projections
Relative sea-level projections based on the IPCC AR6 global projections described in the previous section incorporate regional effects, such as sea-level fingerprintingFootnote 12 and projected changes to ocean circulation (James & Brierley-Green, 2026). In addition, a recently updated national crustal velocity model (Robin et al., 2020) was used in the projections. The resulting pattern of relative sea-level increases and decreases at locations across Canada is spatially similar to historical tide gauge measurements of relative sea-level change (section 7.4.1.2). They can also be compared to relative sea-level projections for Canada based on IPCC AR5 projections (Han et al., 2014, 2020; Han, Ma, Chen, Thomson, et al., 2015; Han, Ma, Chen, Yang, et al., 2015). In general, the relative sea-level projections from the IPCC AR5 studies provide similar results to those presented in this section, which are based on IPCC AR6.
Under the intermediate emissions scenario (SSP2-4.5), relative sea levels are projected to fall in Hudson Bay and much of the eastern Arctic (Figure 7.21), where land uplift rates are high (Figure 7.19 ). Where the land is rising more slowly, the relative sea level is projected to rise. Where the land is sinking, relative sea levels are projected to rise the most, exceeding the global average value of 0.56 m (Table 7.1) in much of Atlantic Canada and the western Arctic.
Figure take-away: The amount of projected relative sea-level change along Canada’s coastlines depends on the location and emissions scenario.
Figure title: Relative sea-level change by 2100 (relative to 1995–2014) under four emissions scenarios
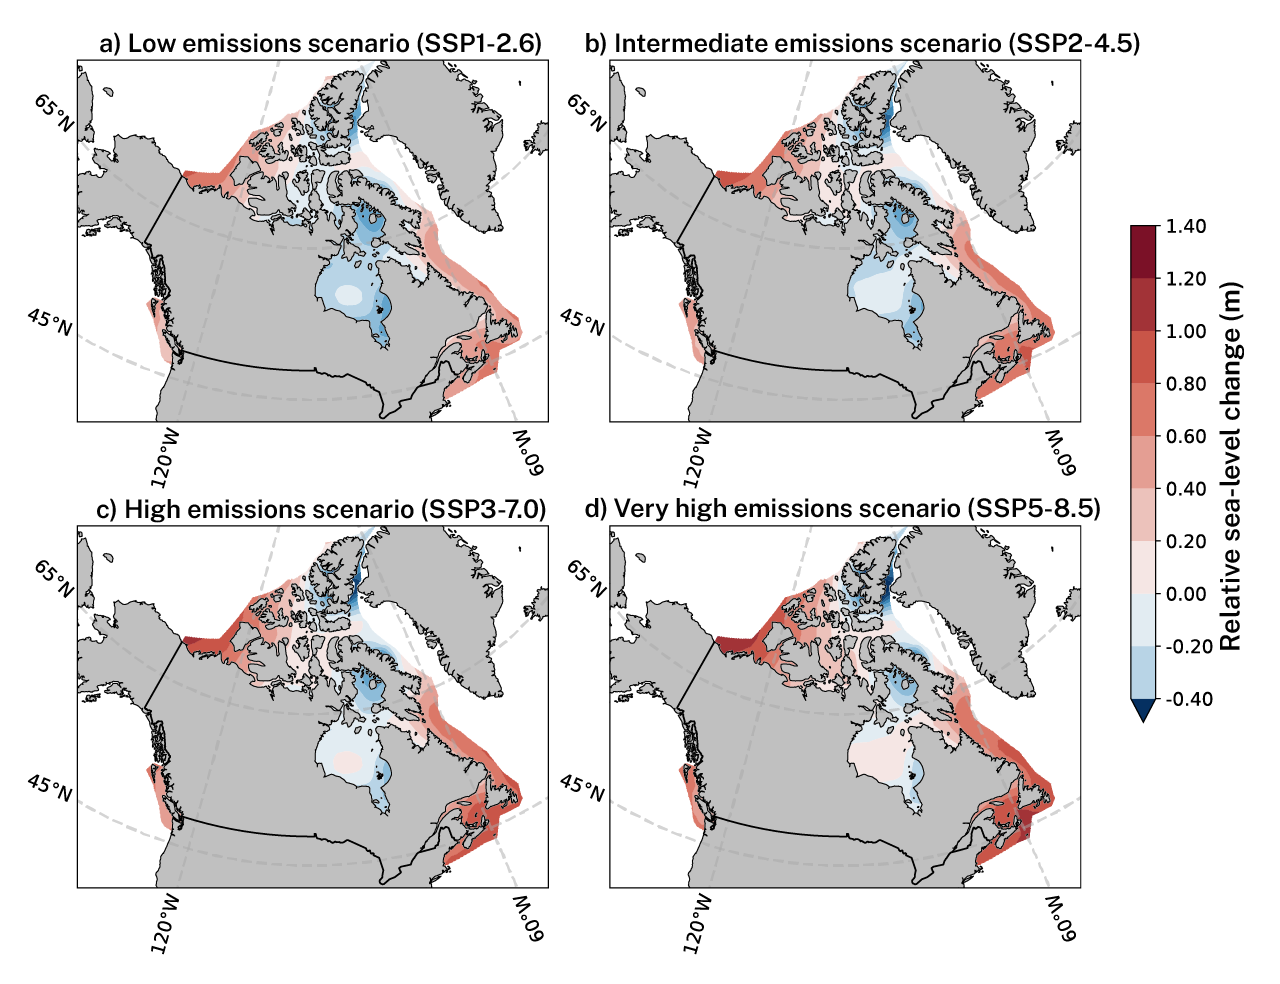
Figure 7.21: Projected median (50th percentile) relative sea-level change across Canada (in m) by 2100, relative to a 1995–2014 baseline period, under the following scenarios: a) low emissions (SSP1-2.6), b) intermediate emissions (SSP2-4.5), c) high emissions (SSP3-7.0), and d) very high emissions (SSP5-8.5). The various gradations of red and blue indicate the magnitude of sea-level rise and fall, respectively. Source: James & Brierley-Green (2026).
Projections of relative sea-level changes through the end of the current century (Figure 7.22) reveal that the changes are largely scenario-independent to about 2050, simplifying the process of planning short-term adaptations. After 2050, projections diverge, with larger amounts of relative sea-level change expected under the high and very high emissions scenarios (SSP3-7.0 and SSP5-8.5 respectively) in regions where the land is not rising rapidly. Tuktoyaktuk and Halifax, where the land is sinking, have the greatest projected sea-level rise. Smaller amounts of sea-level rise are expected to occur in Rimouski, Vancouver, and Tofino, where the land is rising slowly. Churchill presents a stark contrast to the other five communities, as the land there is rising quickly and the relative sea level is projected to fall under all scenarios and in all time frames, except late in the century under the upper range of the very high emissions scenario (SSP5-8.5). The high-end extrapolation, which has low confidence but incorporates the potential effects of the future instability of the Antarctic ice sheet (Box 7.2), projects substantially greater amounts of sea-level rise, exceeding 1.5 m at Halifax and Tuktoyaktuk by late in the century.
An alternative way to present sea-level projections is through a time-of-encounter plot (Figure 7.23). This plot shows the time at which 0.5 m (left column) or 1.0 m (right column) of relative sea-level rise is likely (66% uncertainty range, from 17th to 83rd percentiles) to be experienced. A relative sea-level rise of 0.5 m may be reached in coastal communities as early as the 2050s under the very high emissions scenario (SSP5-8.5), while a low emissions scenario (SSP1-2.6) delays this event by 20 to 40 years, depending on the location. One metre of relative sea-level rise could be encountered as early as the late 2080s at Halifax and Tuktoyaktuk, while a low-emissions scenario would delay the encounter by slightly more than 30 years. The van de Wal et al. (2022) high-end estimate reduces the time-of-encounter for 0.5 m of relative sea-level rise by more than 20 years at some communities, and the 1.0 m time of encounter by more than 30 years at several communities. Under the intermediate emissions scenario (SSP2-4.5), there is a 50% chance or greater that the relative sea level will have risen by 0.5 m before 2080 at Halifax and Tuktoyaktuk, and before 2150 at Rimouski and Vancouver, and a 50% chance or better that relative sea level will have risen by 1.0 m at Halifax and Tuktoyaktuk before 2150.
In locations where the relative sea level is projected to rise, the high and very high emissions scenarios (SSP3-7.0 and SSP5-8.5 respectively) lead to hazards that are potentially more severe than those under the low and very low emissions scenarios (section 7.6).
Figure take-away: The projected change in relative sea level is independent of the emissions scenario before 2050, but becomes dependent on both the emissions scenario and location in the late 21st century.
Figure title: Projected relative sea-level change in six coastal communities
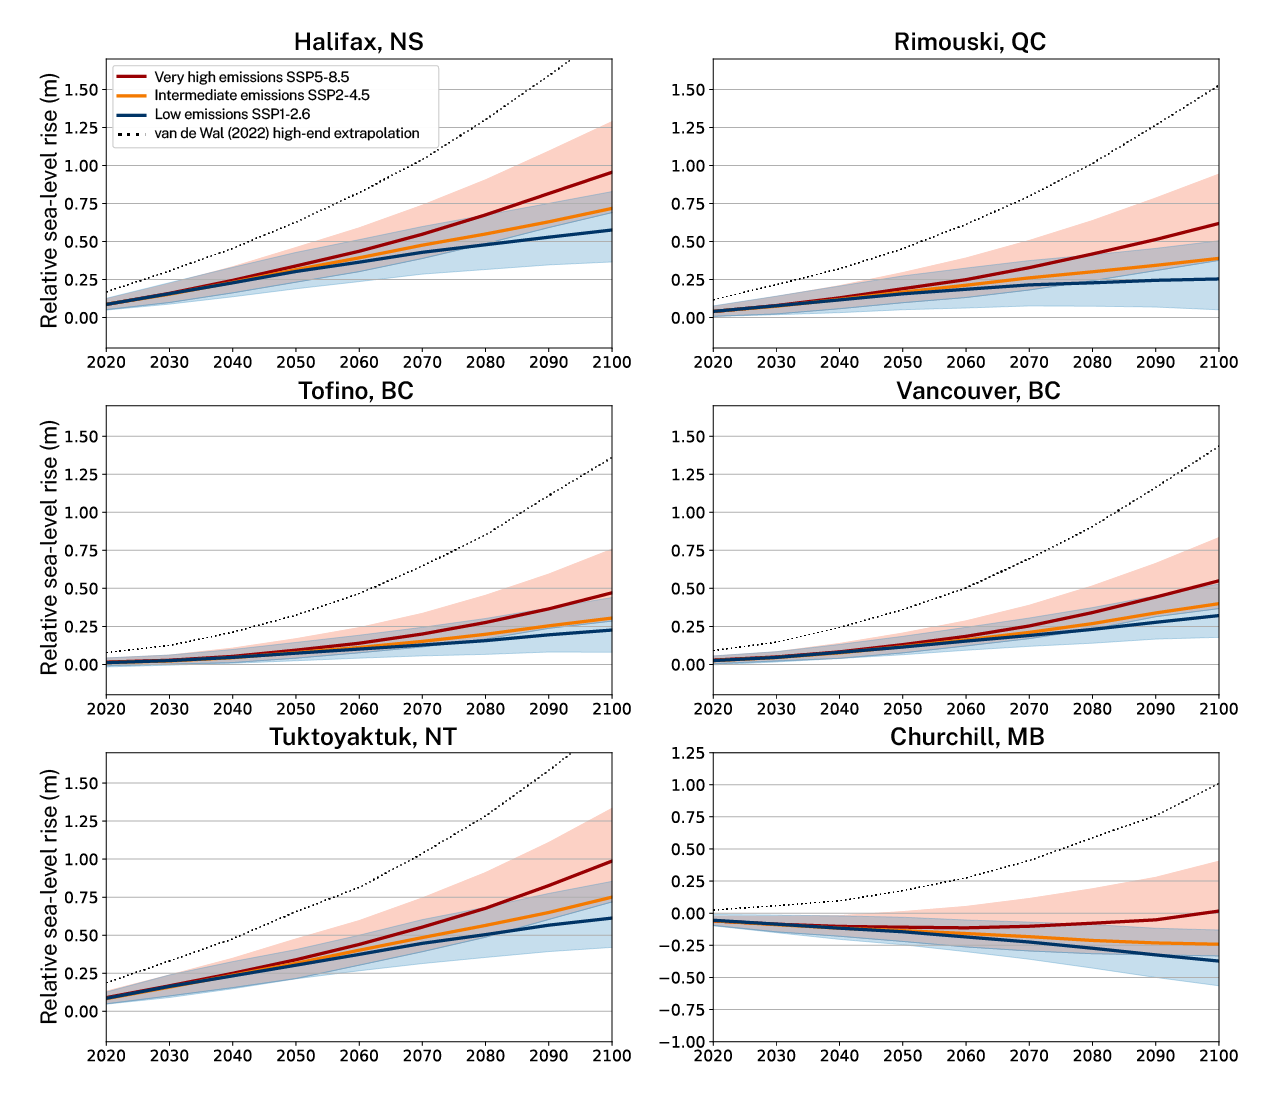
Figure 7.22 : Projected relative sea-level change for six coastal communities across Canada compared to the 1995–2014 baseline period, based on the medium confidence sea-level projections from the IPCC AR6 report (Fox-Kemper et al., 2021), and using the national crustal velocity model (Robin et al., 2020). The solid red line shows the projected changes under the very high emissions scenario (SSP5-8.5S); the orange line, under the intermediate emissions scenario (SSP2-4.5); and the blue line, under the low emissions scenario (SSP1-2.6). The dotted line shows the extrapolated (van de Wal et al., 2022) sea-level high-end.Footnote 13 Medium confidence projections are available to 2150, but are only displayed here to 2100 to focus on the change through the rest of this century. See Figure 7.20 for a map of the communities’ locations.
Read about how the Mi’kmaq Confederacy of Prince Edward Island is confronting rising seas on Lennox Island in Case Story 1.8 of the Regional Perspectives Report, a report that contributed to the fourth cycle of the Canada in a Changing Climate: National Assessment Process.
Figure take-away: The times of encounter for relative sea-level increases of 0.5 m and 1.0 m vary by location in Canada and by emissions scenario.
Figure title: Times of encounter for a relative sea-level rise of 0.5 m and 1.0 m
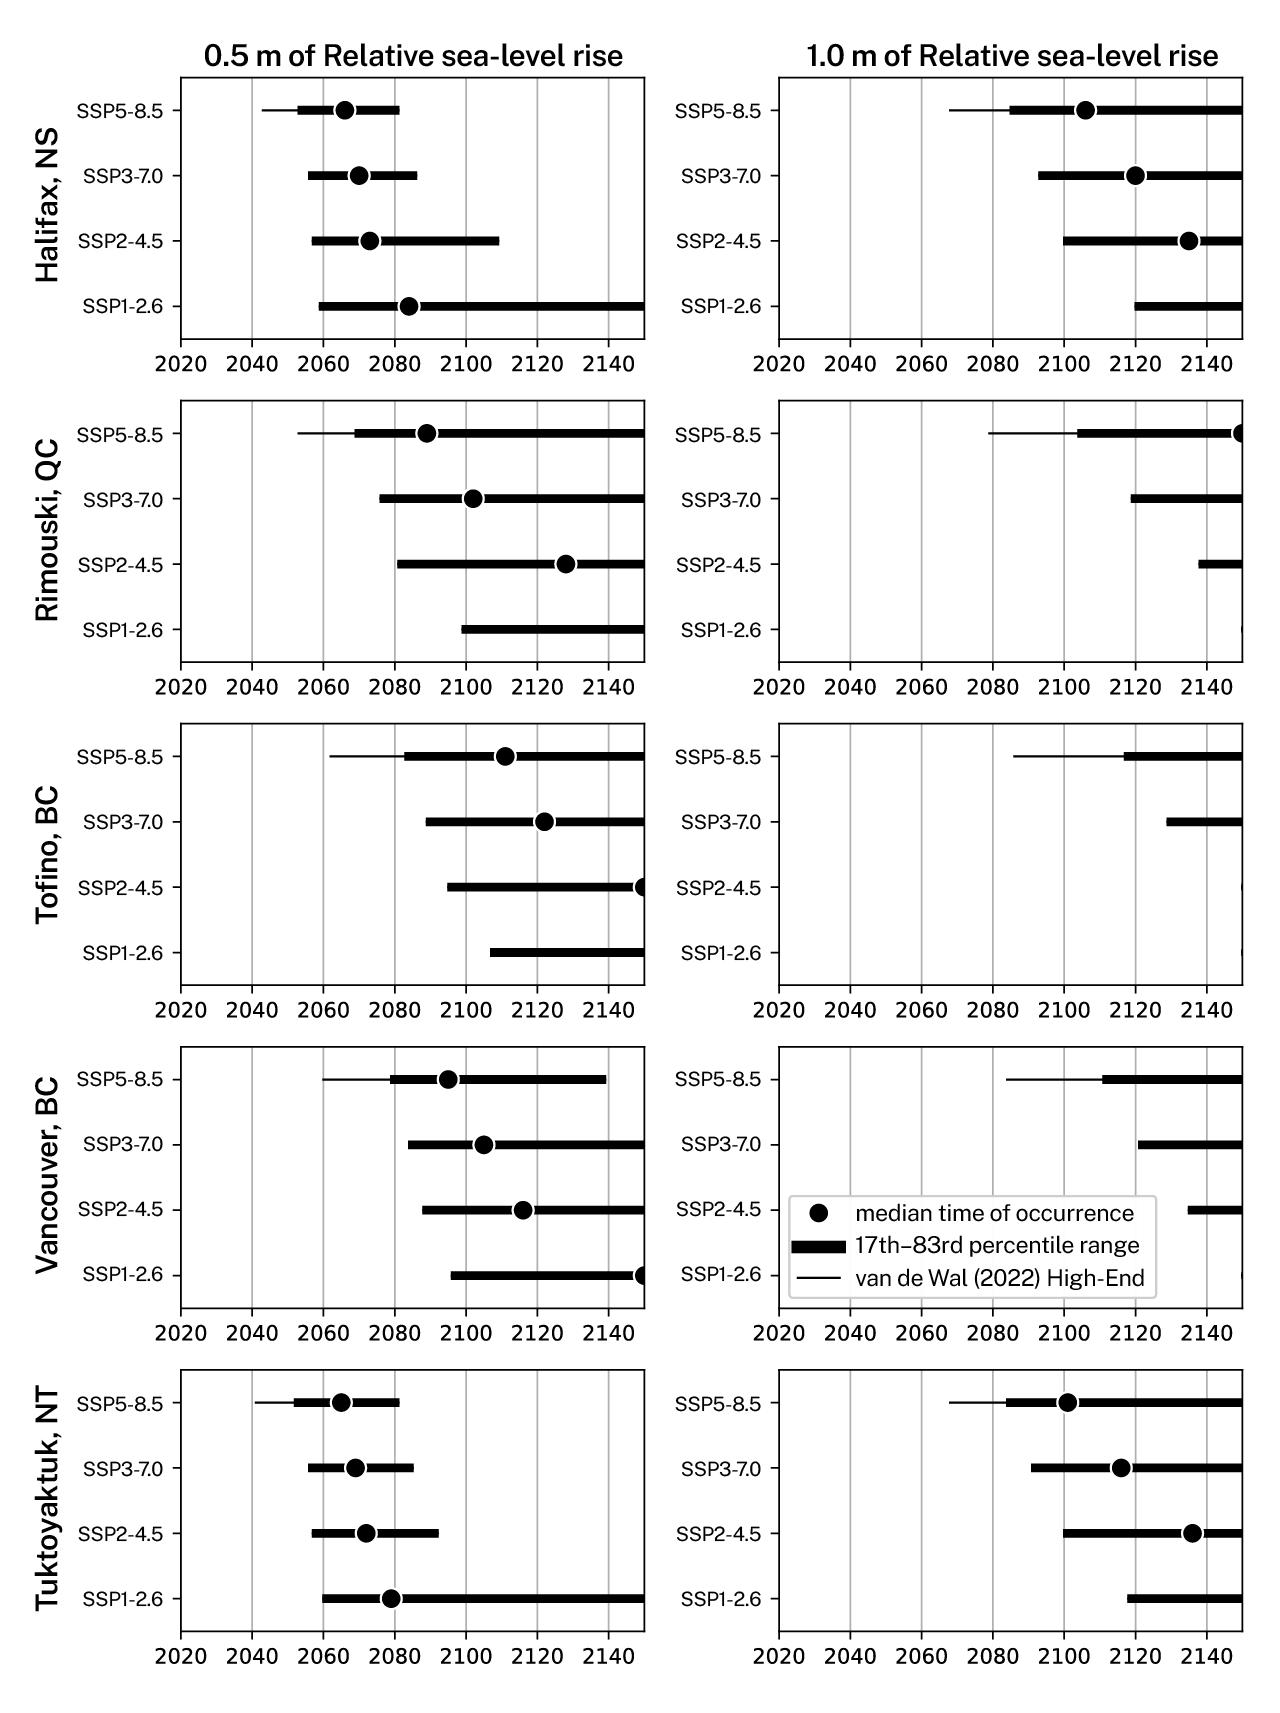
Figure 7.23 : Time-of-encounter plots for 0.5 m (left column) and 1.0 m (right column) of relative sea-level rise at five selected Canadian coastal communities. The change in relative sea level is referenced to the baseline period of 1995–2014. The thicker bars correspond to the likely range (66% uncertainty range, from 17th to 83rd percentiles), and the thin whiskers, to the van de Wal et al. (2022) high-end estimate. The time corresponding to the median projection is indicated with the round symbol. The time of encounter is presented to 2150, which is the limit for medium confidence sea-level projections in the IPCC AR6 report (Fox-Kemper et al., 2021).
At Churchill, relative sea level is projected to fall through the century under all scenarios, except the upper range of the very high emissions scenario (SSP5-8.5; Figure 7.22 ). A time-of-encounter plot (Figure 7.24 ) shows that only under the very high emissions scenario (SSP5-8.5) is a sea-level rise of 0.5 m projected before 2150. In contrast, under a low emissions scenario (SSP1-2.6), a 0.5 m sea-level fall may occur as soon as 2090 (17% chance of occurrence) and has a 50% chance of occurring by 2120. Under the intermediate (SSP2-4.5) and very high emissions (SSP5-8.5) scenarios, the time of encounter for a 0.5 m sea-level fall is delayed by about 15 and 40 years, respectively.
In Hudson Bay and much of the eastern Arctic, falling relative sea levels will lead to navigational hazards in shallow water and the potential stranding of coastal infrastructure over time (T. James et al., 2014). The navigational hazards associated with these falling sea levels will be experienced sooner under the very low and low emissions scenarios (SSP1-1.9 and SSP1-2.6, respectively).
Figure take-away: At Churchill, the time of encounter for a relative sea-level rise of 0.5 m is after 2100, while, for a 0.5 m sea-level fall, it ranges from the 2090s to 2130s, depending on the emissions scenario.
Figure title: Time of encounter for a relative sea-level rise of 0.5 m and fall of 0.5 m at Churchill
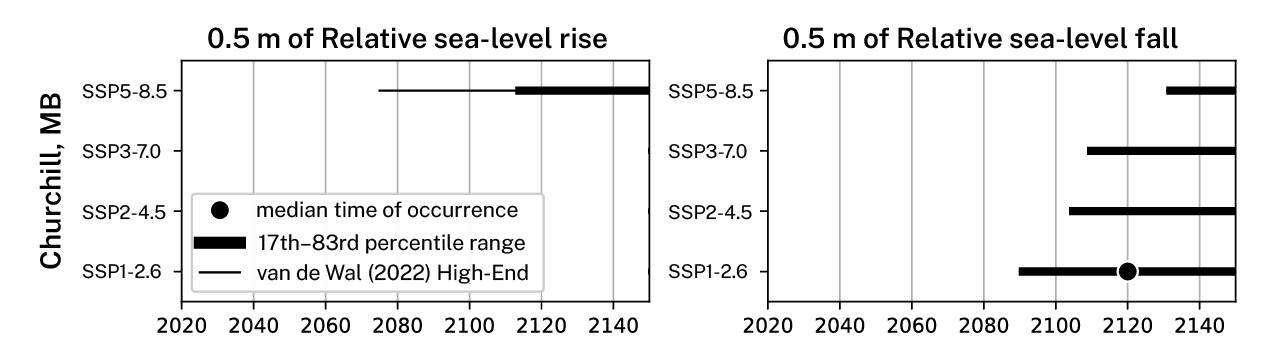
Figure 7.24 : Time-of-encounter plots for a relative sea-level rise of 0.5 m (left column) and a relative sea-level fall (right column) of the same amount at Churchill, Manitoba. The change in relative sea level is referenced to the 1995–2014 baseline period. The thicker bars correspond to the likely range (66% uncertainty range, from the 17th to 83rd percentiles), and the thin whisker, to the van de Wal et al. (2022) high-end estimate. The time of encounter for the median projection is indicated with a solid circle. Time-of-encounter values are presented to 2150, which is the limit for medium confidence sea-level projections in the IPCC AR6 report (Fox-Kemper et al., 2021).
Some of the emerging research in relative sea-level projection has focused on models that consider non-linear vertical land motion, which may increase the uncertainty of sea-level projections (Oelsmann et al., 2024). Other researchers are examining relative sea-level changes in coastal marshes, where local subsidence may influence projections (Ohenhen et al., 2023). Satellite technologies such as Interferometric Synthetic Aperture Radar (InSAR) are playing an increasingly important role in determining the spatial variability in local land motion to be incorporated in relative sea-level projections (Ohenhen et al., 2023).
Future coastal flooding hazards (section 7.6), including flood frequency and peak flood magnitudes, will strongly depend on the projected relative sea-level change described here and on the future state of winds, waves, and storm surge described in section 7.5.
7.4.3: Confidence terms in key messages: summary of evidence
[Key messages are provided here for ease of review but may not appear in this section in final text.]
Key Message 7.6: Global mean sea level has risen by about 20 cm since 1900 as a result of human influence on the climate system (very high confidence). The main contributions to this rise have been the thermal expansion of the warming ocean and widespread melting of ice on land, which results in runoff into the ocean (very high confidence). In regions of Canada where the land is subsiding, the relative mean sea level has risen more than would be expected from global sea-level rise alone (very high confidence). Rates of up to 34 cm per century in southern Atlantic Canada and the western Arctic have been observed, with smaller rates in British Columbia (very high confidence). In contrast, the sea level in western Hudson Bay has fallen by 88 cm per century, owing to rapid land uplift (very high confidence). Land uplift and subsidence are caused by the continuing adjustment of the land surface, owing to the loss of ice mass after the last continental glaciation.
Evidence for historical global mean sea-level rise is based on a quasi-global tide gauge record spanning more than a century, augmented with a 30-year multi-satellite record, which has documented increased rates of global sea-level rise. The evidence base is strong, and repeated analyses spanning decades have confirmed and refined inferred global rates, leading to an assessment of very high confidence. In contrast to earlier IPCC reports, the IPCC AR6 report documented closure of the sea-level budget, which means that the sum of individual contributions from ocean warming, ice masses, and direct anthropogenic contributions is equal to the observed total within the derived uncertainties (IPCC AR6 WGI 9.ES) (Fox-Kemper et al., 2021). The multiple lines of evidence providing consistent support for global sea-level change lead to very high confidence in the main contributions to the rise.
The overall relative sea-level change measured at tide gauges in Canada as a whole is consistent with inferences of the global sea-level change, once vertical land motion constrained by geodetic measurements is accounted for and provided that the tide gauge records are long enough to account for natural variability (James & Brierley-Green, 2026). The consistency of tide gauge trends, geodetic land motion measurements, and land motion inferred from paleo sea-level records (i.e., based on geological evidence), combined with a recent study documenting the closure of the sea-level budget at a majority of the Canadian and American tide gauges examined (Zhai, Lu, & Greenan, 2025), leads to very high confidence in the tide gauge trends for Canada and their attribution.
Key Message 7.7: Global mean sea level is projected to rise by many tens of centimetres in the 21st century under a low emissions scenario and is unlikely to be more than a metre under a very high emissions scenario (medium confidence). Relative sea levels in different parts of Canada are, however, projected to rise or fall depending on local vertical land motion as well as the amount of global sea-level rise. Owing to land subsidence, parts of Atlantic Canada and the western Arctic are projected to experience increases in relative sea level that are larger than the change in the global mean sea level during the coming century (high confidence).
Projections of global sea-level change take into account a combination of contributions, including ocean warming (thermal expansion), glaciers, ice caps, and ice sheets, as well as the direct contributions from human activities such as groundwater pumping and reservoir construction. The closure of the historical sea-level budget achieved in recent years has improved the confidence in projections of sea-level change based on current processes (Fox-Kemper et al., 2021). However, ice-sheet processes, which are deeply uncertain (DeConto et al., 2021; DeConto & Pollard, 2016; Pattyn & Morlighem, 2020), may result in increased amounts of meltwater from the Antarctic ice sheet making its way into the oceans, rendering the projections medium confidence.
Across Canada, a network of global navigation satellite system instruments provides direct observations of vertical land motion, providing readings that are consistent with the tide gauge and paleo sea-level records. These high-quality records show land subsidence in Atlantic Canada and the western Arctic that may exacerbate sea-level rise. On the basis of our understanding of physical processes and the consistent evidence from CMIP6 models, relative sea-level rise greater than the global average is projected with high confidence in areas of Canada where the land is sinking.
7.5: Waves and storm surge
Key Message 7.8: Mean and extreme wave heights have increased in Arctic and sub-Arctic regions, primarily as a result of the warming-driven reduction in sea ice (high confidence). Wave heights in the northwest Atlantic have also increased over the last few decades (medium confidence), but the changes in ice-free areas that would result in increased wave heights cannot be directly attributed to human-caused climate change. Wave height trends in the northeast Pacific are not statistically significant. Extreme storm surges have increased in areas of the western Arctic, Hudson Bay, and Atlantic Canada (low confidence).
Key Message 7.9: The projected lengthening of the Arctic ice-free season will cause increases in mean and extreme wave heights (high confidence) and storm surges (medium confidence). In areas of Atlantic Canada not affected by sea ice, mean wave heights are projected to decrease (medium confidence), while weak changes are projected in the northeast Pacific (low confidence). Projections of extreme wave heights in areas without sea ice provide limited evidence of increases in Atlantic Canada (low confidence).
In addition to long-term changes in mean sea level (section 7.4), considerable variability is found in sea surface heights over shorter timescales. Together, these contribute to extreme coastal water-level events (section 7.6). Considering short-term processes such as wave effects, storm surges, tides, and physical coastline changes is essential to understand changes in extreme water-level events (IPCC AR6 WGI 9.6.4) (Fox-Kemper et al., 2021).
Marine winds blowing across the surface of the ocean generate wind waves, which move away from their site of origin in the form of longer period swells (Holthuijsen, 2007) (Box 7.3). At any given location, the sea state may be made up of locally generated wind waves as well as multiple remotely generated swell systems. In Atlantic Canada, the sea state is typically dominated by wind waves, while Canada’s Pacific waters are heavily influenced by incoming swell (Lobeto et al., 2024). At high latitudes, sea ice conditions strongly influence wind waves, and can reduce or even completely suppress wave generation and propagation. Conversely, the retreat of sea ice promotes wave growth by expanding the space and time in which wind waves can form (Casas‐Prat & Wang, 2020a).
Atmospheric pressure and wind conditions can generate storm surges, which last from hours to days (Pugh & Woodworth, 2014) and are sensitive to a storm’s intensity, path, size, and speed of movement (N. B. Bernier et al., 2024). In shallow-water environments near the coast, storms can lift and push water toward the shore, resulting in a positive surge (higher water elevation). Alternatively, offshore winds can push the water away from the coast and high atmospheric pressure can press the water down, resulting in a negative surge (lower water elevation). A surge can originate thousands of kilometres from the coast and even in deep water (e.g., equatorial Kelvin waves) (N. B. Bernier et al., 2024; P. Wang et al., 2022). Much like wave activity, sea ice retreat also favours larger storm surges (P. Wang & Bernier, 2023).
Changes in ocean waves and storm surges have important consequences at global to regional scales, affecting coastal communities, ecosystems, and marine infrastructure and operations (N. B. Bernier et al., 2024; Casas-Prat, Hemer, et al., 2024). Future changes in wind waves may exacerbate coastal erosion and flooding, damage marine-built infrastructure, and affect offshore operations (Casas-Prat, Hemer, et al., 2024). Waves also play an important role in the interactions between atmospheric and oceanic processes (for example, waves can favour the break-up of sea ice) and are a source of renewable energy, which can contribute to the development of a blue economy (Casas-Prat, Hemer, et al., 2024). Positive storm surges can cause coastal flooding and erosion, while negative surges can pose risks to navigation if a ship’s draft exceeds the local water depth (N. B. Bernier et al., 2024). In combination with other weather conditions, such as heavy precipitation or streamflow, ocean waves and storm surges can lead to extreme events, such as compound coastal flooding (Chapter 8 section 8.7.2).
In this section, we will present past and future changes in ocean waves and storm surges at a regional scale and their connection to changes in marine wind and sea ice conditions.
Box 7.3: Generation, description, and impact of ocean waves
During a storm, friction between the wind and the ocean surface creates waves. The greater the area of the ocean surface over which the wind can blow (this distance is referred to as fetch), the larger the waves that can form. As waves move away from the storm centre, they disperse into multiple swell systems, since long waves travel faster away from the generation site (Box 7.3 Figure 1). The sea state at any place and time is usually a combination of locally and remotely generated waves. Parameters used to characterize ocean wave conditions include:
- Significant wave height (Hs): describes the characteristic wave height of the sea state as the average of the highest one third of waves.
- Mean wave period (Tm): describes the average time it takes for two consecutive wave crests to pass through a fixed point. The period associated with the most energetic wave system is the peak wave period (Tp).
- Mean wave direction (θm): describes the average direction of all ocean wave systems. If there are many wave systems, it is important to capture the θm associated with each system.
Hs is used in coastal, marine, and offshore engineering, as it relates to processes causing coastal flooding, erosion, and infrastructure instability. High and steep waves (which have high Hs/Tm ratios) are important contributors to beach erosion and infrastructure damage. Tm is relevant in coastal and naval engineering, as it relates to wave resonance and vessel stability, while Tp is often used in assessing coastal flooding. The combination of Hs and Tm can describe wave power. θm is a key variable affecting longshore sediment transport and long-term beach retreat.
Figure take-away: Wind waves, generated locally as a result of wind and storm activity, then propagate across the ocean as swell.
Figure title: Generation of wind waves and swell
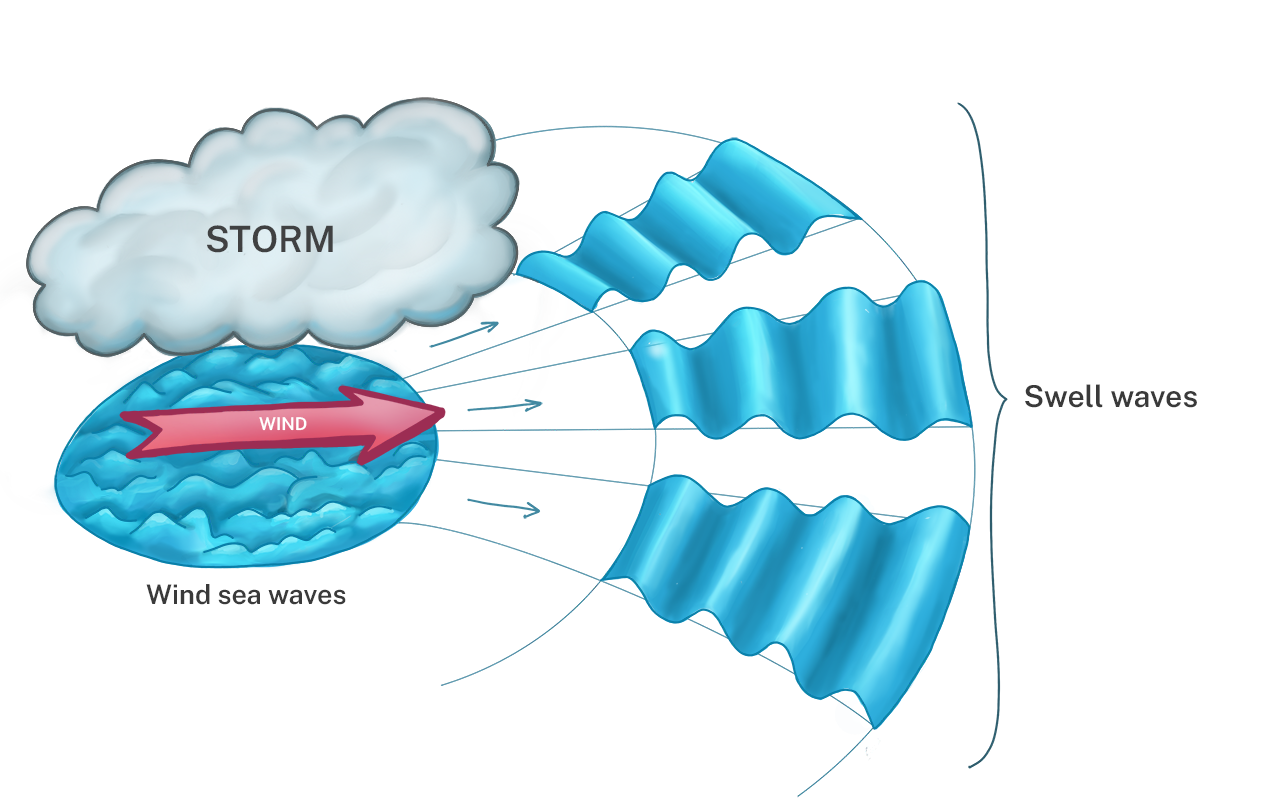
Box 7.3 Figure 1: Schematic of the generation of ocean waves and swell. Localized wind and storm activity generates wind waves. Longer waves travel faster, forming organized swells that can propagate far from the site of origin.
7.5.1: Past changes
7.5.1.1: Changes in ocean waves
Although climate-related wave observations have become increasingly available, they are not spatially and temporally uniform. Long, continuous records are scarce, and their quality may be compromised by changes in data collection methods and processing techniques over time, as seen for other climate variables (Chapter 2, section 2.3). Satellite observations provide better spatial coverage and have recently become long enough (~30 years) to enable climatological studies. However, satellite records may under-sample the extremes, particularly in the 1980s and 1990s, when fewer altimeters were in orbit. To address these limitations, wave hindcasts or reanalyses (wave simulations that integrate observations) can also be used to investigate the historical wave climate and changes in it (Casas-Prat, Hemer, et al., 2024).
In the past, the nearly year-round presence of sea ice prevented waves from posing a significant threat to Canada’s Arctic coastlines (Casas-Prat et al., 2018). However, ongoing declines in sea ice (Chapter 6, section 6.3) have allowed waves to increasingly affect this region. Recently, storm-generated waves have drastically impacted some coastal communities in the Northwest Territories (Radosavljevic et al., 2016; Whalen et al., 2022), which already experience some of the highest coastal erosion rates in the Arctic (> 4.5 m per year) (AMAP, 2021). Both satellite data and models show a remarkable increase in significant wave height (Hs) (defined in Box 7.3) between the 1990s and the 2020s (Christakos et al., 2024; Liu et al., 2016; X. L. Wang et al., 2015, 2021), with rates of increase of 1–3 cm per year in average conditions and exceeding 10 cm per year for extreme wave heights, particularly in the fall (Casas-Prat, Hemer, et al., 2024) (medium confidence). Sea ice retreat is a key driver of these rapid changes, which cannot be explained by changes in wind speed alone. A more comprehensive characterization of waves in the Arctic presents challenges because of the paucity of observations and the difficulty of measuring and modelling wave conditions in regions with partial ice cover (Casas‐Prat & Wang, 2020a).
The wave climate in the Atlantic and Pacific waters off Canada is heavily influenced by a type of storm called an extratropical cyclone (Chapter 4, section 4.4). The average significant wave height will be greater in years with more of these storms. Observed changes in the frequency and intensity of extratropical cyclones that make landfall in Canada are weak and detected in only a few seasons and regions; owing to large internal climate variability, limited observational records, and model uncertainty, there is low confidence in the attribution of these changes to human influence (Chapter 4, section 4.4). However, ocean waves impacting Canada can also be affected by changes in offshore storms, as well as changes in the storm track of extratropical cyclones. There is medium confidence that winter storm tracks over the North Atlantic and Pacific oceans have shifted poleward since the 1980s (IPCC AR6 WGI 2.3.1.4.3) (Gulev et al., 2021), with an increase in the number of intense cyclones in parts of eastern Canada and the eastern Arctic during the fall and winter (X. L. Wang et al., 2016). As reported in CCCR2019 (Greenan et al., 2019), a comparison of the 1982–2001 and 1958−1977 periods shows about a 180 km poleward shift of storm tracks in the North Atlantic and about a 260 km poleward shift of storm tracks in Canada as a whole (X. L. Wang et al., 2006).
In Atlantic Canada, waves are also affected by hurricanes that transition to post-tropical cyclones, like the recent Hurricane Fiona (Chapter 8, Box 8.5). There is generally low confidence in the changes observed in Atlantic hurricanes that impact Canada, although a recent study found an increased probability of high winds during the hurricane season in Atlantic Canada (Chapter 8, Table 8.1). Observations also suggest increases in the intensity of Atlantic hurricanes more broadly (Chapter 4, section 4.6). Eastern Canada is one of the 10 coastal regions globally that experience the highest significant wave heights during storms, with averages ranging from 3 to 6 m (Lobeto et al., 2024). Wave characteristics (described in Box 7.3) in the Atlantic and Pacific oceans correlate with large-scale patterns of natural climate variability, such as the North Atlantic Oscillation (NAO), Pacific Decadal Oscillation (PDO), El Niño–Southern Oscillation (ENSO), and others (Chapter 4, section 4.8), affecting our ability to attribute observed changes to climate change instead of natural variability in these regions (Casas-Prat, Hemer, et al., 2024; Mentaschi et al., 2017; Shimura et al., 2013).
In addition, observed and modelled wave datasets show a trend of increasing mean and extreme wave heights in Atlantic Canada over the last four decades (Figure 7.25 ) (Casas-Prat, Hemer, et al., 2024; Erikson et al., 2022; Fox-Kemper et al., 2021). This agrees with the positive trends in surface winds since the 1980s in the northwest Atlantic, which have been detected in multi-platform satellite data and many reanalysis products (see Chapter 8 section 8.4.1 on wind extremes) (IPCC AR6 WGI 2.3.1.4.4) (Gulev et al., 2021; Sharmar et al., 2021; Young & Ribal, 2019). However, the corresponding wave trends in ice-free areas have been mainly attributed to internal climate variability (Hochet et al., 2023). For example, the trend of increasing significant wave heights (< 1 cm per year) over the 1993–2018 period in the northwest Atlantic correlates with a downward trend in the North Atlantic Oscillation index. In areas off the east coast of northern Canada where sea ice is declining, significant wave heights are increasing at rates of up to 3 cm per year from October to December. Sea ice retreat in Baffin Bay during summer also supports positive trends in significant wave heights (Figure 7.25 ) (X. L. Wang et al., 2021).
Annual mean and extreme significant wave heights increased in the North Atlantic during the 20th century, but this analysis is compromised by changing data quality over this long period (Casas-Prat, Hemer, et al., 2024; Erikson et al., 2022; Meucci, Young, Aarnes, et al., 2020). In the Pacific waters off Canada, satellite data and reanalysis products do not show statistically significant trends in mean significant wave heights over the last four decades. However, corrected buoy records do indicate a negative trend in mean significant wave heights off British Columbia during this period (Gemmrich et al., 2011). It is important to note that these records do not cover a long enough period to capture the contribution of large-scale climate variability resulting from the El Niño–Southern Oscillation and Pacific Decadal Oscillation.
Figure take-away: Historically, mean wave height has significantly increased in areas of Atlantic Canada, particularly in the fall.
Figure title: Historical wave height trends
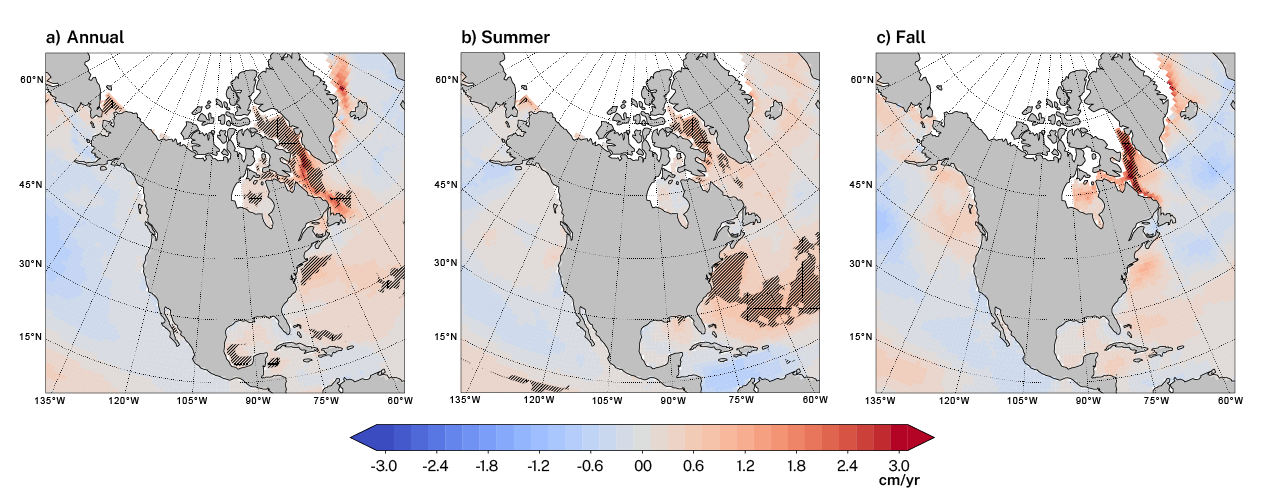
Figure 7.25 : Maps showing trends in mean significant wave height (Hs) (in cm per year) a) annually, b) in summer, and c) in fall during the 1980–2014 period. The direction and magnitude of trends are colour coded, with negative trends shown in shades of blue and positive ones, in shades of red. The statistics used incorporate ice time, assuming that when sea ice is present, the significant wave height is equal to zero (Tuomi et al., 2019). Trends were only plotted for grid points if every year of the time series had a non-zero seasonal or annual value. Summer is defined as July, August, and September (JAS) and fall as October, November, and December (OND). Hatching indicates areas of robust change, quantified by a statistically significant ensemble average, in other words, one requiring more than 50% of the member models to have a statistically significant change and more than 80% of those models with a statistically significant change to have the same direction of change. The significance of each ensemble member is at the 5% level (i.e., there is ≤ a 5% chance of concluding that an effect or trend exists when it does not). Adapted from: Casas-Prat, Hemer, et al. (2024).
7.5.1.2: Changes in storm surge
The limited observational data available (e.g., long-term tide gauge records) make assessing long-term changes in storm surge more difficult and increase the associated uncertainty. Storm surge modelling efforts aim to compensate for this deficiency. However, most existing storm surge models (Han & Lu, 2023; Muis et al., 2016; Zhai et al., 2019) do not take into account ice effects due to the challenges in modelling storm surge in areas affected by sea ice, making the assessment of changes in storm surge particularly difficult in the Arctic and at high latitudes in Atlantic Canada. Tide gauge and satellite radar altimeter data have been used to demonstrate an increase in high-frequency surge extremes (i.e., those occurring multiple times a year on average) in portions of the east coast of Canada (Bij de Vaate et al., 2024). These extremes have increased at a rate of up to 0.5 cm per year over the 1993–2021 period. In addition, driftwood accumulations can be used as a proxy for storm surges, and they indicate that the frequency of moderate storm surges may have increased in the last few decades along the Canadian portion of the Beaufort Sea coastline (MacLeod & Dallimore, 2021).
A recent surge model hindcast found significant positive trends of up to 0.5 cm per year in annual storm surge maxima in parts of Hudson Bay, in the areas southeast of Baffin Island and south of Nova Scotia, and in the western Arctic during the 1993–2020 period (Figure 7.26 ) (P. Wang & Bernier, 2023). These areas have also experienced increases in wave heights (section 7.5.1.1), owing to changes in winds and sea ice. In contrast, this same hindcast found significant negative trends in storm surge maxima in parts of the Canadian Arctic Archipelago, in this case owing to declining atmospheric pressure rather than changes in winds or sea ice, since wind-driven surges are very weak in this region (for example, see station Alert in P. Wang & Bernier, 2023). The lower rate of sea ice loss in the Canadian Arctic Archipelago than in other parts of the Canadian Arctic is responsible for the low magnitude of wind-driven storm surges in this region (Chapter 6, section 6.3.1.1). Owing to the short duration of the assessed period (1993–2020), trends like those obtained in the hindcast for south of Nova Scotia could be affected by internal climate variability, as discussed previously for ocean wave climate.
Figure take-away: Historical trends in annual storm surge maxima are positive south of Nova Scotia, southeast of Baffin Island, and in eastern Hudson Bay, but negative in the Canadian Arctic Archipelago.
Figure Title: Historical storm surge trends from a model hindcast for 1993–2020
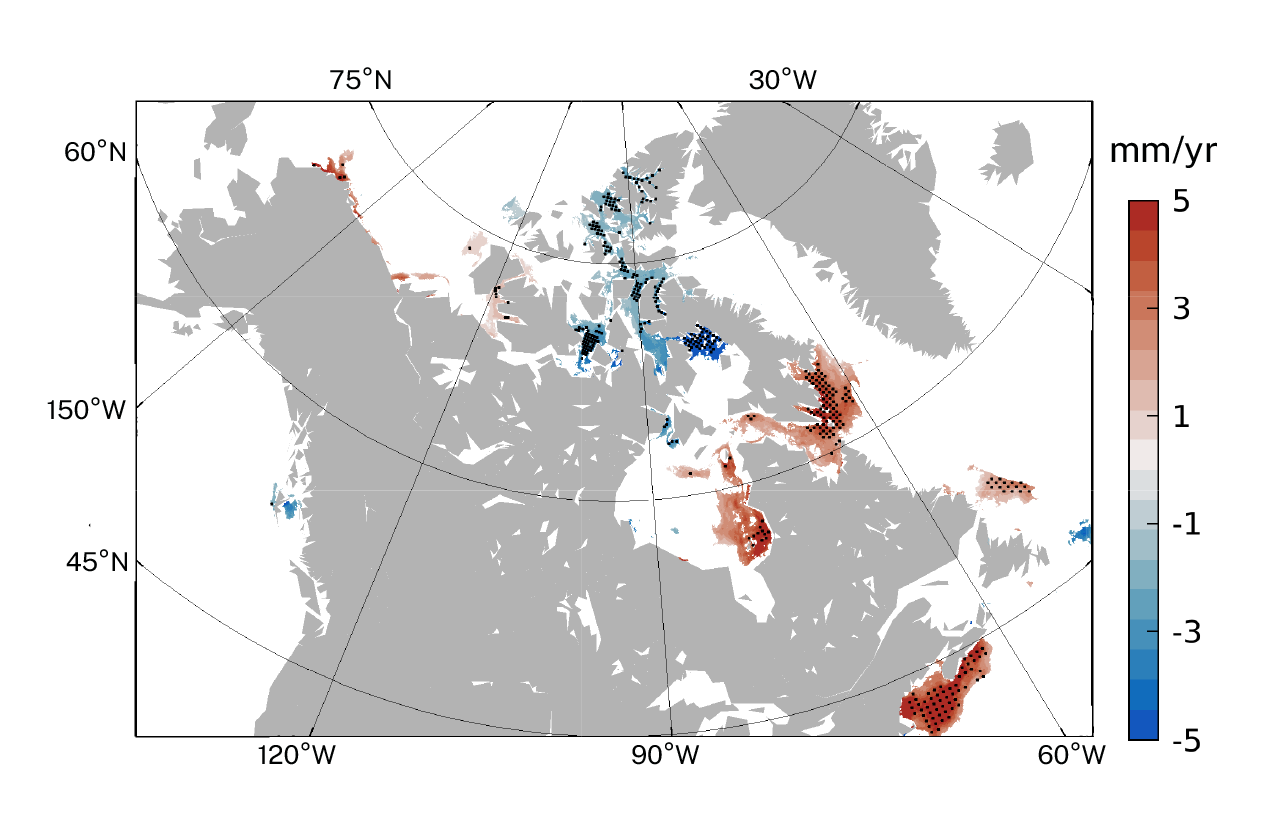
Figure 7.26 : Map showing trends (in mm per year) in annual storm surge maxima during the 1993–2020 period. The data were obtained from Environment and Climate Change Canada’s Global Deterministic Storm Surge Prediction System (GDSPS), which takes account of sea ice effects (P. Wang & Bernier, 2023). Since the modelled water levels take account of components spanning multiple timescales (i.e., tides, surges, and low-frequency variations associated with changes in water density), surge values were calculated by removing the effects of tides and low-frequency non-tidal water levels (defined in this case as having periods longer than 15 days). Trends are plotted for water depths of less than 1000 m off Canada and in adjacent areas, including the waters north of Alaska and the Gulf of Maine, where results are significant at the 20% level (≤ 20% chance of concluding that an effect or trend exists when it does not). Hatched areas indicate results significant at the 5% level (≤ 5% chance of concluding that an effect or trend exists when it does not). Adapted from: P. Wang and Bernier (2023).
7.5.2: Future changes
7.5.2.1: Ocean wave projections
Most climate models do not simulate ocean waves, which are typically investigated by using projections of surface winds, surface pressure, and sea ice conditions to generate wave projections (Casas-Prat, Hemer, et al., 2024). Because waves are affected by local and distant atmospheric patterns, wave projections generally need to be investigated at a global scale before focusing on the regional and local scales (Casas-Prat, Hemer, et al., 2024). The considerable computational effort involved explains why fewer wave projections are typically generated than other CMIP ensemble products and generally involve shorter simulation periods (20–30 years) using only a subset of the available climate models or emissions scenarios (or both), which could underestimate the total uncertainty. Statistical approaches, with their much lower computational cost, have been used to create larger ensembles (X. L. Wang et al., 2014), but have limitations in capturing complex wave patterns, such as those found in areas with sea ice (Casas-Prat, Hemer, et al., 2024).
The greatest relative changes in wave climate are projected to occur in ice-affected regions such as the Canadian Arctic. The projected retreat of sea ice and the lengthening of the ice-free season will play a crucial role in changes in wave conditions, which, in turn, are expected to result in increases in significant wave height and swell generation (Casas-Prat, Hemer, et al., 2024; Casas‐Prat & Wang, 2020a). In particular, the annual maximum significant wave height along Canada’s Arctic coastlines is projected to increase twofold to threefold by the end of the century under the very high emissions scenario (RCP8.5) (Casas‐Prat & Wang, 2020a). The ice-free season is expected to lengthen (A. D. Crawford et al., 2021), with the annual maximum significant wave height occurring later in the year, for example, shifting from September to November in the Beaufort Sea, with larger waves expected at higher latitudes (Casas‐Prat & Wang, 2020b; Jahn et al., 2024). Recent studies using CMIP6 atmospheric projections confirm the notable increases in wave height in the Canadian Arctic overall (Casas-Prat, Cicon, et al., 2024; Meucci et al., 2024), with statistically significant changes in the mean significant wave height and mean wave period by the end of the century under both the very high (SSP5-8.5) and low (SSP1-2.6) emissions scenarios (Meucci et al., 2024) (Figure 7.27 ). The uncertainty in the magnitude of these wave increases is due to the limited number of studies covering the region, the challenges in simulating interactions between sea ice and waves, and potential biases in the wind and sea ice projections. For example, CMIP6 models tend to simulate sea ice break-ups that are too early and freeze-ups that are too late (Chapter 6, section 6.3). Existing wave projection models take account of the effects of sea ice on waves (with simplifications), but do not consider the inverse—the potential effects of waves on sea ice—which could contribute to Arctic amplification (Casas‐Prat & Wang, 2020b) (Chapter 4, section 4.2). Despite these concerns, there is high confidence that wave heights will increase in the Arctic, because sea ice is projected to decline substantially, with consistently ice-free Arctic summers anticipated by mid-century (Chapter 6, section 6.3) (Jahn et al., 2024).
The projected changes are more uncertain in regions that are already ice-free. However, since CCCR2019 was published (see section 7.4 in CCCR2019) (Bush & Lemmen, 2019), the development of the first large, comprehensive ensemble of global wave projections, dubbed the COWCLIP ensemble, has significantly improved our understanding of potential changes in wave conditions (Hemer et al., 2012; Morim et al., 2019, 2020). The 155 state-of-the-art CMIP5-driven wave simulations making up this ensemble were run for areas not affected by sea ice, under the intermediate (RCP4.5) and very high (RCP8.5) emissions scenarios. The results project reduced wave activity in the Atlantic, with the mean significant wave height expected to decline by up to 5% (intermediate emissions scenario) or 10% (very high emissions scenario) by the end of the century (Morim et al., 2019). The broad agreement among ensemble members leads to medium confidence in this decline (IPCC AR6 WGI 9.6.4.2) (Fox-Kemper et al., 2021). This reduction in wave activity is consistent with climate model projections of a poleward shift in extratropical cyclones, which strongly influence wave heights. However, the wide regional variations and internal variability present result in low confidence in the projected changes in storm tracks (Chapter 4, section 4.4).
Recently developed CMIP6-driven wave projections (which include a smaller number of climate models, but account for sea ice effects) (Casas-Prat, Cicon, et al., 2024; Meucci et al., 2024) indicate a decrease of up to 10% in the mean significant wave height by the end of the century in southern Atlantic Canada under the very high emissions scenario (SSP5-8.5) (Figure 7.27 ). However, no statistically significant changes were detected under the low emissions scenario (SSP1-2.6). In a similar way to what is projected to occur in the Arctic, the regions in eastern Canada where sea ice is expected to decline, such as the Labrador Sea, Davis Strait, Baffin Bay, and Hudson Bay, are expected to experience an increase of over 25% in significant wave heights under the low emissions scenario (SSP1-2.6) and an increase of over 40% under the very high emissions scenario (SSP5-8.5) (Figure 7.27 ).
In the northeast Pacific, the projected changes in mean significant wave heights are less evident. Statistically significant trends in this parameter cannot be derived from the results of the large COWCLIP ensemble (based on CMIP5 models). However, the models do indicate a tendency for up to a 10% greater wave energy fluxFootnote 14 along Canada’s Pacific coastline, due to the increase in swells originating in the southern Pacific Ocean and the Southern Ocean (Casas-Prat, Hemer, et al., 2024). More recent studies based on CMIP6 (Casas-Prat, Cicon, et al., 2024; Meucci et al., 2024) project a decrease in the mean significant wave height (of up to 5%) under the very high emissions scenario (SSP5-8.5) (Figure 7.27).
There is low agreement in the projected changes in extreme wave conditions in the Pacific and Atlantic oceans around Canada, owing to the challenges of modelling extremes (Lobeto et al., 2021; Meucci, Young, Hemer, et al., 2020; Patra et al., 2021; Seneviratne et al., 2021). An increasing number of projections agree on a future increase in significant wave height extremes in parts of Atlantic Canada (Bernardino et al., 2023; Camus et al., 2017; D’Agostini et al., 2022; Lobeto et al., 2021; Meucci, Young, Hemer, et al., 2020). However, there is low confidence in the projected changes in extratropical and tropical storm intensity and frequency in this region that are linked to an increase in wave height extremes (Chapter 4, sections 4.4 and 4.6).
Figure take-away: Substantial changes are projected to occur in annual mean wave heights in regions where sea ice is expected to decline.
Figure title: Projected changes in mean significant wave heights
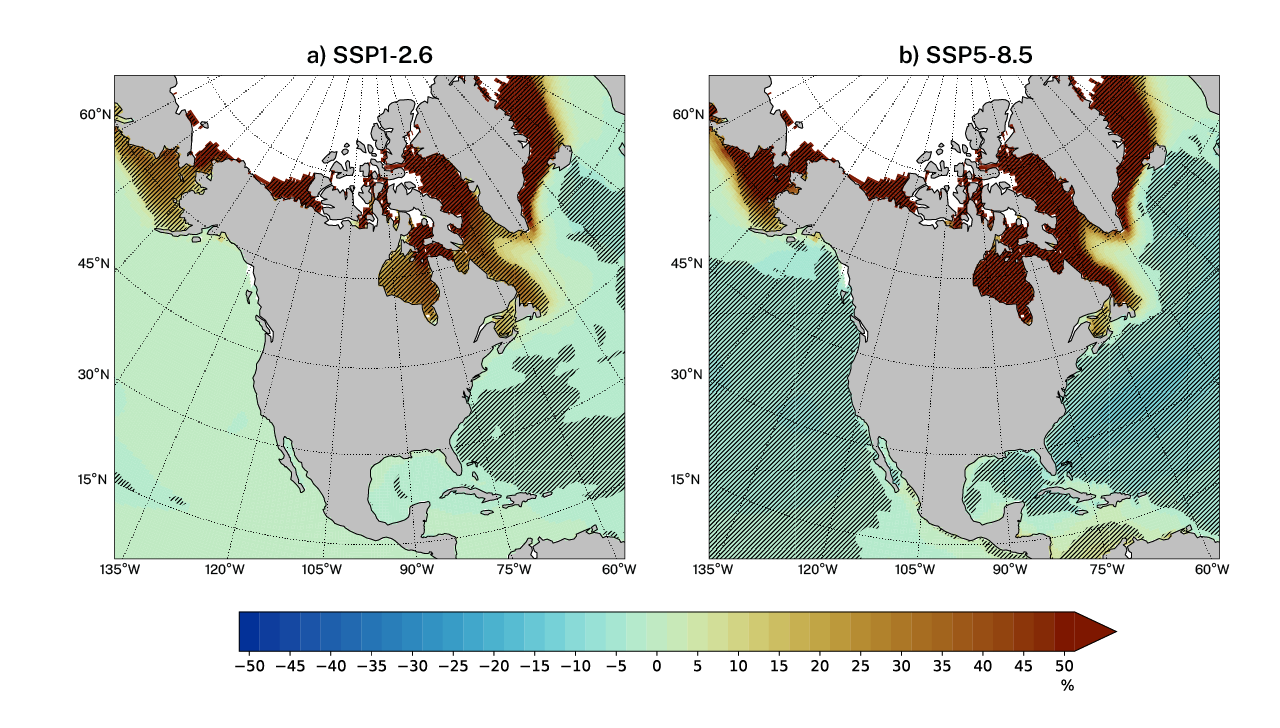
Figure 7.27 : Maps showing the projected change (%) in annual mean significant wave heights by 2071–2100 (relative to 1985–2014) under the a) low (SSP1-2.6) and b) very high (SSP5-8.5) emissions scenarios, based on projections by an eight-member model ensemble (Meucci et al., 2024). The different colour gradations represent the projected decline (blues and greens) or increase (yellows and reds) in wave height. These projections use ice-time-included statistics, which consider the whole time window of analysis and assume that, when sea ice is present, the significant wave height is equal to zero (Tuomi et al., 2019). Hatching indicates areas of robust change, quantified by a statistically significant ensemble average, in other words, one requiring more than 50% of the member models to have a statistically significant change and more than 80% of those models with a statistically significant change to have the same direction of change. The significance of each ensemble member is at the 5% level (≤ 5% chance of concluding that an effect or trend exists when it does not). Adapted from: Meucci et al. (2024).
7.5.2.2: Storm surge projections
Projected changes in storm surge are uncertain, due to the limited number of studies on this topic, as well as the challenges involved in simulating the underlying drivers of these changes. As is the case for waves, climate models do not typically provide projections of storm surges. For regions of Canada that experience seasonal sea ice, such as the southern Beaufort Sea, Hudson Bay, and Atlantic Canada, the uncertainties may stem in part from sea ice projections. On average, CMIP6 models project that the ice-free period could expand by 31 days per 1°C of global warming in seasonally ice-free Arctic waters (see Chapter 6, Table 6.1). In regions where the ice-free season is expected to be longer in the future, storm surges could increase (see, for example, Kim et al. (2021)), as is expected for ocean waves. These effects could be amplified by feedbacks between atmospheric and sea ice conditions, as the diminishing sea ice promotes stronger surface winds (Mioduszewski et al., 2018), which, in turn, favour higher storm surges.
To date, only one multi-model ensemble has been developed for global storm surge projections. It considers five climate models that provide simulations for the period 2021–2050) under the very high emissions scenario (SSP5-8.5) (Muis et al., 2023). The projected changes in storm surge on the east and west coasts of Canada are not statistically significant, due in part to the considerable variability among model results. Notably, the ensemble does not consider sea ice effects, which strongly limits its applicability in the Canadian Arctic and Atlantic Canada (P. Wang & Bernier, 2023). In the northeast Pacific, according to a subset of CMIP5-driven regional surge projections, the 99th percentile of daily storm surge maxima could increase by up to 10% by the end of the 21st century under the very high emissions scenario (RCP8.5) (Cousineau & Murphy, 2022). However, the simplified boundary conditions in this regional storm surge model (which constrain how the model simulates surge conditions that originate far from the coastline) and the large variability in the results from the regional climate models involved result in low confidence in these projections.
Although the strength of intense tropical cyclones will increase in a warmer climate, there is low confidence in the projected increases in their wind speeds once these storms reach Atlantic Canada, and the changes in their frequency are also uncertain (Chapter 4, section 4.6). In addition, extreme storm surges and wave heights do not necessarily increase in a warmer climate, due to internal climate variability (Shimura et al., 2022).
7.5.3: Confidence terms in key messages: summary of evidence
[Key messages are provided here for ease of review but may not appear in this section in final text.]
Key Message 7.8: Mean and extreme wave heights have increased in Arctic and sub-Arctic regions, primarily as a result of the warming-driven reduction in sea ice (high confidence). Wave heights in the northwest Atlantic have also increased over the last few decades (medium confidence), but the changes in ice-free areas that would result in increased wave heights cannot be directly attributed to human-caused climate change. Wave height trends in the northeast Pacific are not statistically significant. Extreme storm surges have increased in areas of the western Arctic, Hudson Bay, and Atlantic Canada (low confidence).
In the areas affected by sea ice (which include the Arctic and part of Atlantic Canada), there is greater confidence in wave height trends, since sea ice retreat is a key driver of increasing wave height (Casas-Prat, Hemer, et al., 2024; Christakos et al., 2024; Liu et al., 2016; X. L. Wang et al., 2015, 2021). The observed decline in sea ice, the consistency among historical wave datasets (modelled and observed) in reproducing increasing wave heights, and the understanding that ocean wave heights increase as sea ice retreats (although with uncertainty in the estimates) all lead to high confidence in the positive wave trends along Arctic coastlines on a regional scale.
A recent review of several wave products and satellite observations (Casas-Prat, Hemer, et al., 2024) indicates that overall wave trends in the Pacific are not significant, but that a statistically significant positive trend can be found in Atlantic Canada, particularly during the fall, which we assessed as medium confidence. However, these trends cannot be attributed to human-caused climate change, because of the strong internal climate variability linked to atmospheric and coupled atmosphere-ocean modes of variability (including the North Atlantic Oscillation and El Niño–Southern Oscillation, respectively) (Casas-Prat, Hemer, et al., 2024).
There is also a good understanding that reduced sea ice cover (Mioduszewski et al., 2018) promotes higher storm surges, which explains the positive trends obtained in some parts of the Arctic and upper latitudes of Atlantic Canada, which were derived from modelled data or proxy observations (or both). However, competing factors, such as increases in sea surface pressure, could also affect surges. This, together with the limited number of historical surge studies in the Arctic (Bij de Vaate et al., 2024; P. Wang & Bernier, 2023), has led to our assessment of low confidence that storm surges have increased in areas of the western Arctic, Hudson Bay, and Atlantic Canada.
Key Message 7.9: The projected lengthening of the Arctic ice-free season will cause increases in mean and extreme wave heights (high confidence) and storm surges (medium confidence). In areas of Atlantic Canada not affected by sea ice, mean wave heights are projected to decrease (medium confidence), while weak changes are projected for the northeast Pacific (low confidence). Projections of extreme wave heights in areas without sea ice provide limited evidence of increases in Atlantic Canada (low confidence).
Studies on wave projections in the Arctic—or global studies that include the Arctic region—that take account of CMIP-based projections of changes in winds and sea ice are limited (Casas‐Prat & Wang, 2020a; Meucci et al., 2024). Regional discrepancies in the rates of sea ice retreat and challenges in modelling waves in waters with partial sea ice coverage lead to uncertain wave projections. However, there is high confidence that the projected sea ice retreat in the Arctic (Chapter 6, section 6.3) will result in increasing wave heights, because the larger area of ice-free water will support more wave generation and propagation (Casas‐Prat & Wang, 2020b; Li et al., 2019; Nederhoff et al., 2022; Thomson & Rogers, 2014). The substantial projected decline in sea ice is mechanistically understood to favour increases in storm surge; however, no studies involving surge projections explicitly account for projected changes in wind fields and sea ice conditions and, therefore, we have medium confidence in the projected changes in storm surge in the Canadian Arctic.
A large ensemble of CMIP5-based wave projections shows a decrease (significant at the 95% level, meaning that there is ≤ a 5% chance of concluding that an effect or trend exists when it does not) in mean wave height along the Atlantic coastlines (excluding areas affected by sea ice) (Morim et al., 2019). A similar signal is not seen in the Pacific. These results generally align with those from recent studies involving a small ensemble of CMIP6 models, despite some discrepancies for the North Pacific (Casas-Prat, Cicon, et al., 2024; Meucci, Young, Hemer, et al., 2020). The consistency among studies leads to medium confidence in the wave projections in the northwest Atlantic; this agrees with the IPCC’s overall assessment of medium confidence in projections of changes in mean wave climate (IPCC AR6 WGI 11.7.4). We have low confidence in the projections for the Pacific coast, due to the lack of consistency in the CMIP6 results.
Future changes in extremes are uncertain. The results of existing studies not only are surrounded by uncertainty, but are sometimes even contradictory, although recent investigations point toward an increase in wave height extremes in Atlantic Canada. However, these results are affected by several limitations, such as the coarse representation of atmospheric forcing and inaccurate representation of tropical cyclones. Combined, this evidence supports the assessment of low confidence in changes in the extremes.
7.6: Extreme sea level
Key Message 7.10: Extreme sea-level events have increased in frequency and magnitude in places along Canada’s coastline where the relative sea level has risen over the past century, such as southern Atlantic Canada, the western Arctic, and British Columbia (high confidence).
Key Message 7.11: Extreme sea-level events are projected to occur more often and to become larger because of future increases in relative sea-level rise in many parts of Canada (high confidence). The projected decline of sea ice along Canada’s Arctic and Atlantic coasts will result in increased waves and storm surges, which will exacerbate extreme sea-level events (high confidence).
Extreme sea level is defined for this report as an exceptionally high local sea surface height arising from a combination of short-term phenomena, such as storm surges, tides, and waves (see Figure 7.28). Relative sea-level changes, including those resulting from anthropogenic climate change, directly affect the frequency and intensity of extreme sea levels by altering mean water levels (see Chapter 8, upper part of Box 8.1 Figure 1). In shallow coastal areas, they can also influence the variability in sea surface height by modulating the depth available for the propagation of tides, waves, and surges (see Chapter 8, lower part of Box 8.1 Figure 1). Moreover, such variability can also be impacted by weather-driven changes in storm surges and waves (section 7.5).
Regional sea-level change has been the main driver of changes in extreme sea levels as measured by the global tide gauge network during the 20th century (high confidence), and is expected to also be the main driver of a substantial increase in the frequency of extreme sea levels over the next century (medium confidence) (IPCC AR6 WGI 9.ES) (Fox-Kemper et al., 2021). Extreme sea levels can be influenced by changes in the frequency, tracks, or strength of weather systems, as well as large-scale climate processes such as the El Niño–Southern Oscillation (Han & Lu, 2023; Zhai et al., 2019). These processes operate at a wide range of time and spatial scales, and are discussed in greater detail in Woodworth et al. (2019).
Extreme sea levels are an important issue because of their potential to cause flooding and erosion, among other impacts, which can lead to significant damage to coastal communities, ecosystems, and infrastructure, according to Chapter 4 of the IPCC Special Report on the Ocean and Cryosphere in a Changing Climate (Oppenheimer, M. et al., 2019). When combined with other weather or climate processes, such as heavy precipitation or streamflow, extreme sea level can result in amplified hazards, including compound coastal flooding (Chapter 8, section 8.7.2).
In this section, we will present and assess historical observations of extreme sea levels for several representative coastal locations in Canada. We will also discuss future changes in extreme sea levels using the projected relative sea-level changes presented in section 7.4, and highlight the coastal areas where changes in waves and storm surges (section 7.5) could also affect extreme sea levels. The analyses in this section build on and extend the results of section 7.5.3 in CCCR2019 (Greenan et al., 2019).
Figure take-away: Several different factors contribute to extreme sea levels along the coast.
Figure title: Extreme sea levels along the coast
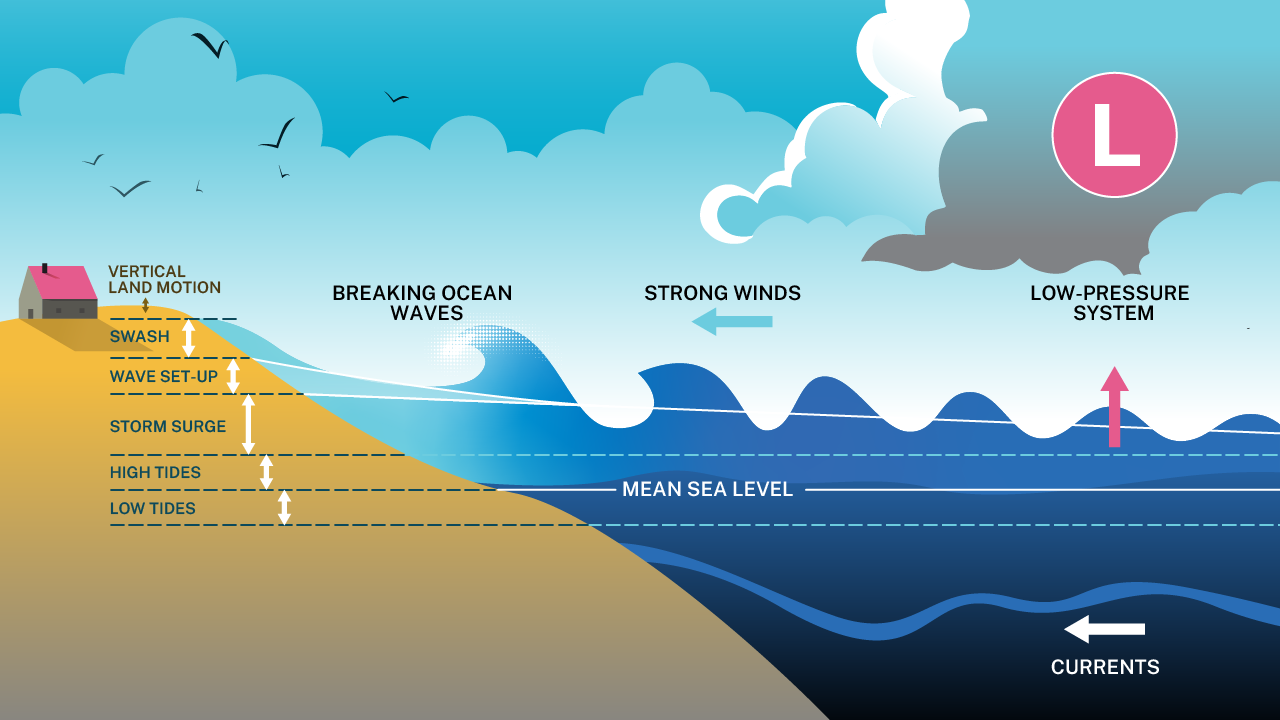
Figure 7.28 : Illustration of the factors contributing to extreme sea levels along the coast. Low-pressure systems and strong winds blowing onshore raise the surface of the ocean relative to the mean sea level and produce positive storm surges. Moreover, as ocean waves approach the coast, the friction with the ocean bottom causes the waves to break, which in turn leads to another elevation of the ocean surface, called wave set-up. As this wave set-up eventually reaches the shore, it is washed up on the beach with a quick motion called swash. Wave set-up and wave swash together compose the wave run-up. Extreme sea level can result from a combination of these processes, and is often most hazardous during high astronomical tides. It is important to note that the mean sea level fluctuates by season, decade, and longer-term timescales, and that these fluctuations also affect extreme sea levels. Vertical land motion can also contribute to changes in extreme sea levels over timescales of decades and longer. Adapted from: Woodworth et al. (2019).
7.6.1: Past changes
There is strong evidence that the frequency of coastal flooding has increased in regions of Canada where relative sea levels have risen (Greenan et al., 2019). As one example, long-term relative sea-level trends have driven the increase in the annual occurrence of extreme sea levels measured at the Halifax tide gauge from 1920 to 2023 (Figure 7.29 ). The number of annual occurrences in Halifax has risen rapidly in recent decades, as a result of the acceleration of global mean sea-level rise (Figure 7.3). Other parts of the Canadian coastline where relative sea levels are rising are experiencing similar trends. When the effects of relative sea-level rise are removed from the Halifax tide gauge record, the incidence of extreme sea levels is similar between the periods of 2004–2023 and 1960–1980. This indicates that the long-term increase in the frequency of extreme sea-level events seen in Halifax is caused by relative sea-level rise, and not by an increase in the frequency of storm events. This agrees with previous global studies indicating that much of the trend in extremes is due to the change in the mean sea level (Menéndez & Woodworth, 2010).
Tuktoyaktuk is another location where the relative sea level is rising and, like Halifax, this location is also experiencing an increase in extreme sea-level events (Figure 7.29). However, the tide gauge record in Tuktoyaktuk has significant data gaps that make it more difficult to determine long-term trends in the frequency of these events. For those locations in Canada experiencing only small changes in relative sea level in the past century (e.g., Rimouski and Vancouver), no significant trend has been found in the frequency of extreme sea-level events. In contrast to the locations experiencing relative sea-level rise, places such as Tofino and Churchill have experienced a decrease in relative sea level and, hence, have also observed a decrease in extreme sea-level events in the last several decades.
Figure take-away: Sites experiencing relative sea-level rise are also experiencing an increase in extreme sea-level events.
Figure title: Trends in extreme sea-level events and relative sea-level changes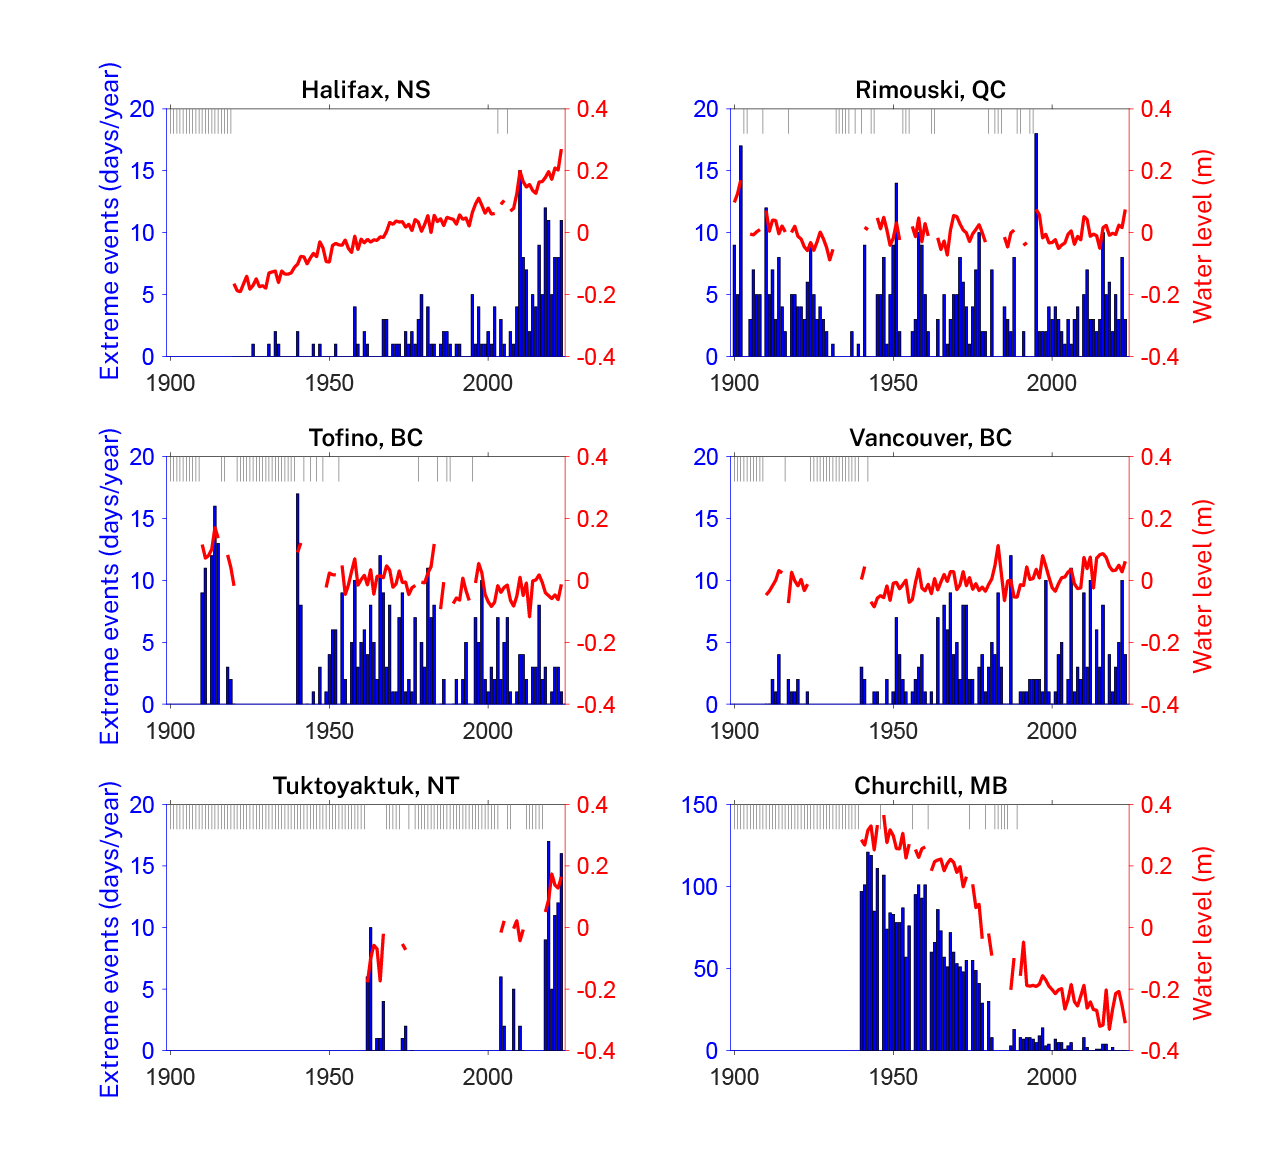
Figure 7.29 : Trends in the annual number of extreme sea-level events (days per year) in relation to trends in relative sea-level changes (m). The red lines and right-hand axis show the change in annual mean relative sea level at six selected tide gauge sites. The blue bars and left-hand axis show the number of annual occurrences of extreme sea-level events above the 99th percentile daily maximum value calculated for the 1995–2014 period. Mean water levels and extreme events are only presented for years where more than 80% of the days had good quality data. The grey vertical line along the top of each graph indicates the years that did not meet the data availability criteria. Data source: National Oceanography Centre (2025).
While mean sea-level rise has been the major contributor to changes in extreme sea levels, changes in regional climate and storms could also play an important role in some locations (Marcos & Woodworth, 2017; Rohmer & Cozannet, 2019). In regions of the Arctic where sea ice has been declining due to climate change, it is likely that storm surge and waves have increased (section 7.5). However, outside of areas affected by sea ice, there is limited evidence that changes in storm surge have resulted in increased extreme sea levels. For example, a recent historical dataset of modelled high-resolution storm surge data (P. Wang & Bernier, 2023) suggests an increase of approximately 5 mm per year in the annual surge maxima for Halifax during the 1993–2020 period, but this analysis may be affected by internal climate variability due to the limited period of available data (section 7.5). Similarly, wave run-up (wave set-up plus swash) has been identified as a potential contributor to extreme sea levels, but we have not assessed this contribution because of a lack of long-term data in Canada.
Extreme sea levels along Canada’s coastlines can also be influenced by internal climate variability on a seasonal to decadal timescale (Han & Lu, 2023; Zhai et al., 2019). A negative correlation between the Southern Oscillation Index (a metric for El Niño) and extreme sea levels has been observed along the west coast of North America, meaning that unusually high extreme sea levels are expected along Canada’s Pacific coast during El Niño years (Muis et al., 2018). This correlation is mostly due to the influence of El Niño on changes in ocean volume that are related, in turn, to changes in seawater density (referred to as the steric component of sea-level change) and its relationship to extreme sea levels (Muis et al., 2018). Similarly, the North Atlantic Oscillation affects extreme sea levels in eastern Canada, which is related in part to the negative correlation between the North Atlantic Oscillation and regional mean sea level. Long- and medium-term tidal cycles can also modulate extreme sea levels along the coast; however, these effects are relatively small (Enríquez et al., 2022).
Box 7.4: Frequency of extreme sea-level events
One metric used to characterize the frequency of extreme sea-level events is the annual exceedance probability (AEP). AEP is the probability that an extreme sea-level event of a certain magnitude will occur in any given year. The AEP is expressed as a percentage—for example, a 1% AEP means that there is a 1% chance of an extreme sea-level event of a given magnitude happening in a particular year. This concept is closely related to that of a 1-in-100-year event, or an event of a specific magnitude that has a statistical probability of occurring once every 100 years on average, corresponding to a 1% AEP. However, this does not mean that such an event will only happen once in a century but, instead, represents a long-term average. Many people mistakenly think that, once a 100-year event happens, another will not occur for another century, but this is incorrect. Multiple 100-year floods could occur in a short period, or none could occur for a period much longer than 100 years. Therefore, AEP better communicates to non-experts the ongoing, annual risk of experiencing a major extreme sea-level event.
7.6.2: Future changes
With the exception of a few regions around the world that have substantial land uplift (including some parts of Canada; see section 7.4), relative sea-level rise is very likely to virtually certain (depending on the region) to continue during the 21st century, contributing to increased coastal flooding in low-lying areas (high confidence) and coastal erosion along most sandy coasts (high confidence) (IPCC AR6 WGI TS.4.3) (Arias et al., 2021). By 2050, the historical 1% average annual exceedance probability (AEP) (a 1% chance of a location experiencing coastal flooding in a given year, see Box 7.4) associated with a specific extreme sea-level event is projected to increase to an average AEP of 2–50% in most high-latitude regions under both the intermediate (RCP4.5) and very high (RCP8.5) emissions scenarios (Vousdoukas et al., 2018). By 2100, present-day 1% average AEP levels are projected to be exceeded multiple times each year almost everywhere. These results are limited by the use of coarse-resolution atmospheric models, coarse coastal bathymetry, the reduced number of climate models considered, simplified computation of wave run-up, lack of feedback processes, and simplification (or exclusion) of sea ice effects.
To date, in studies using individual models to simulate different contributions to extreme sea levels, non-linear interactions are not well captured, and uncertainties associated with downscaling methodologies are poorly resolved, leading to low confidence in the available extreme sea-level projections that include modelled wave and surge contributions (IPCC AR6 WGI 9.6.4.2) (Fox-Kemper et al., 2021). Despite the lack of quantitative assessments of how future wave heights and surges might translate to extreme sea levels along Canada’s Arctic coastlines, a positive correlation has been observed between the retreat of sea ice on one hand, and ocean wave heights and storm surges on the other hand (section 7.5). This implies that the increase in surges and wave heights resulting from sea ice retreat will likely exacerbate increases in extreme sea levels in this region. In summary, although waves and surges are non-negligible contributors to projected extreme sea-level changes (Jevrejeva et al., 2023; Melet et al., 2020; Muis et al., 2020; Vousdoukas et al., 2018), relative sea-level change is expected to be the main driver in changes to future extreme sea levels in most areas (medium confidence) (IPCC AR6 WGI TS.4.3) (Arias et al., 2021).
Two methods are generally used to project future extreme sea-level changes. The first one, the static approach, uses historical tidal, surge, and wave information and adjusts future extreme sea-level distributions by adding the projected mean relative sea-level rise to these values (see Chapter 8, Box 8.1 Figure 1). The second, the dynamic approach, employs hydrodynamic or wave models (or both) that are forced with atmospheric fields derived from general circulation models (GCMs). These models also project changes in tidal, storm surge, and wave distributions, which are then combined with relative sea-level projections to project future extreme sea levels. The static approach has limitations because it relies on historical data and does not account for trends in storm conditions or feedback processes. However, the dynamic approach has a very high computational cost, and is limited by uncertainties in the projected changes in atmospheric dynamics (Chapter 4, section 4.4), as well as in waves and storm surge (section 7.5).
As discussed in section 7.4.2.2 (Figure 7.22), the acceleration of global sea-level rise will cause the relative sea level to increase in many locations along Canada’s coastlines. In Figure 7.30, we have used the static approach described above to illustrate extreme sea-level changes at six selected locations in Canada under the intermediate emissions scenario (SSP2-4.5). In the example for Halifax, the model assumes that the relative mean sea level has increased by 0.28 m, which is the median projection under the intermediate emissions scenario (SSP2-4.5) for 2050 (section 7.4.2.2). Using this approach, an extreme sea-level event that has an AEP of 1% in 2024 will see it increase to 14% by 2050 (a 14-fold increase). By 2100, the relative mean sea level is projected to increase by 0.68 m, and a 1% AEP event would be expected to become an annual one, representing a 100-fold increase. It is important to note that, in the case of rare events—those with an annual probability of occurrence below 1%—the extreme value analysis methods can result in uncertainties comparable to or even greater than the uncertainty associated with mean regional sea-level rise (Wahl et al., 2017).
Figure take-away: The frequency of coastal flooding is expected to increase in five of the six locations assessed in Canada.
Figure title: Projected changes in annual extreme sea levels
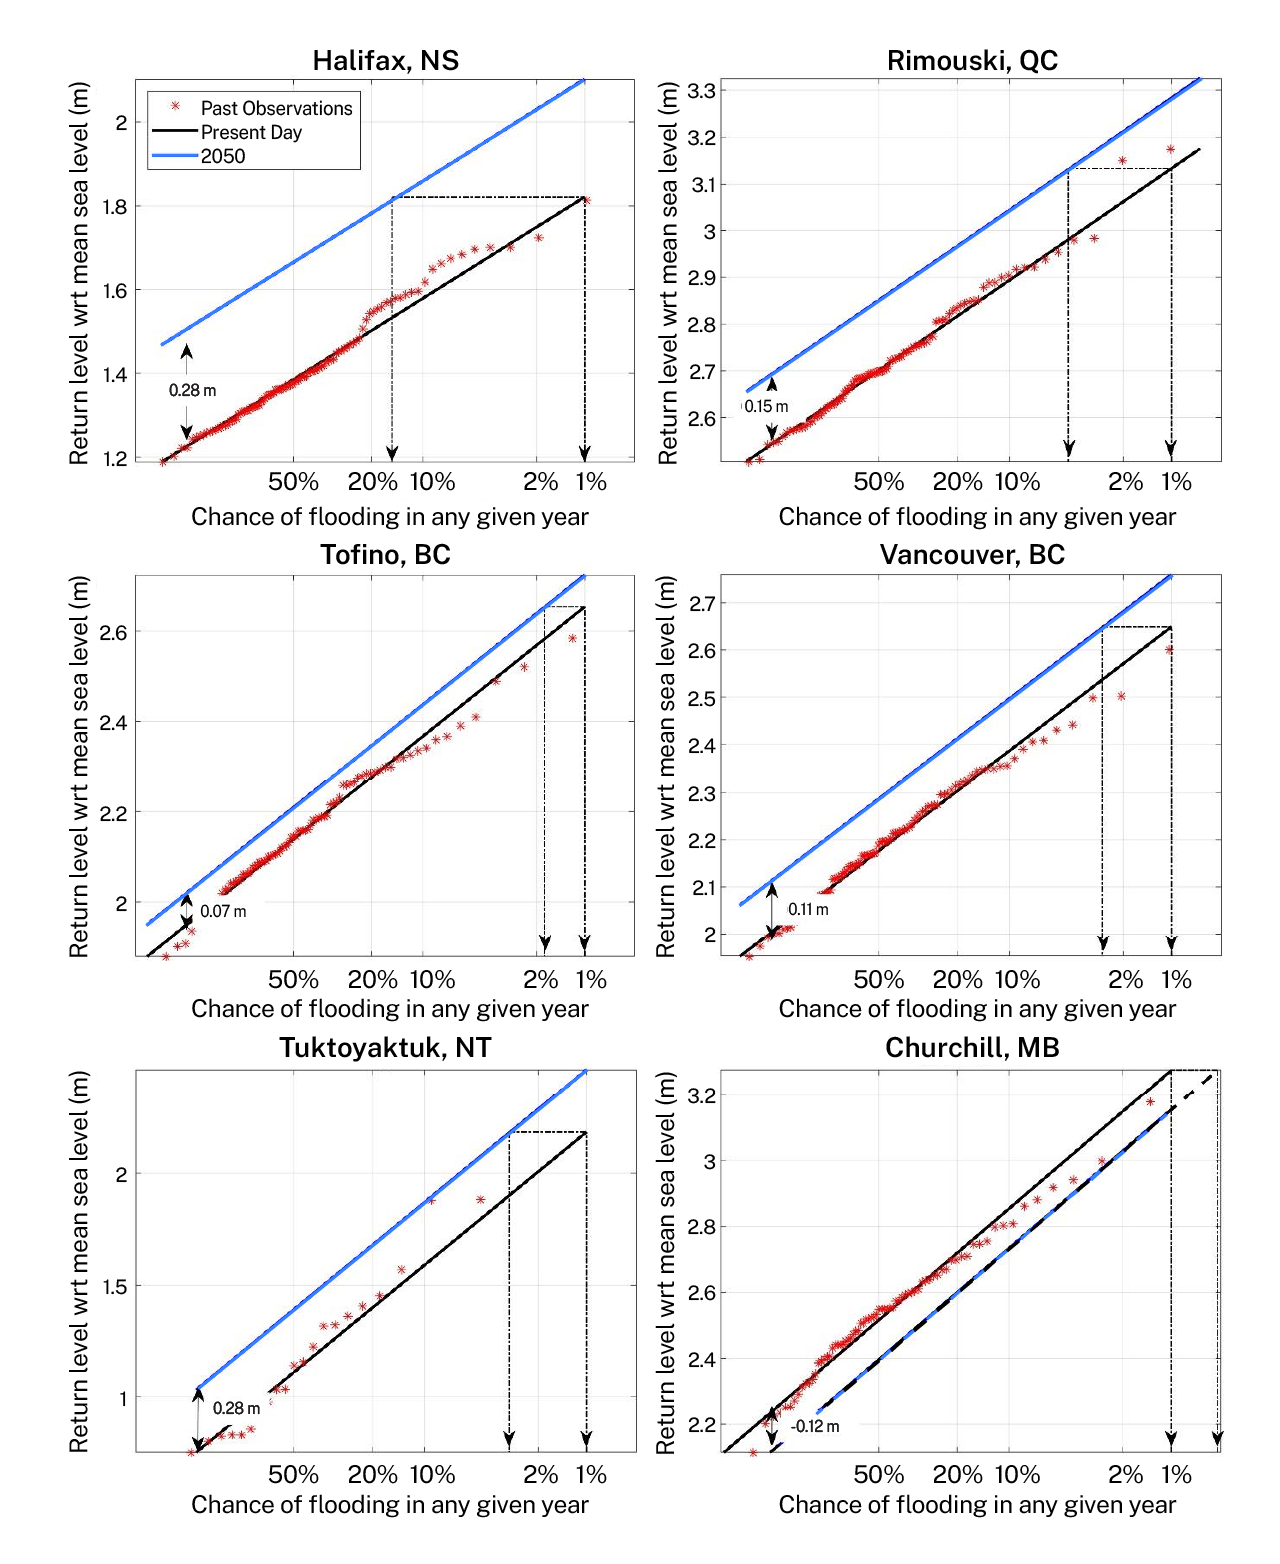
Figure 7.30: Chance of flooding in any given year at six locations in Canada in the present day and in the year 2050. The y-axis shows the return level with respect to mean sea level in question and the x-axis, the chance of this occurring in any given year. The red stars show the observed annual maxima for hourly water levels relative to the annual mean, derived from tide gauge observations. The years for which annual maxima are available differ for each location (see Figure 7.29). The annual maxima are mapped against the current annual exceedance probability (AEP) for each value. The solid black line represents the best fit to the current annual extreme water levels. The blue line shows the projected extreme sea levels and their AEPs in 2050 for the median projection under the intermediate emissions scenario (SSP2-4.5). The dashed arrows show the projected change by 2050 for annual maxima with current AEPs of 1%. Data source: Permanent Service for Mean Sea Level (2025).
At Rimouski, Tofino, Vancouver, and Tuktoyaktuk, the mean sea level associated with a 1% AEP in 2024 is projected to have an AEP of less than 5% in 2050 under the intermediate emissions scenario (SSP2-4.5), a change that is significantly smaller than that projected for Halifax. The larger range of annual maxima for hourly water levels at Tuktoyaktuk means that, even though the forecasted relative sea-level change is similar to the one for Halifax, Tuktoyaktuk is projected to experience a smaller increase in the frequency of extreme sea-level events. The projected relative sea-level changes at Rimouski, Tofino, and Vancouver are roughly less than half that at Halifax, and this results in smaller projected changes to AEP percentages.
Owing to the rapid uplift of land at Churchill, the relative sea level is projected to fall by 0.12 m by the year 2050 under the intermediate emissions scenario (SSP2-4.5) (section 7.4.2.2). This results in a projected reduction in the current 1% AEP to 0.5% at 2050. While this suggests that coastal flooding from extreme events will become a less prevalent hazard in areas like Churchill, extreme low water level events continue to pose risks to transportation and navigation safety.
In situations such as fishing harbours, where the relative sea level is increasing and human retreat from the coast is prohibitively expensive, the height of the infrastructure will have to be raised in order to maintain flooding risks at desired levels. One approach to planning in these situations is to determine a vertical allowance that can accommodate the projected sea-level rise (Figure 7.31). This allowance is defined as the height by which the infrastructure needs to be raised in order to maintain the current level of flooding risk under a future sea-level rise scenario, and depends on the designed operational lifetime of the infrastructure. Such an approach incorporates the relative sea-level change projected in the IPCC AR6 report and its associated uncertainty (James & Brierley-Green, 2026), as well as the local tidal range and storm surge history (Zhai et al., 2019; H. Zhang & Sheng, 2013). Allowances are provided on the Canadian Extreme Water Level Adaptation Tool website for all DFO small craft harbours, and at ClimateData in the form of a gridded data product for various IPCC AR6 scenarios. Additional information on adaptation options can be found at the Natural Resources Canada Climate-Resilient Coastal Communities Program.
Coastal ecosystems can serve as a first line of defence along shorelines against extreme sea levels and destructive wave energy. To learn how salt marsh restoration is being explored as an adaptation practice in Nova Scotia, read Case Story 1.3 of the Regional Perspectives Report, a report that contributed to the Canada in a Changing Climate: National Assessment Process report.
Figure take-away: Various factors determine the vertical allowance for coastal infrastructure under relative sea-level rise.
Figure title: Vertical allowances for coastal infrastructure
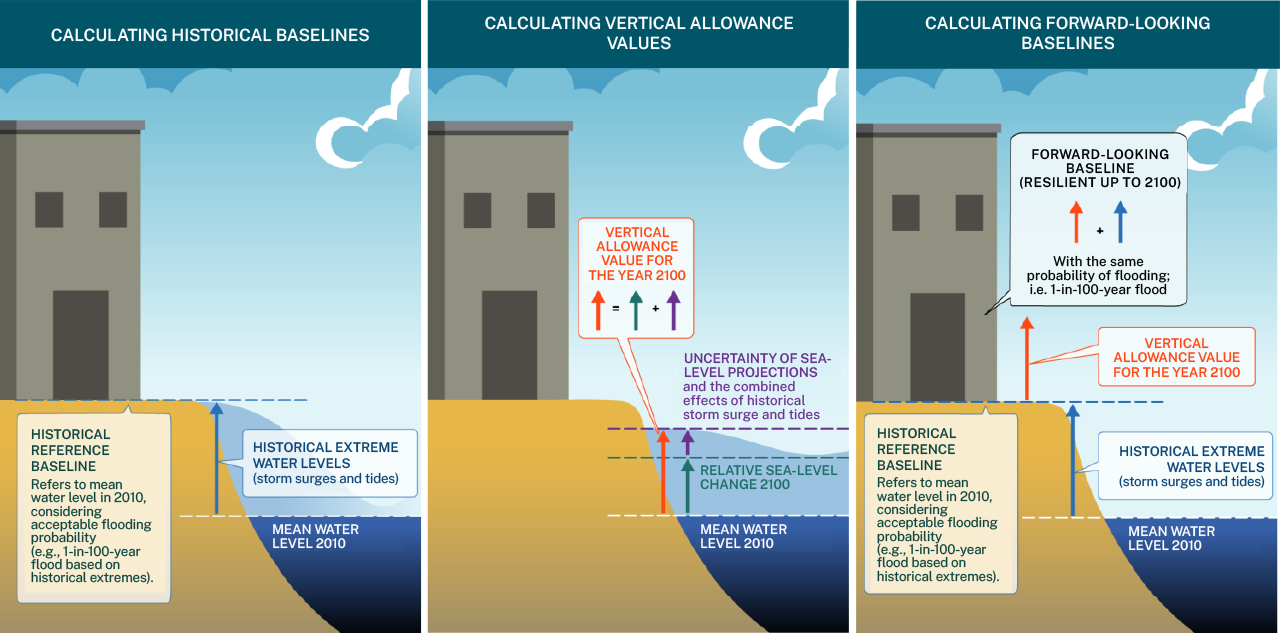
Figure 7.31 : Illustration of the method used in planning vertical allowances for coastal infrastructure. The panel on the left illustrates planning based on the recent mean water level (e.g., in the year 2010 in this case) and the historical water level records (typically from a tide gauge and incorporating storm surges and tides). This results in a historical baseline incorporating an annual exceedance probability (AEP) level chosen by the coastal planner that represents an acceptable risk level (e.g., 1% AEP, or a 1-in-100-year event). The middle panel shows the vertical allowance for a future date (e.g., the year 2100 in this case), comprised of the relative sea-level change in the year 2100 and the uncertainty in that projection. The panel on the right shows the vertical allowance for the year 2100, which is added to the historical reference baseline to provide the planner with the height that the infrastructure should be raised to maintain the chosen AEP level at 2100. Adapted from: Canadian Centre for Climate Services (2025b)
7.6.3: Confidence terms in key messages: summary of evidence
[Key messages are provided here for ease of review but may not appear in this section in final text.]
Key Message 7.10: Extreme sea-level events have increased in frequency and magnitude in places along Canada’s coastline where the relative sea level has risen over the past century, such as southern Atlantic Canada, the western Arctic, and British Columbia (high confidence).
The scientific understanding is clear that a positive relative sea-level change leads to the increased frequency and magnitude of extreme sea-level events, as has been shown in the many studies cited in Chapter 9 of the IPCC AR6 WGI report (high agreement and robust evidence). In Canada, high-quality historical relative sea-level data are available from a network of tide gauges and GPS stations (section 7.4.1.2). We have used these data to demonstrate the relationship between relative sea-level rise and the increase in extreme sea-level events at selected locations in Canada (section 7.6.1). This analysis, combined with our understanding of how relative sea-level change affects the frequency and magnitude of extreme sea-level events, provides the basis for the assessment of high confidence in this key message.
Key Message 7.11: Extreme sea-level events are projected to occur more often and to become larger because of future increases in relative sea-level rise in many parts of Canada (high confidence). The projected decline of sea ice along Canada’s Arctic and Atlantic coasts will result in increased waves and storm surges, which will exacerbate extreme sea-level events (high confidence).
Section 7.4.2.2 clearly demonstrates that a rise in relative mean sea level can be expected along the majority of Canada’s coastlines, with the exception of the coastlines of Hudson Bay and the eastern Canadian Arctic. The scientific understanding is clear that a positive relative sea-level change will lead to extreme sea-level events of an increased frequency and magnitude, as demonstrated by the many studies cited in Chapter 9 of the IPCC AR6 WGI report (high agreement and robust evidence). We have used selected locations in Canada to demonstrate the projected increase in the frequency of extreme sea-level events for those sites where relative sea level will rise (section 7.6). The combination of high-quality historical data, consistent CMIP6 model projections, and the understanding of how the frequency and magnitude of extreme sea-level events are altered by relative sea-level change results in an assessment of high confidence for future projections. The projected retreat of sea ice in the Arctic (see Chapter 6, section 6.3), and our understanding of the effects of the loss of sea ice on ocean waves and surge (section 7.5), leads to high confidence in the positive contribution of waves and surges to the exacerbation of extreme sea levels.
7.7: Ocean chemistry
Key Message 7.12: At the surface, observations over the last three decades show that the oceans around Canada have absorbed anthropogenic carbon dioxide from the atmosphere, causing ocean acidification (very high confidence). This higher-carbon, acidified water is carried beneath the surface by ocean circulation.
Key Message 7.13: Beneath the surface, oxygen has declined over many decades in the offshore and coastal waters of the northeast Pacific, in the Estuary and Gulf of St. Lawrence, and on the Scotian Shelf (high confidence), but the processes responsible vary by region and are not fully understood. Since biological respiration both consumes oxygen and adds carbon dioxide, acidification is exacerbated in regions experiencing oxygen declines (high confidence). Year-to-year variations in water circulation and biological activity have caused extreme low-oxygen and high-acidity events in the subsurface oceans around Canada (medium confidence).
Key Message 7.14: Over the rest of the 21st century, the oceans around Canada are projected to continue to absorb anthropogenic carbon dioxide, to increase in acidity (very high confidence), and to lose oxygen in the subsurface (medium confidence). The level of projected acidification in the latter half of this century will strongly depend on the level of future carbon dioxide emissions (very high confidence).
This section will present both observations and projections of increasing ocean carbon storage, acidification, and deoxygenation in Canadian waters. Ocean chemistry plays an enormous role in slowing the rate of climate change, but is itself changing. The ocean holds far more carbon than either the atmosphere or the terrestrial biosphere—about 50 times more than the atmosphere (Friedlingstein et al., 2023)—which means that the ocean strongly regulates carbon dioxide (CO2) concentrations in the atmosphere over long periods of time. For such a large fraction of CO2 to be stored in seawater is a unique situation for gases, since the atmosphere holds the vast majority of other gases, such as oxygen. The crucial difference is that CO2 reacts with water to form several other compounds (carbonic acid, bicarbonate, and carbonate ions), whose proportions are related to the acidity (H+ concentrationFootnote 15) of seawater (Figure 7.32). Because of slow geological reactions, oceans have naturally low acidity, which increases the proportion of bicarbonate and carbonate ions, and allows for substantial carbon storage.
As atmospheric CO2 levels rise, more CO2 diffuses from the air into the surface of the ocean. In the decade from 2013 to 2022, the global ocean absorbed about 25% of anthropogenic carbon emissions (Friedlingstein et al., 2023). This absorption of carbon by the oceans is driven not by the planet’s warming or by biological processes, but by higher gas levels in the atmosphere, which are transferred over time to the water. However, marine biological and physical processes cause strong seasonal cycles (Fassbender et al., 2018; Landschützer et al., 2018) and spatial variability (Landschützer et al., 2020) in surface ocean CO2 levels. Therefore, to detect long-term climate change in a context of naturally variable background conditions, detailed and sustained observations are required.
As CO2 enters the water and reacts with it, acidity increases as other carbon compounds are formed (Figure 7.32), a process known as ocean acidification. Globally, it is virtually certain that the surface ocean has acidified over the last four decades (IPCC AR6 WGI 5.3.2.2) (Canadell et al., 2021; Raven et al., 2005). The increasing acidity reduces the concentration of carbonate ions (CO32-), making it more difficult for organisms to create and maintain shells and other structures composed of calcium carbonate (CaCO3) (Leung et al., 2022; Spalding et al., 2017). Ocean acidification may adversely affect a wide array of marine organisms—with the impacts on wild-caught and farmed shellfish, especially at the larval stage, particularly well studied—but knowledge gaps remain (Barton et al., 2015; Chandra Rajan & Vengatesen, 2020; Gimenez et al., 2018; Haigh et al., 2015).
Figure take-away: The surface ocean absorbs carbon dioxide from the atmosphere, causing acidification, and, as water circulates beneath the ocean surface, respiration reduces oxygen and further increases carbon concentrations and acidity.
Figure title: Changes in ocean chemistry
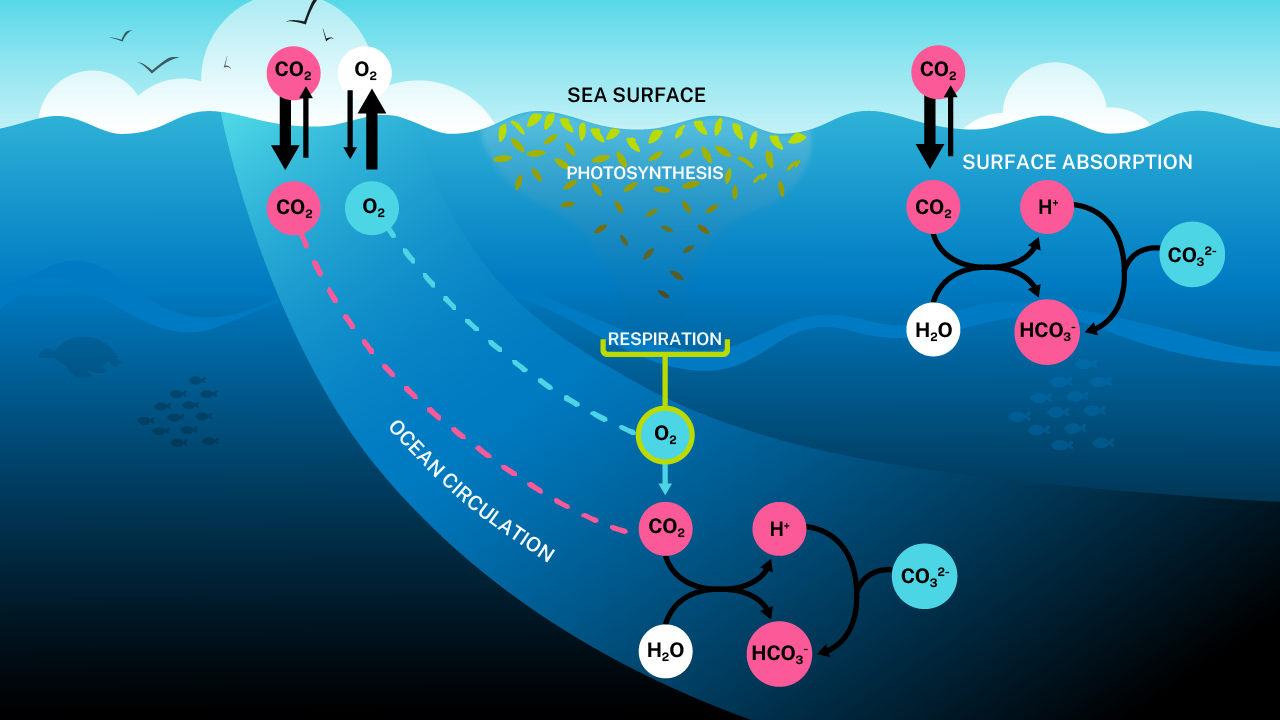
Figure 7.32 : Illustration of changes in ocean chemistry due to absorption of carbon dioxide (CO2) at the ocean surface, circulation beneath the surface, and subsurface respiration. Red circles indicate compounds whose concentrations are increasing over time (CO2; hydrogen ions, H+; and bicarbonate ions, HCO3-), while blue circles indicate compounds whose concentrations are decreasing (oxygen, O2; and carbonate ions, CO32-). In the upper right portion of the diagram, the surface ocean absorbs excess anthropogenic CO2, which combines with water (H2O) to raise acidity (H+) and reduces carbonate ions (CO32-). In the upper left and bottom, the waters carried beneath the surface ocean are affected by respiration, which consumes oxygen (O2) and releases more CO2, as the sinking organic carbon (largely plankton, symbolized by green ovals) is degraded by bacteria. The released CO2, in turn, increases acidity (H+) and reduces carbonate ions (CO32-).
Dissolved oxygen levels beneath the surface ocean are also decreasing, in a process known as deoxygenation. Globally, the upper 1000 m of the ocean has very likely lost from 0.5 to 3.3% of its dissolved oxygen, according to section 5.2.2.4 of the IPCC SROCC report (Bindoff, N. L. et al., 2019). Several factors modulate these changes. Gas exchange occurs between the atmosphere and the surface waters of the ocean, a process that is strongly affected by water temperature, with warmer water having less capacity to store dissolved gases. However, only about 15% of the global oxygen decline in the oceans can be directly attributed to lower solubility in warmer waters (Schmidtko et al., 2017). Photosynthesis in the surface ocean converts CO2 to carbon within the bodies of organisms, a portion of which sinks into the deep ocean. There, bacteria consume oxygen while degrading this carbon, releasing CO2 and further increasing acidity (Figure 7.32). Thus, oxygen, carbon, and acidity levels in any part of the subsurface ocean depend on the properties of the water, the vigour of exchange with the atmosphere when the water was last in contact with it, the rate of biological oxygen consumption and CO2 production in the subsurface, and the time the water has taken to travel from its last contact with the atmosphere to its current location. The combined effect of these factors makes it challenging to uncover the underlying drivers of subsurface deoxygenation and acidification. Moreover, in some coastal regions, additional nutrients from fertilizers, detergents, and sewage entering the ocean from land further increase surface productivity, which in turn drives excess respiration below the surface, ultimately reducing oxygen and increasing acidity, in a process known as eutrophication (Breitburg et al., 2018; Rabalais et al., 2014). Oxygen saturation levels below 20–25% (about 60 µmolFootnote 16 per kg) threaten the survival of marine organisms and are termed hypoxic, although some species are threatened even at higher levels (Vaquer-Sunyer & Duarte, 2008).
7.7.1: Past changes
7.7.1.1: Carbon increase in and acidification of the surface ocean
Observations in the open ocean around Canada (that is, away from the coastal zone) show that surface waters have gained carbon, resulting in acidification. Beginning in the late 1980s and early 1990s, Fisheries and Oceans Canada (DFO) began sustained ocean carbon monitoring at two key locations in the northwest Atlantic and northeast Pacific. These time series provide two of the longest records of ocean carbon in existence globally. Observations in the central Labrador Sea (Atlantic) show a 1.1% increase (23 µmol per kg) in carbon content from 1996 to 2023, and a simultaneous 17% increase in acidity (0.07 pH unit decrease; see footnote 14) (Figure 7.33) (Raimondi et al., 2021; Ringuette et al., 2022). Surface water observations in the northeast Pacific show a 0.7% (15 µmol per kg) increase in carbon from 1990 to 2020, and a simultaneous 10% increase in acidity (0.04 pH unit decrease) (Figure 7.33) (Franco et al., 2021). Broader surveys repeated approximately every decade support these changes in the Atlantic and Pacific (Carter et al., 2019; Gruber et al., 2019). Both regions are characterized by sometimes wide year-to-year variations, which means that long-term trends can be difficult to accurately determine. The depth of wintertime mixing, which is much greater in the northwest Atlantic, and the level of summertime productivity both heavily influence these year-to-year differences.
While the changes in total ocean carbon levels may seem small, they have enabled the ocean to absorb approximately 25% of global emissions from human activities since 1850 (Friedlingstein et al., 2023). That these carbon increases since the 1990s constitute only about a 1% change in the surface ocean’s total carbon content is a testament to the vast quantities of carbon the ocean already holds. Similarly, total changes in pH units may appear small because of the way this measure is calculated (on a logarithmic scale; see footnote 14), but the change in acidity is substantial.
Figure take-away: Carbon and acidity have increased in the surface waters of both the northwest Atlantic and northeast Pacific since the early 1990s.
Figure title: Surface ocean carbon and acidity in the waters around Canada
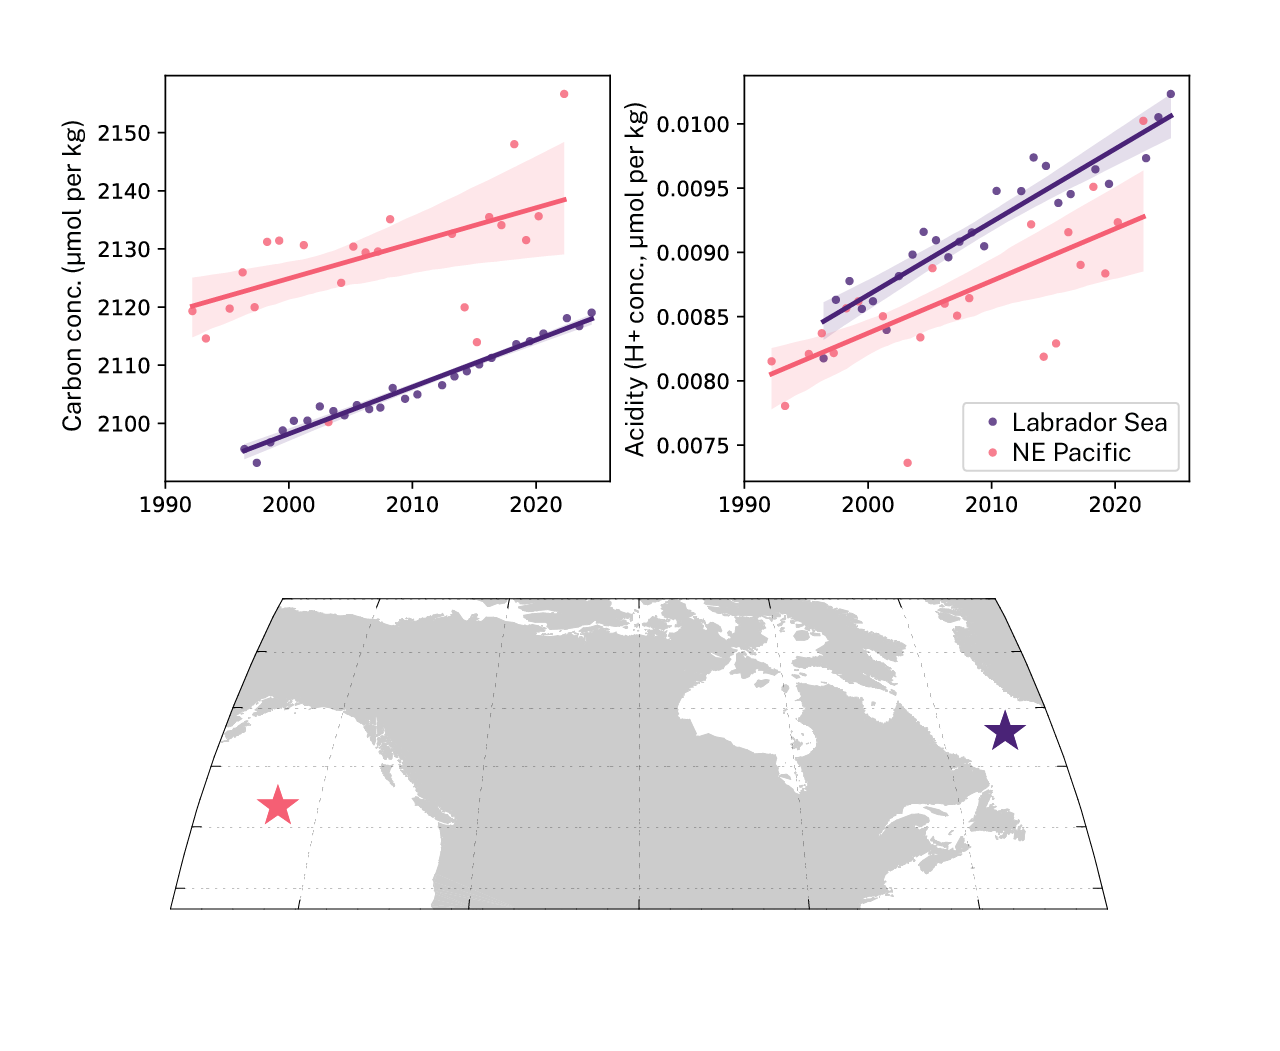
Figure 7.33 : Average carbon concentrations (in µmol per kg) and acidity (H+ concentrations) at different locations in the northwest Atlantic and northeast Pacific. The left panel shows average dissolved inorganic carbon concentrations in the northwest Atlantic (purple points) and in the northeast Pacific (pink points) from the 1990s to the early 2020s, normalized to a salinity of 34 for easier comparison. The right panel shows acidity in the same locations. In both panels, the lines represent a least squares fit to the data, with the shading showing the 95% confidence interval for the trend. The map at the bottom shows the locations of the observations; the northwest Atlantic measurements come from the central Labrador Sea (56°N, 53°W to 59°N, 50°W) and are an average of many samples from depths of 150–500 m, while the northeast Pacific measurements come from near-surface waters (0–15 m depths) at Station Papa (50oN 145oW) in February and March. Data source: for northwest Atlantic, Raimondi et al. (2021); Ringuette et al. (2022); Fisheries and Oceans Canada (2025b); for northeast Pacific, Franco et al. (2021); Ianson et al. (2021).
The carbon content of the Arctic Ocean has also increased, but direct observations are more limited due to the logistical challenges of making sustained ocean observations in this region. As a result, changes can often only be assessed from a few snapshots in time. Near-surface waters throughout the Arctic, including the Canada Basin of the Arctic Ocean, show a 2.0−2.5% (~45 µmol per kg) increase in carbon content since the start of the industrial era (inferred from observations of other dissolved anthropogenic compounds) (Raimondi et al., 2024). In the Canada Basin, surface measurements show dissolved CO2 has increased even faster than atmospheric CO2 levels (Ouyang et al., 2020), while acidity has increased by 40–65% from 1994 to 2020 (Qi et al., 2022). Observations from multiple field surveys demonstrate that the surface waters of the Canada Basin have become less favourable to aragonite, a form of calcium carbonate particularly prone to dissolution in waters with higher acidity, with extensive regions of the surface Arctic Ocean now corrosive to this mineral (AMAP, 2018; Chierici & Fransson, 2009; Miller et al., 2014; Yamamoto-Kawai et al., 2009; Yamamoto‐Kawai et al., 2025; Y. Zhang et al., 2020). As a result, organisms that form calcium carbonate shells or other structures need to expend more energy to make their shells, and may be disadvantaged relative to organisms that do not form shells (Haigh et al., 2015; Spalding et al., 2017). The Arctic Ocean is experiencing especially rapid acidification. Sea ice melt, the increasing uptake of atmospheric CO2 as the sea ice retreats, lower water temperatures, and the chemistry of local river waters all contribute to amplifying acidification in the Arctic Ocean (Chapter 6, section 6.3.1) (AMAP, 2018; Azetsu‐Scott et al., 2010; Qi et al., 2022; Y. Zhang et al., 2020).
7.7.1.2: Deoxygenation and acidification of the subsurface ocean
Subsurface waters off Canada’s west coast in the northeast Pacific have lost oxygen and gained carbon, which indicates that these waters have also acidified. Canada began measuring dissolved oxygen in 1956 in the offshore waters of the northeast Pacific at Station Papa (50° N 145° W), making this one of the longest records of chemical observations in the world’s oceans (Freeland, 2007; Tabata & Weichselbaumer, 1992). These careful measurements reveal that 12% of the dissolved oxygen at depths ranging from 0 m to 4000 m (nearly the full depth of the ocean at this location) has been lost from 1960 to 2018 (Cummins & Ross, 2020), which is substantially faster than the global average decline of 2% (Schmidtko et al., 2017). This deoxygenation is concentrated at depths between 100 m and 200 m, where oxygen concentrations are declining at a rate of 1.2% of saturation per decade (see footnote 16) (5 mmol per kg per decade) (Cummins & Ross, 2020). Although the ocean is warming, and warm water can physically dissolve less gas, the direct effect of temperature is responsible for only a small proportion of the observed oxygen decline (Ito et al., 2017). Instead, some combination of increasing stratification (which would prevent deeper waters from contacting the atmosphere for extended periods), circulation changes, and changing biological respiration rates are responsible (W. R. Crawford & Peña, 2016; Cummins & Ross, 2020; Whitney et al., 2007).
The carbon concentration in these same waters at depths of 100–200 m has increased by approximately 1% over a shorter observational period (1990–2020) (increase of 15–24 µmol per kg carbon) (Franco et al., 2021). Approximately half of this increase has resulted from the absorption of anthropogenic CO2 and the other half from the same processes that reduce oxygen, since biological respiration results in increased CO2 as well as decreased oxygen (Figure 7.32 ) (Franco et al., 2021). Changes in subsurface acidity have not yet been quantified for the dataset from Station Papa, but the acidity of these waters is expected to have increased, since rising carbon concentrations are associated with increasing acidity.
Closer to the British Columbia coast—over the continental shelf and in some inlets where historical observations are available—oxygen concentrations in the bottom waters have also decreased for several decades, although there are gaps in the data record at most locations. Since the mid-1970s, oxygen concentrations have decreased at a rate of 0.2–0.4% of saturationFootnote 17 per year (0.5–1.1 µmol per kg per year) in some areas near the seabed off southwest Vancouver Island, as well as in five straits, inlets, and channels around British Columbia (W. R. Crawford & Peña, 2013; Hannah et al., 2024; Jackson et al., 2021; Johannessen et al., 2014). The similarity in the trends for the shelf and inland waters and the strong connecting circulation between these waters suggest that waters with declining oxygen levels along the coast are carried into the constricted waterways of the region. However, an investigation of oxygen data in waters from California to British Columbia just off the continental shelf shows that oxygen increased from the 1950s to the 1970s and then declined afterwards (W. R. Crawford & Peña, 2016), which may be related to decadal climate variations (Stramma et al., 2020). The presence of large, possibly natural, variations makes it more difficult to determine the contribution of climate change to deoxygenation.
Observations and model simulations for some nearshore regions in British Columbia show that waters have gained carbon and have acidified. In the Salish Sea, both data- and model-based estimates demonstrate that dissolved carbon has increased by approximately 1.5% (28−38 µmol per kg in the region as a whole, but with changes of nearly 50 µmol per kg in isolated areas) since the pre-industrial era (Evans et al., 2019; Hare et al., 2020; Jarníková et al., 2022; Simpson et al., 2022). These same studies show that carbon increases have directly driven acidification, with the result that waters in the Salish Sea are now even more corrosive to calcium carbonate, meaning that organisms require more energy to form and maintain shells and other structures composed of these minerals.
The severe deoxygenation and acidification of deeper waters in the St. Lawrence Estuary and Gulf highlight the complex and interrelated causes of these phenomena. Average bottom-water oxygen levels in the 2010s at the head of the Lower St. Lawrence Estuary were about half the values observed in the 1930s (45% of saturation [see footnote 16] in the 1930s versus 20% of saturation in the 2010s; see Figure 7.34) (Jutras et al., 2023). Acidity (see footnote 14) increased by 100% in these same bottom waters during the same period (R. Y. Bernier et al., 2018; Gibb et al., 2023; Mucci et al., 2011). From 2019 to 2021, the already low oxygen concentrations in the bottom waters decreased even further to 13% of saturation, a severely low, hypoxic level (Figure 7.34) (Jutras et al., 2023), while acidity increased by an additional 20% (Gibb et al., 2023). In addition, in 2021, the surface area of hypoxic waters in the Lower Estuary as a whole was the largest recorded in three decades (Jutras et al., 2023). Changes since 2008 have been traced to alterations in the proportion of waters that enter the deep Gulf of St. Lawrence from the open ocean (Gilbert et al., 2005). These waters are a mix of cool, oxygen-rich water from the Labrador Current and warm, oxygen-poor water from the Gulf Stream. These changes have been particularly evident since 2008, with the increase in the amount of Gulf Stream water relative to that of Labrador Current water reducing oxygen and increasing acidity in the Gulf of St. Lawrence (Gibb et al., 2023; Jutras et al., 2020, 2023). This change in the proportions of waters is also reflected in the warming trend in the deep Gulf of St. Lawrence (Figure 7.9). In contrast, prior to the 2000s, the decline in oxygen and increase in acidity were caused more by excess nutrients from agriculture and sewage that entered the surface waters and drove increased subsurface respiration in the Gulf (eutrophication) (Goyette et al., 2016; Hudon et al., 2017; Jutras et al., 2020; Mucci et al., 2011).
Figure take-away: Dissolved oxygen near the bottom of the St. Lawrence Estuary has decreased over several decades.
Figure title: Oxygen saturation in the bottom waters of the St. Lawrence Estuary

Figure 7.34 : Time series of average oxygen saturation values (%) (see footnote 16) near the sea floor at the head of the Lower St. Lawrence Estuary near Rimouski since the 1930s, and a map showing the location of the observations. Locations of individual samples in the region vary from year to year. Error bars show the standard deviation when multiple data were collected that year. The absence of an error bar indicates only a single data value in that year. Measurements were made at water densities of 1027.2–1027.5 kg per m3, in the region within 300 km downstream of the city of Québec. Data source: Jutras et al. (2023); Blais et al. (2024); Mucci and Jutras (2020).
Changes in the proportions of waters flowing over the shelf of the northwest Atlantic in Canada are also causing deoxygenation there. Near-bottom dissolved oxygen on the central Scotian Shelf has declined from approximately 70% of saturation (~210 µmol per kg) in the early 1960s to approximately 50% of saturation (~145 µmol per kg) in the mid-2010s (Claret et al., 2018). These same waters have also become warmer and saltier, indicating that water from the warm, oxygen-poor Gulf Stream is making up a greater proportion of the waters reaching the shelf (and coast) (Claret et al., 2018; Gilbert et al., 2010; Petrie & Yeats, 2000). Because of the connection between increased respiration, decreased oxygen, and increased acidity, the waters of the central Scotian Shelf have also probably undergone acidification; however, direct observations of acidity in this region are too recent to detect a long-term change. In contrast, deoxygenation has not been observed in the central Labrador Sea, where, during strong winter mixing events, the deep water comes in contact with the atmosphere and absorbs oxygen. In this location, years with higher or lower oxygen are related to the depth and length of wintertime mixing rather than any other factor (Koelling et al., 2023; Wolf et al., 2018).
In the Arctic, deoxygenation has also been observed in the Canada Basin, although the much higher overall oxygen levels there mean that hypoxia is not a concern. In this region, oxygen has decreased mainly in the subsurface waters (30–100 m), which originate in the Chukchi Sea, declining by 2% in the upper part of this layer and by 3% in the lower part over the 2003–2018 period (Arroyo et al., 2023). These declines were mainly caused by the warming of this layer, since warmer water can hold a smaller amount of dissolved gases. However, increasing subsurface respiration also contributed to the decline in the lower layer (Arroyo et al., 2023).
Observations of subsurface waters in the Arctic Ocean frequently reveal corrosive conditions for aragonite, and the limited measurements available indicate that these conditions of higher acidity are increasing. The waters with the highest natural acidity in the Arctic flow into the region from the Pacific, where the strong respiration there has depleted their oxygen content and increased CO2 and acidity levels (Azetsu‐Scott et al., 2010; Niemi et al., 2021; Qi et al., 2017). Some waters entering from the North Atlantic also display higher acidity due to respiration (Burgers et al., 2023). In the western Arctic Ocean, the area of subsurface waters corrosive to aragonite has increased from 5% of the total area surveyed in 1994 to 25% in 2010 (Qi et al., 2017). In parts of the Beaufort Sea and Canada Basin, subsurface waters (~100–200 m depths) that were not corrosive in the 1990s became corrosive in the 2000s (Miller et al., 2014). In southwestern Baffin Bay, corrosive waters were observed at shallow depths of 50–200 m in 2019, but not in 1997 or 2004 (Burgers et al., 2024). Events of combined extreme high acidity and low oxygen have also been observed in the Arctic. In 2020, waters with an oxygen saturation below 50% and highly corrosive to aragonite were observed at depths greater than 100 m in the southern part of the Chukchi Plateau (Nishino et al., 2023), compared with typical oxygen saturation levels of 70–80% over the previous two decades. Weaker circulation appears to have allowed these waters to stagnate behind a ridge, where respiration lowered oxygen levels and raised CO2 and acidity levels.
A low oxygen (hypoxic) and high acidity event on the British Columbia Shelf demonstrates how natural variability can interact with trends in deoxygenation and acidification to create extreme conditions. In August 2021, much of the water column over the continental shelf off southern British Columbia experienced hypoxic conditions and higher acidity, with oxygen declining to about half its typical values, from a range of 20–60% of saturation to 10–30% of saturation (Franco et al., 2023). These unusually low oxygen levels extended from the bottom to just 25 m from the surface. Values were more than two standard deviations lower than the average conditions observed between 2003 and 2020, demonstrating that this was an extreme event. The low oxygen in these waters was accompanied by corrosive conditions for both aragonite and calcite. An earlier low-oxygen event, though not as extreme, was observed in the same region in 2013 (Sahu et al., 2022). An increase in nutrient transport to the surface due to unusually strong winds appears to have caused these events, stimulating stronger than normal surface productivity starting earlier in the year, and subsequently stronger than normal subsurface respiration. The addition of this unusually large respiration signal to already declining oxygen and increasing acidity in the region is an example of how natural variability and anthropogenic trends can combine to create extreme conditions that would probably not have occurred in the pre-industrial era.
7.7.2: Future changes
Globally, the ocean is projected to continue to absorb CO2 (very high confidence) and experience increased acidity (very high confidence) and decreased oxygen (high confidence) throughout the 21st century under all but negative emissions scenarios (IPCC AR6 WGI SPM B.5.1) (IPCC, 2021). The magnitude of acidification depends directly on future emissions. Under a very low emissions scenario (SSP1-1.9), global ocean acidity could return to near present-day levels by 2100, while under a high emissions scenario (SSP3-7.0), global ocean acidity is projected to nearly double relative to present-day levels. The evidence is strong for these acidification projections because the process is inorganic and driven by the direct transfer of CO2 from the atmosphere to the ocean, and the physical mechanism is well understood. Acidification reduces the ocean’s ability to absorb CO2, such that the ocean is projected to take up a smaller percentage of global emissions over time (IPCC AR6 WGI SPM B.4.1) (IPCC, 2021). Carbon uptake is expected to develop differently in the northwest Atlantic than in the northeast Pacific in the future, with the Pacific maintaining a more consistent uptake (Gooya et al., 2023). Global projections of deoxygenation are less certain. Model simulations of the last 50 years show substantial variability in the rate and spatial pattern of deoxygenation (Oschlies et al., 2018; Takano et al., 2023). Oxygen declines in the subsurface ocean are largely driven by a combination of biological and circulation changes, whose future evolution in specific regions remains poorly understood.
Projections specific to the oceans around Canada show trends similar to global projections (Figure 7.35). Under a high emissions scenario (SSP3-7.0), ocean acidity is projected to double by the end of the century relative to the 1986–2014 average, in nearly all the surface oceans around Canada, with even greater changes expected in the Arctic and northwest Atlantic. Even under a low emissions scenario (SSP1-2.6), acidity is projected to increase by 20–35% in the same time frame, with the greatest changes again projected in the Arctic and northwest Atlantic (Figure 7.35).
Figure take-away: Acidity is projected to increase in the surface oceans around Canada, with stronger increases under a higher emissions scenario.
Figure title: Projected changes in surface ocean acidity
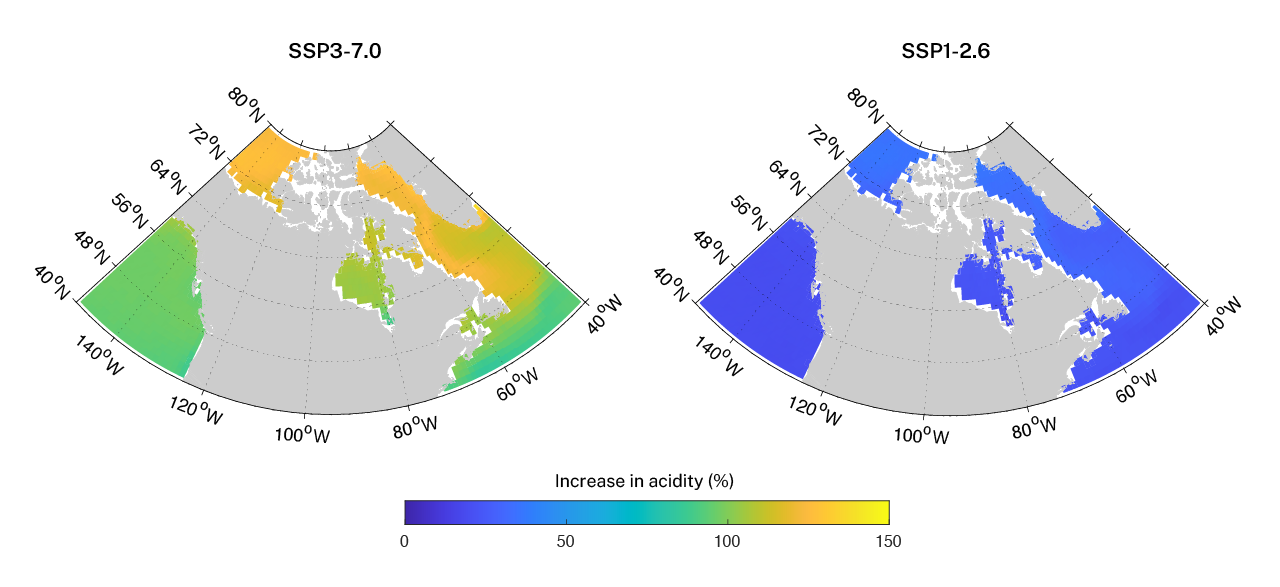
Figure 7.35 : Maps showing percent increase in acidity (see footnote 14) in the surface ocean at the end of this century (projected 2081–2100 average) compared with the historical baseline (1986–2014 average) under two different emissions scenarios. The left panel illustrates the projected increases under a high emissions scenario (SSP3-7.0) and the right panel, under a low emissions scenario (SSP1-2.6). Both maps are shown on the same scale. Increases range from approximately 20 to 140%, where a value of 100% means acidity has doubled. Data source: values are averaged from an ensemble of 9 CMIP6 model simulations.
Although all projections show increasing ocean acidification, the magnitude of this varies from region to region and from model to model. On the Scotian Shelf in the Atlantic, subsurface acidity is projected to increase and oxygen to decrease, but the magnitude of the future changes is uncertain within at least a factor of two (Lavoie et al., 2019, 2020; Rutherford et al., 2024). The future chemical properties of the waters in this region will depend heavily on the change in currents (Claret et al., 2018; Rutherford et al., 2024), which is consistent with the importance of currents in driving the observed historical changes reported in section 7.7.1.2. In the Pacific, models of Canada’s waters also project increases in acidity and decreases in subsurface oxygen, affecting regions that include the biologically rich continental shelf (Holdsworth et al., 2021; Peña & Fine, 2024). Low-oxygen, high-acidity events on Canada’s west coast may become more frequent and intense due to changes in summertime coastal upwelling (Pozo Buil et al., 2021; Rykaczewski et al., 2015; D. Wang et al., 2015), similar to the 2021 event discussed in section 7.1.2.2 (Franco et al., 2023).
In the Arctic Ocean, simulations by an ensemble of CMIP6 models project increasing acidity throughout the region due to the continued absorption of anthropogenic CO2 (Steiner & Reader, 2024). Under the very high emissions scenario (SSP5-8.5), the upper 50 m of the water column in all regions of the Arctic is projected to become corrosive for aragonite by 2080. In Canadian Arctic waters that already have higher acidity, which include the Beaufort Sea and its coastal waters and the Canadian Arctic Archipelago, consistently corrosive conditions are projected in the upper 50 m of the water column by 2040 under the very high emissions scenario (SSP-5.85) and by 2045 under the intermediate emissions scenario (SSP2-4.5). The models in this ensemble also project a decrease in oxygen concentrations in Arctic waters, especially in regions with the greatest ocean warming.
7.7.3: Confidence terms in key messages: summary of evidence
[Key messages are provided here for ease of review but may not appear in this section in final text.]
Key Message 7.12: At the surface, observations over the last three decades show that the oceans around Canada have absorbed anthropogenic carbon dioxide from the atmosphere, causing ocean acidification (very high confidence). This higher-carbon, acidified water is carried beneath the surface by ocean circulation.
Evidence for increased ocean carbon concentrations and acidity comes from multiple, repeated high-quality measurements in the Labrador Sea and northeast Pacific since the 1990s (Franco et al., 2021; Raimondi et al., 2021; Ringuette et al., 2022), as well as in the Arctic (Qi et al., 2022; Yamamoto‐Kawai et al., 2025). Increasing carbon and acidity in these waters agree with globally distributed observations, and are consistent with seawater carbon chemistry and the physical and chemical principles of air-sea gas exchange (Canadell et al., 2021). Robust evidence, strong alignment with global observations, and underlying scientific principles lead to an assessment of very high confidence that ocean carbon and acidity are increasing. It is a statement of fact that ocean circulation carries surface waters into the subsurface.
Key Message 7.13: Beneath the surface, oxygen has declined over many decades in the offshore and coastal waters of the northeast Pacific, in the Estuary and Gulf of St. Lawrence, and on the Scotian Shelf (high confidence), but the processes responsible vary by region and are not fully understood. Since biological respiration both consumes oxygen and adds carbon dioxide, acidification is exacerbated in regions experiencing oxygen declines (high confidence). Year-to-year variations in water circulation and biological activity have caused extreme low-oxygen and high-acidity events in the subsurface oceans around Canada (medium confidence).
Evidence for decreasing oxygen concentrations in subsurface waters comes from repeated high-quality measurements in many regions, reported in multiple publications. The offshore waters of the northeast Pacific have one of the longest time series of open-ocean data in the world, and historical measurements from decades ago just off the British Columbia coast and in the St. Lawrence Estuary are also available (Jackson et al., 2021; Jutras et al., 2020). These observations show that oxygen is decreasing in the regions in question, albeit at differing rates, supporting the assessment of high confidence. The dominant process causing deoxygenation appears to vary by region and time period, including decreased interaction with the surface water, changing circulation, increased biological respiration, eutrophication, and warming waters. In locations where they have been investigated, declining oxygen and increasing acidity are usually found in combination, because oxygen consumption and CO2 production are biologically linked, although the ultimate driver in many regions may be related to changes in physical circulation. Robust evidence from multiple sources and underlying scientific principles support the assessment of high confidence in increases in subsurface acidity linked to deoxygenation. Events of extremely low oxygen and high acidity have been identified along the British Columbia coast, in the St. Lawrence Estuary and Gulf, and in the Arctic (Franco et al., 2023; Jutras et al., 2023; Nishino et al., 2023). However, gaps in data collection prevent the identification of extreme hypoxia and acidification events in many regions. Less substantial evidence in some locations leads to an assessment of medium confidence in extreme hypoxic and high-acidity events in Canadian waters.
Key Message 7.14: Over the rest of the 21st century, the oceans around Canada are projected to continue to absorb anthropogenic carbon dioxide, to increase in acidity (very high confidence), and to lose oxygen in the subsurface (medium confidence). The level of projected acidification in the latter half of this century will strongly depend on the level of future carbon dioxide emissions (very high confidence).
As long as atmospheric CO2 concentrations continue to rise, the ocean is expected to continue to absorb some of this carbon and increase in acidity as a result. The models all project increases in ocean carbon and acidity, both globally and in the oceans around Canada, unless atmospheric CO2 rapidly drops below current levels (IPCC, 2021). Different models exhibit some variability in the rate of these increases, with disagreement on the rate but not on the direction of change, especially in regions like the Arctic, where sea ice is an additional complicating factor (Steiner & Reader, 2024). The strong agreement between multiple model projections and the understanding of the mechanisms involved support the assessment of very high confidence that the ocean will continue to acidify, at a rate that depends on future emissions. Oxygen has declined in the global oceans and in the oceans around Canada over the last 50 years, a trend that is projected to continue according to most models. However, patterns and rates of deoxygenation are less certain than those for carbon, due mainly to the effects of internal climate variability (Takano et al., 2023), leading to an assessment of medium confidence in the projections of changes in oxygen.
7.8: Synthesis
Key Message 7.15: The oceans slow the rate of climate-driven atmospheric warming by absorbing heat and carbon dioxide; however, this absorption, in turn, warms and acidifies the oceans around Canada (very high confidence). Impacts on the ocean include more frequent and intense marine heatwaves, increasing stratification, rising sea levels in many regions, more frequent coastal flooding events, and decreasing ocean oxygen levels (high confidence). Continued emissions will intensify these changes, but with impacts varying substantially along Canada’s coastlines, which will result in differing needs for climate change adaptation (high confidence).
Confidence in the synthesis key message is based on the assessments of confidence in earlier key messages and supported by the evidence in the relevant sections.
The ocean fundamentally shapes the rate of climate change. Human greenhouse gas emissions have enhanced the retention of heat by our Earth system, leading to increases in air temperature of about 2°C in Canada during the 1948–2023 period (Chapter 2, section 2.2). The ocean has absorbed and is storing roughly 90% of the excess heat from global warming (section 7.2), reducing the effects of that heat on the land surface and atmosphere. In addition, approximately 25% of human-caused carbon dioxide emissions have been absorbed by the ocean, again slowing the rate of climate change (section 7.7). However, the service performed by the ocean in storing heat and carbon significantly affects its functioning, in turn influencing interconnected parts of our climate system and society.
Ocean circulation and water mass movements are changing. The increase in thermal energy due to climate change is intensifying the hydrological cycle by increasing evaporation rates and altering precipitation distribution. Annual total precipitation has increased in Canada since 1948, with greater changes in northern Canada (Chapter 2, section 2.5). Warmer temperatures are melting glaciers and ice sheets (Chapter 6, section 6.5). The increased precipitation and meltwater have contributed to the freshening of the surface oceans around Canada (section 7.3). The warming and freshening of the surface ocean cause it to become less dense, which increases stratification, reduces the connection with the deep ocean, and disrupts the vertical transport of ocean nutrients and oxygen (section 7.3). Oxygen levels beneath the ocean surface are declining in many Canadian ocean regions and globally, caused in some areas by this stratification and the resulting reduction in the transport of oxygen-rich waters to deeper layers (section 7.7.2). Furthermore, the influx of freshwater from melting ice disrupts thermohaline circulation, the ocean’s deep overturning conveyor belt, which plays a critical role in global climate regulation (Chapter 4, section 4.9). Projections suggest that the ocean will continue to warm, freshen, and stratify, with the rates of change dependent on the level of future emissions.
Sea level is rising in many regions, impacting communities. The warming of the ocean causes the water to expand (section 7.2), while melting glaciers and ice sheets contribute additional water to the ocean (Chapter 6, section 6.5). However, the impact of this global sea-level rise is experienced differently in each region, because the land is also moving vertically, at a rate and direction dependent on the land’s response to the removal of the weight of the ice sheets covering Canada during the last Ice Age, about 10,000 years ago (section 7.4). Therefore, in some regions of Canada, the relative sea level is increasing faster than the global mean sea level is rising (because the land there is sinking), while in other regions, the relative sea level is falling (because the land there is rising faster than the global mean sea level). Coastal regions with rising sea levels are experiencing more coastal flooding (section 7.6).
More extreme events are being observed in the oceans around Canada. Marine heatwaves are increasing in frequency and intensity (section 7.2) as a direct result of warming ocean temperatures. The melting of Arctic sea ice (Chapter 6, section 6.3) is leading to higher wave heights and storm surges (section 7.5), which further contribute to extreme sea-level events. Warming oceans can enhance storm activity and contribute to higher wind speeds, which drive destructive waves (Chapter 4, section 4.6; Chapter 8, Box 8.3). Ocean acidification and deoxygenation can be exacerbated by natural variability in ocean circulation and productivity, leading to the extreme low-oxygen and high-acidity events observed in many ocean regions (section 7.7).
7.9: Key knowledge gaps and emerging issues
7.9.1: Sustained observations
Sustained monitoring of the oceans around Canada is critical to the assessment of climate change in the ocean. However, such monitoring is challenging given the country’s large Exclusive Economic Zone (EEZ). The vastness, remoteness, and harsh conditions of the Arctic Ocean pose significant additional challenges. Although changes in sea surface temperature and sea ice can be monitored with satellites, other ocean data require in situ subsurface observations. Canada is a strong supporter of the Global Ocean Observing System (GOOS) and has recently created the Canadian Integrated Ocean Observing System (CIOOS) (, a GOOS Regional Alliance) to facilitate improved access to ocean data.
7.9.2: Sea level
Ice sheet instability is a poorly understood process, creating key knowledge gaps that affect projections of sea-level change. For relative sea-level change, techniques are evolving toward determining vertical land motion using Interferometric Synthetic Aperture Radar (InSAR) instead of Global Positioning System (GPS) measurements on bedrock; this introduces the need to consider land motion that varies over short spatial (and probably temporal) scales.
7.9.3: Ocean currents
There is little robust information on how ocean currents around Canada (e.g., Labrador Current, Alaska Current, and California Undercurrent) could change in the future as a result of climate change. Improvement in the downscaling of regional ocean climate models could help to provide insights into possible future scenarios.
7.9.4: Waves, storm surge, and extreme sea levels
Understanding and projecting extreme sea levels is challenging, because past and future changes in nearshore waves and storm surge are uncertain and because sea-level rise and coastal morphology interact in complex ways. Models do not agree well with each other, and do not properly reproduce small-scale atmospheric features, such as tropical cyclones, which greatly impact waves and surge extremes. Although most tropical cyclones do not reach Canada, the propagating waves produced by these storms do impact Atlantic Canada, and sometimes the remnants of these large storms are still associated with intense winds that drive locally generated wave and surge extremes. Moreover, better knowledge of the exact shape of Canada’s coast is needed for national-scale projections of wave run-up, an important contributor to extreme water levels.
In the Arctic, sea ice decline, which favours both waves and surges, allows for more certain projections of change in this region. However, a better understanding of how sea ice interacts with waves and surges to affect extreme conditions is still required.
7.9.5: Ocean chemistry
This assessment has been limited to ocean chemistry topics with strong evidence of change, namely increasing carbon concentrations, acidification, and deoxygenation. Other biogeochemical ocean properties, like dissolved nutrients or marine biological productivity rates, may also be changing, but long-term observations of these other properties are either lacking in many regions or do not yet reveal clear trends. A few time series of dissolved nutrient concentrations are available for the offshore northwest Atlantic and northeast Pacific, but coastal and Arctic observations remain limited and subject to high variability in both space and time, which makes estimating robust trends more challenging. Autonomous deployments of sensors on moorings and profiling devices offer a way to increase observations without expanding expensive ship operations, but should continue to be paired with some ship-based, water sample measurements to ensure the highest accuracy for detection of trends.
FAQs
FAQ 7.1: Is sea level rising everywhere in Canada?
A: Sea level is not rising everywhere in Canada, because local geological processes, particularly the way the land has been slowly rebounding since the disappearance of the large ice sheets associated with the passing of the last Ice Age, can cause the land to rise or sink, which affects the relative sea level (i.e., how mean sea-level changes with respect to the local coastline). While global sea level is rising due to climate change, local conditions vary across Canada, leading to regional differences in how sea-level change is experienced. In particular, relative sea level has fallen in western Hudson Bay due to land uplift, while it is rising faster than the global rate in southern Atlantic Canada and the western Arctic where the land is sinking.
FAQ 7.2: Are marine heatwaves any different from heatwaves we experience on land?
A: Marine heatwaves and land heatwaves are similar in that they involve extended periods of unusually high temperatures, but they differ in their duration, causes, impacts, and the rate of temperature change. Marine heatwaves tend to last longer, develop more slowly, and affect broader areas, while their impacts on marine ecosystems can be more severe and longer lasting than those on land. Climate change is a significant driver of more frequent and more intense heatwaves of both types.
FAQ 7.3: Why does the carbon dioxide that humans emit into the atmosphere cause ocean acidification?
A: The ocean acts as a massive carbon absorber, taking up roughly 25% of the carbon dioxide that humans release into the atmosphere through activities like the burning of fossil fuels, deforestation, and industrial processes. When atmospheric carbon dioxide encounters the surface of the ocean, it dissolves in seawater, just like any gas dissolving in any liquid. There, the carbon dioxide undergoes chemical reactions that release hydrogen ions (H⁺) in seawater. Since acidity is a measure of the concentration of hydrogen ions, the release of these ions results in acidification.
References
AMAP. (2021). AMAP Arctic climate change update 2021: Key trends and impacts. Arctic Monitoring and Assessment Programme.
Amaya, D. J., Jacox, M. G., Alexander, M. A., Scott, J. D., Deser, C., Capotondi, A., & Phillips, A. S. (2023). Bottom marine heatwaves along the continental shelves of North America. Nature Communications, 14(1), 1038.
Amaya, D. J., Miller, A. J., Xie, S.-P., & Kosaka, Y. (2020). Physical drivers of the summer 2019 North Pacific marine heatwave. Nature Communications, 11(1), 1903.
Arias, P. A., Bellouin, N., Coppola, E., Jones, R. G., Krinner, G., Marotzke, J., Naik, V., Palmer, M. D., Plattner, G.-K., Rogelj, J., Rojas, M., Sillmann, J., Storelvmo, T., Thorne, P. W., Trewin, B., Achuta Rao, K., Adhikary, B., Allan, R. P., Armour, K., … Zickfeld, K. (2021). Technical summary. In V. Masson-Delmotte, P. Zhai, A. Pirani, S. L. Connors, C. Péan, S. Berger, N. Caud, Y. Chen, L. Goldfarb, M. I. Gomis, M. Huang, K. Leitzell, E. Lonnoy, J. B. R. Matthews, T. K. Maycock, T. Waterfield, O. Yelekçi, R. Yu, & B. Zhou (Eds.),Climate Change 2021: The physical science basis. Contribution of working group I to the Sixth Assessment Report of the Intergovernmental Panel on Climate Change(p. 33−144). Cambridge University Press.
Arroyo, A., Timmermans, M., Le Bras, I., Williams, W., & Zimmermann, S. (2023). Declining O2 in the Canada basin halocline consistent with physical and biogeochemical effects of Pacific summer water warming. Journal of Geophysical Research: Oceans, 128(4), e2022JC019418.
Athanase, M., Sánchez-Benítez, A., Goessling, H. F., Pithan, F., & Jung, T. (2024). Projected amplification of summer marine heatwaves in a warming Northeast Pacific Ocean. Communications Earth & Environment, 5(1), 53.
Azetsu‐Scott, K., Clarke, A., Falkner, K., Hamilton, J., Jones, E. P., Lee, C., Petrie, B., Prinsenberg, S., Starr, M., & Yeats, P. (2010). Calcium carbonate saturation states in the waters of the Canadian Arctic Archipelago and the Labrador Sea. Journal of Geophysical Research: Oceans, 115(C11), 2009JC005917.
Bamber, J. L., Oppenheimer, M., Kopp, R. E., Aspinall, W. P., & Cooke, R. M. (2019). Ice sheet contributions to future sea-level rise from structured expert judgment. Proceedings of the National Academy of Sciences, 116(23), 11195–11200.
Barbeaux, S. J., Holsman, K., & Zador, S. (2020). Marine heatwave stress test of ecosystem-based fisheries management in the Gulf of Alaska Pacific cod fishery. Frontiers in Marine Science, 7, 703.
Barkhordarian, A., Nielsen, D. M., & Baehr, J. (2022). Recent marine heatwaves in the North Pacific warming pool can be attributed to rising atmospheric levels of greenhouse gases. Communications Earth & Environment, 3(1), 131.
Barkhordarian, A., Nielsen, D. M., Olonscheck, D., & Baehr, J. (2024). Arctic marine heatwaves forced by greenhouse gases and triggered by abrupt sea-ice melt. Communications Earth & Environment, 5(1), 57.
Barton, A., Waldbusser, G., Feely, R., Weisberg, S., Newton, J., Hales, B., Cudd, S., Eudeline, B., Langdon, C., Jefferds, I., King, T., Suhrbier, A., & McLauglin, K. (2015). Impacts of coastal acidification on the Pacific Northwest shellfish industry and adaptation strategies implemented in response. Oceanography, 25(2), 146–159.
Bernardino, M., Gonçalves, M., Campos, R. M., & Guedes Soares, C. (2023). Extremes and variability of wind and waves across the oceans until the end of the 21st century. Ocean Engineering, 275, 114081.
Bernier, N. B., Hemer, M., Mori, N., Appendini, C. M., Breivik, O., De Camargo, R., Casas-Prat, M., Duong, T. M., Haigh, I. D., Howard, T., Hernaman, V., Huizy, O., Irish, J. L., Kirezci, E., Kohno, N., Lee, J.-W., McInnes, K. L., Meyer, E. M. I., Marcos, M., … Zhang, Y. J. (2024). Storm surges and extreme sea levels: Review, establishment of model intercomparison and coordination of surge climate projection efforts (SurgeMIP). Weather and Climate Extremes, 45, 100689.
Bernier, R. Y., Jamieson, R. E., Kelly, N. E., Lafleur, C., & Moore, A. M. (2023). State of the Atlantic Ocean synthesis report. Fisheries and Oceans Canada.
Bernier, R. Y., Jamieson, R. E., & Moore, A. M. (2018). State of the Atlantic Ocean synthesis report. Fisheries and Oceans Canada.
Bij de Vaate, I., Slobbe, D. C., & Verlaan, M. (2024). Mapping the spatiotemporal variability in global storm surge water levels using satellite radar altimetry. Ocean Dynamics, 74(3), 169–182.
Bindoff, N. L., W.W.L. Cheung, J.G. Kairo, J. Arístegui, V.A. Guinder, R. Hallberg, N. Hilmi, N. Jiao, M.S. Karim, L. Levin, S. O’Donoghue, S.R. Purca Cuicapusa, B. Rinkevich, T. Suga, A. Tagliabue, & P. Williamson. (2019). Changing ocean, marine ecosystems, and dependent communities. In H.-O. Pörtner, D.C. Roberts, V. Masson-Delmotte, P. Zhai, M. Tignor, E. Poloczanska, K. Mintenbeck, A. Alegría, M. Nicolai, A. Okem, J. Petzold, B. Rama, & N.M. Weyer (Eds.),IPCC special report on the ocean and cryosphere in a changing climate(pp. 447–587). Cambridge University Press.
Blais, M., Galbraith, P. S., Lizotte, M., Clay, S. A., & Starr, M. (2024). Chemical and biological oceanographic conditions in the Estuary and Gulf of St. Lawrence during 2023. Fisheries and Oceans Canada.
Boldt, J. L., Joyce, E., Tucker, S., & Gauthier, S. (2023). State of the physical, biological and selected fishery resources of Pacific Canadian marine ecosystems in 2022. Fisheries and Oceans Canada.
Boldt, J. L., Joyce, Elizabeth, Tucker, Strahan, Gauthier, Stephane, & Dosser, Hayley. (2024). State of the physical, biological and selected fishery resources of Pacific Canadian marine ecosystems in 2023. Fisheries and Oceans Canada.
Bond, N. A., Cronin, M. F., Freeland, H., & Mantua, N. (2015). Causes and impacts of the 2014 warm anomaly in the NE Pacific. Geophysical Research Letters, 42(9), 3414–3420.
Breitburg, D., Levin, L. A., Oschlies, A., Grégoire, M., Chavez, F. P., Conley, D. J., Garçon, V., Gilbert, D., Gutiérrez, D., Isensee, K., Jacinto, G. S., Limburg, K. E., Montes, I., Naqvi, S. W. A., Pitcher, G. C., Rabalais, N. N., Roman, M. R., Rose, K. A., Seibel, B. A., … Zhang, J. (2018). Declining oxygen in the global ocean and coastal waters. Science, 359(6371), eaam7240.
Brickman, D., Hebert, D., & Wang, Z. (2018). Mechanism for the recent ocean warming events on the Scotian Shelf of eastern Canada. Continental Shelf Research, 156, 11–22.
Burgers, T. M., Azetsu‐Scott, K., Myers, P. G., Else, B. G. T., Miller, L. A., Rysgaard, S., Chan, W., Tremblay, J., & Papakyriakou, T. (2024). Unraveling the biogeochemical drivers of aragonite saturation state in baffin bay: Insights from the west greenland continental shelf. Journal of Geophysical Research: Oceans, 129(8), e2024JC021122.
Burgers, T. M., Miller, L. A., Rysgaard, S., Mortensen, J., Else, B., Tremblay, J. É., & Papakyriakou, T. (2023). Distinguishing physical and biological controls on the carbon dynamics in a high‐Arctic outlet strait. Journal of Geophysical Research: Oceans, 128(3), e2022JC019393.
Bush, E., & Lemmen, D. S. (Eds.). (2019). Canada’s changing climate report. Government of Canada.
Camus, P., Losada, I. J., Izaguirre, C., Espejo, A., Menéndez, M., & Pérez, J. (2017). Statistical wave climate projections for coastal impact assessments. Earth’s Future, 5(9), 918–933.
Canadell, J. G., Monteiro, P. M. S., Costa, M. H., Cotrim da Cunha, L., Cox, P. M., Eliseev, A. V., Henson, S., Ishii, M., Jaccard, S., Koven, C., Lohila, A., Patra, P. K., Piao, S., Rogelj, J., Syampungani, S., Zaehle, S., & Zickfeld, K. (2021). Global carbon and other biogeochemical cycles and feedbacks. In V. Masson-Delmotte, P. Zhai, A. Pirani, S. L. Connors, C. Péan, S. Berger, N. Caud, Y. Chen, L. Goldfarb, M. I. Gomis, M. Huang, K. Leitzell, E. Lonnoy, J. B. R. Matthews, T. K. Maycock, T. Waterfield, O. Yelekçi, R. Yu, & B. Zhou (Eds.), Climate Change 2021: The physical science basis. Contribution of working group I to the Sixth Assessment Report of the Intergovernmental Panel on Climate Change (pp. 673–816). Cambridge University Press.
Canadian Centre for Climate Services. (2025a). Guidance on using relative sea-level change datasets.
Canadian Centre for Climate Services. (2025b). Guidance on Using the Vertical Allowances Dataset.
Carter, B. R., Feely, R. A., Wanninkhof, R., Kouketsu, S., Sonnerup, R. E., Pardo, P. C., Sabine, C. L., Johnson, G. C., Sloyan, B. M., Murata, A., Mecking, S., Tilbrook, B., Speer, K., Talley, L. D., Millero, F. J., Wijffels, S. E., Macdonald, A. M., Gruber, N., & Bullister, J. L. (2019). Pacific anthropogenic carbon between 1991 and 2017. Global Biogeochemical Cycles, 33(5), 597–617.
Carvalho, K. S., & Wang, S. (2020). Sea surface temperature variability in the Arctic Ocean and its marginal seas in a changing climate: Patterns and mechanisms. Global and Planetary Change, 193, 103265.
Casas-Prat, M., Cicon, L., Pouliot, B., Bernier, N. B., Cannon, A. J., & Chan, R. (2024). CanESM5-derived ocean wave projections—Considerations for coarse resolution climate models. Ocean Modelling, 192, 102430.
Casas-Prat, M., Hemer, M. A., Dodet, G., Morim, J., Wang, X. L., Mori, N., Young, I., Erikson, L., Kamranzad, B., Kumar, P., Menéndez, M., & Feng, Y. (2024). Wind-wave climate changes and their impacts. Nature Reviews Earth & Environment, 5(1), 23–42.
Casas‐Prat, M., & Wang, X. L. (2020a). Projections of extreme ocean waves in the arctic and potential implications for coastal inundation and erosion. Journal of Geophysical Research: Oceans, 125(8), Article 8.
Casas‐Prat, M., & Wang, X. L. (2020b). Sea ice retreat contributes to projected increases in extreme arctic ocean surface waves. Geophysical Research Letters, 47(15), e2020GL088100.
Casas-Prat, M., Wang, X. L., & Swart, N. (2018). CMIP5-based global wave climate projections including the entire Arctic Ocean. Ocean Modelling, 123, 66–85.
Cavole, L., Demko, A., Diner, R., Giddings, A., Koester, I., Pagniello, C., Paulsen, M.-L., Ramirez-Valdez, A., Schwenck, S., Yen, N., Zill, M., & Franks, P. (2016). Biological impacts of the 2013–2015 warm-water anomaly in the northeast pacific: Winners, losers, and the future. Oceanography, 29(2).
Ceres, R. L., Forest, C. E., & Keller, K. (2017). Understanding the detectability of potential changes to the 100-year peak storm surge. Climatic Change, 145(1–2), 221–235.
Chandra Rajan, K., & Vengatesen, T. (2020). Molecular adaptation of molluscan biomineralisation to high-CO2 oceans – The known and the unknown. Marine Environmental Research, 155, 104883.
Chen, N., Han, G., & Yan, X. (2020). Similarity and difference in interannual sea level variations between the mid‐Atlantic bight and the Nova Scotia coast. Journal of Geophysical Research: Oceans, 125(5), e2019JC015919.
Cheng, L., von Schuckmann, K., Minière, A., Hakuba, M. Z., Purkey, S., Schmidt, G. A., & Pan, Y. (2024). Ocean heat content in 2023. Nature Reviews Earth & Environment, 5(4), 232–234.
Cheung, W. W. L., & Frölicher, T. L. (2020). Marine heatwaves exacerbate climate change impacts for fisheries in the northeast Pacific. Scientific Reports, 10(1), 6678.
Chierici, M., & Fransson, A. (2009). Calcium carbonate saturation in the surface water of the Arctic Ocean: Undersaturation in freshwater influenced shelves. Biogeosciences, 6, 2421–2431.
Christakos, K., Lavidas, G., Gao, Z., & Björkqvist, J.-V. (2024). Long-term assessment of wave conditions and wave energy resource in the Arctic Ocean. Renewable Energy, 220, 119678.
Church, J. A., Clark, P. U., Cazenave, A., Gregory, J. M., Jevrejeva, S., Merrifield, M. A., Milne, G. A., Nerem, R. S., Nunn, P. D., Payne, A. J., Pfeffer, W. T., Stammer, D., & Unnikrishnan, A. S. (2013). Sea level change. In T. F. Stocker, D. Qin, G.-K. Plattner, M. Tignor, S. K. Allen, J. Boschung, Nauels, Y. Xia, V. Bex, & P. M. Midgley (Eds.), Climate Change 2013: The Physical Science Basis. Contribution of Working Group I to the Fifth Assessment Report of the Intergovernmental Panel on Climate Change (pp. 1137–1217). Cambridge University Press.
Claret, M., Galbraith, E. D., Palter, J. B., Bianchi, D., Fennel, K., Gilbert, D., & Dunne, J. P. (2018). Rapid coastal deoxygenation due to ocean circulation shift in the northwest Atlantic. Nature Climate Change, 8(10), 868–872.
Cousineau, J., & Murphy, E. (2022). Numerical investigation of climate change effects on storm surges and extreme waves on Canada’s pacific coast. Atmosphere, 13(2), 311.
Crawford, A. D., Stroeve, J., Smith, A., & Jahn, A. (2021). Arctic open-water periods are projected to lengthen dramatically by 2100. Communications Earth & Environment, 2(1), Article 1.
Crawford, W. R., & Peña, M. A. (2013). Declining oxygen on the British Columbia continental shelf. Atmosphere-Ocean, 51(1), 88–103.
Crawford, W. R., & Peña, M. A. (2016). Decadal trends in oxygen concentration in subsurface waters of the northeast Pacific Ocean. Atmosphere-Ocean, 54(2), 171–192.
Cummins, P. F., & Masson, D. (2014). Climatic variability and trends in the surface waters of coastal British Columbia. Progress in Oceanography, 120, 279–290.
Cummins, P. F., & Ross, T. (2020). Secular trends in water properties at Station P in the northeast Pacific: An updated analysis. Progress in Oceanography, 186, 102329.
Cyr, F., Coyne, J., Snook, S., Bishop, C., Galbraith, P. S., Chen, N., & Han, G. (2024). Physical oceanographic conditions on the Newfoundland and Labrador Shelf during 2023. Fisheries and Oceans Canada.
D’Agostini, A., Bernardino, M., & Guedes Soares, C. (2022). Projected wave storm conditions under the RCP8.5 climate change scenario in the North Atlantic Ocean. Ocean Engineering, 266, 112874.
DeConto, R. M., & Pollard, D. (2016). Contribution of Antarctica to past and future sea-level rise. Nature, 531, 591–597.
DeConto, R. M., Pollard, D., Alley, R. B., Velicogna, I., Gasson, E., Gomez, N., Sadai, S., Condron, A., Gilford, D. M., Ashe, E. L., Kopp, R. E., Li, D., & Dutton, A. (2021). The Paris climate agreement and future sea-level rise from Antarctica. Nature, 593(7857), 83–89.
Douville, H., Raghavan, K., Renwick, J., Allan, R. P., Arias, P. A., Barlow, M., Cerezo-Mota, R., Cherchi, A., Gan, T. Y., Gergis, J., Jiang, D., Khan, A., Pokam Mba, W., Rosenfeld, D., Tierney, J., & Zolina, O. (2021). Water cycle changes. In V. Masson-Delmotte, P. Zhai, A. Pirani, S. L. Connors, C. Péan, S. Berger, N. Caud, Y. Chen, L. Goldfarb, M. I. Gomis, M. Huang, K. Leitzell, E. Lonnoy, J. B. R. Matthews, T. K. Maycock, T. Waterfield, O. Yelekçi, R. Yu, & B. Zhou (Eds.),Climate change 2021: The physical science basis. Contribution of working group I to the Sixth Assessment Report of the Intergovernmental Panel on Climate Change(pp. 1055–1210). Cambridge University Press.
Enríquez, A. R., Wahl, T., Baranes, H. E., Talke, S. A., Orton, P. M., Booth, J. F., & Haigh, I. D. (2022). Predictable changes in extreme sea levels and coastal flood risk due to long-term tidal cycles. Journal of Geophysical Research: Oceans, 127(4), e2021JC018157.
Erikson, L., Morim, J., Hemer, M., Young, I., Wang, X. L., Mentaschi, L., Mori, N., Semedo, A., Stopa, J., Grigorieva, V., Gulev, S., Aarnes, O., Bidlot, J.-R., Breivik, Ø., Bricheno, L., Shimura, T., Menendez, M., Markina, M., Sharmar, V., … Webb, A. (2022). Global ocean wave fields show consistent regional trends between 1980 and 2014 in a multi-product ensemble. Communications Earth & Environment, 3(1), 320.
Evans, W., Pocock, K., Hare, A., Weekes, C., Hales, B., Jackson, J., Gurney-Smith, H., Mathis, J. T., Alin, S. R., & Feely, R. A. (2019). Marine CO2 patterns in the northern Salish Sea. Frontiers in Marine Science, 5, 536.
Fassbender, A. J., Rodgers, K. B., Palevsky, H. I., & Sabine, C. L. (2018). Seasonal asymmetry in the evolution of surface ocean p CO2 and pH thermodynamic drivers and the influence on sea‐air CO2 flux. Global Biogeochemical Cycles, 32(10), 1476–1497.
Fisheries and Oceans Canada. (2020a). Canada’s oceans now 2020. Fisheries and Oceans Canada.
Fisheries and Oceans Canada. (2020b). Data from BC lightstations. Canada.Ca.
Fisheries and Oceans Canada. (2024). Line P climatology (1956-2012). Open Canada.
Fisheries and Oceans Canada. (2025a). Atlantic Zone Monitoring Program (AZMP). Canada.Ca.
Fisheries and Oceans Canada. (2025b). Atlantic Zone Off-Shelf Monitoring Program (AZOMP). Bedford Institute of Oceanography.
Fisheries and Oceans Canada. (2025c). British Columbia lightstation sea-surface temperature and salinity data (pacific), 1914-present—Open government portal. Open Canada.
Fisheries and Oceans Canada. (2025d). Canada’s oceans now: Arctic ecosystems 2023(p. 31). Fisheries and Oceans Canada.
Flato, G., Gillett, N., Arora, V., Cannon, A. J., & Anstey, J. (2019). Modelling future climate change. In E. Bush & D. S. Lemmen (Eds.),Canada’s Changing Climate Report(pp. 74–111). Government of Canada.
Fox-Kemper, B., Hewitt, H. T., Xiao, C., Aðalgeirsdóttir, G., Drijfhout, S. S., Edwards, T. L., Golledge, N. R., Hemer, M., Kopp, R. E., Krinner, G., Mix, A., Notz, D., Nowicki, S., Nurhati, I. S., Ruiz, L., Sallée, J.-B., Slangen, A. B. A., & Yu, Y. (2021). Ocean, cryosphere and sea level change. In V. Masson-Delmotte, P. Zhai, A. Pirani, S. L. Connors, C. Péan, S. Berger, N. Caud, Y. Chen, L. Goldfarb, M. I. Gomis, M. Huang, K. Leitzell, E. Lonnoy, J. B. R. Matthews, T. K. Maycock, T. Waterfield, O. Yelekçi, R. Yu, & B. Zhou (Eds.),Climate Change 2021: The physical science basis. Contribution of working group I to the Sixth Assessment Report of the Intergovernmental Panel on Climate Change(pp. 1211–1362). Cambridge University Press.
Franco, A. C., Ianson, D., Ross, T., Hamme, R. C., Monahan, A. H., Christian, J. R., Davelaar, M., Johnson, W. K., Miller, L. A., Robert, M., & Tortell, P. D. (2021). Anthropogenic and climatic contributions to observed carbon system trends in the northeast Pacific. Global Biogeochemical Cycles, 35(7), e2020GB006829.
Franco, A. C., Ianson, D., Ross, T., Hannah, C., Sastri, A., & Tortell, P. D. (2023). Drivers and potential consequences of observed extreme hypoxia along the Canadian Pacific continental shelf. Geophysical Research Letters, 50(6), e2022GL101857.
Fredston, A. L., Cheung, W. W. L., Frölicher, T. L., Kitchel, Z. J., Maureaud, A. A., Thorson, J. T., Auber, A., Mérigot, B., Palacios-Abrantes, J., Palomares, M. L. D., Pecuchet, L., Shackell, N. L., & Pinsky, M. L. (2023). Marine heatwaves are not a dominant driver of change in demersal fishes. Nature, 621(7978), 324–329.
Freeland, H. J. (2007). A short history of Ocean Station Papa and Line P. Progress in Oceanography, 75(2), 120–125.
Freeland, H. J. (2013). Evidence of change in the winter mixed layer in the northeast Pacific Ocean: A problem revisited. Atmosphere-Ocean, 51(1), 126–133.
Friedlingstein, P., O’Sullivan, M., Jones, M. W., Andrew, R. M., Bakker, D. C. E., Hauck, J., Landschützer, P., Le Quéré, C., Luijkx, I. T., Peters, G. P., Peters, W., Pongratz, J., Schwingshackl, C., Sitch, S., Canadell, J. G., Ciais, P., Jackson, R. B., Alin, S. R., Anthoni, P., … Zheng, B. (2023). Global carbon budget 2023. Earth System Science Data, 15(12), 5301–5369.
Galbraith, P. S., Chassé, J., Shaw, J.-L., Dumas, J., & Bourassa, M.-N. (2024). Physical oceanographic conditions in the Gulf of St. Lawrence during 2023. Fisheries and Oceans Canada.
Geertsema, M., Menounos, B., Bullard, G., Carrivick, J. L., Clague, J. J., Dai, C., Donati, D., Ekstrom, G., Jackson, J. M., Lynett, P., Pichierri, M., Pon, A., Shugar, D. H., Stead, D., Del Bel Belluz, J., Friele, P., Giesbrecht, I., Heathfield, D., Millard, T., … Sharp, M. A. (2022). The 28 November 2020 landslide, tsunami, and outburst flood – A hazard cascade associated with rapid deglaciation at elliot creek, British Columbia, Canada. Geophysical Research Letters, 49(6), e2021GL096716.
Gemmrich, J., Thomas, B., & Bouchard, R. (2011). Observational changes and trends in northeast Pacific wave records: NE Pacific wave trends. Geophysical Research Letters, 38(22), n/a-n/a.
Gibb, O., Cyr, F., Azetsu-Scott, K., Chassé, J., Childs, D., Gabriel, C.-E., Galbraith, P. S., Maillet, G., Pepin, P., Punshon, S., & Starr, M. (2023). Spatiotemporal variability in pH and carbonate parameters on the Canadian Atlantic continental shelf between 2014 and 2022. Earth System Science Data, 15(9), 4127–4162.
Gilbert, D., Rabalais, N. N., Díaz, R. J., & Zhang, J. (2010). Evidence for greater oxygen decline rates in the coastal ocean than in the open ocean. Biogeosciences, 7(7), 2283–2296.
Gilbert, D., Sundby, B., Gobeil, C., Mucci, A., & Tremblay, G.-H. (2005). A seventy-two-year record of diminishing deep-water oxygen in the St. Lawrence estuary: The northwest Atlantic connection. Limnology and Oceanography, 50(5), 1654–1666.
Gimenez, I., Waldbusser, G. G., & Hales, B. (2018). Ocean acidification stress index for shellfish (OASIS): Linking Pacific oyster larval survival and exposure to variable carbonate chemistry regimes. Elementa: Science of the Anthropocene, 6, 51.
Goddard, P. B., Yin, J., Griffies, S. M., & Zhang, S. (2015). An extreme event of sea-level rise along the Northeast coast of North America in 2009–2010. Nature Communications, 6(1), 6346.
Gomes, D. G. E., Ruzicka, J. J., Crozier, L. G., Huff, D. D., Brodeur, R. D., & Stewart, J. D. (2024). Marine heatwaves disrupt ecosystem structure and function via altered food webs and energy flux. Nature Communications, 15(1), 1988.
Gooya, P., Swart, N. C., & Hamme, R. C. (2023). Time-varying changes and uncertainties in the CMIP6 ocean carbon sink from global to local scale. Earth System Dynamics, 14(2), 383–398.
Goyette, J., Bennett, E. M., Howarth, R. W., & Maranger, R. (2016). Changes in anthropogenic nitrogen and phosphorus inputs to the St. Lawrence sub‐basin over 110 years and impacts on riverine export. Global Biogeochemical Cycles, 30(7), 1000–1014.
Greenan, B. J. W., James, T. S., Loder, J. W., Pepin, P., Azetsu-Scott, K., Ianson, D., Hamme, R. C., Gilbert, D., Tremblay, J.-E., Wang, X. L., & Perrie, W. (2019). Changes in oceans surrounding Canada. In E. Bush & D. S. Lemmen (Eds.),Canada’s Changing Climate Report(pp. 343–423). Government of Canada.
Gruber, N., Clement, D., Carter, B. R., Feely, R. A., Heuven, S. van, Hoppema, M., Ishii, M., Key, R. M., Kozyr, A., Lauvset, S. K., Monaco, C. L., Mathis, J. T., Murata, A., Olsen, A., Perez, F. F., Sabine, C. L., Tanhua, T., & Wanninkhof, R. (2019). The oceanic sink for anthropogenic CO2 from 1994 to 2007. Science, 363(6432), 1193–1199.
Gulev, S. K., Thorne, P. W., Ahn, J., Dentener, F. J., Domingues, C. M., Gerland, S., Gong, D., Kaufman, D. S., Nnamchi, H. C., Quaas, J., Rivera, J. A., Sathyendranath, S., Smith, S. L., Trewin, B., von Schuckmann, K., & Vose, R. S. (2021). Changing state of the climate system. In V. Masson-Delmotte, P. Zhai, A. Pirani, S. L. Connors, C. Péan, S. Berger, N. Caud, Y. Chen, L. Goldfarb, M. I. Gomis, M. Huang, K. Leitzell, E. Lonnoy, J. B. R. Matthews, T. K. Maycock, T. Waterfield, O. Yelekçi, R. Yu, & B. Zhou (Eds.),Climate change 2021: The physical science basis. Contribution of working group I to the Sixth Assessment Report of the Intergovernmental Panel on Climate Change(pp. 287–422).
Haigh, R., Ianson, D., Holt, C. A., Neate, H. E., & Edwards, A. M. (2015). Effects of ocean acidification on temperate coastal marine ecosystems and fisheries in the Northeast Pacific. PLOS ONE, 10(2), e0117533.
Han, G., Chassé, J., Lambert, N., Zhang, M., & Perrie, W. (2025). Projected sea surface temperature and salinity changes over the Northwest Atlantic shelf and slope in the 21st century from regional downscaling models. Can. Tech. Rep. Hydrogr. Ocean Sci. 222, vi + 9 p.
Han, G., & Lu, J. (2023). Extreme sea levels and their attribution for the Canadian Pacific coast from a baroclinic regional ocean model and tide‐gauge data. Journal of Geophysical Research: Oceans, 128(7), e2022JC019482.
Han, G., Ma, Z., Bao, H., & Slangen, A. (2014). Regional differences of relative sea level changes in the Northwest Atlantic: Historical trends and future projections. Journal of Geophysical Research: Oceans, 119(1), 156–164.
Han, G., Ma, Z., Chen, N., Thomson, R., & Slangen, A. (2015). Changes in mean relative sea level around Canada in the twentieth and twenty-first centuries. Atmosphere-Ocean, 53(5), 452–463.
Han, G., Ma, Z., Chen, N., Yang, J., & Chen, N. (2015). Coastal sea level projections with improved accounting for vertical land motion. Scientific Reports, 5(1), 16085.
Han, G., Ma, Z., & Slangen, A. B. A. (2020). Scenarios of twenty-first century mean sea level rise at tide-gauge stations across Canada. Atmosphere-Ocean, 58(4), 287–301.
Hannah, C. G., Johannessen, S. C., Wright, C. A., & Page, S. J. (2024). Oxygen dynamics in a deep‐silled fjord: Tight coupling to the open shelf. Limnology and Oceanography, 69(3), 652–666.
Hare, A., Evans, W., Pocock, K., Weekes, C., & Gimenez, I. (2020). Contrasting marine carbonate systems in two fjords in British Columbia, Canada: Seawater buffering capacity and the response to anthropogenic CO2 invasion. PLOS ONE, 15(9), e0238432.
Hawkins, E., & Sutton, R. (2009). The potential to narrow uncertainty in regional climate predictions. Bulletin of the American Meteorological Society, 90(8), 1095–1108.
He, Y., Shu, Q., Wang, Q., Song, Z., Zhang, M., Wang, S., Zhang, L., Bi, H., Pan, R., & Qiao, F. (2024). Arctic amplification of marine heatwaves under global warming. Nature Communications, 15(1), 8265.
Hebert, D., Layton, C., Brickman, D., & Galbraith, P. S. (2024). Physical oceanographic conditions on the Scotian Shelf and in the Gulf of Maine during 2023. Fisheries and Oceans Canada.
Helm, K. P., Bindoff, N. L., & Church, J. A. (2010). Changes in the global hydrological‐cycle inferred from ocean salinity. Geophysical Research Letters, 37(18), 2010GL044222.
Hemer, M. A., Wang, X. L., Weisse, R., & Swail, V. R. (2012). Advancing wind-waves climate science: The COWCLIP project. Bulletin of the American Meteorological Society, 93(6), 791–796.
Hilborn, A., Guan, L., Wan, D., & Peña, A. (2025). A sea surface temperature product for monitoring marine heatwaves in the Northeast Pacific. Fisheries and Oceans Canada.
Hobday, A. J., Alexander, L. V., Perkins, S. E., Smale, D. A., Straub, S. C., Oliver, E. C. J., Benthuysen, J. A., Burrows, M. T., Donat, M. G., Feng, M., Holbrook, N. J., Moore, P. J., Scannell, H. A., Sen Gupta, A., & Wernberg, T. (2016). A hierarchical approach to defining marine heatwaves. Progress in Oceanography, 141, 227–238.
Hochet, A., Dodet, G., Sévellec, F., Bouin, M.-N., Patra, A., & Ardhuin, F. (2023). Time of emergence for altimetry-based significant wave height changes in the North Atlantic. Geophysical Research Letters, 50(9), e2022GL102348.
Holdsworth, A. M., Zhai, L., Lu, Y., & Christian, J. R. (2021). Future changes in oceanography and biogeochemistry along the Canadian Pacific continental margin. Frontiers in Marine Science, 8, 602991.
Holthuijsen, L. H. (2007). Waves in oceanic and coastal waters. Cambridge University Press.
Hu, Y., & Freymueller, J. T. (2019). Geodetic observations of time‐variable glacial isostatic adjustment in Southeast Alaska and its implications for earth rheology. Journal of Geophysical Research, 124, 9870–9889.
Huang, B., Liu, C., Banzon, V. F., Freeman, E., Graham, G., Hankins, W., Smith, T. M., & Zhang, H.-M. (2020). NOAA 0.25-degree Daily Optimum Interpolation Sea Surface Temperature (OISST), Version 2.1[Dataset].
Hudon, C., Gagnon, P., Rondeau, M., Hébert, S., Gilbert, D., Hill, B., Patoine, M., & Starr, M. (2017). Hydrological and biological processes modulate carbon, nitrogen and phosphorus flux from the St. Lawrence River to its estuary (Quebec, Canada). Biogeochemistry, 135(3), 251–276.
Ianson, D., Robert, M., Johnson, W. K., Ross, T., Hamme, R. C., Tortell, P. D., Davelaar, M., Miller, L. A., Christian, J. R., Franco, A. C., & Monahan, A. H. (2021). A compilation of inorganic carbon system and other hydrographic and chemical discrete profile measurements obtained during the fifty five Line P cruises in the Northeast Pacific Ocean over the period from 1990 to 2019(No. NCEI Accession 0234342) [Dataset].
IPCC. (2021). Summary for policymakers. In V. Masson-Delmotte, P. Zhai, A. Pirani, S. L. Connors, C. Péan, S. Berger, N. Caud, Y. Chen, L. Goldfarb, M. I. Gomis, M. Huang, K. Leitzell, E. Lonnoy, J. B. R. Matthews, T. K. Maycock, T. Waterfield, O. Yelekçi, R. Yu, & B. Zhou (Eds.),Climate change 2021: The physical science basis. Contribution of working group I to the Sixth Assessment Report of the Intergovernmental Panel on Climate Change(p. 3−32). Cambridge University Press.
Ito, T., Minobe, S., Long, M. C., & Deutsch, C. (2017). Upper ocean O2 trends: 1958–2015. Geophysical Research Letters, 44(9), 4214–4223.
Jackson, J. M., Bianucci, L., Hannah, C. G., Carmack, E. C., & Barrette, J. (2021). Deep waters in British Columbia mainland fjords show rapid warming and deoxygenation from 1951 to 2020. Geophysical Research Letters, 48(3), e2020GL091094.
Jackson, J. M., Johnson, G. C., Dosser, H. V., & Ross, T. (2018). Warming from recent marine heatwave lingers in deep British Columbia Fjord. Geophysical Research Letters, 45(18), 9757–9764.
Jahn, A., Holland, M. M., & Kay, J. E. (2024). Projections of an ice-free Arctic Ocean. Nature Reviews Earth & Environment, 5(3), 164–176.
James, T., & Brierley-Green, C. (2026). Relative sea-level projections for Canada based on the IPCC Sixth Assessment Report and the NAD83v70VG national crustal velocity model. GSC Open File 9337e.
James, T., Henton, J. A., Leonard, L. J., Darlington, A., Forbes, D. L., & Craymer, M. (2014). Relative sea-level projections in Canada and the adjacent mainland United States (p. 72). Natural Resources Canada.
James, T. S., Robin, C., Henton, J. A., & Craymer, M. (2021). Relative sea-level projections for Canada based on the IPCC Fifth Assessment Report and the NAD83v70VG national crustal velocity model. Natural Resources Canada.
Jarníková, T., Ianson, D., Allen, S. E., Shao, A. E., & Olson, E. M. (2022). Anthropogenic carbon increase has caused critical shifts in aragonite saturation across a sensitive coastal system. Global Biogeochemical Cycles, 36(7), e2021GB007024.
Jevrejeva, S., Williams, J., Vousdoukas, M. I., & Jackson, L. P. (2023). Future sea level rise dominates changes in worst case extreme sea levels along the global coastline by 2100. Environmental Research Letters, 18(2), 024037.
Johannessen, S. C., Masson, D., & Macdonald, R. W. (2014). Oxygen in the deep Strait of Georgia, 1951–2009: The roles of mixing, deep‐water renewal, and remineralization of organic carbon. Limnology and Oceanography, 59(1), 211–222.
Jutras, M., Dufour, C. O., Mucci, A., Cyr, F., & Gilbert, D. (2020). Temporal changes in the causes of the observed oxygen decline in the st. Lawrence estuary. Journal of Geophysical Research: Oceans, 125(12), e2020JC016577.
Jutras, M., Mucci, A., Chaillou, G., Nesbitt, W. A., & Wallace, D. W. R. (2023). Temporal and spatial evolution of bottom-water hypoxia in the St Lawrence estuarine system. Biogeosciences, 20(4), 839–849.
Khosravi, N., Wang, Q., Koldunov, N., Hinrichs, C., Semmler, T., Danilov, S., & Jung, T. (2022). The Arctic Ocean in CMIP6 models: Biases and projected changes in temperature and salinity. Earth’s Future, 10(2), e2021EF002282.
Kim, J., Murphy, E., Nistor, I., Ferguson, S., & Provan, M. (2021). Numerical analysis of storm surges on Canada’s Western Arctic Coastline. Journal of Marine Science and Engineering, 9(3), Article 3.
Koelling, J., Atamanchuk, D., Wallace, D. W. R., & Karstensen, J. (2023). Decadal variability of oxygen uptake, export, and storage in the Labrador Sea from observations and CMIP6 models. Frontiers in Marine Science, 10, 1202299.
Kopp, R. E., Oppenheimer, M., O’Reilly, J. L., Drijfhout, S. S., Edwards, T. L., Fox-Kemper, B., Garner, G. G., Golledge, N. R., Hermans, T. H. J., Hewitt, H. T., Horton, B. P., Krinner, G., Notz, D., Nowicki, S., Palmer, M. D., Slangen, A. B. A., & Xiao, C. (2023). Communicating future sea-level rise uncertainty and ambiguity to assessment users. Nature Climate Change, 13(7), 648–660.
Landschützer, P., Gruber, N., Bakker, D. C. E., Stemmler, I., & Six, K. D. (2018). Strengthening seasonal marine CO2 variations due to increasing atmospheric CO2. Nature Climate Change, 8(2), 146–150.
Landschützer, P., Laruelle, G. G., Roobaert, A., & Regnier, P. (2020). A uniform pCO2 climatology combining open and coastal oceans. Earth System Science Data, 12(4), 2537–2553.
Langehaug, H. R., Sagen, H., Stallemo, A., Uotila, P., Rautiainen, L., Olsen, S. M., Devilliers, M., Yang, S., & Storheim, E. (2023). Constraining CMIP6 estimates of Arctic Ocean temperature and salinity in 2025-2055. Frontiers in Marine Science, 10, 1211562.
Lavoie, D., Lambert, N., & Gilbert, D. (2019). Projections of future trends in biogeochemical conditions in the Northwest Atlantic using CMIP5 earth system models. Atmosphere-Ocean, 57(1), 18–40.
Lavoie, D., Lambert, N., Rousseau, S., Dumas, J., Chassé, J., Long, Z., Perrie, W., Starr, M., Brickman, D., & Azetsu-Scott, K. (2020). Projections of future physical and biochemical conditions in the Gulf of St. Lawrence, on the Scotian Shelf and in the Gulf of Maine using a regional climate model. Fisheries and Oceans Canada.
Leung, J. Y. S., Zhang, S., & Connell, S. D. (2022). Is ocean acidification really a threat to marine calcifiers? A systematic review and meta‐analysis of 980+ studies spanning two decades. Small, 18(35), 2107407.
Levang, S. J., & Schmitt, R. W. (2020). Intergyre Salt Transport in the Climate Warming Response. Journal of Physical Oceanography, 50(1), 255–268.
Li, J., Ma, Y., Liu, Q., Zhang, W., & Guan, C. (2019). Growth of wave height with retreating ice cover in the Arctic. Cold Regions Science and Technology, 164, 102790.
Lindsey, R., & Dahlman, L. (2025, June 26). Climate change: Ocean heat content. NOAA.
Liu, Q., Babanin, A. V., Zieger, S., Young, I. R., & Guan, C. (2016). Wind and wave climate in the Arctic Ocean as observed by altimeters. Journal of Climate, 29(22), 7957–7975.
Lobeto, H., Menendez, M., & Losada, I. J. (2021). Future behavior of wind wave extremes due to climate change. Scientific Reports, 11(1), 7869.
Lobeto, H., Semedo, A., Lemos, G., Dastgheib, A., Menendez, M., Ranasinghe, R., & Bidlot, J.-R. (2024). Global coastal wave storminess. Scientific Reports, 14(1), 3726.
Loder, J. W., & Wang, Z. (2015). Trends and variability of sea surface temperature in the northwest Atlantic from three historical gridded datasets. Atmosphere-Ocean, 53(5), 510–528.
Lu, Y., Zhai, L., Hu, X., Horwitz, R., Paquin, J., Hannah, C., & Crawford, W. R. (2025). Sea level variations in shelf waters off the coast of British Columbia: From sub-synoptic to interannual time scales. Journal of Physical Oceanography, 55, 59–74.
MacLeod, R. F., & Dallimore, S. R. (2021). Assessment of storm surge history as recorded by driftwood in the Mackenzie Delta and Tuktoyaktuk Coastlands, Arctic Canada. Frontiers in Earth Science, 9.
Marcos, M., & Woodworth, P. L. (2017). Spatiotemporal changes in extreme sea levels along the coasts of the North Atlantic and the Gulf of Mexico. Journal of Geophysical Research: Oceans, 122(9), 7031–7048.
Melet, A., Almar, R., Hemer, M., Le Cozannet, G., Meyssignac, B., & Ruggiero, P. (2020). Contribution of wave setup to projected coastal sea level changes. Journal of Geophysical Research: Oceans, 125(8), e2020JC016078.
Menéndez, M., & Woodworth, P. L. (2010). Changes in extreme high water levels based on a quasi-global tide-gauge data set. Journal of Geophysical Research: Oceans, 115(C10).
Mentaschi, L., Vousdoukas, M. I., Voukouvalas, E., Dosio, A., & Feyen, L. (2017). Global changes of extreme coastal wave energy fluxes triggered by intensified teleconnection patterns. Geophysical Research Letters, 44(5), 2416–2426.
Meucci, A., Young, I. R., Aarnes, O. J., & Breivik, Ø. (2020). Comparison of wind speed and wave height trends from twentieth-century models and satellite altimeters. Journal of Climate, 33(2), 611–624.
Meucci, A., Young, I. R., Hemer, M., Kirezci, E., & Ranasinghe, R. (2020). Projected 21st century changes in extreme wind-wave events. Science Advances, 6(24), eaaz7295.
Meucci, A., Young, I. R., Trenham, C., & Hemer, M. (2024). An 8-model ensemble of CMIP6-derived ocean surface wave climate. Scientific Data, 11(1), 100.
Miller, L. A., Macdonald, R. W., McLaughlin, F., Mucci, A., Yamamoto-Kawai, M., Giesbrecht, K. E., & Williams, W. J. (2014). Changes in the marine carbonate system of the western Arctic: Patterns in a rescued data set. Polar Research, 33(1), 20577.
Mioduszewski, J., Vavrus, S., & Wang, M. (2018). Diminishing Arctic sea ice promotes stronger surface winds. Journal of Climate, 31(19), 8101–8119.
Morim, J., Hemer, M., Wang, X. L., Cartwright, N., Trenham, C., Semedo, A., Young, I., Bricheno, L., Camus, P., Casas-Prat, M., Erikson, L., Mentaschi, L., Mori, N., Shimura, T., Timmermans, B., Aarnes, O., Breivik, Ø., Behrens, A., Dobrynin, M., … Andutta, F. (2019). Robustness and uncertainties in global multivariate wind-wave climate projections. Nature Climate Change, 9(9), 711–718.
Morim, J., Trenham, C., Hemer, M., Wang, X. L., Mori, N., Casas-Prat, M., Semedo, A., Shimura, T., Timmermans, B., Camus, P., Bricheno, L., Mentaschi, L., Dobrynin, M., Feng, Y., & Erikson, L. (2020). A global ensemble of ocean wave climate projections from CMIP5-driven models. Scientific Data, 7(1), 105.
Mucci, A., & Jutras, M. (2020). Coriolis Hydrographic Dataset[Dataset].
Mucci, A., Starr, M., Gilbert, D., & Sundby, B. (2011). Acidification of lower St. Lawrence Estuary bottom waters. Atmosphere-Ocean, 49(3), 206–218.
Muis, S., Aerts, J. C. J. H., Á. Antolínez, J. A., Dullaart, J. C., Duong, T. M., Erikson, L., Haarsma, R. J., Apecechea, M. I., Mengel, M., Le Bars, D., O’Neill, A., Ranasinghe, R., Roberts, M. J., Verlaan, M., Ward, P. J., & Yan, K. (2023). Global projections of storm surges using high-resolution CMIP6 climate models. Earth’s Future, 11(9), e2023EF003479.
Muis, S., Apecechea, M. I., Dullaart, J., de Lima Rego, J., Madsen, K. S., Su, J., Yan, K., & Verlaan, M. (2020). A high-resolution global dataset of extreme sea levels, tides, and storm surges, including future projections. Frontiers in Marine Science, 7.
Muis, S., Haigh, I. D., Nobre, G. G., Aerts, J. C. J. H., & Ward, P. (2018). Influence of el niño‐southern oscillation on global coastal flooding. Earth’s Future, 6, 1311–1322.
Muis, S., Verlaan, M., Winsemius, H. C., Aerts, J. C. J. H., & Ward, P. J. (2016). A global reanalysis of storm surges and extreme sea levels. Nature Communications, 7(1), 11969.
NASA. (2025, August 5). Sea Level. NASA.
National Oceanography Centre. (2025). Permanent Service for Mean Sea Level.
Nederhoff, K., Erikson, L., Engelstad, A., Bieniek, P., & Kasper, J. (2022). The effect of changing sea ice on wave climate trends along Alaska’s central Beaufort Sea coast. The Cryosphere, 16(5), 1609–1629.
Niemi, A., Bednaršek, N., Michel, C., Feely, R. A., Williams, W., Azetsu-Scott, K., Walkusz, W., & Reist, J. D. (2021). Biological impact of ocean acidification in the Canadian Arctic: Widespread severe pteropod shell dissolution in Amundsen Gulf. Frontiers in Marine Science, 8, 600184.
Niemi, A., Ehrman, A., Ahmed, M., Arey, M., Azetsu-Scott, K., Babin, M., Capelle, D., Christie, L. R., Devred, E., Drake, A. K., Halliday, W. D., Harris, L. N., Hedges, K., Illasiak, J., Loseto, L., MacPhee, S., Maps, F., Marcoux, M., Mayette, A., … Yurkowski, D. (2024). State of Canada’s Arctic seas. Fisheries and Oceans Canada.
Nishino, S., Jung, J., Cho, K.-H., Williams, W. J., Fujiwara, A., Murata, A., Itoh, M., Watanabe, E., Aoyama, M., Yamamoto-Kawai, M., Kikuchi, T., Yang, E. J., & Kang, S.-H. (2023). Atlantic-origin water extension into the Pacific Arctic induced an anomalous biogeochemical event. Nature Communications, 14(1), 6235.
Oelsmann, J., Marcos, M., Passaro, M., Sanchez, L., Dettmering, D., Dangendorf, S., & Seitz, F. (2024). Regional variations in relative sea-level changes influenced by nonlinear vertical land motion. Nature Geoscience, 17(2), 137–144.
Ohenhen, L. O., Shirzaei, M., Ojha, C., & Kirwan, M. L. (2023). Hidden vulnerability of US Atlantic coast to sea-level rise due to vertical land motion. Nature Communications, 14(1), 2038.
Oliver, E. C. J., Benthuysen, J. A., Darmaraki, S., Donat, M. G., Hobday, A. J., Holbrook, N. J., Schlegel, R. W., & Sen Gupta, A. (2021). Marine heatwaves. InAnnual Review of Marine Science(Vol. 13, Issue Volume 13, 2021, pp. 313–342). Annual Reviews.
Oliver, E. C. J., Burrows, M. T., Donat, M. G., Sen Gupta, A., Alexander, L. V., Perkins-Kirkpatrick, S. E., Benthuysen, J. A., Hobday, A. J., Holbrook, N. J., Moore, P. J., Thomsen, M. S., Wernberg, T., & Smale, D. A. (2019). Projected marine heatwaves in the 21st century and the potential for ecological impact. Frontiers in Marine Science, 6, 734.
Oliver, E. C. J., Donat, M. G., Burrows, M. T., Moore, P. J., Smale, D. A., Alexander, L. V., Benthuysen, J. A., Feng, M., Sen Gupta, A., Hobday, A. J., Holbrook, N. J., Perkins-Kirkpatrick, S. E., Scannell, H. A., Straub, S. C., & Wernberg, T. (2018). Longer and more frequent marine heatwaves over the past century. Nature Communications, 9(1), 1324.
Oppenheimer, M., B.C. Glavovic, J. Hinkel, R. van de Wal, A.K. Magnan, A. Abd-Elgawad, R. Cai, M. CifuentesJara, R.M. DeConto, T. Ghosh, J. Hay, F. Isla, B. Marzeion, B. Meyssignac, & Z. Sebesvari. (2019). Sea level rise and implications for low-lying islands, coasts and communities. In H.-O. Pörtner, D.C. Roberts, V. Masson-Delmotte, P. Zhai, M. Tignor, E. Poloczanska, K. Mintenbeck, A. Alegría, M. Nicolai, A. Okem, J. Petzold, B. Rama, & N.M. Weyer (Eds.),IPCC Special Report on the Ocean and Cryosphere in a Changing Climate(pp. 321–445). Cambridge University Press.
Oschlies, A., Brandt, P., Stramma, L., & Schmidtko, S. (2018). Drivers and mechanisms of ocean deoxygenation. Nature Geoscience, 11(7), 467–473.
Ouyang, Z., Qi, D., Chen, L., Takahashi, T., Zhong, W., DeGrandpre, M. D., Chen, B., Gao, Z., Nishino, S., Murata, A., Sun, H., Robbins, L. L., Jin, M., & Cai, W.-J. (2020). Sea-ice loss amplifies summertime decadal CO2 increase in the western Arctic Ocean. Nature Climate Change, 10(7), 678–684.
Palmer, M. D., Domingues, C. M., Slangen, A. B. A., & Boeira Dias, F. (2021). An ensemble approach to quantify global mean sea-level rise over the 20th century from tide gauge reconstructions. Environmental Research Letters, 16(4), 044043.
Patra, A., Min, S.-K., Kumar, P., & Wang, X. L. (2021). Changes in extreme ocean wave heights under 1.5°C, 2°C, and 3°C global warming. Weather and Climate Extremes, 33, 100358.
Pattyn, F., & Morlighem, M. (2020). The uncertain future of the Antarctic Ice Sheet. Science, 367(6484), 1331–1335.
Peña, M. A., & Fine, I. (2024). Future physical and biogeochemical ocean conditions under climate change along the British Columbia continental margin. Atmosphere-Ocean, 62(1), 2–23.
Perez, E., Ryan, S., Andres, M., Gawarkiewicz, G., Ummenhofer, C. C., Bane, J., & Haines, S. (2021). Understanding physical drivers of the 2015/16 marine heatwaves in the Northwest Atlantic. Scientific Reports, 11(1), 17623.
Petrie, B., & Yeats, P. (2000). Annual and interannual variability of nutrients and their estimated fluxes in the Scotian Shelf—Gulf of Maine region. Canadian Journal of Fisheries and Aquatic Sciences, 57(12), 2536–2546.
Pozo Buil, M., Jacox, M. G., Fiechter, J., Alexander, M. A., Bograd, S. J., Curchitser, E. N., Edwards, C. A., Rykaczewski, R. R., & Stock, C. A. (2021). A dynamically downscaled ensemble of future projections for the California current system. Frontiers in Marine Science, 8, 612874.
Pugh, D., & Woodworth, P. (2014). Sea-level science: Understanding tides, surges, tsunamis and mean sea-level changes. Cambridge University Press.
Qi, D., Chen, L., Chen, B., Gao, Z., Zhong, W., Feely, R. A., Anderson, L. G., Sun, H., Chen, J., Chen, M., Zhan, L., Zhang, Y., & Cai, W.-J. (2017). Increase in acidifying water in the western Arctic Ocean. Nature Climate Change, 7(3), 195–199.
Qi, D., Ouyang, Z., Chen, L., Wu, Y., Lei, R., Chen, B., Feely, R. A., Anderson, L. G., Zhong, W., Lin, H., Polukhin, A., Zhang, Y., Zhang, Y., Bi, H., Lin, X., Luo, Y., Zhuang, Y., He, J., Chen, J., & Cai, W.-J. (2022). Climate change drives rapid decadal acidification in the Arctic Ocean from 1994 to 2020. Science, 377(6614), 1544–1550.
Rabalais, N., Cai, W.-J., Carstensen, J., Conley, D., Fry, B., Hu, X., Quiñones-Rivera, Z., Rosenberg, R., Slomp, C., Turner, E., Voss, M., Wissel, B., & Zhang, J. (2014). Eutrophication-driven deoxygenation in the coastal ocean. Oceanography, 27(1), 172–183.
Radosavljevic, B., Lantuit, H., Pollard, W., Overduin, P., Couture, N., Sachs, T., Helm, V., & Fritz, M. (2016). Erosion and flooding—Threats to coastal infrastructure in the Arctic: A case study from Herschel Island, Yukon Territory, Canada. Estuaries and Coasts, 39(4), 900–915.
Raimondi, L., Tanhua, T., Azetsu‐Scott, K., Yashayaev, I., & Wallace, D. W. R. (2021). A 30 ‐year time series of transient tracer‐based estimates of anthropogenic carbon in the central Labrador Sea. Journal of Geophysical Research: Oceans, 126(5), e2020JC017092.
Raimondi, L., Wefing, A., & Casacuberta, N. (2024). Anthropogenic carbon in the Arctic Ocean: Perspectives from different transient tracers. Journal of Geophysical Research: Oceans, 129(1), e2023JC019999.
Raven, J., Caldeira, K., Elderfield, H., Hoegh-Guldberg, O., Liss, P., Riebesell, U., Shepherd, J., Turley, C., & Watson, A. (2005). Ocean acidification due to increasing atmospheric carbon dioxide. The Royal Society.
Rayner, N. A., Parker, D. E., Horton, E. B., Folland, C. K., Alexander, L. V., Rowell, D. P., Kent, E. C., & Kaplan, A. (2003). Global analyses of sea surface temperature, sea ice, and night marine air temperature since the late nineteenth century. Journal of Geophysical Research: Atmospheres, 108(D14), 2002JD002670.
Richaud, B., Hu, X., Darmaraki, S., Fennel, K., Lu, Y., & Oliver, E. C. J. (2024). Drivers of marine heatwaves in the Arctic Ocean. Journal of Geophysical Research: Oceans, 129(2), e2023JC020324.
Ringuette, M., Devred, E., Azetsu-Scott, K., Head, E., Punshon, S., Casault, B., & Clay, S. A. (2022). Optical, chemical, and biological oceanographic conditions in the Labrador Sea between 2014 and 2018. Canadian Science Advisory Secretariat (CSAS).
Robin, C. M. I., Craymer, M., Ferland, R., James, T. S., Lapelle, E., Piraszewski, M., & Zhao, Y. (2020). NAD83v70VG: A new national crustal velocity model for Canada. Natural Resources Canada.
Rohmer, J., & Cozannet, G. L. (2019). Dominance of the mean sea level in the high-percentile sea levels time evolution with respect to large-scale climate variability: A Bayesian statistical approach. Environmental Research Letters, 14(1), 014008.
Rutherford, K., Fennel, K., Garcia Suarez, L., & John, J. G. (2024). Uncertainty in the evolution of northwestern North Atlantic circulation leads to diverging biogeochemical projections. Biogeosciences, 21(1), 301–314.
Rykaczewski, R. R., Dunne, J. P., Sydeman, W. J., García‐Reyes, M., Black, B. A., & Bograd, S. J. (2015). Poleward displacement of coastal upwelling‐favorable winds in the ocean’s eastern boundary currents through the 21st century. Geophysical Research Letters, 42(15), 6424–6431.
Sahu, S., Allen, S. E., Saldías, G. S., Klymak, J. M., & Zhai, L. (2022). Spatial and temporal origins of the la perouse low oxygen pool: A combined Lagrangian statistical approach. Journal of Geophysical Research: Oceans, 127(3), e2021JC018135.
Schlegel, R. W., Oliver, E. C. J., & Chen, K. (2021). Drivers of marine heatwaves in the northwest Atlantic: The role of air–sea interaction during onset and decline. Frontiers in Marine Science, 8, 627970.
Schmidtko, S., Stramma, L., & Visbeck, M. (2017). Decline in global oceanic oxygen content during the past five decades. Nature, 542(7641), 335–339.
Seneviratne, S. I., Zhang, X., Adnan, M., Badi, W., Dereczynski, C., Di Luca, A., Ghosh, S., Iskandar, I., Kossin, J., Lewis, S., Otto, F., Pinto, I., Satoh, M., Vicente-Serrano, S. M., Wehner, M., & Zhou, B. (2021). Weather and climate extreme events in a changing climate. In V. Masson-Delmotte, P. Zhai, A. Pirani, S. L. Connors, C. Péan, S. Berger, N. Caud, Y. Chen, L. Goldfarb, M. I. Gomis, M. Huang, K. Leitzell, E. Lonnoy, J. B. R. Matthews, T. K. Maycock, T. Waterfield, O. Yelekçi, R. Yu, & B. Zhou (Eds.), Climate Change 2021: The physical science basis. Contribution of working group I to the Sixth Assessment Report of the Intergovernmental Panel on Climate Change (pp. 1513–1766). Cambridge University Press. DOI: 10.1017/9781009157896.013
Sharmar, V. D., Markina, M. Yu., & Gulev, S. K. (2021). Global ocean wind-wave model hindcasts forced by different reanalyzes: A comparative assessment. Journal of Geophysical Research: Oceans, 126(1), e2020JC016710.
Shimura, T., Mori, N., & Mase, H. (2013). Ocean waves and teleconnection patterns in the Northern Hemisphere. Journal of Climate, 26(21), 8654–8670.
Shimura, T., Pringle, W. J., Mori, N., Miyashita, T., & Yoshida, K. (2022). Seamless projections of global storm surge and ocean waves under a warming climate. Geophysical Research Letters, 49(6), e2021GL097427.
Simpson, E., Ianson, D., & Kohfeld, K. E. (2022). Using end‐member models to estimate seasonal carbonate chemistry and acidification sensitivity in temperate estuaries. Geophysical Research Letters, 49(2), e2021GL095579.
Slater, T., Lawrence, I. R., Otosaka, I. N., Shepherd, A., Gourmelen, N., Jakob, L., Tepes, P., Gilbert, L., & Nienow, P. (2021). Review article: Earth’s ice imbalance. The Cryosphere, 15(1), 233–246.
Smith, K. E., Burrows, M. T., Hobday, A. J., King, N. G., Moore, P. J., Sen Gupta, A., Thomsen, M. S., Wernberg, T., & Smale, D. A. (2023). Biological impacts of marine heatwaves. Annual Review of Marine Science, 15(1), 119–145.
Spalding, C., Finnegan, S., & Fischer, W. W. (2017). Energetic costs of calcification under ocean acidification. Global Biogeochemical Cycles, 31(5), 866–877.
Starko, S., Epstein, G., Chalifour, L., Bruce, K., Buzzoni, D., Csordas, M., Dimoff, S., Hansen, R., Maucieri, D. G., McHenry, J., Tietjen Kristina L., Timmer, Brian, & Baum, Julia K. (2025). Ecological responses to extreme climatic events: A systematic review of the 2014–2016 Northeast Pacific marine heatwave. InOceanography and Marine Biology(p. 55). CRC Press.
Steiner, N. S., & Reader, C. M. (2024). Trends and projections in climate-related stressors impacting arctic marine ecosystems—A CMIP6 model analysis. Journal of Geophysical Research: Oceans, 129(11), e2024JC020970.
Stramma, L., Schmidtko, S., Bograd, S. J., Ono, T., Ross, T., Sasano, D., & Whitney, F. A. (2020). Trends and decadal oscillations of oxygen and nutrients at 50 to 300 m depth in the equatorial and North Pacific. Biogeosciences, 17(3), 813–831.
Szuwalski, C. S., Aydin, K., Fedewa, E. J., Garber-Yonts, B., & Litzow, M. A. (2023). The collapse of eastern Bering Sea snow crab. Science, 382(6668), 306–310.
Tabata, S., & Weichselbaumer, W. E. (1992). An update of the statistics of hydrographic/CTD data taken at Ocean Station P (May 1956-September 1990). Fisheries and Oceans Canada.
Takano, Y., Ilyina, T., Tjiputra, J., Eddebbar, Y. A., Berthet, S., Bopp, L., Buitenhuis, E., Butenschön, M., Christian, J. R., Dunne, J. P., Gröger, M., Hayashida, H., Hieronymus, J., Koenigk, T., Krasting, J. P., Long, M. C., Lovato, T., Nakano, H., Palmieri, J., … Yool, A. (2023). Simulations of ocean deoxygenation in the historical era: Insights from forced and coupled models. Frontiers in Marine Science, 10, 1139917.
Thomson, J., & Rogers, W. E. (2014). Swell and sea in the emerging Arctic Ocean. Geophysical Research Letters, 41(9), 3136–3140.
Tuomi, L., Kanarik, H., Björkqvist, J.-V., Marjamaa, R., Vainio, J., Hordoir, R., Höglund, A., & Kahma, K. K. (2019). Impact of ice data quality and treatment on wave hindcast statistics in seasonally ice-covered seas. Frontiers in Earth Science, 7.
van de Wal, R. S. W., Nicholls, R. J., Behar, D., McInnes, K., Stammer, D., Lowe, J. A., Church, J. A., DeConto, R., Fettweis, X., Goelzer, H., Haasnoot, M., Haigh, I. D., Hinkel, J., Horton, B. P., James, T. S., Jenkins, A., LeCozannet, G., Levermann, A., Lipscomb, W. H., … White, K. (2022). A high‐end estimate of sea level rise for practitioners. Earth’s Future, 10(11), e2022EF002751.
Vaquer-Sunyer, R., & Duarte, C. M. (2008). Thresholds of hypoxia for marine biodiversity. Proceedings of the National Academy of Sciences, 105(40), 15452–15457.
Volkov, D. L., Schmid, C., Chomiak, L., Germineaud, C., Dong, S., & Goes, M. (2022). Interannual to decadal sea level variability in the subpolar North Atlantic: The role of propagating signals. Ocean Science, 18(6), 1741–1762.
Vousdoukas, M. I., Mentaschi, L., Voukouvalas, E., Verlaan, M., Jevrejeva, S., Jackson, L. P., & Feyen, L. (2018). Global probabilistic projections of extreme sea levels show intensification of coastal flood hazard. Nature Communications, 9(1), 2360.
Wahl, T., Haigh, I. D., Nicholls, R. J., Arns, A., Dangendorf, S., Hinkel, J., & Slangen, A. B. A. (2017). Understanding extreme sea levels for broad-scale coastal impact and adaptation analysis. Nature Communications, 8(1), 16075.
Wang, D., Gouhier, T. C., Menge, B. A., & Ganguly, A. R. (2015). Intensification and spatial homogenization of coastal upwelling under climate change. Nature, 518(7539), 390–394.
Wang, P., & Bernier, N. B. (2023). Adding sea ice effects to a global operational model (NEMO v3.6) for forecasting total water level: Approach and impact. Geoscientific Model Development, 16(11), 3335–3354.
Wang, P., Bernier, N. B., & Thompson, K. R. (2022). Adding baroclinicity to a global operational model for forecasting total water level: Approach and impact. Ocean Modelling, 174, 102031.
Wang, X. L., Casas-Prat, M., Feng, Y., Crosby, A., & Swail, V. R. (2021). Historical changes in the Davis Strait Baffin Bay surface winds and waves, 1979-2016. Journal of Climate, 1–44.
Wang, X. L., Feng, Y., Chan, R., & Isaac, V. (2016). Inter-comparison of extra-tropical cyclone activity in nine reanalysis datasets. Atmospheric Research, 181, 133–153.
Wang, X. L., Feng, Y., & Swail, V. R. (2014). Changes in global ocean wave heights as projected using multimodel CMIP5 simulations. Geophysical Research Letters, 41(3), 1026–1034.
Wang, X. L., Feng, Y., Swail, V. R., & Cox, A. (2015). Historical changes in the beaufort-Chukchi–Bering seas surface winds and waves, 1971–2013. Journal of Climate, 28(19), 7457–7469.
Wang, X. L., Swail, V. R., & Zwiers, F. W. (2006). Climatology and Changes of Extratropical Cyclone Activity: Comparison of ERA-40 with NCEP–NCAR Reanalysis for 1958–2001. Journal of Climate, 19(13), 3145–3166.
Wang, Y., Kajtar, J. B., Alexander, L. V., Pilo, G. S., & Holbrook, N. J. (2022). Understanding the changing nature of marine cold-spells. Geophysical Research Letters, 49(6), e2021GL097002.
Wang, Z., Greenan, B. J. W., Hannah, C. G., & Layton, C. (2025). Past and future changes in sea surface temperature in the oceans surrounding Canada. Can. Tech. Rep. Hydrogr. Ocean Sci. 404, v + 44p.
Weller, E., Min, S.-K., Lee, D., Kug, J.-S., Cai, W., & Yeh, S.-W. (2015). Human contribution to the 2014 record high sea surface temperatures over the western tropical and Northeast Pacific Ocean. Bulletin of the American Meteorological Society, 96(12), S100–S104.
Whalen, D., Forbes, D. L., Kostylev, V., Lim, M., Fraser, P., Nedimović, M. R., & Stuckey, S. (2022). Mechanisms, volumetric assessment, and prognosis for rapid coastal erosion of Tuktoyaktuk Island, an important natural barrier for the harbour and community. Canadian Journal of Earth Sciences, 59(11), 945–960.
Whitney, F. A., Freeland, H. J., & Robert, M. (2007). Persistently declining oxygen levels in the interior waters of the eastern subarctic Pacific. Progress in Oceanography, 75(2), 179–199.
Wolf, M. K., Hamme, R. C., Gilbert, D., Yashayaev, I., & Thierry, V. (2018). Oxygen saturation surrounding deep water formation events in the labrador sea from argo‐O 2 data. Global Biogeochemical Cycles, 32(4), 635–653.
Woodworth, P. L., Melet, A., Marcos, M., Ray, R. D., Wöppelmann, G., Sasaki, Y. N., Cirano, M., Hibbert, A., Huthnance, J. M., Monserrat, S., & Merrifield, M. A. (2019). Forcing factors affecting sea level changes at the coast. Surveys in Geophysics, 40(6), 1351–1397.
Yamamoto-Kawai, M., McLaughlin, F. A., Carmack, E. C., Nishino, S., & Shimada, K. (2009). Aragonite undersaturation in the arctic ocean: Effects of ocean acidification and sea ice melt. Science, 326(5956), 1098–1100.
Yamamoto‐Kawai, M., Tsujimoto, H., Zhang, Y., Zimmermann, S., & Williams, W. (2025). Vertical Expansion of Aragonite Undersaturated Waters in the Canada Basin of the Arctic Ocean From 2003 to 2019. Journal of Geophysical Research: Oceans, 130(2), e2024JC021166.
Yao, Y., Wang, C., & Fu, Y. (2022). Global marine heatwaves and cold-spells in present climate to future projections. Earth’s Future, 10(11), e2022EF002787.
Young, I. R., & Ribal, A. (2019). Multiplatform evaluation of global trends in wind speed and wave height. Science, 364(6440), 548–552. https://doi.org/10.1126/science.aav9527
Zemp, M., Huss, M., Thibert, E., Eckert, N., McNabb, R., Huber, J., Barandun, M., Machguth, H., Nussbaumer, S. U., Gärtner-Roer, I., Thomson, L., Paul, F., Maussion, F., Kutuzov, S., & Cogley, J. G. (2019). Global glacier mass changes and their contributions to sea-level rise from 1961 to 2016. Nature, 568(7752), 382–386.
Zhai, L., Greenan, B., Thomson, R., & Tinis, S. (2019). Use of oceanic reanalysis to improve estimates of extreme storm surge. Journal of Atmospheric and Oceanic Technology, 36(11), 2205–2219.
Zhai, L., Lu, Y., & Greenan, B. (2025). Evaluation of budget of local sea level trends along coast of Canada during 1958-2015. Journal of Geophysical Research: Oceans, 130.
Zhai, L., Lu, Y., Wang, H., Garric, G., & Van Gennip, S. (2025). Variations of marine heatwaves and cold spells in the Northwest Atlantic during 1993-2023. 9th Edition of the Copernicus Ocean State Report (OSR9).
Zhang, H., & Sheng, J. (2013). Estimation of extreme sea levels over the eastern continental shelf of North America: Estimation of extreme sea levels. Journal of Geophysical Research: Oceans, 118(11), 6253–6273.
Zhang, Y., Yamamoto‐Kawai, M., & Williams, W. J. (2020). Two decades of ocean acidification in the surface waters of the Beaufort Gyre, Arctic Ocean: Effects of sea ice melt and retreat from 1997–2016. Geophysical Research Letters, 47(3), e60119.