
Bocaccio (Sebastes paucispinis) : COSEWIC assessment and status report 2013
Endangered
2013
Table of Contents
- Document Information
- COSEWIC Assessment Summary
- COSEWIC Executive Summary
- Technical Summary
- Preface
- Wildlife Species Description and Significance
- Distribution
- Habitat
- Biology
- Population Sizes and Trends
- Limiting Factors and Threats
- Protection, Status, and Ranks
- Acknowledgements and Authorities Contacted
- Information Sources
- Biographical Summary of Report Writer(s)
- Collections Examined
List of Figures
- Figure 1a. Adult Bocaccio. Note the melanomas in the top photograph
- Figure 1b. Adult Bocaccio.
- Figure 2. Global distribution of Bocaccio along the Pacific Coast of North America (Website accessed February 2013: AquaMaps Website)
- Figure 3. (a) A chart of coastal BC waters showing spatial distribution of all trawl tows which captured one or more Bocaccio (January, 1996-June, 2001); also shown are the boundaries of Major Areas used by DFO fisheries management (source: COSEWIC 2002).
- Figure 3. (b) Distribution of Bocaccio based on survey and commercial observations for the 1996-2011 time period (source: Norm Olsen, pers. comm., 2012). Figure b indicates all 2 km x 2 km cells with at least one record of Bocaccio capture.
- Figure 4. Maximum potential habitat area for adult Bocaccio based on preferred bottom depth zone of 77-309 m. Shaded area equals 48,346 km2. Note that the shaded area excludes enclosed waters and inlets, some of which have proven to be habitat for adult and young Bocaccio, and shallower coastal waters, which may be habitat for juveniles (source: COSEWIC 2002)
- Figure 5. Estimated length at age of male (-) and female (---) Bocaccio in BC waters, based on the von Bertalanffy growth model (based on growth parameters from Stanley et al. 2012)
- Figure 6. Comparison of the lognormal and binomial standardized CPUE indices for Bocaccio. The error bars show ± 95% confidence bounds. The decline observed after the 2003/2004 fishing year is thought to reflect change in fishers’ behaviour, and data after that year are therefore not included in the Bayesian Schaeffer surplus production model (source: Stanley et al. 2012)
- Figure 7. Biomass estimates for Bocaccio from: a) West Coast Vancouver Island shrimp trawl, b) Queen Charlotte Sound shrimp trawl, c) US Triennial survey, and d) IPHC setline surveys. Bias corrected 95% confidence intervals from 1,000 bootstrap replicates (panels a, b, and d) or 5,000 bootstrap replicates (panel c) are plotted (source: Stanley et al. 2012)
- Figure 8. Biomass estimates for Bocaccio from: a) West Coast Haida Gwaii; b) Hecate Strait, c) Queen Charlotte Sound, and d) West Coast Vancouver Island Groundfish Synoptic trawl surveys for 2003 to 2011. Bias corrected 95% confidence intervals from 1000 bootstrap replicates are plotted (source: Stanley et al. 2012)
- Figure 9. Reconstructed catch of Bocaccio for (a) the 1935-2012 time period, with (b) a close-up of the 2000-2012 time period, in the trawl (domestic US & Canadian and foreign) and rockfish ZN hook and line (HL) fisheries, the halibut fishery, the salmon troll fishery, and the recreational fishery. Catches in the trawl and rockfish ZN HL fisheries are fixed; catches in the three other fisheries are estimated. These reconstructed catches were input values in the reference case of the Schaefer surplus production model (see Appendix 7)
- Figure 10. Plots of median and 80% probability intervals of the estimated stock biomass with the nine biomass indices (i.e., one from commercial trawl and eight from the scientific surveys) rescaled by their median for different timescales; a. 1935-2012; b. 1975-2012; c. 2000-2012. Note that some of the very large values for some of the indices are not shown in panes b. and c. to permit closer inspection of more recent trends. Reconstructed catch history of the seven fisheries are also illustrated and scaled to the second y-axis (source: Stanley et al. 2012)
- Figure 11. Proportion of mature females by age (red line) and age frequency histograms for the females in the commercial catches (source: Stanley et al. 2012)
- Figure 12. Map showing the areas closed to bottom trawl fishing (since April 2, 2012), consistent with the new habitat conservation measures for corals and sponges (source: DFO 2013). Inset map shows the maximum potential habitat area for adult Bocaccio (see Figure 4)
List of Appendices
- Appendix 1. Arithmetic and standardized commercial bottom trawl CPUE indices with 95% confidence bounds of the standardized indices and the associated standard error. The geometric mean of the standardized series has been scaled so that it equals the geometric mean of the arithmetic series. The last three fishing years were not included in the assessment, because they were not comparable with the earlier period (source: Stanley et al. 2012)
- Appendix 2. Biomass estimates for Bocaccio from the West Coast Vancouver Island shrimp trawl survey for the survey years 1975 to 2011. These are based on a post-stratification of this survey into two strata and by assuming that the survey tows were randomly selected within these areas. Bootstrap bias corrected 95% confidence intervals and CVs are based on 1,000 random draws with replacement. The analytic CV is based on the assumption of random tow selection within a stratum; – indicates not applicable (source: Stanley et al. 2012)
- Appendix 3. Biomass estimates for Bocaccio from the Queen Charlotte Sound shrimp trawl survey for the survey years 1999 to 2011. Bootstrap bias corrected 95% confidence intervals and CVs are based on 1,000 random draws with replacement. The analytic CV is based on the assumption of random tow selection within a stratum; – indicates not applicable (source: Stanley et al. 2012)
- Appendix 4. Biomass estimates for Bocaccio in the US triennial survey (Canadian waters only) with 95% confidence regions based on the bootstrap distribution of biomass. Biomass estimates are based on a post-stratification of this survey into two strata and by assuming that the survey tows were randomly selected within these areas. Bootstrap bias corrected confidence intervals are based on 5,000 random draws with replacement (source: Stanley et al. 2012)
- Appendix 5. Estimates and 95% confidence limits of relative catch rate (pieces/skate) of Bocaccio in the IPHC BC longline survey (source: Stanley et al. 2012)
- Appendix 6a. Biomass estimates for Bocaccio from the four Groundfish synoptic trawl survey - West Coast Haida Gwaii (2006 to 2010). Biomass estimates are based on a post-stratification of the survey into two strata and by assuming that the survey tows were randomly selected within these areas. Bootstrap bias corrected 95% confidence intervals and CVs are based on 1,000 random draws with replacement. The analytic CVs are based on the assumption of random tow selection within a stratum (source: Stanley et al. 2012)
- Appendix 6b. Biomass estimates for Bocaccio from the four Groundfish synoptic trawl survey - Hecate Strait (2005-2011). Biomass estimates are based on a post-stratification of the survey into two strata and by assuming that the survey tows were randomly selected within these areas. Bootstrap bias corrected 95% confidence intervals and CVs are based on 1,000 random draws with replacement. The analytic CVs are based on the assumption of random tow selection within a stratum (source: Stanley et al. 2012)
- Appendix 6c. Biomass estimates for Bocaccio from the four Groundfish synoptic trawl survey - Queen Charlotte Sound (2003-2011). Biomass estimates are based on a post-stratification of the survey into two strata and by assuming that the survey tows were randomly selected within these areas. Bootstrap bias corrected 95% confidence intervals and CVs are based on 1,000 random draws with replacement. The analytic CVs are based on the assumption of random tow selection within a stratum (source: Stanley et al. 2012)
- Appendix 6d. Biomass estimates for Bocaccio from the four Groundfish synoptic trawl survey - West Coast Vancouver Island (2004-2010). Biomass estimates are based on a post-stratification of the survey into two strata and by assuming that the survey tows were randomly selected within these areas. Bootstrap bias corrected 95% confidence intervals and CVs are based on 1,000 random draws with replacement. The analytic CVs are based on the assumption of random tow selection within a stratum (source: Stanley et al. 2012)
- Appendix 7. Inputted values for catch (1935-2012) in the reference case of the Bayesian surplus production model. Catches for trawl and rockfish ZN hook and line (HL) are fixed, catches in the other fisheries (i.e., halibut, salmon troll, recreational) are estimated. Catch values are rounded to nearest ton (source: Stanley et al. 2012)
- Appendix 8. Posterior median estimates of the stock biomass (t) with 10th, 50th and 90th percentiles for the 1935-2012 period, based on the reference case run of the model (source: Stanley et al. 2012)
Document Information

Committee on the Status of Endangered Wildlife in Canada (COSEWIC) status reports are working documents used in assigning the status of wildlife species suspected of being at risk. This report may be cited as follows:
COSEWIC. 2013. COSEWIC assessment and status report on the Bocaccio Sebastes paucispinis in Canada. Committee on the Status of Endangered Wildlife in Canada. Ottawa. x + 49 pp. (Species at Risk Public Registry website).
Previous report(s):
Crossman, E.J.1994. COSEWIC status report on the Bocaccio Sebastes paucispinis in Canada. Committee on the Status of Endangered Wildlife in Canada. Ottawa. 43 pp.
Production note:
COSEWIC would like to acknowledge Alexandra E. Valentin for writing the status report on Bocaccio (Sebastes paucispinis) in Canada. This report was prepared under contract with Environment Canada and was overseen by Alan Sinclair, Co-chair of the COSEWIC Marine Fishes Species Specialist Subcommittee.
For additional copies contact:
COSEWIC Secretariat
c/o Canadian Wildlife Service
Environment Canada
Ottawa, ON
K1A 0H3
Tel.: 819-953-3215
Fax: 819-994-3684
COSEWIC E-mail
COSEWIC web site
Également disponible en français sous le titre Évaluation et Rapport de situation du COSEPAC sur le Bocaccio (Sebastes paucispinis) au Canada.
Cover illustration/photo:
Bocaccio - National Oceanic and Atmospheric Administration (NOAA), National Marine Fisheries Service (NMFS), Southwest Fisheries Science Center (SWFSC), Remotely Operated Vehicles (ROV) Team; Website accessed February 2012:
NOAA Photo Library - Bocaccio rockfish (Sebastes paucispinus).
©Her Majesty the Queen in Right of Canada, 2014.
Catalogue No. CW69-14/315-2014E-PDF
ISBN 978-1-100-23554-7

COSEWIC Assessment Summary
Assessment Summary - November 2013
- Common name
- Bocaccio
- Scientific name
- Sebastes paucispinis
- Status
- Endangered
- Reason for designation
- This species is a long-lived rockfish with a maximum age for females in Canada of 52 years and a generation time of 20 years. Its life history makes it susceptible to overfishing. The current assessment has benefited from increased population information that covers the entire distribution in Canada and extends much further into the past. The population has been in continuous decline for 60 years and it has declined by 28% in the 10-year period since it was first assessed by COSEWIC. New surveys initiated since the last assessment indicate that these recent declines have occurred in areas of highest biomass off the west coast of Vancouver Island and in Queen Charlotte Sound. Fishery bycatch has been reduced but remains the main threat to the population.
- Occurrence
- Pacific Ocean
- Status history
- Designated Threatened in November 2002. Status re-examined and designated Endangered in November 2013.
COSEWIC Executive Summary
Bocaccio
Sebastes paucispinis
Wildlife Species Description and Significance
Bocaccio is one of at least 39 species of rockfish found in marine waters off British Columbia (BC). It is distinguished from other rockfish (Sebastes spp.) by its long upper jaw. There are two demographic clusters of Bocaccio, one centred on the west coast of British Columbia and another centred on central/southern California. However, genetic studies fail to find population differentiation along the Pacific coast. This report treats all the Bocaccio of the BC coast as a single population.
Distribution
Bocaccio are found in coastal waters of the northeastern Pacific Ocean from the Gulf of Alaska to Baja California, Mexico. The population in BC probably overlaps to some extent with United States (US) populations to the north and south. Most BC catches come from the offshore Pacific waters near the edge of the continental shelf, with the largest catches coming from the northwest coast of Vancouver Island and from Queen Charlotte Sound. Bocaccio are reported in some inlets and in the Strait of Georgia.
Habitat
Young of the year live near the surface for a few months, then settle in nearshore areas where they form schools and are found over bottom depths of 30-120 m. Adults can be semi-pelagic and are usually found over rocky high relief bottom, most commonly over depths of 60-340 m. Recent studies identify corals and sponges as potential habitat for Bocaccio.
Biology
Bocaccio are livebearers. Larvae are extruded in winter in BC waters. Maturity is reached at about 7 years. Bocaccio can reach a weight of 9 kg and a length of over 90 cm. Females tend to be larger than males. Maximum age is at least 57 years. Bocaccio are relatively sedentary as adults but are more mobile during the first few years of life. They undergo rapid vertical movements over the day. Juveniles and adults feed on a wide variety of invertebrates and fishes. Predators of adults are likely limited to larger fishes and marine mammals.
Population Sizes and Trends
Based on stock reconstruction, the exploitable stock biomass has declined significantly since the 1930s, with the steepest decline occurring from 1985 to 1995. The population likely continued to decline from 2000 to 2010. Population biomass has declined by more than 90% over the last 60 years and by 28% since the last COSEWIC assessment in 2002. The biomass estimate for 2012 is less than 2,000 t and represents 3.5% of the estimated unfished biomass. There is no sign that the population has started to increase. Biomass estimates are at very low levels in US neighbouring waters and no rescue of Canadian fish is anticipated.
Threats and Limiting Factors
Catches (as bycatch) in the commercial groundfish fisheries are assumed to be the major current source of human-induced mortality. Life history characteristics (e.g., longevity, viviparity and a sedentary adult distribution) render this species vulnerable to overfishing. Recruitment is likely to be episodic and affected by climatic conditions. Available age data are too scarce to gauge recruitment in BC waters, but there are indications of poor recruitment to the fishery over the 2006-2009 period.
Protection, Status, and Ranks
A set of pilot management measures was adopted in 2013, with the objective to reduce total Bocaccio catches to 75 t yr-1 within 3 years. Various measures impose constraints on landings in commercial fisheries. Since 2004, a voluntary program in the trawl fleet directs the proceeds of catches for research and management purposes. A similar pilot program is supported by the hook-and-line fleet since 2013. Recreational catches are constrained by “rockfish” daily bag limits. Rockfish Conservation Areas have been established since 2002, in nearshore areas throughout the BC coast. Since April 2012, several measures have been implemented to provide additional protection of coral and sponge habitat, including avoidance protocols and restricting trawling activities to areas previously trawled between 1996 and 2011. The benefits for Bocaccio resulting from these habitat conservation measures are difficult to anticipate.
The International Union for Conservation of Nature (IUCN) Red List of threatened species lists Bocaccio as Critically Endangered (1996). Bocaccio was assessed as Threatened by COSEWIC in 2002. The US Puget Sound/Georgia Basin Distinct Population Segments of Bocaccio is considered as Endangered under the US Endangered Species Act. The US southern population (California to northern Mexico) is a Species of Concern.
Technical Summary
Sebastes paucispinis
Bocaccio
Bocaccio
- Range of occurrence in Canada (province/territory/ocean):
- Pacific Ocean (BC marine waters, mostly along the continental coast; one population is assumed)
Demographic Information
Generation time (usually average age of parents in the population; indicate if another method of estimating generation time indicated in the IUCN guidelines (2008) is being used)
20.4 yrs
Is there an [observed, inferred, or projected] continuing decline in number of mature individuals?
Yes
(Inferred)
Estimated percent of continuing decline in total number of mature individuals within [5 years or 2 generations]
88 % decline in 2 generations
[Observed, estimated, inferred, or suspected] percent [reduction or increase] in total number of mature individuals over the last [10 years, or 3 generations].
92 % decline in 3 generations
[Projected or suspected] percent [reduction or increase] in total number of mature individuals over the next [10 years, or 3 generations].
N/A
[Observed, estimated, inferred, or suspected] percent [reduction or increase] in total number of mature individuals over any [10 years, or 3 generations] period, over a time period including both the past and the future.
N/A
Are the causes of the decline clearly reversible and understood and ceased?
No, the cause is understood but it has not ceased and it is not clearly reversible.
Are there extreme fluctuations in number of mature individuals?
No
Extent and Occupancy Information
Estimated extent of occurrence
> 48,000 km2
(maximum potential habitat based on preferred bottom depth zone; different from COSEWIC usual definition)
Index of area of occupancy (IAO)
(Always report 2x2 grid value).
at least 29,816 km2
Is the total population severely fragmented?
No
Number of locationsFootnote∗
The number of locations is unclear.
The main threats include bycatch mortality in diverse fisheries in a number of regions.
Is there an [observed, inferred, or projected] continuing decline in extent of occurrence?
No
(inferred)
Is there an [observed, inferred, or projected] continuing decline in index of area of occupancy?
No
(inferred)
Is there an [observed, inferred, or projected] continuing decline in number of populations?
No; single population
(inferred)
Is there an [observed, inferred, or projected] continuing decline in number of locationsFootnote∗?
N/A
Is there an [observed, inferred, or projected] continuing decline in [area, extent and/or quality] of habitat?
No
(inferred)
Are there extreme fluctuations in number of populations?
No; single population
Are there extreme fluctuations in number of locationsFootnote∗?
N/A
Are there extreme fluctuations in extent of occurrence?
No
Are there extreme fluctuations in index of area of occupancy?
No
| Population | N Mature Individuals |
|---|---|
| - | BC population: probably over 400,000, based on biomass in 2012 (1,879 t) divided by a mean weight of 4.3 kg |
| Total | Probably over 400,000 |
Quantitative Analysis
Probability of extinction in the wild is at least [20% within 20 years or 5 generations, or 10% within 100 years].
N/A
Threats (actual or imminent, to populations or habitats)
The main threat is overfishing mostly as bycatch in commercial fisheries, but also from recreational and First Nation fisheries, and maybe in adjacent US waters.
Potential threats to habitat are observed declines in dissolved oxygen in BC waters and perhaps coral and sponge destruction by fishing gear.
Rescue Effect (immigration from outside Canada)
Status of outside population(s)?
In Alaska, Bocaccio biomass has been at a very low level since 1987.
South of BC waters, the US population is severely depleted
Is immigration known or possible?
Probably, as larvae and juveniles.
Would immigrants be adapted to survive in Canada?
Probably
Is there sufficient habitat for immigrants in Canada?
Probably
Is rescue from outside populations likely?
No
Data-Sensitive Species
- Is this a data-sensitive species?
- No
Status History
- COSEWIC:
- Designated Threatened in November 2002. Status re-examined and designated Endangered in November 2013
Status and Reasons for Designation
- Status:
- Endangered
- Alpha-numeric code:
- A2b
- Reason for Designation:
- This species is a long-lived rockfish with a maximum age for females in Canada of 52 years and a generation time of 20 years. Its life history makes it susceptible to overfishing. The current assessment has benefited from increased population information that covers the entire distribution in Canada and extends much further into the past. The population has been in continuous decline for 60 years and it has declined by 28% in the 10-year period since it was first assessed by COSEWIC. New surveys initiated since the last assessment indicate that these recent declines have occurred in areas of highest biomass off the west coast of Vancouver Island and in Queen Charlotte Sound. Fishery bycatch has been reduced but remains the main threat to the population.
Applicability of Criteria
- Criterion A:
- (Decline in Total Number of Mature Individuals): Meets Endangered A2b since the population has declined by 92% over the previous 3 generations, the declining trend continues, the cause of the decline is understood but it has not ceased and it may not be reversible.
- Criterion B:
- (Small Distribution Range and Decline or Fluctuation): Does not apply since the extent of occurrence (EO) and IAO exceed criteria.
- Criterion C:
- (Small and Declining Number of Mature Individuals): Does not apply since the number of mature individuals exceeds the criteria.
- Criterion D:
- (Very Small or Restricted Population): Does not apply since the mature population size and IAO exceed the criteria.
- Criterion E:
- (Quantitative Analysis): Not done.
Preface
In the last Bocaccio assessment by COSEWIC in 2002, abundance in BC waters was poorly known, and the assessment was largely based on survey results that covered only the southern portion of the species distribution in Canada. Its low commercial importance had inhibited directed research and the low catches had limited the utility of fishery-dependent data for tracking abundance. Since 2002, new groundfish surveys covering the entire BC coast have been implemented, research was undertaken to estimate fishery catches going back to 1935, and reporting of Bocaccio catch has improved. In 2009, Fisheries and Oceans Canada DFO conducted a stock assessment for Bocaccio based on new and improved data that provided a multi-generational time series of population abundance. In addition, stock projections were carried out over 5-, 20-, and 40-year scenarios, under different constant total allowable catch policies (Stanley et al. 2009). The assessment was updated in 2012, adding four years of observations (2007/2008-2010/2011) and modelling the recreational catches for the first time in a Bocaccio assessment (Stanley et al. 2012). Despite uncertainty and potential bias in some estimates, the 2009 and 2012 assessments clearly indicated that the stock is severely depleted. Building on the new knowledge from the 2009 stock assessment, the recovery potential of Bocaccio was assessed in 2009 by DFO. This COSEWIC report incorporates the new information generated by these recent assessments.

COSEWIC History
The Committee on the Status of Endangered Wildlife in Canada (COSEWIC) was created in 1977 as a result of a recommendation at the Federal-Provincial Wildlife Conference held in 1976. It arose from the need for a single, official, scientifically sound, national listing of wildlife species at risk. In 1978, COSEWIC designated its first species and produced its first list of Canadian species at risk. Species designated at meetings of the full committee are added to the list. On June 5, 2003, the Species at Risk Act (SARA) was proclaimed. SARA establishes COSEWIC as an advisory body ensuring that species will continue to be assessed under a rigorous and independent scientific process.
COSEWIC Mandate
The Committee on the Status of Endangered Wildlife in Canada (COSEWIC) assesses the national status of wild species, subspecies, varieties, or other designatable units that are considered to be at risk in Canada. Designations are made on native species for the following taxonomic groups: mammals, birds, reptiles, amphibians, fishes, arthropods, molluscs, vascular plants, mosses, and lichens.
COSEWIC Membership
COSEWIC comprises members from each provincial and territorial government wildlife agency, four federal entities (Canadian Wildlife Service, Parks Canada Agency, Department of Fisheries and Oceans, and the Federal Biodiversity Information Partnership, chaired by the Canadian Museum of Nature), three non-government science members and the co-chairs of the species specialist subcommittees and the Aboriginal Traditional Knowledge subcommittee. The Committee meets to consider status reports on candidate species.
Definitions (2013)
- Wildlife Species
- A species, subspecies, variety, or geographically or genetically distinct population of animal, plant or other organism, other than a bacterium or virus, that is wild by nature and is either native to Canada or has extended its range into Canada without human intervention and has been present in Canada for at least 50 years.
- Extinct (X)
- A wildlife species that no longer exists.
- Extirpated (XT)
- A wildlife species no longer existing in the wild in Canada, but occurring elsewhere.
- Endangered (E)
- A wildlife species facing imminent extirpation or extinction.
- Threatened (T)
- A wildlife species likely to become endangered if limiting factors are not reversed.
- Special Concern (SC)Footnote*
- A wildlife species that may become a threatened or an endangered species because of a combination of biological characteristics and identified threats.
- Not at Risk (NAR)Footnote**
- A wildlife species that has been evaluated and found to be not at risk of extinction given the current circumstances.
- Data Deficient (DD)Footnote***
- A category that applies when the available information is insufficient (a) to resolve a species’ eligibility for assessment or (b) to permit an assessment of the species’ risk of extinction.
The Canadian Wildlife Service, Environment Canada, provides full administrative and financial support to the COSEWIC Secretariat.
Wildlife Species Description and Significance
Name and Classification
Bocaccio (Sebastes paucispinis Ayres, 1854) is a member of the order Scorpaeniformes and family Scorpaenidae. It is one of about 69 species of rockfish (Sebastes spp.) known to occur along the Pacific coast of North America (Eschmeyer et al. 1983; Love et al. 2002; Hyde and Vetter 2007). It is one of at least 39 species known to occur in British Columbia (BC) waters. Other common or market names include Rock Salmon, Salmon Rockfish, Pacific Red Snapper, Pacific Snapper, Oregon Red Snapper, and Oregon Snapper; some of these names are shared with other species. British Columbia commercial fishers often call them Longjaws. The former generation of BC fishermen used to call them Andy-Gumps (Love et al. 2002). Bocaccio is also the name in French.
Morphological Description
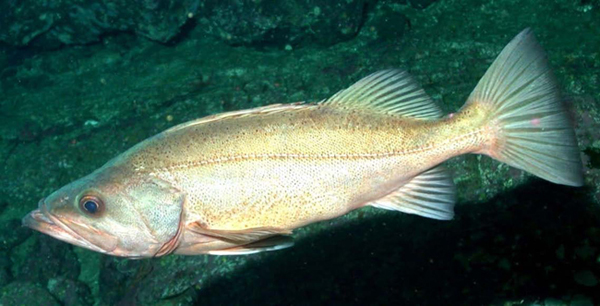
Bocaccio is one of the largest species of rockfish (Figure 1). The principal field diagnostic of this species is the long upper jaw that extends to, or behind, the eye. Larvae can be identified by their pigment pattern. Juveniles less than 25 cm in length are light bronze with small brown spots on their sides (Moser 1967; Moser et al. 1977; Moser 1996). As the juveniles mature, their colour darkens and the spots disappear. Adult Bocaccio range in colour from olive orange to burnt orange or brown on the dorsal surface, becoming pink to red ventrally. Adult Bocaccio and other rockfish often develop black, melanistic blotches (Figure 1), which may be a pre-cancerous melanoma (Love et al. 2002).
Figure 1a. Adult Bocaccio. Note the melanomas in the top photograph.
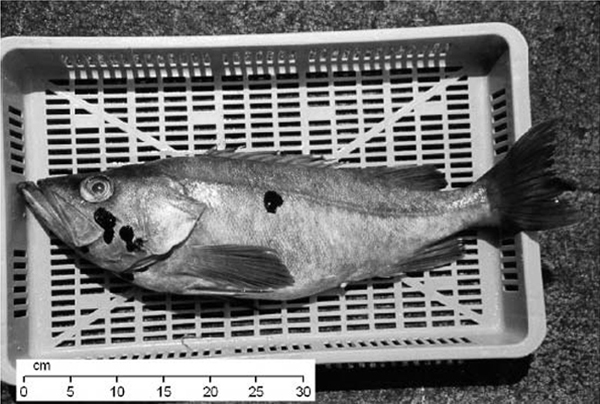
Photo: Steve Sviatko © Fisheries and Oceans Canada. photo archives, Groundfish Section, Science Branch, Pacific Region
Figure 1b. Adult Bocaccio.

Photo: © NOAA NMFS SWFSC ROV Team; Website accessed February 2012: NOAA Photo Library - Bocaccio rockfish (Sebastes paucispinus).
Population Spatial Structure and Variability
Bocaccio is mainly distributed in the offshore waters along the Pacific coast of North America, from Alaska to central Baja California (Figure 2). There is little information on distribution in the inlets and nearshore waters of BC, but they have been reported from the Strait of Georgia, Juan de Fuca Strait, Queen Charlotte Strait, and other inlets and enclosed waters (Figure 3a). There is no evidence of population structure in offshore Canadian waters.
Figure 2. Global distribution of Bocaccio along the Pacific Coast of North America (Website accessed February 2013: AquaMaps Website).
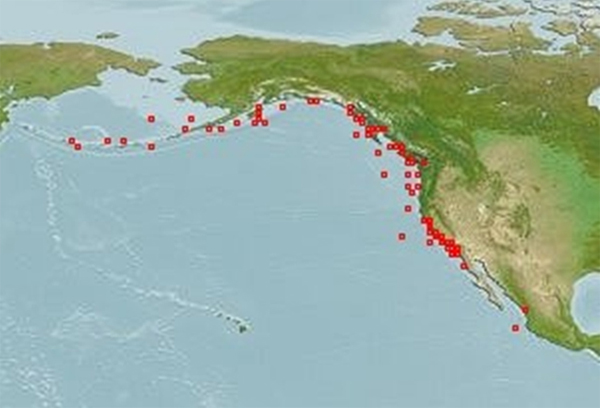
Long description for Figure 2
Map of the global distribution of the Bocaccio along the Pacific coast of North America. The main distribution is from Alaska to central Baja California. Further details can be found in the preceding/next paragraph(s).
Figure 3. (a) A chart of coastal BC waters showing spatial distribution of all trawl tows which captured one or more Bocaccio (January, 1996-June, 2001); also shown are the boundaries of Major Areas used by DFO fisheries management (source: COSEWIC 2002).
Long description for Figure 3a
Figure 3a is a chart of coastal British Columbia waters showing the spatial distribution of all trawl tows that captured Bocaccio between January 1996 and June 2011. The panel also shows the boundaries of major areas used by Fisheries and Oceans Canada. Further details can be found in the preceding/next paragraph(s).
Figure 3. (b) Distribution of Bocaccio based on survey and commercial observations for the 1996-2011 time period (source: Norm Olsen, pers. comm., 2012). Figure b indicates all 2 km x 2 km cells with at least one record of Bocaccio capture.
Long description for Figure 3b
Figure 3b is a chart of British Columbia waters showing the distribution of Bocaccio based on survey and commercial observations from 1996 to 2011. The chart is based on 2 kilometre by 2 kilometre cells containing at least one Bocaccio capture. The total area of occupancy is given as 29,816 square kilometres. Further details can be found in the preceding/next paragraph(s).
Catch statistics and scientific surveys suggest that there are two demographic clusters of Bocaccio off the west coast of North America, one centred on the west coast of British Columbia and another centred around central/southern California (Field et al. 2009). The Gulf of Alaska is at the northern edge of the BC population. The presence of two populations is supported by apparent differences in growth, maturity, and longevity from the two areas (Field et al. 2009 and reference therein). In between, a relative scarcity of Bocaccio, particularly of smaller fish, is observed along the Oregon Coast. This might reflect the shift in oceanographic conditions that occurs along the California current (Sivasundar and Palumbi 2010).
The Strait of Georgia basin is shared by Canada and the US and is relatively isolated from coastal Pacific waters in terms of bathymetry and hydrography (Davenne and Masson 2001). Moreover, the Strait of Georgia is connected with Puget Sound, an even more isolated basin in the US. On April 2009, Bocaccio in the Puget Sound/Georgia basin was identified as a distinct population segment (DPS) in the US (NMFS 2009). This designation is based on environmental and ecological features, species life history, and length frequency data, the latter suggesting different recruitment dynamics between coastal fish and those from the Puget Sound/Georgia basin (Drake et al. 2010). As most of these length-frequency data originate from the inside Puget Sound recreational fishery, this information does not allow conclusions to be drawn about Bocaccio in the Canadian portion of the Strait of Georgia. Although the Canadian portion of the Strait of Georgia is recognized as environmentally distinct from the offshore BC waters, there is not enough information to determine or refute whether there is a self-perpetuating population in the Strait of Georgia.
Available genetic information documenting population structure in BC waters is limited. Two genetic studies investigated the range-wide population structure of Bocaccio along the Pacific coast. Each study comprised two samples caught in the BC waters, but neither considered the Puget Sound/Georgia basin or Alaskan waters. Matala et al. (2004) examined genetic variation at seven microsatellite loci in eight samples (n = 30-67) from British Columbia to Baja California. A contingency G-test across all samples and all loci provided significant (P = 0.037) evidence for departures from global panmixia, indicating that coastal Bocaccio are not a single, randomly breeding population. A large-scale pattern of isolation by distance was not observed in the data and levels of differentiation were extremely low (FST averaged over all loci and populations was negative). However, an ad hoc method for partitioning the samples based on genetic and geographic homogeneity could not reject the possibility of some population structure related to geographic location and oceanographic features; it raised the possibility of limited gene flow between British Columbia and California, as well as between other regions (e.g., across Point Conception in California). A re-analysis, presented in Field et al. (2009), of the same data using the Bayesian partitioning program Structure 2.0 (Pritchard et al. 2000) found no support for the presence of population genetic structure among the samples of Bocaccio analyzed by Matala et al. (2004).
Buonaccorsi et al. (2012) recently characterized the population structure with temporal replicates along the Pacific Coast. The study comprised six samples (n = 47-49) representing three regions (British Columbia, Central California, Southern California Bight). The study used 31 microsatellite loci, of which 13 were associated to a gene. Unlike traditional ‘anonymous’ microsatellites, which are supposed to be neutral, gene-associated microsatellites are associated with polymorphisms that might reflect local adaptation along environmental gradients. Results revealed little evidence of population structure. Hierarchical Analysis Of Variance (ANOVA) detected no significant differences among geographic (FST = -0.001, P = 0.871) or year-class groupings (FST = <0.0001, P = 0.547), regardless of which combinations of markers were tested. While FST values were negative, exact G-tests detected heterogeneity in allele frequency among the samples over all 31 loci (FST = -0.0002; P = 0.045). No pairwise comparisons were significant after correction for multiple tests (all P-values > 0.014). The authors concluded that there is not enough evidence to reject the single homogeneous gene pool (i.e., panmixia) hypothesis for Bocaccio rockfish. The authors also suggested that Matala et al. (2004) might have reported a Type I error.
Low FST values, seemingly indicating panmixia, can be achieved with only a few migrants per generation. The failure to detect clear genetic differentiation between the two identified demographic clusters (i.e., Canadian/Northern US region versus southern/central California region) indicates that gene flow is sufficient on an evolutionary timescale to maintain genetic homogeneity over a broad geographic area between two populations, which show limited demographic dependence on a much shorter ecological timescale (Waples et al. 2008; Berntson and Moran 2009).
Designatable Units
In this report, BC Bocaccio is considered as one designatable unit (DU). The single DU hypothesis is based on the available information regarding spatial distribution of adults in the offshore waters, as well as the absence of obvious barriers to dispersion at every life-stage across the whole area. The limited available genetic information (see above) supports this designation. The Strait of Georgia might contain a self-perpetuating population, as this area is distinct from the offshore waters, but there are no available data to determine or refute this.
Distribution
Global Range
Bocaccio are found in the eastern Pacific Ocean from Stepovak Bay, Alaska west of Kodiak Island, to Punta Blanca, Baja California, Mexico (Eschmeyer et al. 1983; Figure 2).
Canadian Range
Bocaccio are present in offshore waters along the entire Pacific coast of Canada (Figure 3). The largest reported commercial catches have come from the northwest end of Vancouver Island and Queen Charlotte Sound. Most of the trawl catch comes from tows conducted near the break in slope of the continental shelf, as well as the edges of troughs in Queen Charlotte Sound. The highest catch densities are over rocky high relief bottom near the edge of the continental shelf. As most commercial groundfish fishing is conducted on the offshore waters near the continental shelf break, there is little information on the distribution in the nearshore waters and the inlets of BC. They have been reported from the Strait of Georgia, Juan de Fuca Strait, Queen Charlotte Strait, and several inlets along Vancouver Island and BC mainland (e.g., Barkley Sound and Fitz Hugh Sound; Figure 3a; COSEWIC 2002).
The maximum potential habitat area for adult Bocaccio was estimated to exceed 48,000 km2 in the 2002 COSEWIC assessment, based on preferred bottom depth zone (Figure 4). This estimate is still valid, because the overall distribution of Bocaccio remained about the same over the 2002-2011 period (Figure 3; Rick Stanley, DFO Pacific Region, pers. comm., 2012). It is assumed that this species has been present throughout this range since the development of the fishery, but the data do not allow further examination of temporal trends. Longer-term comparisons of the distribution are problematic, owing to inadequate geospatial data prior to 1991 (Rutherford 1999) and lack of data on rockfish species composition prior to 1967 (Tagart and Kimura 1982). Scientific survey time series are too recent and too variable to provide any comparison of Bocaccio distribution. Commercial data are also not comparable over time. Appropriate hook and line data are only available since 2006. Reliable trawl data are available since 1996, but trawling behaviour likely changed after the 2003/2004 fishing season. At that time, trawlers started to actively avoid Bocaccio following the implementation of a voluntary program that directed the proceeds of all Bocaccio catches for research and management (DFO 2013). Based on a 2 km x 2 km grid, the index of area of occupancy (IAO) for the 1996-2011 time period is estimated to be at least 29,816 km2 (Figure 3b).
Figure 4. Maximum potential habitat area for adult Bocaccio based on preferred bottom depth zone of 77-309 m. Shaded area equals 48,346 km2. Note that the shaded area excludes enclosed waters and inlets, some of which have proven to be habitat for adult and young Bocaccio, and shallower coastal waters, which may be habitat for juveniles (source: COSEWIC 2002).
Long description for Figure 4
Map of coastal British Columbia waters showing maximum potential habitat area for adult Bocaccio in the preferred depth range of 77 to 309 metres. Further details can be found in the preceding/next paragraph(s).
Detailed catch data from rockfish fisheries by First Nations are not available. Bocaccio have always been a part of the Aboriginal fisheries on the west coast of Vancouver Island. Jim Lane, regional fisheries biologist at the Nuu-chah-nulth Tribal Council, explains:
“There are 15 Nuu-chah-nulth Nations on the west coast of Vancouver Island (14 are part of the Nuu-chah-nulth Tribal Council); all harvest groundfish including rockfish. While the Nations do specifically target rockfish, I have never heard of Nations specifically targeting Bocaccio, rather they are harvested in conjunction with other rockfish or groundfish. For some Nations, Bocaccio are a preferred food species, while for others they are not. Nuu-chah-nulth have also an aboriginal right to fish and sell fish through the BC Supreme Court and the BC Appellate Court. This makes access to Bocaccio important for both food and economic activities. The amount of Bocaccio harvested in Nuu-chah-nulth food fisheries is unknown at this time, but it is probably safe to assume it is tied to overall abundance and similar to catch rates in other hook and line fisheries.”
There are very few available catch data and no time series of relative abundance and distribution indices for the BC portion of the Strait of Georgia. Most records are sparse, isolated, and often based on anecdotal reports, suggesting that Bocaccio is rare in the Strait of Georgia, though more common in the Juan de Fuca Strait (COSEWIC 2002). Qualitative information also suggests that Bocaccio might have been more common before the 1980s, although still at low abundance. Available data from the US portion of the Strait of Georgia support these observations (Palsson et al. 2009; Drake et al. 2010).
Search Effort
The description of Bocaccio distribution in Canada is based mostly on catch reports from all commercial trawl and hook and line (HL) fisheries, as well as from scientific synoptic trawl surveys. Although some targeting took place during earlier decades of the groundfish trawl fishery, Bocaccio is currently captured incidentally.
Bocaccio distribution was estimated based on all bycatch reported in the groundfish fishery (i.e., groundfish trawl, rockfish hook and line ZN Footnote2 category of fishing licences, which includes set-line, handline, and troll, Pacific Fishery Regulations Schedule II licensing, Pacific Halibut and Sablefish). Commercial trawl catches (not including those from inside waters of Vancouver Island) have been monitored since 1991 with independent 100% dockside coverage of landings and, since 1996, with 100% observer coverage of at sea catches. Total catches from this fishery are considered accurate since 1996. Catches in the commercial groundfish HL fishery have been monitored with 100% independent dockside monitoring for all subsectors since 1996 (ZN rockfish in 1995) and with a 100% electronic monitoring of catches at sea since 2006. Catches since 2006 are considered accurate (Stanley et al. 2009). Only accurate catch data are shown on Figure 3b.
Bocaccio distribution was also estimated based on new groundfish bottom trawl surveys that began in 2003 and cover the entire BC coast, two annual shrimp surveys (since 1996 and 1999), and the annual International Pacific Halibut Commission (IPHC) halibut longline survey (since 2003). These surveys cover the West Coast of Queen Charlotte Island, Hecate Strait, Queen Charlotte Sound and the West Coast of Vancouver Island.
Habitat
Habitat Requirements
Young Bocaccio have been captured in gillnets in nearshore sub-tidal depths off the west coast of Vancouver Island (Gillespie et al. 1993). Most of the older juveniles and adults are captured during commercial bottom trawling (in depths of 60-340 m) and midwater trawling (over bottom depths of 60-200 m) in BC waters. The principal fishing locations are on the continental shelf, near the break-in-slope of the shelf, as well as along edges of troughs and underwater canyons. These areas are mostly characterized by a rocky bottom (Sinclair et al. 2005; Bryan et al. 2010). The presence of Bocaccio in midwater trawl catches and salmon troll catches indicates they can be semi-pelagic (off-bottom).
Finney (2010) showed that the overlap between bottom-contact fisheries and the predicted habitat of coral is substantial in BC waters (between 30 and 47%, depending on the type of coral), with effort being disproportionately concentrated in areas of predicted coral habitat. Du Preez and Tunnicliffe (2011) showed that rockfish (including a limited number of data on Bocaccio) select sponges and corals over the inert substrata alone and that abundance is reduced in areas with past trawling activities. The role of biogenic habitat for early life stages of Bocaccio has not been documented yet. It has been recently shown that cold corals such as sea pen (Octocorallia: Pennatulacea) is used by Sebastes spp. larvae along the continental slope of Eastern Canada (Baillon et al. 2012).
Habitat Trends
The lack of information on the distribution of early life history stages renders it problematic to speculate on habitat issues for larvae and juveniles. There is also no information on trends in the amount of habitat available to adult Bocaccio. At least 83% of the continental shelf and slope of British Columbia is currently being used by humans, with commercial bottom trawling representing the main stressor on the habitat (Ban and Alder 2008). A recent (2010-2015) conservation strategy was developed to protect cold-water corals and sponges in BC waters (DFO 2010). In addition, new measures developed for the groundfish bottom trawl industry came into effect in April 2012 (DFO 2013). Measures include bycatch limits, avoidance protocols and the closure of a wide area of BC waters to bottom trawl fishing (see section on Habitat Protection and Ownership); the benefits for Bocaccio are difficult to anticipate.
As reported by DFO (2009), it has been recently observed that dissolved oxygen concentration is declining along the North Pacific coast. This decline appears to be correlated with apparent shifts in distribution of many groundfish species to shallower waters (Whitney et al. 2009). It was estimated that the groundfish community in the offshore waters of British Columbia has moved into shallower habitat, at a rate of 2-3 m per year over the past decade. The causal link is not proven yet; these observations are preliminary and their long-term significance on both the quality and quantity of available habitat for Bocaccio is unknown.
Biology
Most of the biological research on Bocaccio was conducted in California. There has been very little directed research on this species in BC waters. Stanley et al. (2012) consider that the available data are sufficient to estimate life-history parameters, such as size-at-age or age-at-maturity, but not sufficient to explore the influence of location, depth, or time on these estimates.
Growth
Juveniles can reach 24 cm by the end of their first year (MacCall et al. 1999). The maximum recorded length and weight in BC waters are 97 cm and 8.9 kg for females and 85 cm and 9.0 kg for males. Maximum recorded age in BC is 52 and 57 years for females and males, respectively (DFO 2009). Length at age functions are shown on Figure 5. Equation von Bertalanffy growth parameters are:
for females and
for males (Stanley et al. 2012).
Figure 5 shows that the age at which 50% of females are predicted to be mature is 7.1 years (Stanley et al. 2012). This is older than previously estimated (i.e., 4.0 years) by COSEWIC (2002). Most females in commercial catches are nearly fully grown (Figure 5).
Figure 5. Estimated length at age of male (-) and female (---) Bocaccio in BC waters, based on the von Bertalanffy growth model (based on growth parameters from Stanley et al. 2012).
Long description for Figure 5
Chart showing length at age functions for Bocaccio caught in British Columbia waters. Separate functions are given for male and female fish. Most females in commercial catches are nearly fully grown. Further details can be found in the preceding/next paragraph(s).
Generation Time
The 2002 Bocaccio assessment by COSEWIC used an instantaneous natural mortality (M) rate of 0.2 yr-1, as estimated by MacCall et al. (1999) in the US Bocaccio assessment. This value translated into a generation time (IUCN 2013) of 9 years, and a 3-generation window for assessing extinction risk of 27 years. Recently, M was revised downwards to 0.075 yr-1 for fish in BC waters (Stanley et al. 2009), based partly on an analysis incorporating the newly available age data. The US Boccacio assessment also revised M downwards, due to improvements in age determination methods and resulting increases in maximum observed ages. Assuming an age at 50% maturity (A) of 7.1 years and a natural mortality rate (M) of 0.075 yr-1, the generation time (G) is 20.4 years (using G = A + 1/ M) for Bocaccio in British Columbia. This estimate was rounded to 20 years in the last DFO assessment (Stanley et al. 2012). Thus, a 3-generation window for assessing extinction risk would be about 60 years.
Life Cycle and Reproduction
Bocaccio are viviparous, like all members of their genus. Copulation occurs in the early fall (Moser 1967) but there is delayed fertilization (Wyllie-Echeverria 1987). Fertilized eggs are retained in the body of the female where the larvae undergo much of their development prior to release. Fecundity ranges from 20,000 to 2,300,000 eggs and increases with size of the female (Phillips 1964). Embryonic development takes approximately one month (Moser 1967). Parturition occurs in the winter in BC waters (Westrheim 1975). More southerly populations appear to have a longer period of parturition and may also release multiple broods in a single year (Moser 1967). The combined larval and juvenile pelagic phase typically last about 150 days. Therefore, spatial dispersal of larvae and juveniles potentially links populations among fairly broad regions.
Extremely variable juvenile recruitment from year to year is common among rockfish species (Love et al. 2002 and references therein). In central/southern California, strong year classes occur on the scale of decades (Tolimieri and Levin 2005). Zabel et al. (2011) showed that this episodic recruitment is controlled by complicated interactions between climate, as expressed by monthly indices of the Northern Oscillation Index, and population density. Their results suggested that strong recruitment only occurs when climate acts favourably upon several life stages. The study also found evidence of a climate ‘carry over’ effect where the ultimate success of juvenile recruitment appeared to be influenced by climate conditions during the period before larvae were released, implying a maternal effect that is expressed in offspring.
Physiology and Adaptability
Like all species in the genus, Bocaccio have physoclistic swim bladders that cannot rapidly accommodate the sudden change in pressure that occurs when they are brought to the surface. The resulting barotrauma kills almost all fish when captured from waters deeper than 20-30 m (Starr et al. 2002). Little is known about their adaptability to other types of environmental change.
Dispersal and Migration
The barotrauma effects on Bocaccio render tagging studies difficult. Preliminary results from a tagging study off California showed that adult Bocaccio moved from less than 1 km to up to 50 km (Hanan and Curry 2012). An earlier study was conducted off California from 1977 to 1981 (Hartmann 1987). A total of 66 fish were recaptured out of 1,149 tagged juveniles and adults. Nineteen travelled 0.9 to 148 km. Seven of these, all juveniles, travelled from 13 to 148 km. The adults tagged during that study moved very little; all were recaptured at their tagging site after periods at liberty of up to 2.3 years.
In 1998, Starr et al. (2002) put acoustic tags onto 16 Bocaccio, ranging in size from 35 to 58 cm. Fish were captured at depths of 100-200 m and reeled up to a depth of approximately 20 m, where acoustic transmitters were surgically implanted in them. Eight of the 16 tags also transmitted information about depth. Tagged fish were released on the seafloor at the location of catch and monitored during 3.5 months. Fish frequently moved vertically 10-20 m and occasionally displayed vertical movements of 100 m or greater. Some individuals showed site fidelity by remaining within the study area or by leaving and returning, while others moved large distances during the 3.5-month monitoring period.
Overall, the available tagging studies indicate that Bocaccio are mobile during the first few years of life but are more sedentary with age.
Interspecific Interactions
Bocaccio cohabit with a wide variety of groundfish species including other rockfish. Bocaccio larvae are planktivores, feeding on larval euphausiids, diatoms, and dinoflagellates. Juveniles feed on larvae, euphausiids, and a variety of young fishes. Adults prey mostly on fish. The estimated trophic level of Bocaccio is 3.51 (SE 0.46), based on food items (FishBase Website).
Chinook Salmon (Oncorhynchus tshawytscha), terns, and Harbor Seals (Phoca vitulina) are known predators on smaller Bocaccio (Love et al. 2002 and references therein). Predators of larger adults are likely limited to larger piscivorous fishes and marine mammals (e.g., Harbour Seals and Northern Elephant Seals (Mirounga angustirostris)). Few studies have identified rockfish prey to the species level (Field et al. 2009).
Population Sizes and Trends
Since the last COSEWIC assessment in 2002, assessments have been performed by DFO on Bocaccio from BC waters in 2004, 2009 and 2012. Stanley and Starr (2004) concluded that it was not feasible to reliably estimate stock status, owing to uncertainty in the interpretation of the available abundance indices, along with their low precision. Time series of age-structured data were insufficient, as well as information on fish vulnerability at size or age in the fisheries. In 2009, DFO provided a more complete stock assessment of Bocaccio based on a Bayesian Schaefer surplus production model fitted to one fishery dependent and six fishery independent stock biomass trend indices, and a reconstructed catch history. That approach does not rely on age-structured data (Stanley et al. 2009). Long-term biomass projections were made over 5-, 20-, and 40-year scenarios, under different constant Total allowable catch (TAC) policies. The assessment was updated in 2012, adding four years of observations (2008-2011) and modelling the recreational catches for the first time in a Bocaccio assessment. A description and summary of the DFO 2012 stock assessment (Stanley et al. 2012) is presented in the following sections.
Sampling Effort and Methods
Various sources of catch data were used in the Bayesian Schaefer surplus production model. No distinction was made between directed and non-directed catches, because Bocaccio has been predominantly a bycatch species in all BC fisheries. No distinction was made either between landed catch and discarded catch, because Bocaccio die after capture due to the barotrauma. In other words, catch represented the total removals by fishing gear, summing both landed and discarded catch.
In brief, the Bayesian Schaefer surplus production model was fit to one fishery dependent (i.e., domestic commercial trawl) and eight fishery independent (i.e., scientific trawl and longline surveys) biomass indices, and a reconstructed catch history of seven fisheries beginning in 1935 when the population was assumed to be near to an unfished equilibrium. The methodology used to produce these indices and reconstructed catches is detailed in Stanley et al. (2009, 2012).
Commercial bottom trawl CPUE index
A commercial bottom trawl catch per unit effort (CPUE) index for 1996/1997 to 2003/2004 was included in the assessment model, treating it as an index of abundance. This index was based on commercial catch and effort data collected by fisheries observers deployed on bottom trawl vessels during 1996-2004. The CPUE data were standardized using Generalized Linear Modelling methods. The standardized and nominal indices indicate there was little change in CPUE from 1996/1997 to 2003/2004 (Figure 6, Appendix 1).
Figure 6. Comparison of the lognormal and binomial standardized CPUE indices for Bocaccio. The error bars show ± 95% confidence bounds. The decline observed after the 2003/2004 fishing year is thought to reflect change in fishers’ behaviour, and data after that year are therefore not included in the Bayesian Schaeffer surplus production model (source: Stanley et al. 2012).
Long description for Figure 6
Chart comparing lognormal and binomial standardized catch-per-unit-effort (CPUE) indices for Bocaccio. The standardized and nominal indices indicate there was little change in CPUE from 1996/1997 to 2003/2004. The decline observed after the 2003/2004 fishing year is thought to reflect change in fishers’ behaviour. Further details can be found in the preceding/next paragraph(s).
Data prior to 1996 were excluded because they were considered unreliable and not comparable. Data after the 2003/2004 fishing year were also excluded. This date corresponds to the implementation of the voluntary program that directed the proceeds of all Bocaccio catches for research and management (DFO 2013). As a consequence, fishers started to avoid Bocaccio. For this reason, catch rates after the 2003/2004 fishing year are not comparable with previous years and are considered to reflect changes in fishing behaviour.
Survey-based indices
Abundance indices (i.e., biomass) from the eight scientific surveys were derived from catch and effort data, using 1,000 (Canadian and IPHC surveys) or 5,000 (US triennial survey) bootstrap replicates with replacement to estimate 95% confidence intervals. Detailed methodology of the surveys and bootstrap procedures are available in Stanley et al. (2009 and 2012). Since the last COSEWIC assessment of Bocaccio in 2002, biomass estimates (excluding large outlier values) remained low and stable in the shrimp surveys and the IPHC setline survey (Figure 7, Appendix 2 to 5). Biomass estimates from the new groundfish bottom trawl surveys indicate that most of the fish were caught in Queen Charlotte Sound and west of Vancouver Island. These series show a declining trend (Figure 8, Appendix 6). Biomass estimates indicate that Bocaccio is not very abundant west of Haida Gwaii and in Hecate Strait.
Figure 7. Biomass estimates for Bocaccio from: a) West Coast Vancouver Island shrimp trawl, b) Queen Charlotte Sound shrimp trawl, c) US Triennial survey, and d) IPHC setline surveys. Bias corrected 95% confidence intervals from 1,000 bootstrap replicates (panels a, b, and d) or 5,000 bootstrap replicates (panel c) are plotted (source: Stanley et al. 2012).
Long description for Figure 7
Four chart panels giving relative biomass estimates for Bocaccio. Panel a gives estimates for the West Coast Vancouver Island shrimp trawl, Panel b for the Queen Charlotte Sound shrimp trawl, Panel c for the United States triennial survey, and Panel d for the IPHC (International Pacific Halibut Commission) setline surveys. Since 2002, biomass estimates (excluding large outlier values) have remained low and stable in the shrimp surveys and the IPHC setline surveys. Further details can be found in the preceding/next paragraph(s).
Figure 8. Biomass estimates for Bocaccio from: a) West Coast Haida Gwaii; b) Hecate Strait, c) Queen Charlotte Sound, and d) West Coast Vancouver Island Groundfish Synoptic trawl surveys for 2003 to 2011. Bias corrected 95% confidence intervals from 1000 bootstrap replicates are plotted (source: Stanley et al. 2012)
Long description for Figure 8
Four chart panels giving biomass estimates for Bocaccio. Panel a gives estimates from West Coast Haida Gwaii, Panel b from Hecate Strait, Panel c from Queen Charlotte Sound, and Panel d from West Coast Vancouver Island Groundfish Synoptic trawl surveys. Biomass estimates from the new groundfish bottom trawl surveys indicate that most of the fish were caught in Queen Charlotte Sound and west of Vancouver Island. These series show a declining trend. Further details can be found in the preceding/next paragraph(s).
Commercial and recreational catch reconstruction
Commercial and recreational catches were estimated from seven fisheries using four different fishing gears (Stanley et al. 2012). Trawl fisheries were divided into three sectors: US domestic, Canadian domestic, and foreign. Hook and line and trap fisheries were divided into three sectors: rockfish ZN (set-line, handline, and lingcod troll), halibut (set-line), and salmon troll. The recreational fishery catches were estimated and included for the first time in 2012. Historical catches for these seven fisheries were reconstructed back to 1935 when the population was assumed to be near to an unfished equilibrium (Figure 9, Appendix 7). Owing to the uncertainty in the catch reconstruction, the assessment conducted sensitivity tests wherein historical time-series of catches were modified. Conclusions regarding relative stock status were not affected in those sensitivity analyses.
Abundance
Based on the reference case of the Bayesian Schaefer surplus production model (Figure 10, Appendix 8), the median estimate exploitable biomass in 2012 (B2012) is 1,879 t (CI90% = 1,031; 3,625). The median estimate of stock size relative to its unfished stock size (B2012/K) is 3.5% (CI90% = 1.4; 9.1).
Figure 9. Reconstructed catch of Bocaccio for (a) the 1935-2012 time period, with (b) a close-up of the 2000-2012 time period, in the trawl (domestic US & Canadian and foreign) and rockfish ZN hook and line (HL) fisheries, the halibut fishery, the salmon troll fishery, and the recreational fishery. Catches in the trawl and rockfish ZN HL fisheries are fixed; catches in the three other fisheries are estimated. These reconstructed catches were input values in the reference case of the Schaefer surplus production model (see Appendix 7).
Long description for Figure 9
Two chart panels giving reconstructed catch of Bocaccio for the 1935-2012 time period (Panel a) and a close-up of the 2000-2012 time period (Panel b) in the trawl (domestic United States and Canadian and foreign) and rockfish ZN hook and line fisheries, the halibut fishery, the salmon troll fishery, and the recreational fishery. Further details can be found in the preceding/next paragraph(s).
Figure 10. Plots of median and 80% probability intervals of the estimated stock biomass with the nine biomass indices (i.e., one from commercial trawl and eight from the scientific surveys) rescaled by their median for different timescales; a. 1935-2012; b. 1975-2012; c. 2000-2012. Note that some of the very large values for some of the indices are not shown in panes b. and c. to permit closer inspection of more recent trends. Reconstructed catch history of the seven fisheries are also illustrated and scaled to the second y-axis (source: Stanley et al. 2012).
Long description for Figure 10
Three chart panels showing plots of median and 80-percent probability intervals of the estimated stock biomass with the nine biomass indices (one from commercial trawl and eight from the scientific surveys) rescaled by their median for different timescales. Panel a covers the period 1935-2012, Panel b covers 1975-2012, and Panel c covers 2000-2012. Reconstructed catch histories of the seven fisheries are also illustrated and scaled to the second y axis. The Bocaccio exploitable stock biomass has declined significantly from the 1930s, with the steepest decline occurring from 1985 to 1995. The rate of decline slowed after 1995 but the population continued to decline over the most recent decade. Further details can be found in the preceding/next paragraph(s).
The impacts of alternative model assumptions from those used in the reference case were explored extensively, in 18 additional sensitivity runs. The sensitivity runs showed that the conclusion of very low stock status was robust to a wide range of assumptions (Stanley et al. 2012).
Fluctuation and trends
The reference case of the Bayesian Schaefer surplus production model indicates that Bocaccio exploitable stock biomass has declined significantly from the 1930s, with the steepest decline occurring from 1985 to 1995 (Figure 10). The rate of decline slowed after 1995 but the population continued to decline over the most recent decade. Population biomass declined by 92% over the last 60 years (3 generations), by 88% over the past 40 years (2 generations), and by 28% since the last COSEWIC assessment in 2002. Stanley et al. (2012) emphasized that, while there is considerable uncertainty in estimating recent trends, there is no sign that the population has started to increase.
Relatively poor recruitment may explain, in part, why the population has not responded to the recent reduction in catches (Stanley et al. 2012). Negative annual deviates in surplus production were observed in 2006-2009. Although they were not significantly different from 0, these negative deviates suggest that there was poor recruitment into exploitable age classes in these years.
Any recovery of this population will likely take a long time. Stanley et al. (2012) carried out long-term biomass projections using the reference production model. The results suggest that the probability of observing a biomass increase over three generations is close to 50% if the current catch rate of 137 t yr-1 is maintained. Under the same scenario, there was a 50% probability that the population would recover to where it would no longer meet the endangered criterion under A2b in 40 years. If all catch is stopped, it would take 20 years for the population to not meet the A2b criterion for endangered.
As Stanley et al. (2012) emphasized, these projections are based on strong assumptions, including (i) stationarity in model parameters, (ii) that the assumed catch rate is maintained, and (iii) that total stock biomass (without reference to the population age or size structure) determines annual surplus production in the following year with no lag. However, these are the same assumptions under which the model reconstruction was made. Therefore, Stanley et al. (2012) recommend considering these long-term projections as guidelines to distinguish between model hypotheses, rather than as true predictions of stock size.
Rescue Effect
No rescue effect is anticipated for Bocaccio in BC waters, considering that:
- catch statistics and biological characteristics suggest that BC waters are the centre of a northern demographic population cluster separated by an area of low abundance from a main southern population cluster centred off central/southern California;
- the anticipated increase in abundance in central/southern California is unlikely to translate into a significant immigration of adult individuals in BC waters, because of their limited dispersal behaviour;
- larval and/or juvenile dispersion, though having a genetic homogenizing effect, is unlikely to translate into a demographic effect;
- the current status of Bocaccio in US neighbouring waters of Alaska, Washington/Oregon, and Puget Sound/US Georgia Basin indicate biomass levels lower than observed in BC.
Threats and Limiting Factors
Available data suggest that there is limited exploitation on juveniles (Figure 11). Indeed, virtually no sub-market-sized juveniles are captured in the commercial or research trawl catches, even though they are large enough to be retained by the nets. This probably indicates that the younger stages inhabit shallower or non-trawlable habitats.
Figure 11. Proportion of mature females by age (red line) and age frequency histograms for the females in the commercial catches (source: Stanley et al. 2012).
Long description for Figure 11
Chart giving proportion of mature females by age and age frequency histograms for the females in the commercial catches. Available data suggest that there is limited exploitation on juveniles. Further details can be found in the preceding/next paragraph(s).
Incidental catches of adult Bocaccio in the commercial groundfish fisheries are the major current source of human-induced mortality. Longevity, viviparity and a sedentary adult distribution make Bocaccio particularly susceptible to overfishing. Bocaccio scored in the top ten (among 69 Sebastes species measured) in intrinsic vulnerability (Magnuson-Ford et al. 2009). This index combines nine morphological, life history, and range size characteristics and it represents the species’ inability to recover from overfishing.
Small numbers of Bocaccio are caught in First Nations’ fisheries (<2 t; Stanley et al. 2009). Given the reduced catches in the trawl fishery and the low estimates of current biomass, the relative importance of this fishery is increasing. Similar arguments led to the inclusion of the recreational fisheries in the last Bocaccio assessment (Stanley et al. 2012). Improved catch monitoring will be established to better estimate levels of mortality in First Nations’ fisheries (Daily Journal of Commerce (DJC) 2011).
As reported in DFO (2009), declines in dissolved oxygen, which appear to be correlated with apparent shifts in distribution of many groundfish species to shallower depths, may be a source of concern (Whitney et al. 2009). This observation could reduce both the quality and the quantity of available habitat for Bocaccio. These observations are preliminary.
DFO (2009) reported that long-term effects of fishing gear (trawl and setline) might have had an impact on Bocaccio through disturbance to biogenic habitat (i.e., coral and sponges). There is little information on the importance of biogenic habitat specifically for Bocaccio in BC waters, but a recent study suggested that rockfish (including a limited number of data on Bocaccio) select sponges and corals over the inert substrata alone and that abundance is reduced in areas with past trawling activities (Du Preez and Tunnicliffe 2011).
Non-fishing coastal development activities in BC (e.g., aquaculture and increased marine transport of petroleum products) could have negative impacts on Bocaccio through habitat perturbation (DFO 2009). For example, it is likely that large oil spills would represent a major threat, possibly through the impact on the near surface larval and shallower pelagic juvenile habitat.
Protection, status, and ranks
Legal Protection and Status
Bocaccio was assessed as Threatened by COSEWIC in November 2002. Following extensive review, the Government in Council decided in 2011 not to add Bocaccio to the list of wildlife species at risk (Schedule 1) under the Species at Risk Act (DJC 2011). It was determined that the costs of protection under the Species at Risk Act would likely outweigh the benefits to Canadians, although the intrinsic benefit of the species was not determined. Presently, DFO continues to manage this species under the Fisheries Act.
Bocaccio is managed under the 2013 Integrated Fishery Management Plan for Groundfish (DFO 2013). There is no directed fishery for Bocaccio; it is caught by fisheries targeting other species. There is a 100% monitoring of all catch (for detailed information see section on Search Effort). Based on the stock assessment by Stanley et al. (2012), DFO has set out a plan for stepped reductions of total Bocaccio catches to 75 t yr-1 over 3 years (2013-14 to 2015-16). Pilot management measures have been adopted for the 2013/2014 fishing season; they will be reviewed and, if necessary, amended at the end of each fishing season. The management measures are summarized in the following paragraphs.
In the commercial fishery, 93% of Bocaccio is allocated to the trawl sector and the remaining 7% to the hook-and-line and trap fisheries (HL) sector. In the trawl sector, the pilot management measures include (i) establishing a coastwide annual trawl mortality cap of 150 tonnes, (ii) establishing individual vessel licence allocations, (iii) establishing holdings caps, and (iv) applying all rules governing the Trawl Individual Vessel Quota (IVQ) program for Bocaccio rockfish. In the commercial HL fisheries, Bocaccio is managed as part of an aggregate of “other rockfish”. With the new pilot management measures, the HL fisheries are now subject to a specified trip limit for Bocaccio (varying between 200-400 lbs, depending on the landings of quota applicable rockfish).
Additionally, the trawl industry has reconfirmed its continuation of the 2004 voluntary program whereby groundfish trawl vessel masters donate all proceeds of landed Bocaccio rockfish for use in groundfish research programs. As the groundfish trawl fishery accounts for the majority of Bocaccio catch, the voluntary program has resulted in an approximate halving of total Bocaccio landings after 2004 relative to the level of landings prior to that year (Figure 9). The pilot management measures comprise a similar voluntary relinquishment program supported by the groundfish hook-and-line fleets.
A small trawl fishery (called Option B; < 15 vessels) is permitted in the inside waters of Areas 12 - 20 and 29 (i.e., Johnstone Strait, Juan de Fuca Strait, and Strait of Georgia, excluding Howe Sound). The closed areas and times fixed by regulations have been varied to allow fishing by bottom trawl gear. However, this fishery is not permitted to fish for or retain rockfish (including Bocaccio).
Recreational catches are constrained by a “rockfish” daily bag limit of 0 to 5, depending on the area (Finfish Species and Limits Table (Other than salmon)).
On April 28, 2010, the National Marine Fisheries Service (NMFS) published a final determination to list the Puget Sound/Georgia Basin Distinct Population Segments (DPS) of Bocaccio rockfish (Sebastes paucispinis) as endangered under the US Endangered Species Act. The southern population (from latitude 40°10’ N in California to northern Mexico) is a Species of Concern (NMFS 2004).
Non-Legal Status and Ranks
The IUCN Red List of threatened species lists Bocaccio as critically endangered (Sobel 1996). The Global NatureServe StatusFootnote3 for Bocaccio is G4 - apparently secure (July 02, 2003); National status for the US is N4 - apparently secure (December 30, 2002). These ranks were determined before the NMFS (2010) determination for the Puget Sound/Georgia basin DPS in 2010 and the southern population DPS in 2004 (NMFS 2004). National statusFootnote3 for Canada is N2 - imperilled (June 03, 2003). Rank 2 corresponds to situations where the species occurrence is rare due to very restricted range, very few populations, steep declines, or other factors making it very vulnerable to extirpation. Rank 4 is given when the species occurrence is uncommon but not rare, with some cause for long-term concern due to declines or other factors. The Canadian General Status rank of Bocaccio is at risk (2005, CESCC 2006).
Habitat Protection and Ownership
In 2012, environmentalists and bottom trawl industry announced measures to limit the effect of trawl nets on sensitive corals, sponges, and deep-sea habitats on the BC coast. The measures have been implemented through DFO’s groundfish integrated management plan (DFO 2013). One of the objectives was to ensure that the BC groundfish bottom trawl fishery is restricted to areas previously trawled between 1996 and 2011. Following this objective, a wide area of BC waters has been closed year-round to bottom trawl fishing since April 2012 (Figure 12; DFO 2013). With this measure, access to previously trawled areas is reduced by 20.6%, access to continental slope habitat (200 to 800 m) is reduced by 18%, and access to deepwater habitat (800 to 1,400 m) is reduced by 65%. Only a fraction of the maximum potential habitat area for Bocaccio (mostly in Queen Charlotte Sound) occurs in the protected area (Figure 12); the benefits for Bocaccio are difficult to anticipate. Habitat quotas (i.e., a limit of 4500 kg/y of corals and sponges for the trawl fleet) and the establishment of an encounter protocol (for trawl tows where combined coral and sponge catch exceeds 20 kg), also introduced in April 2012, are expected to reduce the interaction of bottom trawls with coral and sponge habitats remaining within the allowable trawling areas (DFO 2013).
Figure 12. Map showing the areas closed to bottom trawl fishing (since April 2, 2012), consistent with the new habitat conservation measures for corals and sponges (source: DFO 2013). Inset map shows the maximum potential habitat area for adult Bocaccio (see Figure 4).
Long description for Figure 12
Map showing the areas closed to bottom trawl fishing since April 2, 2012, consistent with new habitat conservation measures for corals and sponges. An inset map shows the maximum potential habitat area for adult Bocaccio. Further details can be found in the preceding/next paragraph(s).
Since 2002, Rockfish Conservation Areas (RCAs) have been established in nearshore areas throughout the BC coast. Considering the traditional widespread distribution of Bocaccio over the continental shelf and the rarity of observations in nearshore waters, it is unlikely that Bocaccio benefits from this protection, unless coastal waters are demonstrated to play a significant role for early life stages.
Acknowledgements and Authorities Contacted
The report writer is very grateful to Rick Stanley (Fisheries and Oceans Canada) for his much appreciated assistance in the writing of this report. Alan Sinclair provided helpful comments and guidelines. The following reviewers provided knowledgeable input to the report: Carrie Holt, Scott Wallace, Paul Starr, Christie Whelan, Jonathan Thar, and Neil Davis (from DFO), Marie-France Noel (from the Canadian Wildlife Service), Greg Wilson (from the BC Ministry of Environment), and John Reynolds. Environment Canada provided funding and support.
Vincent Buonaccorsi, Associate Professor of Biology, Juniata College, Huntingdon, PA, USA.
John Field, Groundfish Analysis Team Leader, Southwest Fisheries Science Center, NOAA Fisheries Service, Santa Cruz, CA, USA.
Alain Filion, Scientific and GIS Project Officer, COSEWIC Secretariat, Canadian Wildlife Service, Environment Canada, Gatineau, QC.
Monique Goit, Scientific Project Officer, COSEWIC Secretariat, Canadian Wildlife Service, Environment Canada, Gatineau, QC.
Neil Jones, Scientific Project Officer & ATK Coordinator, COSEWIC Secretariat, Canadian Wildlife Service, Environment Canada, Gatineau, QC.
Tameezan Karim, Groundfish Regional Manager, Fisheries and Oceans Canada, Vancouver, BC.
Jim Lane, regional fisheries biologist, Nuu-chah-nulth Tribal Council, Port Alberni, BC.
Murdoch MacAllister, Associate Professor & Canada Research Chair in Fisheries Assessment and Statistics, University of British Columbia Fisheries Centre, Vancouver, BC.
Norm Olsen, Programmer/Analyst, Pacific Biological Station, Fisheries and Oceans Canada, Nanaimo, BC.
Julie Perrault, COSEWIC Secretariat, Canadian Wildlife Service, Environment Canada, Gatineau, QC.
Jason Pitre, Scientific Project Officer, COSEWIC Secretariat, Canadian Wildlife Service, Environment Canada, Gatineau, QC.
Kate Rutherford, Groundfish Statistics Coordinator, Pacific Biological Station, Fisheries and Oceans Canada, Nanaimo, BC.
Shirley Sheppard, COSEWIC Secretariat, Canadian Wildlife Service, Environment Canada, Gatineau, QC.
Alan Sinclair, Co-Chair, COSEWIC Marine Fishes Species Specialist Subcommittee, Parksville, BC.
Rick Stanley, Biologist, Pacific Biological Station, Fisheries and Oceans Canada, Nanaimo, BC.
Information Sources
Baillon, S., J.-F. Hamel, V.E. Wareham, and A. Mercier. 2012. Deep cold-water corals as nurseries for fish larvae. Frontiers in Ecology and the Environment (e-View).
Ban, N. and J. Alder. 2008. How wild is the ocean? Assessing the intensity of anthropogenic marine activities in British Columbia, Canada. Aquatic Conservation: Marine and Freshwater Ecosystems 18: 55-85.
Berntson, E. A. and P. Moran. 2009. The utility and limitations of genetic data for stock identification and management of North Pacific rockfish (Sebastes spp.). Reviews in Fish Biology and Fisheries 19: 233-247.
Bryan, M.G., C. Fu, and G.D. Workman. 2010. Assemblages and distributions of groundfish species off the West Coast of Vancouver Island. The Open Marine Biology Journal 4: 101-114.
Buonaccorsi, V.P., C.A. Kimbrell, E.A. Lynn, and J.R. Hyde. 2012. Comparative population genetic analysis of Bocaccio rockfish Sebastes paucispinis using anonymous and gene-associated simple sequence repeat loci. Journal of Heredity 103:391-399.
Canadian Endangered Species Conservation Council (CESCC). 2006. Wild Species 2005: The General Status of Species in Canada.
COSEWIC 2002. COSEWIC assessment and status report on the Bocaccio Sebastes paucispinis in Canada. Committee on the Status of Endangered Wildlife in Canada. Ottawa. vii + 43 pp.
Davenne, E. and D. Masson. 2001. Water Properties in the Straits of Georgia and Juan de Fuca. Institute of Ocean Sciences, Sidney, BC, Canada Website (PDF; 4.9MB) [accessed November 2011].
DFO. 2009. Recovery Potential Assessment of Bocaccio in British Columbia waters. DFO Canadian Science Advisory Secretariat Science Advisory Report 2009/040.
DFO. 2010. Pacific Region Cold-water Coral and Sponge Conservation Strategy. 2010-2015 Website (PDF; 2.8MB) [accessed February 2013].
DFO. 2013. Pacific region integrated fisheries management plan for Groundfish, effective February 21, 2013 Website (PDF; 4.7MB) [accessed February 2013].
DJC. 2011. Order giving notice of decisions not to add certain species to the list of endangered species, Species at risk Act, SI/2011-56. Justice Canada. Website (PDF; 198 KB) [accessed October 2011].
Drake J.S., E.A. Berntson, J.M. Cope, R.G. Gustafson, E.E. Holmes, P.S. Levin, N. Tolimieri, R.S. Waples, S.M. Sogard, and G.D. Williams. 2010. Status review of five rockfish species in Puget Sound, Washington: Bocaccio (Sebastes paucispinis), canary rockfish (S. pinniger), yelloweye rockfish (S. ruberrimus), greenstriped rockfish (S. elongatus), and redstripe rockfish (S. proriger). US Department of Commerce, NOAA Technical Memorandum NMFS-NWFSC-108, 234 pp.
Du Preez, C. and V. Tunnicliffe. 2011. Shortspine thornyhead and rockfish (Scorpaenidae) distribution in response to substratum, biogenic structures and trawling. Marine Ecological Progress Series 425: 217-231.
Eschmeyer, W.N., E.S. Herald, and H. Hammann. 1983. A field guide to Pacific Coast Fishes of North America. Houghton Mifflin, Boston. 336 pp.
Field, J.C., E.J. Dick, D. Pearson, and A.D. MacCall. 2009. Status of Bocaccio, Sebastes paucispinis, in the Conception, Monterey and Eureka INPFC areas for 2009. In Status of the Pacific coast groundfish fishery through 2009, stock assessment and fishery evaluation: Stock assessments, STAR Panel reports, and rebuilding analyses. Pacific Fishery Management Council, Portland, Oregon. 255 pp.
Finney, J.L. 2010. Overlap of predicted cold-water coral habitat and bottom-contact fisheries in British Columbia. DFO Can. Sci. Advis. Sec. Res. Doc. 2010/067. vi + 26 p.
Gillespie, G.E., R.D. Stanley, and B.M. Leaman. 1993. Cruise details and biological information from the juvenile rockfish surveys aboard the RV. W.E. Ricker, May 13 25, 1991, and the F/V Island Sun, June 3-11, 1991. Canadian Data Report of Fisheries and Aquatic Sciences 920.
Hanan, D.A and B.E. Curry. 2012. Long-term movement patterns and habitat use of nearshore groundfish: tag-recapture in Central and Southern California waters. The Open Fish Science Journal 5: 30-43.
Hartmann, A.R. 1987. Movement of scorpionfishes (Scorpaenidae: Sebastes and Scorpaena) in the southern California Bight. California Fish and Game Bulletin 73: 68-79.
Hyde, J. R. and R. D. Vetter. 2007. The origin, evolution, and diversification of rockfishes of the genus Sebastes (Cuvier). Molecular Phylogenetics and Evolution 44: 790-811.
IUCN Standards and Petitions Subcommittee. 2013. Guidelines for Using the IUCN Red List Categories and Criteria. Version 10. Prepared by the Standards and Petitions Subcommittee. Website (PDF; 1.27MB) [accessed July 2013].
Love, M.S., M. Yoklavich and L. Thorsteinson. 2002. Rockfishes of the northeast Pacific. University of California Press, Berkeley, California, 404 pp.
MacCall, A.D., S. Ralston, D. Pearson, and E. Williams. 1999. Status of Bocaccio off California in 1999 and outlook for the next millennium. In Appendix to Status of the Pacific Coast Groundfish fishery through 1999 and recommended acceptable biological catches for 2000. Pacific Fisheries Management Council. Oregon, U.S.A. Website (PDF; 3.43MB) [accessed August 2011].
Magnuson-Ford K., T. Ingram, D.W. Redding, and A.O. Mooers. 2009. Rockfish (Sebastes) that are evolutionarily isolated are also large, morphologically distinctive and vulnerable to overfishing. Biological Conservation 142: 1787-1796.
Matala, A.P., A.K. Gray, A.J. Gharrett, and M.S. Love. 2004. Microsatellite variation indicates population genetic structure of Bocaccio. North American Journal of Fisheries Management 24:1189-1202.
Moser, H.G. 1967. Reproduction and development of Sebastodes paucispinis and comparison with other rockfishes off southern California. Copeia 1967: 773-797.
Moser, H.G. 1996. Scorpaenidae: scorpionfishes and rockfishes. Pp. 733-795. in H.G. Moser (ed.). The early stages of fishes in the California Current region. California Cooperative Oceanic Fisheries Investigations (CalCOFI) Atlas No. 33.
Moser, H. G., E. H. Ahlstrom, and E. M. Sandknop. 1977. Guide to the identification of scorpionfish larvae (family Scorpaenidae) in the eastern Pacific with comparative notes on species of Sebastes and Helicolenus from other oceans. US Department of Commerce. NOAA Technical Report NMFS Circ. 402, 71 pp.
National Marine Fisheries Service (NMFS). 2004. Endangered and threatened species; Establishment of species of concern list, Addition of species to species of concern list, Description of factors for identifying species of concern, and Revision of candidate species list under the Endangered Species Act. Federal Register 73(69): 19975-19979.
National Marine Fisheries Service (NMFS). 2009. Endangered and threatened wildlife and plants: Proposed Endangered, Threatened, and Not Warranted Status for Distinct Population Segments of Rockfish in Puget Sound. Federal Register 74(77): 18516-18542.
National Marine Fisheries Service (NMFS). 2010. Endangered and threatened wildlife and plants: threatened status for the Puget Sound/Georgia Basin Distinct Population Segments of yelloweye and canary rockfish and endangered status for the Puget Sound/Georgia Basin Distinct Population Segment of boccaccio rockfish. Federal Register 75(81): 22276-22290.
Palsson, W.A., T.-S. Tsou, G.G. Bargmann, R.M. Buckley, J.E. West, M.L. Mills, Y. W. Cheng, and R.E. Pacunski. 2009. The Biology and Assessment of Rockfishes in Puget Sound. Fish Management Division, Fish Program, Washington Department of Fish and Wildlife.
Phillips, J.B. 1964. Life history studies on ten species of rockfish (Genus Sebastodes). Fish Bulletin No. 126. California, Department of Fish and Game. 70 pp.
Pritchard, J. K., M. Stephens, and P. Donnelly. 2000. Inference of population structure using multilocus genotype data. Genetics 155:945-959.
Rutherford, K.L. 1999. A brief history of GFCATCH (1954-1995), the groundfish catch and effort database at the Pacific Biological Station. Canadian Technical Report of Fisheries and Aquatic Sciences 2299: 66 pp.
Sinclair, A.F., K.W. Conway, and W.R. Crawford. 2005. Associations between bathymetric, geologic and oceanographic features and the distribution of the British Columbia bottom trawl fishery. International Council for the Exploration of the Sea (ICES) CM 2005/L:25. 31 pp.
Sivasundar, A. and S.R. Palumbi. 2010. Life history, ecology and the biogeography of strong genetic breaks among 15 species of Pacific rockfish, Sebastes. Marine Biology 157: 1433-1452.
Sobel, J. 1996. Sebastes paucispinis. In: IUCN 2013. IUCN Red List of Threatened Species. Version 2013.1. IUCN Red List [accessed July 2013].
Stanley, R.D. and P. Starr. 2004. Scientific advice for input to the allowable harm assessment for Bocaccio. DFO Canadian Science Advisory Secretariat Research Document 2004/098.
Stanley, R.D., M. McAllister, P. Starr, and N. Olsen. 2009. Stock assessment for Bocaccio (Sebastes paucispinis) in British Columbia waters. DFO Canadian Science Advisory Secretariat Research Document 2009/055. xiv + 200 pp.
Stanley, R.D., M. McAllister, and P. Starr. 2012. Updated stock assessment for Bocaccio (Sebastes paucispinis) in British Columbia waters for 2012. Canadian Science Advisory Secretariat Research Document 2012/042.
Starr, R.M., J.N. Heine, K.A. Johnson, J.M. Felton, and G.M. Cailliet. 2002. Movements of bocaccio (Sebastes paucispinis) and greenspotted (Sebastes chlorostictus) rockfishes in Monterey submarine canyon: Implications for the design of marine reserves. Fishery Bulletin 100:324-337.
Tagart, J.V. and D. Kimura. 1982. Review of Washington’s coastal trawl rockfish fishery. Washington Department of Fisheries Technical Report No. 68: 66 pp.
Tolimieri, N. and P.S. Levin. 2005. The roles of fishing and climate in the population dynamics of bocaccio rockfish. Ecological Applications 15:458-468.
Waples, R.S., A.E. Punt, and J.M. Cope. 2008. Integrating genetic data into management of marine resources: how can we do it better? Fish and Fisheries 9: 423-449.
Westrheim, S.J. 1975. Reproduction, maturation, and identification of larvae of some Sebastes (Scorpaenidae) species in the Northeast Pacific Ocean. Journal of the Fisheries Research Board of Canada 32: 2399-2411.
Whitney, F., D. Gilbert, and A. Sinclair. 2009. Impacts of spreading hypoxia on coastal biota of the subarctic Pacific. Goldschmidt Conference Abstracts A1435.
Wyllie-Echeverria, T. 1987. Thirty-four species of California Rockfishes: maturity and seasonality of reproduction. Fishery Bulletin 85: 229-250.
Zabel, R.W., P.S. Levin, N. Tolimieri, and N. Mantua. 2011. Interactions between climate and population density in the episodic recruitment of Bocaccio, Sebastes paucispinis, a Pacific rockfish. Fisheries Oceanography 20: 294-304.
Biographical Summary of Report Writer(s)
Since 2010, Dr. Alexandra E. Valentin has worked at Fisheries and Oceans Canada (DFO) in Mont-Joli (Qc), under temporary employment contracts as a research scientist or biologist. She received a Bachelor’s degree in biology at the University of Geneva in 1996. Her Master’s (1999) and Doctorate (2006) are in Oceanography, from the Quebec University in Rimouski (UQAR), Canada. From 2006 to 2010, she held two consecutive postdoctoral positions at DFO in Mont-Joli. Dr. Valentin has developed a strong expertise on Atlantic redfish species (Sebastes spp.), more specifically on issues related to species and population identification in the context of fishery management. Her work is based on a multidisciplinary approach, using several stock identification tools such as genetics and geometric morphometrics. Her present work deals with redfish (Sebastes spp.) species identification and stock structure based on genetic analysis of archived otoliths.
Collections Examined
No collections were examined for this report.
| Fishing year |
Arithmetic CPUE |
Standardized CPUE |
Lower bound |
Upper bound |
Standard error |
|---|---|---|---|---|---|
| 96/97 | 29.8 | 28.9 | 27.1 | 30.8 | 0.032 |
| 97/98 | 29.4 | 31.5 | 30.0 | 33.1 | 0.025 |
| 98/99 | 27.4 | 27.9 | 26.6 | 29.3 | 0.025 |
| 99/00 | 25.2 | 27.4 | 26.2 | 28.7 | 0.024 |
| 00/01 | 32.1 | 28.1 | 26.9 | 29.3 | 0.022 |
| 01/02 | 33.5 | 32.3 | 30.9 | 33.8 | 0.022 |
| 02/03 | 29.4 | 29.9 | 28.6 | 31.2 | 0.022 |
| 03/04 | 27.1 | 27.9 | 26.7 | 29.2 | 0.023 |
| 04/05 | 26.0 | 21.9 | 20.9 | 23.0 | 0.025 |
| 05/06 | 18.9 | 20.5 | 19.5 | 21.5 | 0.024 |
| 06/07 | 18.2 | 19.5 | 18.4 | 20.6 | 0.028 |
| Survey year |
Biomass (t) |
Mean Bootstrap biomass (t) |
Lower Bound biomass (t) |
Upper Bound biomass (t) |
Bootstrap CV |
Analytic CV |
|---|---|---|---|---|---|---|
| 1975 | 106.1 | 107.0 | 48.7 | 190.9 | 0.340 | 0.350 |
| 1976 | 42.3 | 42.3 | 11.5 | 99.4 | 0.508 | 0.521 |
| 1977 | 84.7 | 84.6 | 28.4 | 177.1 | 0.449 | 0.467 |
| 1978 | 362.1 | 357.3 | 8.5 | 1,000.2 | 0.715 | 0.713 |
| 1979 | 25.6 | 25.6 | 5.1 | 52.9 | 0.456 | 0.494 |
| 1980 | 21.2 | 20.8 | 0.0 | 58.2 | 0.735 | 0.768 |
| 1981 | 28.6 | 28.6 | 0.7 | 89.5 | 0.752 | 0.781 |
| 1982 | 577.0 | 581.6 | 54.0 | 1,741.1 | 0.821 | 0.823 |
| 1983 | 339.6 | 352.4 | 7.3 | 1,293.4 | 0.920 | 0.926 |
| 1985 | 366.9 | 368.2 | 168.6 | 606.0 | 0.301 | 0.302 |
| 1987 | 73.7 | 73.5 | 26.6 | 138.9 | 0.379 | 0.380 |
| 1988 | 117.9 | 115.0 | 25.7 | 275.7 | 0.537 | 0.525 |
| 1989 | 33.6 | 33.3 | 7.0 | 89.8 | 0.558 | 0.531 |
| 1990 | 162.6 | 163.5 | 30.0 | 421.3 | 0.612 | 0.591 |
| 1991 | 115.3 | 115.3 | 5.4 | 395.0 | 0.826 | 0.903 |
| 1992 | 387.0 | 379.6 | 111.6 | 854.0 | 0.449 | 0.426 |
| 1993 | 10.0 | 10.1 | 0.0 | 40.9 | 1.001 | 1.000 |
| 1994 | 139.6 | 138.5 | 0.0 | 535.3 | 0.958 | 0.945 |
| 1995 | 15.4 | 15.1 | 0.0 | 59.2 | 0.991 | 1.000 |
| 1996 | 50.5 | 50.2 | 0.0 | 174.2 | 0.870 | 0.902 |
| 1997 | 110.9 | 111.0 | 21.4 | 267.0 | 0.575 | 0.576 |
| 1998 | 214.3 | 212.2 | 0.0 | 729.4 | 0.909 | 0.940 |
| 1999 | 2.0 | 2.0 | 0.0 | 7.0 | 0.951 | 1.000 |
| 2000 | 0.0 | 0.0 | - | - | - | 0.000 |
| 2001 | 70.2 | 69.5 | 19.4 | 156.3 | 0.468 | 0.460 |
| 2002 | 30.6 | 30.7 | 1.0 | 93.5 | 0.758 | 0.765 |
| 2003 | 32.1 | 32.3 | 0.0 | 72.5 | 0.530 | 0.552 |
| 2004 | 30.2 | 29.7 | 0.0 | 88.9 | 0.731 | 0.726 |
| 2005 | 583.2 | 570.8 | 0.0 | 2,050.1 | 0.976 | 0.971 |
| 2006 | 6.4 | 6.5 | 0.0 | 26.8 | 0.977 | 1.000 |
| 2007 | 11.6 | 11.3 | 0.3 | 37.5 | 0.732 | 0.693 |
| 2008 | 16.1 | 16.0 | 0.0 | 36.6 | 0.569 | 0.586 |
| 2009 | 91.1 | 92.5 | 19.7 | 181.4 | 0.452 | 0.461 |
| 2010 | 47.3 | 46.6 | 8.4 | 112.1 | 0.561 | 0.563 |
| 2011 | 0.0 | 0.0 | - | - | - | 0.000 |
| Survey year |
Biomass (t) |
Mean bootstrap biomass (t) |
Lower bound biomass (t) |
Upper bound biomass (t) |
Bootstrap CV |
Analytic CV |
|---|---|---|---|---|---|---|
| 1999 | 18.8 | 19.0 | 5.3 | 38.4 | 0.432 | 0.445 |
| 2000 | 9.2 | 9.3 | 0.0 | 29.1 | 0.796 | 0.761 |
| 2001 | 19.4 | 19.5 | 5.7 | 39.7 | 0.432 | 0.420 |
| 2002 | 2.5 | 2.6 | 0.0 | 10.3 | 0.980 | 1.000 |
| 2003 | 7.2 | 7.5 | 0.0 | 17.0 | 0.557 | 0.571 |
| 2004 | 17.7 | 17.5 | 0.0 | 51.8 | 0.840 | 0.865 |
| 2005 | 4.7 | 4.4 | 0.0 | 19.1 | 1.014 | 1.000 |
| 2006 | 7.1 | 7.0 | 1.6 | 16.2 | 0.522 | 0.532 |
| 2007 | 0.0 | 0.0 | - | - | - | 0.000 |
| 2008 | 0.0 | 0.0 | - | - | - | 0.000 |
| 2009 | 10.9 | 10.8 | 3.6 | 21.1 | 0.417 | 0.413 |
| 2010 | 0.0 | 0.0 | - | - | - | 0.000 |
| 2011 | 462.6 | 467.8 | 0.0 | 1,946.0 | 0.988 | 1.000 |
| Survey year |
Biomass (t) |
Mean bootstrap biomass (t) |
Lower bound biomass (t) |
Upper bound biomass (t) |
Bootstrap CV |
Analytic CV |
|---|---|---|---|---|---|---|
| 1980 | 8,103 | 8,261 | 296 | 30,812 | 0.923 | 0.937 |
| 1983 | 4,731 | 4,611 | 681 | 14,566 | 0.697 | 0.688 |
| 1989 | 1,279 | 1,302 | 338 | 2,657 | 0.454 | 0.456 |
| 1992 | 792 | 797 | 135 | 2,149 | 0.633 | 0.654 |
| 1995 | 65 | 64 | 16 | 135 | 0.448 | 0.467 |
| 1998 | 141 | 140 | 49 | 279 | 0.409 | 0.408 |
| 2001 | 120 | 123 | 0 | 365 | 0.768 | 0.798 |
| Survey year |
Mean bootstrap CPUE |
Lower bound CPUE |
Upper bound CPUE |
|---|---|---|---|
| 2003 | 0.013 | 0.006 | 0.024 |
| 2004 | 0.023 | 0.009 | 0.038 |
| 2005 | 0.013 | 0.005 | 0.024 |
| 2006 | 0.036 | 0.010 | 0.079 |
| 2007 | 0.018 | 0.008 | 0.028 |
| 2008 | 0.038 | 0.019 | 0.062 |
| 2009 | 0.020 | 0.009 | 0.034 |
| 2010 | 0.011 | 0.004 | 0.021 |
| 2011 | 0.022 | 0.008 | 0.039 |
| Survey year |
Biomass (t) |
Mean bootstrap biomass (t) |
Lower bound biomass (t) |
Upper bound biomass (t) |
Bootstrap CV |
Analytic CV |
|---|---|---|---|---|---|---|
| 2006 | 9.9 | 10.0 | 4.3 | 17.1 | 0.329 | 0.345 |
| 2007 | 9.6 | 9.6 | 4.3 | 16.9 | 0.328 | 0.329 |
| 2008 | 12.0 | 12.0 | 6.0 | 20.4 | 0.309 | 0.301 |
| 2010 | 8.0 | 8.2 | 3.4 | 14.5 | 0.352 | 0.359 |
| Survey year |
Biomass (t) |
Mean bootstrap biomass (t) |
Lower bound biomass (t) |
Upper bound biomass (t) |
Bootstrap CV |
Analytic CV |
|---|---|---|---|---|---|---|
| 2005 | 19.5 | 19.4 | 8.3 | 36.4 | 0.376 | 0.369 |
| 2007 | 48.6 | 48.7 | 15.6 | 95.7 | 0.403 | 0.389 |
| 2009 | 16.8 | 16.7 | 5.5 | 35.7 | 0.450 | 0.445 |
| 2011 | 55.1 | 55.3 | 6.8 | 152.1 | 0.633 | 0.621 |
| Survey year |
Biomass (t) |
Mean bootstrap biomass (t) |
Lower bound biomass (t) |
Upper bound biomass (t) |
Bootstrap CV |
Analytic CV |
|---|---|---|---|---|---|---|
| 2003 | 110.1 | 109.5 | 26.4 | 271.0 | 0.591 | 0.606 |
| 2004 | 308.9 | 303.6 | 46.5 | 912.2 | 0.788 | 0.776 |
| 2005 | 295.0 | 302.9 | 57.8 | 849.7 | 0.692 | 0.704 |
| 2007 | 127.8 | 126.3 | 28.7 | 351.1 | 0.640 | 0.647 |
| 2009 | 88.5 | 92.9 | 20.1 | 218.0 | 0.585 | 0.613 |
| 2011 | 36.0 | 36.6 | 12.7 | 75.6 | 0.439 | 0.436 |
| Survey year |
Biomass (t) |
Mean bootstrap biomass (t) |
Lower bound biomass (t) |
Upper bound biomass (t) |
Bootstrap CV |
Analytic CV |
|---|---|---|---|---|---|---|
| 2004 | 370.8 | 390.0 | 40.4 | 1,149.2 | 0.760 | 0.783 |
| 2006 | 336.1 | 337.1 | 69.2 | 989.0 | 0.715 | 0.705 |
| 2008 | 155.1 | 155.9 | 88.3 | 255.4 | 0.270 | 0.278 |
| 2010 | 53.2 | 53.6 | 22.1 | 97.7 | 0.371 | 0.385 |
| Year | Fixed Trawl & ZN HL |
Estimated (Medians) Halibut |
Estimated (Medians) Salmon troll |
Estimated (Medians) Recr. |
Total |
|---|---|---|---|---|---|
| 1935 | 1 | 1,242 | 393 | 3 | 1,639 |
| 1936 | 1 | 1,360 | 381 | 3 | 1,745 |
| 1937 | 1 | 1,199 | 365 | 3 | 1,568 |
| 1938 | 2 | 1,043 | 347 | 3 | 1,396 |
| 1939 | 2 | 1,237 | 312 | 3 | 1,554 |
| 1940 | 11 | 1,212 | 290 | 3 | 1,516 |
| 1941 | 8 | 1,121 | 401 | 3 | 1,532 |
| 1942 | 36 | 981 | 377 | 3 | 1,397 |
| 1943 | 100 | 948 | 489 | 2 | 1,540 |
| 1944 | 45 | 723 | 145 | 2 | 915 |
| 1945 | 418 | 701 | 317 | 2 | 1,438 |
| 1946 | 213 | 804 | 246 | 3 | 1,265 |
| 1947 | 116 | 700 | 396 | 5 | 1,218 |
| 1948 | 183 | 690 | 277 | 8 | 1,158 |
| 1949 | 221 | 666 | 385 | 10 | 1,282 |
| 1950 | 209 | 677 | 411 | 12 | 1,309 |
| 1951 | 200 | 795 | 430 | 14 | 1,439 |
| 1952 | 187 | 754 | 339 | 16 | 1,296 |
| 1953 | 78 | 550 | 336 | 18 | 982 |
| 1954 | 81 | 566 | 291 | 20 | 959 |
| 1955 | 104 | 472 | 356 | 22 | 954 |
| 1956 | 98 | 469 | 334 | 23 | 923 |
| 1957 | 74 | 525 | 372 | 26 | 997 |
| 1958 | 70 | 494 | 364 | 28 | 955 |
| 1959 | 91 | 538 | 354 | 29 | 1,013 |
| 1960 | 66 | 484 | 358 | 30 | 938 |
| 1961 | 92 | 463 | 393 | 33 | 980 |
| 1962 | 164 | 491 | 344 | 31 | 1,030 |
| 1963 | 144 | 541 | 311 | 31 | 1,028 |
| 1964 | 110 | 427 | 330 | 31 | 898 |
| 1965 | 290 | 389 | 347 | 32 | 1,058 |
| 1966 | 1,073 | 343 | 312 | 29 | 1,757 |
| 1967 | 785 | 315 | 344 | 28 | 1,472 |
| 1968 | 533 | 284 | 359 | 27 | 1,204 |
| 1969 | 1,064 | 359 | 315 | 26 | 1,765 |
| 1970 | 457 | 304 | 294 | 26 | 1,081 |
| 1971 | 324 | 255 | 311 | 27 | 917 |
| 1972 | 452 | 283 | 274 | 28 | 1,038 |
| 1973 | 1,112 | 196 | 234 | 28 | 1,569 |
| 1974 | 1,274 | 131 | 233 | 27 | 1,665 |
| 1975 | 790 | 184 | 224 | 26 | 1,224 |
| 1976 | 677 | 233 | 220 | 27 | 1,157 |
| 1977 | 399 | 151 | 228 | 28 | 807 |
| 1978 | 255 | 127 | 273 | 30 | 684 |
| 1979 | 486 | 173 | 274 | 30 | 962 |
| 1980 | 183 | 149 | 364 | 31 | 726 |
| 1981 | 95 | 144 | 310 | 31 | 580 |
| 1982 | 105 | 138 | 304 | 32 | 580 |
| 1983 | 154 | 131 | 282 | 32 | 599 |
| 1984 | 176 | 98 | 260 | 33 | 566 |
| 1985 | 418 | 115 | 252 | 28 | 814 |
| 1986 | 720 | 134 | 196 | 15 | 1,065 |
| 1987 | 732 | 120 | 155 | 25 | 1,032 |
| 1988 | 1,348 | 102 | 141 | 16 | 1,607 |
| 1989 | 808 | 79 | 123 | 22 | 1,033 |
| 1990 | 1,063 | 43 | 136 | 21 | 1,263 |
| 1991 | 1,093 | 37 | 116 | 22 | 1,268 |
| 1992 | 976 | 28 | 106 | 24 | 1,134 |
| 1993 | 1,160 | 25 | 66 | 14 | 1,266 |
| 1994 | 635 | 20 | 44 | 15 | 714 |
| 1995 | 545 | 16 | 31 | 9 | 601 |
| 1996 | 343 | 15 | 17 | 4 | 378 |
| 1997 | 267 | 18 | 12 | 9 | 306 |
| 1998 | 236 | 19 | 7 | 10 | 273 |
| 1999 | 251 | 20 | 4 | 11 | 286 |
| 2000 | 303 | 16 | 3 | 8 | 330 |
| 2001 | 288 | 15 | 3 | 8 | 313 |
| 2002 | 295 | 17 | 7 | 9 | 328 |
| 2003 | 237 | 16 | 8 | 10 | 270 |
| 2004 | 170 | 17 | 9 | 9 | 205 |
| 2005 | 162 | 18 | 12 | 9 | 201 |
| 2006 | 131 | 16 | 11 | 9 | 167 |
| 2007 | 139 | 13 | 8 | 7 | 166 |
| 2008 | 118 | 11 | 5 | 7 | 140 |
| 2009 | 114 | 8 | 6 | 6 | 134 |
| 2010 | 99 | 7 | 6 | 6 | 118 |
| 2011 | 119 | 6 | 6 | 6 | 137 |
| 2012 | 119 | 6 | 6 | 6 | 137 |
| Year | Lower 10% |
Median | Upper 90% |
|---|---|---|---|
| 1935 | 21,907 | 43,752 | 98,206 |
| 1936 | 21,226 | 41,662 | 89,542 |
| 1937 | 20,514 | 40,226 | 86,141 |
| 1938 | 19,873 | 38,530 | 81,513 |
| 1939 | 19,151 | 37,378 | 80,921 |
| 1940 | 18,697 | 34,925 | 75,919 |
| 1941 | 18,386 | 33,731 | 66,959 |
| 1942 | 17,717 | 33,074 | 68,540 |
| 1943 | 17,250 | 31,801 | 61,479 |
| 1944 | 16,862 | 31,125 | 59,523 |
| 1945 | 16,925 | 30,524 | 58,881 |
| 1946 | 16,222 | 29,843 | 57,254 |
| 1947 | 15,891 | 28,407 | 54,899 |
| 1948 | 15,565 | 27,689 | 53,313 |
| 1949 | 15,046 | 26,894 | 52,294 |
| 1950 | 14,438 | 26,449 | 51,442 |
| 1951 | 13,948 | 25,297 | 49,527 |
| 1952 | 13,618 | 24,702 | 47,783 |
| 1953 | 13,809 | 24,445 | 45,886 |
| 1954 | 13,992 | 24,667 | 44,708 |
| 1955 | 14,039 | 24,184 | 44,839 |
| 1956 | 13,587 | 23,946 | 44,413 |
| 1957 | 13,314 | 23,410 | 43,870 |
| 1958 | 13,290 | 23,189 | 41,641 |
| 1959 | 12,828 | 22,328 | 41,258 |
| 1960 | 12,873 | 22,438 | 40,503 |
| 1961 | 13,014 | 21,777 | 39,103 |
| 1962 | 13,193 | 21,277 | 38,402 |
| 1963 | 12,938 | 21,363 | 37,243 |
| 1964 | 12,805 | 21,415 | 36,138 |
| 1965 | 13,015 | 20,672 | 35,076 |
| 1966 | 12,561 | 20,286 | 33,724 |
| 1967 | 12,024 | 18,819 | 32,355 |
| 1968 | 11,845 | 18,224 | 31,859 |
| 1969 | 11,307 | 17,697 | 30,050 |
| 1970 | 11,103 | 16,759 | 28,693 |
| 1971 | 11,026 | 16,194 | 27,682 |
| 1972 | 10,971 | 16,118 | 26,671 |
| 1973 | 10,463 | 15,279 | 26,040 |
| 1974 | 9,813 | 14,442 | 24,362 |
| 1975 | 9,223 | 13,394 | 23,080 |
| 1976 | 8,556 | 12,812 | 22,068 |
| 1977 | 8,514 | 12,939 | 21,815 |
| 1978 | 8,816 | 12,815 | 21,613 |
| 1979 | 8,586 | 12,868 | 21,257 |
| 1980 | 8,369 | 13,031 | 21,236 |
| 1981 | 8,650 | 12,822 | 20,570 |
| 1982 | 8,810 | 12,708 | 20,311 |
| 1983 | 8,695 | 12,730 | 19,853 |
| 1984 | 8,489 | 12,407 | 18,751 |
| 1985 | 8,512 | 11,886 | 17,679 |
| 1986 | 8,278 | 11,095 | 16,151 |
| 1987 | 7,540 | 10,351 | 14,590 |
| 1988 | 6,706 | 9,123 | 12,871 |
| 1989 | 5,957 | 8,023 | 11,385 |
| 1990 | 5,275 | 7,153 | 10,404 |
| 1991 | 4,672 | 6,202 | 9,207 |
| 1992 | 3,914 | 5,327 | 7,900 |
| 1993 | 3,090 | 4,401 | 6,705 |
| 1994 | 2,498 | 3,638 | 5,773 |
| 1995 | 2,149 | 3,240 | 5,203 |
| 1996 | 1,917 | 2,930 | 4,864 |
| 1997 | 1,843 | 2,829 | 4,810 |
| 1998 | 1,843 | 2,709 | 4,650 |
| 1999 | 1,832 | 2,728 | 4,537 |
| 2000 | 1,842 | 2,749 | 4,526 |
| 2001 | 1,825 | 2,718 | 4,596 |
| 2002 | 1,726 | 2,599 | 4,484 |
| 2003 | 1,609 | 2,502 | 4,253 |
| 2004 | 1,558 | 2,475 | 4,236 |
| 2005 | 1,458 | 2,428 | 4,233 |
| 2006 | 1,443 | 2,365 | 4,157 |
| 2007 | 1,339 | 2,278 | 4,030 |
| 2008 | 1,270 | 2,230 | 3,941 |
| 2009 | 1,178 | 2,071 | 3,676 |
| 2010 | 1,082 | 1,935 | 3,435 |
| 2011 | 1,052 | 1,911 | 3,506 |
| 2012 | 1,031 | 1,879 | 3,625 |