
Chinook salmon (Oncorhynchus tshawytscha) Okanagan population: COSEWIC assessment and status report 2017
Chinook Salmon
Okanagan population - endangered
2017
Table of contents
- Table of contents
- COSEWIC assessment summary - Okanagan population
- COSEWIC executive summary
- Technical summary - Okanagan population
- Preface
- Wildlife species description and significance
- Distribution
- Habitat
- Biology
- Population sizes and trends
- Threats and limiting factors
- Protection, status and ranks
- Acknowledgements and authorities contacted
- Information sources
- Biographical summary of report writer(s)
List of figures
- Figure 1. Okanagan River Chinook Salmon from the 2008 spawning season.
- Figure 2. Juvenile Okanagan River Chinook Salmon.
- Figure 3. Dendrogram of Cavalli-Sforza and Edwards (1967) chord distances based on 12 microsatellite loci for Chinook Salmon populations in the Columbia River Basin and Okanagan Watershed.
- Figure 4. Map of the Okanagan Watershed in relation to British Columbia and Washington State.
- Figure 5. Map depicting the visual survey sections of the Okanagan River surveyed by ONAFD from 2001 to 2015 (see Table 6 for details about methodology and parts surveyed).
- Figure 6. Historical and recent Chinook Salmon observations in the Okanagan River and selected historical observations in the upper Columbia River Basin.
- Figure 7. Abundance index of Chinook Salmon returning to the Okanagan River from 2001 to 2015. Adipose fin-clipped fish are not included in this abundance index (see Figure 8).
- Figure 8. Percentage of hatchery-origin Chinook Salmon sampled by ONAFD from 2005 to 2014.
- Figure 9. Aerial surveys of redds in the U.S. Okanogan and Similkameen Rivers from 1956 to 2014.
- Figure 10. Upper Columbia summer Chinook Salmon (Well’s Hatchery indicator population) fishing mortality (%) by catch year for Canadian and U.S. fisheries from 1980 to 2013.
- Figure 11. Upper Columbia summer Chinook Salmon (Well’s Hatchery indicator population) fishing mortality (%) by brood year for Canadian and U.S. fisheries from 1975 to 2008.
List of tables
- Table 1. Sample sizes for Okanagan Chinook genetic analysis to determine genetic differentiation among nearby upper Columbia River populations.
- Table 2. List of populations and their population groupings (U.S. – Evolutionarily Significant Unit (ESU); Canada – Conservation Unit (CU)) used in genetics analysis presented in Figure 3.
- Table 3. Current categorization of upper Columbia Chinook populations (McClure et al. 2003) and COSEWIC DU designation.
- Table 4. Summary of visual survey (rafting and walking) search effort from 2006 to 2015 for Okanagan Chinook by the ONAFD.
- Table 5. Presence documentation or abundance index (number of live and dead counts) of Okanagan Chinook from 1965 to 2015.
- Table 6. Summary of visual survey methods from 2001 to 2015.
- Table 7. Escapement estimates of populations that represent the upper Columbia River summer and fall (UCSF) Chinook Salmon Evolutionarily Significant Unit (ESU) and the Canadian Okanagan River.
- Table 8. Summary of hatchery practices at the Wells Hatchery and Chief Joseph Hatchery.
- Table 9. Number of ocean-type Chinook Salmon smolts released by the Wells and Chief Joseph hatchery programs by brood year.
- Table 10. Colville Confederated Tribes’ harvest of upper Columbia River summer Chinook Salmon by fishery from 2011 to 2015.
- Table 11. Sources of upper Columbia River summer Chinook Salmon fishing mortality by fishery and region.
List of appendices
- Appendix I. Threats Classification Table for Chinook Salmon, Okanagan population.
Document information
COSEWIC Assessment and status report on the Chinook Salmon (Oncorhynchus tshawytscha) Okanagan population in Canada, 2017
COSEWIC
Committee on the Status
of Endangered Wildlife
in Canada

COSEPAC
Comité sur la situation
des espèces en péril
au Canada
Committee on the Status of Endangered Wildlife in Canada (COSEWIC) status reports are working documents used in assigning the status of wildlife species suspected of being at risk. This report may be cited as follows:
COSEWIC. 2017. COSEWIC assessment and status report on the Chinook Salmon Oncorhynchus tshawytscha, Okanagan population, in Canada. Committee on the Status of Endangered Wildlife in Canada. Ottawa. xii + 62 pp. (Species at Risk Public Registry website).
Previous report(s):
COSEWIC 2006. COSEWIC assessment and status report on the chinook salmon Oncorhynchus tshawytscha (Okanagan population) in Canada. Committee on the Status of Endangered Wildlife in Canada. Ottawa. vii + 41 pp.
Production note:
COSEWIC would like to acknowledge Douglas Braun and Nicholas Burnett for writing the status report on Chinook Salmon, Okanagan population. This report was prepared under contract with Environment and Climate Change Canada and was overseen by Alan Sinclair, Co-chair of the COSEWIC Marine Fishes Specialist Subcommittee.
For additional copies contact:
COSEWIC Secretariat
c/o Canadian Wildlife Service
Environment Canada
Ottawa, ON
K1A 0H3
Tel.: 819-938-4125
Fax: 819-938-3984
E-mail: COSEWIC E-mail
Website: COSEWIC
Également disponible en français sous le titre Évaluation et Rapport de situation du COSEPAC sur le Saumon chinook (Oncorhynchus tshawytscha), population de l'Okanagan, au Canada.
Cover illustration/photo:
Chinook Salmon - Provided by the Okanagan Nation Alliance Fisheries Department.
COSEWIC assessment summary
Assessment summary - april 2017
- Common name
- Chinook Salmon - Okanagan population
- Scientific name
- Oncorhynchus tshawytscha
- Status
- Endangered
- Reason for designation
- This is the only Columbia River Basin Chinook population in Canada. It is geographically discrete and genetically distinct from other Canadian Chinook populations. This population was once large enough to support an important food and trade fishery prior to settlement by non-native people. Construction of multiple dams along the Columbia River migration route combined with historical overfishing in the Columbia River and the ocean reduced population size. Poor marine survival, deterioration in the quality of Canadian spawning habitat, and non-native predators and competitors have also contributed to the current depleted state of the population. Rescue is theoretically possible from straying of Chinook from the US, but the status of the source population is uncertain as is the viability of these strays. Rescue is therefore considered unlikely. Although there has been a slight increase in the population, the number of mature individuals in the population remains very low, varying between 19 – 112 individuals in the last 4 years.
- Occurrence
- British Columbia, Pacific Ocean
- Status history
- Designated Endangered in an emergency assessment on 4 May 2005. Status re-examined and designated Threatened in April 2006. Status re-examined and designated Endangered in April 2017.
Executive summary
Chinook Salmon
Oncorhynchus tshawytscha
Okanagan population
Wildlife species description and significance
Chinook Salmon (Salmonidae: Oncorhynchus tshawytscha Walbaum) is one of seven species of the genus Oncorhynchus native to North America. This report assesses the status of the Chinook Salmon population within the Okanagan Watershed in British Columbia. The Okanagan Chinook population is part of a larger population complex that includes other summer and fall migrating ocean-type populations that spawn in the tributaries of the upper Columbia River in the U.S. The Okanagan Chinook population is the only remaining Columbia River Basin Chinook population in Canada. The Columbia River Basin group of populations is not only geographically separated from other Canadian Chinook populations, but is also genetically distinct from all other Chinook populations, reflecting deep phylogenetic divergence and local adaptation.
Distribution
Okanagan Chinook spawn in the Okanagan Watershed, located in the Columbia River Basin in southern British Columbia. Although their exact distribution in the Pacific Ocean is unknown, they likely rear in coastal areas like other ocean-type Chinook Salmon populations.
Habitat
Okanagan Chinook spawn predominantly in an 8 km-long reach of semi-natural habitat in the Okanagan River. Individuals have been observed spawning in water depths, velocities and substrate types typical of other Chinook populations. Much of the Okanagan River has been dammed, channelized, straightened, narrowed and dyked; however, improved fish passage at McIntyre Dam and recent restoration efforts have aimed to enhance the quantity and quality of spawning and rearing habitat for salmonids. Hydroelectric dams in the Columbia River have altered the migration corridor of Chinook Salmon migrating to (adults) and from (juveniles) the Okanagan River. Juveniles must survive downstream passage over nine dams, and adults must locate fishways and navigate reservoir slack water. Both life stages must tolerate elevated water temperatures in reservoirs and fishways, and high and variable flow releases in dam tailraces.
Increases in the abundance of the upper Columbia River Chinook Salmon population complex in the 1990s coincided with favorable conditions in the Pacific Ocean. These conditions changed in the early 2000s resulting in a decline in returns.
Biology
Chinook Salmon are the largest species in the genus Oncorhynchus, where adults can exceed 1 m in length. Chinook Salmon are semelparous, migrating as juveniles to the ocean where they feed, and return to fresh water as adults to spawn, and then die. Chinook Salmon typically spawn in their natal rivers during the late summer – early fall; however, some populations can return to fresh water as adults as early as April. Age at maturity ranges from 3 to 7, but the dominant ages of spawners are 4- and 5-year-olds. Once deposited in redds, eggs incubate over the winter and hatch in the early to late spring. After emergence, juveniles either rear in fresh water for one or more years (stream-type) or migrate to the ocean after 2-5 months in fresh water (ocean-type). These juvenile life histories are also correlated with ocean distributions, whereby stream-type populations tend to migrate offshore and ocean-type populations occupy the nearshore environment. Juvenile life histories are one of the key identifiers used to categorize Chinook Salmon populations.
Okanagan Chinook are a summer migrating, ocean-type population that return to fresh water in the summer (June to August) and spawn in October. Juveniles have been observed migrating downstream from the Okanagan River into Osoyoos Lake during late May and June, although little biological information has been collected on this life stage due to its low spawner abundance.
Population sizes and trends
In recent years, annual spawner abundance has appeared to increase; however, abundances remain low (maximum population size of 112 in 2015) and spawner estimates are highly uncertain. Adding adipose fin-clipped fish to the abundance estimate has little influence on the population size and trend. Rescue is likely from nearby wild- and hatchery-origin fish that are part of the upper Columbia River Evolutionary Significant Unit in the U.S.
Threats and limiting factors
Key threats and limiting factors to Okanagan Chinook are fishing, habitat degradation (e.g., dams, water withdrawal, pollution), invasive species, and climate change. Exploitation rates for upper Columbia River summer migrating Chinook Salmon have been > 69% since 2003. Although Canadian exploitation rates have decreased in recent years, the total exploitation has remained stable. Habitat degradation through fragmentation and loss of spawning and rearing habitat has been substantial in the Okanagan Watershed. Dams throughout the U.S. portion of the Columbia River Basin have negatively impacted Okanagan Chinook’s freshwater migration corridor, reducing survival during both adult and juvenile migrations. Notably, Canada has no control over the operations of these facilities. Overall, water quality and quantity are improving, but are still major threats to Okanagan Chinook. Climate change is an emerging threat expected to impact Okanagan Chinook.
Protection, status and ranks
COSEWIC assessed Okanagan Chinook as Endangered in an Emergency Assessment in 2005, later designating the population as Threatened in 2006 due to the potential for rescue from nearby populations of Chinook Salmon in the upper Columbia River. The population was not listed under the Canada Species At Risk Act for economic reasons. COSEWIC re-examined the status of Okanagan Chinook in April 2017 as Endangered. Chinook Salmon have a provincial status of S4, secure in BC. Okanagan Chinook have not been assessed by BC.
Technical summary - Okanagan population
- Scientific name:
- Oncorhynchus tshawytscha
- English name:
- Chinook Salmon, Okanagan population
- French name:
- Saumon chinook, Population de l’Okanagan
- Range of occurrence in Canada:
- British Columbia, Pacific Ocean
Demographic information
| Summary items | Information |
|---|---|
| Generation time (usually average age of parents in the population; indicate if another method of estimating generation time indicated in the IUCN guidelines (2011) is being used) | 4 years |
| Is there an [observed, inferred, or projected] continuing decline in number of mature individuals? | No, there has been an observed increase in the number of wild adult spawners since 2001. |
| Estimated percent of continuing decline in total number of mature individuals within [5 years or 2 generations] | A quantitative analysis was not done. |
| [Observed, estimated, inferred, or suspected] percent [reduction or increase] in total number of mature individuals over the last [10 years, or 3 generations]. | There has been an increase in the number of mature individuals within the last three generations. |
| [Projected or suspected] percent [reduction or increase] in total number of mature individuals over the next [10 years, or 3 generations]. | A quantitative analysis was not done. |
| [Observed, estimated, inferred, or suspected] percent [reduction or increase] in total number of mature individuals over any [10 years, or 3 generations] period, over a time period including both the past and the future. | A quantitative analysis was not done. |
| Are the causes of the decline a. clearly reversible and b. understood and c. ceased? | a. NA. b. NA. c. NA. |
| Are there extreme fluctuations in number of mature individuals? | No |
Extent and occupancy information
| Summary items | Information |
|---|---|
| Estimated extent of occurrence | > 20,000 km2 |
| Index of area of occupancy (IAO) (Always report 2x2 grid value). |
16 km2 |
| Is the population “severely fragmented” i.e., is >50% of its total area of occupancy in habitat patches that are (a) smaller than would be required to support a viable population, and (b) separated from other habitat patches by a distance larger than the species can be expected to disperse? | a. No b. No |
| Number of “locations” See Definitions and Abbreviations on COSEWIC website and IUCN (Feb 2014) for more information on this term. (use plausible range to reflect uncertainty if appropriate) |
1 location, which is defined as the spawning grounds in the Okanagan River where > 96% of the Okanagan Chinook spawn. |
| Is there an [observed, inferred, or projected] decline in extent of occurrence? | No |
| Is there an [observed, inferred, or projected] decline in index of area of occupancy? | No. Improvements to fish passage at McIntyre Dam have provided access to additional spawning habitat in the Okanagan River and the Penticton Channel, which may lead to an increase in the index of area of occupancy in the future. |
| Is there an [observed, inferred, or projected] decline in number of subpopulations? | No |
| Is there an [observed, inferred, or projected] decline in number of “locations” See Definitions and Abbreviations on COSEWIC website and IUCN (Feb 2014) for more information on this term.? |
No |
| Is there an [observed, inferred, or projected] decline in [area, extent and/or quality] of habitat? | No |
| Are there extreme fluctuations in number of subpopulations? | No |
| Number of “locations” See Definitions and Abbreviations on COSEWIC website and IUCN (Feb 2014) for more information on this term.? |
No |
| Are there extreme fluctuations in extent of occurrence? | No |
| Are there extreme fluctuations in index of area of occupancy? | No |
Number of mature individuals (in each subpopulation)
| Subpopulations (give plausible ranges) | N Mature Individuals |
|---|---|
| blank cell | Minimum estimate in 2015 =112 (range of minimum estimates from 2001 to 2015: 5-112) |
| Total | 112 (5-112) |
Quantitative analysis
| Summary items | Information |
|---|---|
| Probability of extinction in the wild is at least [20% within 20 years or 5 generations, or 10% within 100 years]. | A quantitative analysis was not done. |
Threats (direct, from highest impact to least, as per iucn threats calculator, see appendix i)
| Summary items | Information |
|---|---|
| Was a threats calculator completed for this species? | Yes
What additional limiting factors are relevant? |
Rescue effect (immigration from outside Canada)
| Summary items | Information |
|---|---|
| Status of outside population(s) most likely to provide immigrants to Canada. | Status has not been assessed. Populations in the U.S. are supplemented by large hatchery programs in the upper Columbia River and wild populations are increasing due to recent increases in marine survival. |
| Is immigration known or possible? | Yes. There are observations of hatchery fish from the U.S. spawning in the Okanagan River. It is possible that fish spawned in the Similkameen River may stray into the Okanagan. |
| Would immigrants be adapted to survive in Canada? | It is unknown whether strays provide a positive or negative effect on Okanagan Chinook. |
| Is there sufficient habitat for immigrants in Canada? | Likely. Estimates of spawning habitat exceed 1400 pairs. |
| Are conditions deteriorating in Canada? See Table 3 (Guidelines for modifying status assessment based on rescue effect). |
Unknown. Recent restoration efforts have aimed to improve habitat, but high water temperatures, water pollution, and water withdrawals continue to be problematic. |
| Are conditions for the source population deteriorating? See Table 3 (Guidelines for modifying status assessment based on rescue effect). |
Unknown |
| Is the Canadian population considered to be a sink? See Table 3 (Guidelines for modifying status assessment based on rescue effect). |
Unknown |
| Is rescue from outside populations likely? | Unknown |
Data sensitive species
| Summary items | Information |
|---|---|
| Is this a data sensitive species? | No |
Status history
| Summary items | Information |
|---|---|
| COSEWIC: Designated Endangered in an emergency assessment on 4 May 2005. |
Status re-examined and designated Threatened in April 2006. Status re-examined and designated Endangered in April 2017. |
Status and reasons for designation
| Summary items | Information |
|---|---|
| Status | Endangered |
| Alpha-numeric codes | D1 |
| Reasons for Designation | This is the only Columbia River Basin Chinook population in Canada. It is geographically discrete and genetically distinct from other Canadian Chinook populations. This population was once large enough to support an important food and trade fishery prior to settlement by non-native people. Construction of multiple dams along the Columbia River migration route combined with historical overfishing in the Columbia River and the ocean reduced population size. Poor marine survival, deterioration in the quality of Canadian spawning habitat, and non-native predators and competitors have also contributed to the current depleted state of the population. Rescue is theoretically possible from straying of Chinook from the US, but the status of the source population is uncertain as is the viability of these strays. Rescue is therefore considered unlikely. Although there has been a slight increase in the population, the number of mature individuals in the population remains very low, varying between 19 – 112 individuals in the last 4 years. |
Applicability of criteria
| Summary items | Information |
|---|---|
| Criterion A (Decline in Total Number of Mature Individuals) | Does not meet criteria because the population has increased over the past 3 generations. |
| Criterion B (Small Distribution Range and Decline or Fluctuation) | Does not meet criteria because there has been no change in EOO and IAO, the quality of habitat, number of locations, and number of mature individuals are not declining, and there are not severe fluctuations. |
| Criterion C (Small and Declining Number of Mature Individuals) | Does not meet criteria because the number of mature individuals is increasing. |
| Criterion D (Very Small or Restricted Population) | Meets Endangered D1 because the number of mature individuals is less than 250. |
| Criterion E (Quantitative Analysis | Not done |
Preface
This status update report provides new information on the Chinook Salmon population that spawns in the Okanagan River in British Columbia. Okanagan Chinook return to fresh water as adults in the summer, and out-migrate to the ocean as juveniles 2-5 months after emergence (ocean-type life history). Chinook Salmon populations are often categorized by their dominant life history; therefore Okanagan Chinook are considered a summer migrating, ocean-type population. Throughout the document these terms are used to describe the migration timing (spring, summer or fall) and juvenile residence (stream- or ocean-type) of populations. Since the initial COSEWIC assessment of Okanagan Chinook in 2006, new data and information has been collected on the population’s biology, size, habitat trends, extent of occurrence, potential for rescue by other populations, and exploitation rates. Studies examining the durations of freshwater and ocean residence using otolith microchemistry and muscle stable isotopes have provided insights into hypotheses about the use of fresh water throughout the Okanagan Chinook population’s life history. Earlier studies suggested that there may be a component of the Okanagan Chinook population that are resident (spend their whole life in fresh water and are offspring of non-anadromous females) or residualize (spend their whole life in fresh water and are offspring of anadromous females) in Osooyos Lake. Using elements found in the otoliths and muscle tissues, researchers have determined that fish thought to be either residents or residuals actually migrated to the marine environment. Furthermore, all fish sampled were offspring of mothers that migrated to the ocean. Taken together, this evidence suggests that Okanagan Chinook do not typically spend their entire life in fresh water.
Population size has increased since 2005, but remains extremely small (< 250 individuals). Quantity of available spawning and rearing habitat has increased as a result of restoration efforts and a new fish passage structure at McIntyre Dam. Such efforts, however, have not increased the area of occupancy as colonization above McIntyre Dam has not occurred in levels that would change the status of Okanagan Chinook. In 2013, the Chief Joseph Hatchery began operations, which includes the collection of wild adults for broodstock from the Okanogan River, United States and nearby tributaries. Notably, the Okanagan (Canada) and Okanogan (United States) are two portions of the same river, divided by Osoyoos Lake and the Canada – United States border. In 2014 and 2015, 186 050 and 300 546 ocean-type Chinook juveniles (reared in fresh water for 2-5 months) were released into the Okanogan River, United States. Adult returns will not be detectable until 2017. There is high potential for a small proportion of these fish to disperse and spawn in the Okanagan River. Fishing impacts are one of the primary threats faced by Okanagan Chinook. In 2009, amendments to the Pacific Salmon Treaty reduced Canadian catch limits for upper Columbia River Chinook Salmon; however, the Treaty does not cover Canadian-origin Okanagan Chinook. While these amendments resulted in a reduction in Canadian exploitation rates, U.S. exploitation rates have increased over the past 10 years.
COSEWIC history
The Committee on the Status of Endangered Wildlife in Canada (COSEWIC) was created in 1977 as a result of a recommendation at the Federal-Provincial Wildlife Conference held in 1976. It arose from the need for a single, official, scientifically sound, national listing of wildlife species at risk. In 1978, COSEWIC designated its first species and produced its first list of Canadian species at risk. Species designated at meetings of the full committee are added to the list. On June 5, 2003, the Species at Risk Act (SARA) was proclaimed. SARA establishes COSEWIC as an advisory body ensuring that species will continue to be assessed under a rigorous and independent scientific process.
COSEWIC mandate
The Committee on the Status of Endangered Wildlife in Canada (COSEWIC) assesses the national status of wild species, subspecies, varieties, or other designatable units that are considered to be at risk in Canada. Designations are made on native species for the following taxonomic groups: mammals, birds, reptiles, amphibians, fishes, arthropods, molluscs, vascular plants, mosses, and lichens.
COSEWIC membership
COSEWIC comprises members from each provincial and territorial government wildlife agency, four federal entities (Canadian Wildlife Service, Parks Canada Agency, Department of Fisheries and Oceans, and the Federal Biodiversity Information Partnership, chaired by the Canadian Museum of Nature), three non-government science members and the co-chairs of the species specialist subcommittees and the Aboriginal Traditional Knowledge subcommittee. The Committee meets to consider status reports on candidate species.
Definitions (2016)
- Wildlife species
- A species, subspecies, variety, or geographically or genetically distinct population of animal, plant or other organism, other than a bacterium or virus, that is wild by nature and is either native to Canada or has extended its range into Canada without human intervention and has been present in Canada for at least 50 years.
- Extinct (X)
- A wildlife species that no longer exists.
- Extirpated (XT)
- A wildlife species no longer existing in the wild in Canada, but occurring elsewhere.
- Endangered (E)
- A wildlife species facing imminent extirpation or extinction.
- Threatened (T)
- A wildlife species likely to become endangered if limiting factors are not reversed.
-
Special concern (SC)
(Note: Formerly described as “Vulnerable” from 1990 to 1999, or “Rare” prior to 1990.) - A wildlife species that may become a threatened or an endangered species because of a combination of biological characteristics and identified threats.
-
Not at risk (NAR)
(Note: Formerly described as “Not in any category”, or “No designation required.”) - A wildlife species that has been evaluated and found to be not at risk of extinction given the current circumstances.
-
Data deficient (DD)
(Note: Formerly described as “Indeterminate” from 1994 to 1999 or “ISIBD” [insufficient scientific information on which to base a designation] prior to 1994. Definition of the [DD] category revised in 2006.) - A category that applies when the available information is insufficient (a) to resolve a species’ eligibility for assessment or (b) to permit an assessment of the species’ risk of extinction.
The Canadian Wildlife Service, Environment and Climate Change Canada, provides full administrative and financial support to the COSEWIC Secretariat.
Wildlife species description and significance
Name and classification
Chinook Salmon (Salmonidae: Oncorhynchus tshawytscha Walbaum) is one of seven species of the genus Oncorhynchus native to North America (Crête-Lafrenière et al. 2012) . Chinook Salmon is a sister species to Coho Salmon (O. kisutch), together making up one of the clades within Oncorhynchus (Crête-Lafrenière et al. 2012) .
Other common names include spring salmon, king salmon, tyee, and quinnat (Scott and Crossman 1973). Aboriginal Okanagan peoples have two names for Chinook Salmon in the Okanagan Watershed: ntytyix, meaning “spring salmon”, and sk’lwist, meaning “king salmon”, which is used to refer to Chinook that migrate into the Okanagan River later in the year (Vedan 2002; Armstrong 2015). Saumon Chinook is the French common name.
Morphological description
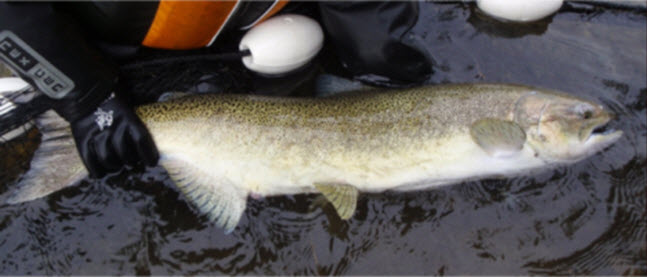
Chinook Salmon adults are the largest of the Oncorhynchus species and can be over 1 m in length and weigh up to 45 kg (Figure 1). Chinook Salmon can be distinguished from other salmonid species by the presence of small black spots on the top and bottom lobes of the caudal fin, and black gums at the base of the teeth in the lower jaw (McPhail 2007).
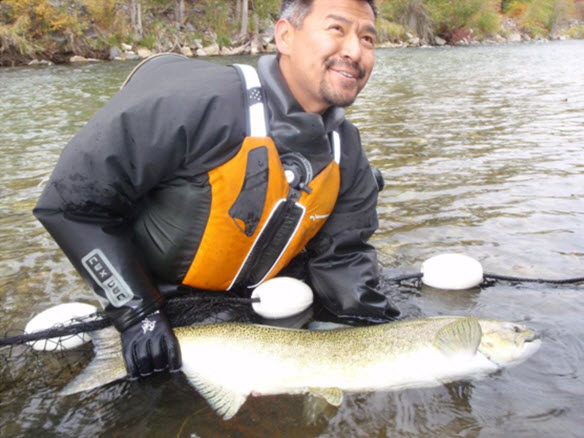
Long description for Figure 1
Photo of an adult Okanagan Chinook Salmon during the 2008 spawning season. Adults can be over 1 metre in length and weigh up to 45 kilograms. Colouration during spawning is highly variable among populations, ranging from goldish brown to blackish and red.
Internal features that distinguish Chinook Salmon from other salmonids are their large number of pyloric caeca (> 100) and variable coloured flesh. Flesh colour can range from pale white to bright red; some individuals may show both colours (McPhail 2007).
Morphology and colouration changes considerably prior to spawning. Like most other Oncorhynchus species, males grow large kypes (elongation of the lower jaw) and develop a dorsal hump. Colouration during spawning is highly variable among populations, ranging from goldish brown to blackish and red. Females have less pronounced secondary sexual characteristics. Females are the most fecund (up to 10 000 eggs per individual) and have the largest eggs (single wet egg mass > 400 mg) of all Oncorhynchus species (Einum et al. 2003).
Chinook Salmon fry and parr are distinguished by the presence of parr marks extending well below the lateral line (Figure 2), the deepest of which are wider than the vertical eye diameter (McPhail 2007). Adipose fins are normally unpigmented in the centre, but have a black edge. Anal fins are usually only slightly falcate, have a white leading edge, and the leading rays do not reach past the posterior insertion of the fin when folded against the body. Juvenile characteristics can be highly variable and proper identification often requires pyloric caeca counts. Chinook fry have 135 to 185 pyloric caeca and Coho fry have 45 to 80 pyloric caeca (McPhail 2007).
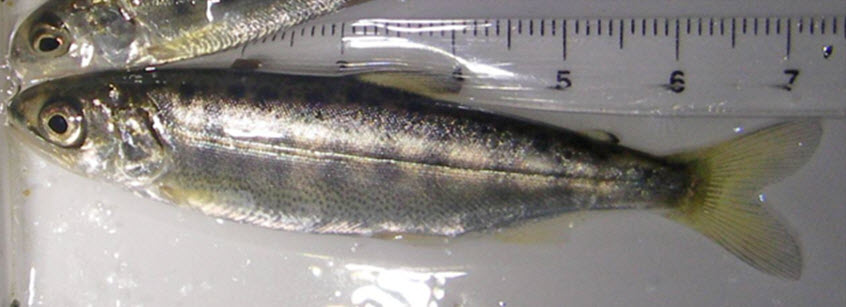
Long description for Figure 2
Photo of a juvenile Chinook Salmon, showing parr marks extending well below the lateral line. Adipose fins are normally unpigmented in the centre, but have a black edge. Anal fins are usually only slightly falcate and have a white leading edge.
Population spatial structure and variability
Chinook Salmon exhibit high population diversity (Braun et al. 2016) and population structure in Canada (Moran et al.2013). Genetic, life history and freshwater habitat variation provide a foundation for the strong population structure, and are hypothesized to be the result of glacial events from the Quaternary period (Moran et al. 2013) and ongoing ‘isolation-by-distance’ gene flow (Beacham et al. 2006). North American Chinook populations have been grouped into Conservation Units (Canada) or Evolutionarily Significant Units (U.S.) (e.g., Waples 1991; Waknitz et al. 1995; Myers et al. 1998; Teel et al. 1999; Candy et al. 2002).
Population structure for Chinook Salmon has been described using life history and genetic studies that examine variation in these traits among populations. For example, populations are often categorized into two broad life history types, populations with stream- or ocean-type juvenile life histories. Juveniles from stream-type populations rear in fresh water for one year (yearling), whereas ocean-type juveniles rear in fresh water for only 2-5 months (sub-yearling) after emergence and then migrate out to the Pacific Ocean. Further differences among populations in their adult return timing to fresh water can influence population structure. Return timing to fresh water (e.g., spring, summer and fall months) has some genetic basis (Waples et al. 2004). Populations or groups of populations are often categorized by their return timing to fresh water; this naming convention is used throughout this report. For example, for interior Columbia River Chinook (populations east of the Cascade Mountains), life history type explains a large amount of the genetic variation among groups of populations (Waples et al. 2004). Okanogan, Similkameen, Hanford, Methow and Wenatchee populations in the U.S. are summer and fall migrating ocean-type populations that are part of the upper Columbia summer and fall (UCSF) Evolutionarily Significant Unit (ESU) and are genetically different from the Chinook populations that make up the upper Columbia River ESU (stream-type) that spawn in some of the same watersheds (Beacham et al. 2006). This study suggests that while there are no geographical barriers between the populations of these two ESUs, there are reproductive barriers that prevent population mixing. UCSF ocean-type populations, however, are genetically similar because of mixing of individuals among spawning grounds (Davis et al. 2007 - Appendix B; DFO 2008).
Genetic studies have been conducted to examine genetic relationships among the Canadian Okanagan Chinook population and nearby U.S. populations including spawning populations in the U.S. portion of the Okanagan Watershed (Similkameen and Okanogan Rivers) (Davis et al. 2007). No Chinook Salmon have returned to the Canadian portion of the Similkameen River due to an impassable waterfall on the U.S. side of the border. Specifically, this study examined the genetic affiliation of the Canadian Okanagan Chinook population, and whether the spawners in the Okanagan River are a small isolated population or part of a larger metapopulation connected by the dispersal of adults. Samples were screened at 12 microsatellite loci (Beacham et al. 2006) and were collected from 2000 to 2008; the number, life stage and location of samples varied each year (Table 1).
| Year | N | Location | Life stage |
|---|---|---|---|
| 2000 | 1 | Okanagan River | Adult |
| 2002 | 1 | Okanagan River | Adult |
| 2003 | 1 | Okanagan River | Adult |
| 2003 | 3 | Osoyoos Lake | Yearlings |
| 2004 | 4 | Okanagan River | Adult |
| 2004 | 7 | Osoyoos Lake | Fry |
| 2005 | 28 | Okanagan River | Adult |
| 2006 | 31 | Okanagan River | Adult |
| 2007 | 18 | Okanagan River | Adult |
| 2008 | 13 | Okanagan River | Adult |
Genetic affiliations between Okanagan Chinook and nearby U.S. populations were examined using only adult samples from 2005 and 2006. FST - a measure of genetic differentiation - ranges from 0 (subpopulations have equal allele frequencies) to 1 (subpopulations are fixed for different alleles) (Allendorf et al. 2013), and was used to measure the genetic differentiation among populations. Dendrogram branch lengths in Figure 3 reflect the genetic distances (based on Cavalli-Sforza Edward chord distances) between populations; Table 2 provides a list of the populations used in the analysis. Results from analyses conducted by DFO’s Molecular Genetics Laboratory in Nanaimo (Davis et al. 2007 - Appendix B) indicated that the Canadian Okanagan population is most closely related to nearby UCSF populations that spawn in U.S. rivers. Specifically, the Okanagan Chinook (Canada) are closely related to Similkameen (U.S.) Chinook as indicated by the low FST value (0.002) and the non-significant (p-value > 0.05) differentiation in allele frequencies between the two populations in 2006 (Davis et al. 2007 - Appendix B). The longer dendrogram branch for 2005 (Figure 3), larger FST value (0.011) between the Okanagan River and Similkameen and significant differentiation (p-value < 0.05) in allele frequencies were attributable in part to the small Okanagan sample size (N = 28) relative to both the Similkameen (N = 92) samples, and especially to the close familial relationships among the sampled fish in 2005 (Davis et al. 2007 - Appendix B). Although the adult sample sizes from the Okanagan River were similar among the two sample years (2006 - N = 31), there was less family structure observed in the 2006 samples. Both Okanagan River branches of the dendrogram (samples from 2005 and 2006) clustered with the UCSF Chinook populations (Figure 3). Similar results were found in a second unpublished study that analyzed samples taken in 2007 (N = 18) and 2008 (N = 13) (Davis 2010).
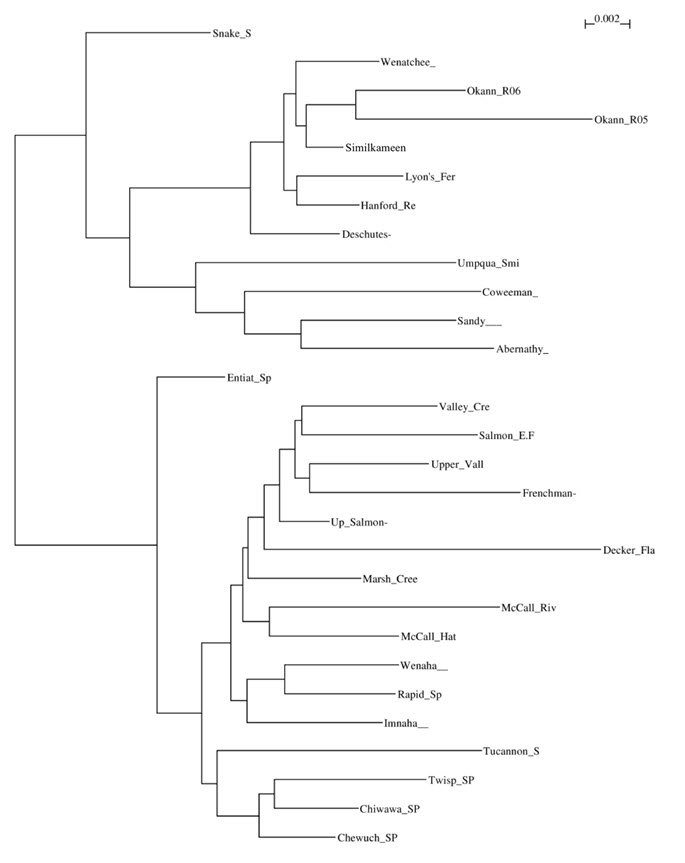
Long description for Figure 3
Dendrogram of Cavalli-Sforza and Edwards (1967) chord distances based on 12 microsatellite loci for Chinook Salmon populations in the Columbia River Basin and Okanagan Watershed.
| Population | Population grouping | Abbreviation |
|---|---|---|
| Snake River | Snake River spring/summer ESU | Snake_S |
| Wenatchee River | Upper Columbia River summer/fall ESU | Wenatchee_ |
| Okanagan River 2006 | Okanagan CU | Okann_R06 |
| Okanagan River 2005 | Okanagan CU | Okann_R05 |
| Similkameen River | Upper Columbia River summer/fall ESU | Similkameen |
| Lyon’s Ferry | Snake River fall ESU | Lyon’s_Fer |
| Hanford Reach | Upper Columbia River summer/fall ESU | Hanford_Re |
| Deschutes River | Snake River fall ESU | Deschutes- |
| Umpqua River | Oregon Coast ESU | Umpqua_Smi |
| Coweeman River | Lower Columbia River ESU | Coweeman_ |
| Sandy River | Lower Columbia River ESU | Sandy_ |
| Abernathy Creek | Lower Columbia River ESU | Abernathy_ |
| Entiat River | Upper Columbia River ESU | Entiat_SP |
| Valley Creek | Snake River spring/summer ESU | Valley_Cre |
| Salmon River EF | Snake River spring/summer ESU | Salmon_E/F |
| Valley Creek Upper | Snake River spring/summer ESU | Upper_Vall |
| Upper Salmon River at Frenchman Creek | Snake River spring/summer ESU | Frenchman- |
| Salmon River Upper | Snake River spring/summer ESU | Up_Salmon- |
| Decker Flat | Snake River spring/summer ESU | Decker_Fla |
| Marsh Creek | Snake River spring/summer ESU | Marsh_Cree |
| McCall River | Snake River spring/summer ESU | McCall_Riv |
| McCall Hatchery | Snake River spring/summer ESU | McCall_Hat |
| Wenaha River South Fork | Snake River spring/summer ESU | Wenaha_ |
| Rapid River Hatchery | Snake River spring/summer ESU | Rapid_SP |
| Imnaha River | Snake River spring/summer ESU | Imnaha_ |
| Tucannon River | Snake River spring/summer ESU | Tucannon_S |
| Twisp River | Upper Columbia River ESU | Twisp_SP |
| Chiwawa River | Upper Columbia River ESU | Chiwawa_SP |
| Chewuch River | Upper Columbia River ESU | Chewuch_SP |
Dispersal (often termed ‘straying’) is common among salmon populations. Adipose fin-clipped adults present on the spawning grounds is direct evidence that non-Okanagan origin fish are present in the Okanagan River during spawning. Davis et al. (2007) further evaluated the degree of reproductive isolation of the Okanagan River population by comparing the degree of allelic richness among populations. Allelic richness is a measure of allelic diversity that accounts for sample size (Allendorf et al.2013). The allelic richness (AR) of the fish known to spawn or hatch in the Okanagan River (AR = 10.2) was comparable to the entire adult sample in 2005 (AR = 9.1) and other, larger, nearby populations in the upper Columbia River (Similkameen River AR = 9.4, Wenatchee River AR = 9.3). Heterozygosity was also similar among all sample groups (known Okanagan spawners and offspring heterozygosity = 85%, Okanagan adults 2006 H=85%, Similkameen River heterozygosity = 84%, Wenatchee River heterozygosity = 84%). Taken together, the results of the Davis et al. (2007) study and other unpublished sources suggest that the Okanagan Chinook population is part of a larger metapopulation and is receiving gene flow from nearby populations that likely include the Similkameen (DFO 2008).
The Canadian Okanagan Chinook population is genetically distinct in Canada, and there are no other Columbia River Basin Chinook populations found in Canada. Okanagan Chinook are genetically related to populations that comprise the UCSF ESU, including the Similkameen and Wenatchee populations (Davis et al. 2007 - Appendix B; DFO 2008). Furthermore, there is evidence of gene flow into the Okanagan population from the Similkameen population. Therefore, the Canadian Okanagan River population should be considered part of the larger UCSF Chinook metapopulation.
Two significant impacts on Chinook Salmon population structure are:
- hatcheries, through mixing of wild and hatchery populations via the dispersal of highly abundant hatchery populations when returning to spawn as adults (Williamson and May 2005) (see Threats Section - Agriculture and Aquaculture); and
- dams, through the loss of upstream habitat and changes in upstream and downstream habitat conditions, which impact survival and spawning success (Moore et al. 2010, Burnett et al. 2014) (see Threats Section - Natural Systems Modifications).
Impacts on the Okanagan population structure are due to hatcheries and dams operated in the U.S. portion of the Columbia Basin.
Designatable units
Guidelines outlined in COSEWIC’s Designatable Units for Chinook Salmon in Southern British Columbia (COSEWIC 2015) were used to determine the designatable unit for the Okanagan River Chinook population.
Okanagan River Chinook Salmon are genetically related to nearby U.S. populations that make up the UCSF Chinook ESU (Davis et al. 2007). Genetic evidence based on microsatellites suggests that the UCSF ESU is genetically discrete from all other Chinook populations (Beacham et al. 2006). There is also evidence of local adaptation whereby populations that comprise the UCSF Chinook ESU (ocean-type populations) have evolved different life histories than the stream-type group of populations that make up the upper Columbia River Chinook ESU (Table 3). For example, Waples et al. (2004) found that even though populations spawned in the same or nearby rivers there was no evidence of gene flow between these two groups of populations. Therefore, the populations within the UCSF ESU and the Okanagan River Chinook population are considered a metapopulation (Davis et al. 2007 - Appendix B). Table 3 shows the current population structure for Columbia River Chinook Salmon and the proposed COSEWIC DU designation for Okanagan Chinook Salmon, Okanagan DU.
Historical and a few recent observations of stream-type adult Chinook Salmon in the Okanagan Watershed in March, April and May (Armstrong 2015; Pearl and Allan pers. comm. 2016) may indicate an additional DU in this region; however, there is no genetic information or spawner data to support this conclusion. This report is focused on the summer migrating, ocean-type Chinook Salmon DU in the upper Columbia that return to fresh water in the summer and spawn in October.
| Population | Country | Adult return timing | Life history | Population grouping |
|---|---|---|---|---|
| Hanford Reach | U.S. | Fall | Ocean-type | UCSF Chinook ESU |
| Methow River | U.S. | Summer | Ocean-type | UCSF Chinook ESU |
| Wenatchee River | U.S. | Summer | Ocean-type | UCSF Chinook ESU |
| Similkameen River | U.S. | Summer | Ocean-type | UCSF Chinook ESU |
| Okanogan River | U.S. | Summer | Ocean-type | UCSF Chinook ESU |
| Okanagan River | Canada | Summer | Ocean-type | Okanagan DU |
| Entiat River | U.S. | Spring | Stream-type | upper Columbia River Chinook ESU |
| Methow River | U.S. | Spring | Stream-type | upper Columbia River Chinook ESU |
| Wenatchee River | U.S. | Spring | Stream-type | upper Columbia River Chinook ESU |
UCSF = upper Columbia River summer and fall
Special significance
Okanagan Chinook are the only Columbia River Chinook Salmon population in Canada and are genetically discrete from all other Chinook populations in Canada. Although the Similkameen River originates in Canada, Chinook do not spawn in the Canadian portion of the river due to an impassable waterfall. Okanagan Chinook Salmon also once supported an important First Nations food fishery and commercial trade (Vedan 2002). Currently there are numerous Aboriginal fishing stations along the Okanagan River that are not being used due to the low abundance of returning Okanagan Chinook.
Distribution
Global range
Okanagan Chinook migrate from the Okanagan River in Canada through the U.S. portion of the Columbia River to the Pacific Ocean. The exact ocean distribution of Okanagan Chinook is unknown; however, ocean-type fish from Wells Hatchery, a population within the UCSF ESU, have been caught along the Pacific Coast from Oregon to Alaska (Sharma and Quinn 2012). Ocean-type Chinook Salmon spend 2-5 years rearing in the ocean.
Canadian range
Historically, Chinook Salmon in the Okanagan River were reported from throughout the watershed (Vedan 2002). First Nations have reported that Chinook were once heavily fished at Okanagan Falls (i.e., outlet of Skaha Lake), and that fish were able to reach both Skaha and Okanagan lakes (Ernst, 1999; Ernst and Vedan, 2000). Corroboration is found in the reports of Clemens et al. (1939), Gartrell (DFO, unpublished files, December 1919 and April 1920), and Kelowna Fish and Game Association (DFO, unpublished files, August 1924). During the 1900s, a series of dams and vertical drop structures were placed in the valley for flood control and agricultural water withdrawals. After the dams and vertical drop structures were constructed, the upper limit of Okanagan Chinook spawning distribution was McIntyre Dam. However, since the installation of a fish passage structure at McIntyre Dam in 2009, small numbers (up to 4 individuals) of Chinook have been observed as far upstream as the Penticton Channel between Skaha and Okanagan lakes (Figure 4). The current distribution of Okanagan Chinook is similar to historical distributions (Ernst 1999; Ernst and Vedan 2000; Vedan 2002). Chinook Salmon were never present in the Canadian portion of the Similkameen River due to an impassable 6 m waterfall where the Enloe Dam was constructed (Figure 4) in the U.S. portion of the river (Ernst 2000; Vedan 2002).
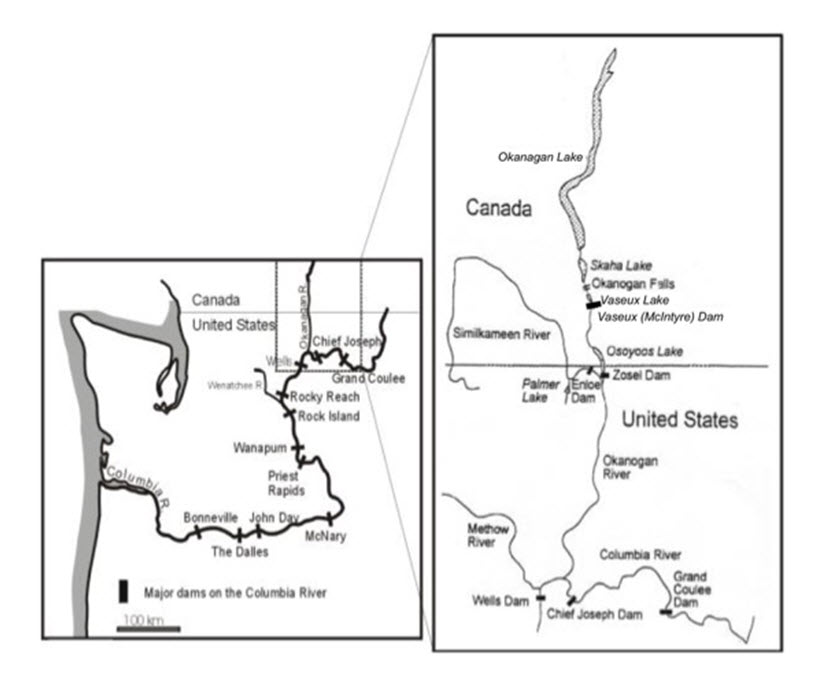
Long description for Figure 4
Two maps showing the Okanagan watershed in relation to British Columbia and Washington State, noting the locations of dams and falls. One map shows an expanded portion of the other map in the area of the international border.
Extent of occurrence and area of occupancy
Okanagan Chinook have a broad distribution in marine waters during juvenile and adult life stages, and while there is not a precise estimate of the EOO, it is certainly > 20 000 km2. Notably, the most spatially contracted life stage is during spawning in the Okanagan River. Okanagan Chinook spawn predominantly in an 8 km-long reach of the Okanagan River that is surveyed annually by the Okanagan Nation Alliance Fisheries Department (ONAFD) during surveys of Sockeye Salmon (Oncorhynchus nerka). Using the COSEWIC 2 x 2 km grid system for calculating index of area of occupancy (IAO), the IAO is estimated at 16 km2. In 2009, the quantity of available spawning and rearing habitat increased as a result of restoration efforts and a new fish passage structure at McIntyre Dam. Such efforts, however, have not yet increased the area of occupancy as the new habitat has not been extensively colonized. In 2015, only 4 out of 112 spawners were observed upstream of McIntyre Dam, which is the highest count for the upstream reach since access has been restored.
Search effort
Since 2001, the ONAFD have enumerated spawning Chinook in the Okanagan River annually during their Sockeye Salmon enumeration program (Long 2002; Wright and Long 2005) (Table 4). Details about these recent surveys are found in the Sampling Effort and Methods section below. Chinook were also seined in the river from 2003 to 2005 (Wright and Long 2005, ONAFD, unpublished files, 2005). The ONAFD surveyed from McIntyre Dam to the Fairview Road Bridge in Oliver, B.C. between 2001 and 2010 (Figure 5). Since fish passage was provided at McIntyre Dam in 2009, the survey area has increased to include the river upstream to Skaha Dam in Okanagan Falls.
| Year | No. of surveys | Start date | End date |
|---|---|---|---|
| 2006 | 12 | 22 Sept | 03 Nov |
| 2007 | 10 | 03 Oct | 05 Nov |
| 2008 | 16 | 17 Sept | 25 Nov |
| 2009 | 18 | 16 Sept | 24 Nov |
| 2010 | 15 | 07 Sept | 04 Nov |
| 2011 | 18 | 14 Sept | 11 Nov |
| 2012 | 13 | 19 Sept | 15 Nov |
| 2013 | 11 | 19 Sept | 04 Nov |
| 2014 | 9 | 03 Oct | 06 Nov |
| 2015 | 11 | 24 Sept | 05 Nov |
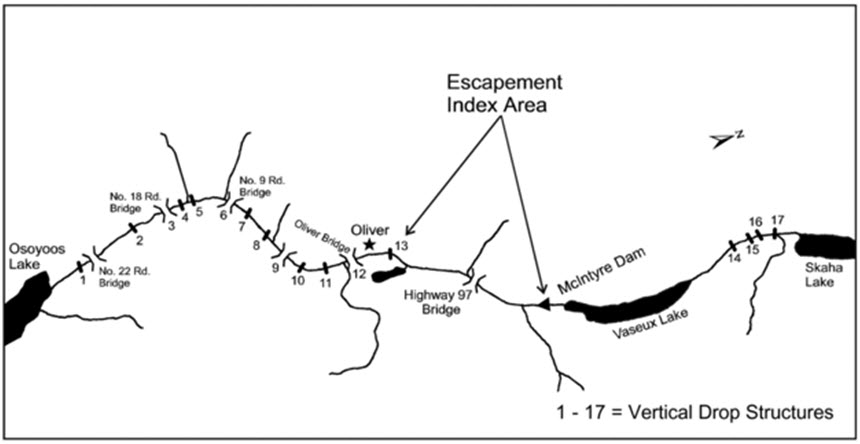
Long description for Figure 5
Map showing sections of the Okanagan River subject to visual surveys by the ONAFD from 2001 to 2015. Vertical drop structures are indicated.
Prior to 2001 there were few formal observations of Chinook Salmon in the Okanagan River. The best historical records (pre-2001) are accounts of the Chinook fishery at Okanagan Falls (Ernst 1999; Ernst and Vedan 2000; Vedan 2002), the Gartrell observation of spawning Chinook in May (DFO, unpublished SEDS files, 1936), Chinook identified as being present in correspondence files from the 1920s to 1999 (DFO, unpublished correspondence files, Kamloops, B.C.), seining of juveniles in Osoyoos Lake in 1971 (Northcote et al. 1972), and annual observations of spawners in the river during Sockeye Salmon enumeration surveys from 1965-2000 (DFO, unpublished SEDS files; Table 5). Overall, search efforts between 1965 and 2000 were inconsistent, and for most years, it was only noted if spawners were present. In years with no data, it is unclear if either spawning grounds were surveyed and no fish were observed or if the spawning grounds were simply not surveyed.
Since 1956, the Washington Department of Fish and Wildlife (WDFW) has been conducting spawning ground surveys in the U.S. Okanogan River (Miller 2004). Surveys have been conducted through aerial redd counts and float or walk surveys in some years (annually since 1991, and sporadically prior to that). It is unknown if the methodology for the aerial surveys has changed throughout the survey years.
| Year | Presence documentation or abundance index |
|---|---|
| 1965 | Present |
| 1966 | NA |
| 1967 | NA |
| 1968 | Present |
| 1969 | Present |
| 1970 | NA |
| 1971 | Present |
| 1972 | Not present |
| 1973 | NA |
| 1974 | NA |
| 1975 | NA |
| 1976 | Present |
| 1977 | 17 |
| 1978 | NA |
| 1979 | NA |
| 1980 | Present |
| 1981 | Present |
| 1982 | Present |
| 1983 | NA |
| 1984 | Present |
| 1985 | NA |
| 1986 | NA |
| 1987 | Present |
| 1988 | NA |
| 1989 | NA |
| 1990 | NA |
| 1991 | NA |
| 1992 | NA |
| 1993 | Present |
| 1994 | Present |
| 1995 | NA |
| 1996 | NA |
| 1997 | Present |
| 1998 | Present |
| 1999 | Present |
| 2000 | Present |
| 2001 | 5 |
| 2002 | 17 |
| 2003 | 35 |
| 2004 | 25 |
| 2005 | 25 |
| 2006 | 43 |
| 2007 | 33 |
| 2008 | 44 |
| 2009 | 8 |
| 2010 | 18 |
| 2011 | 50 |
| 2012 | 20 |
| 2013 | 96 |
| 2014 | 64 |
| 2015 | 112 |
Habitat
Habitat requirements
Chinook Salmon return to natal streams to spawn as mature adults. Upstream migration of summer Chinook Salmon typically occurs in water temperatures ranging from 14°C to 20°C (Bjornn and Reiser 1991). Individuals that experience temperatures > 20°C delay upstream migration (Hallock et al. 1970; Caudill et al. 2013), seeking refuge in coldwater tributaries of the Columbia River (i.e., behavioural thermoregulation; Goniea et al. 2006) until mainstem temperatures return to thermal optima. Like other anadromous fishes, Chinook Salmon can arrive in natal lakes and streams weeks to months prior to spawning. Early-arriving (early to mid-September) Chinook Salmon experience high water temperatures (> 18°C) in the Okanagan River.
Chinook Salmon spawn in a broad range of water depths, velocities, and substrate sizes (e.g., Scott and Crossman 1973, Healey, 1991) in transitional areas between pools and riffles (Bjornn and Reiser 1991). Redd distribution is patchy within apparently uniform habitats, suggesting that other factors such as intra-gravel flow may be critical (Vronskiy 1972). In some cases, however, water depth, velocity and substrate size have been found to be useful predictors of preferred Chinook spawning habitat (Gallagher and Gard 1999). Summer Chinook Salmon prefer to spawn in water with a mean depth > 0.3 m (Briggs 1953, Collings et al. 1972), water velocities ranging from 0.2 to 1.5 m/s (Vronskiy 1972), water temperatures near 16°C (Alderdice and Velsen 1978), low turbidity, and in substrate between 13 and 102 mm (reviewed in Bjornn and Reiser 1991). Chinook Salmon redds have a mean area of 7 m2 (Riebe et al. 2014).
Egg incubation conditions for summer Chinook Salmon include:
- water temperatures between 5.0 and 14.4°C (Bjornn and Reiser 1991),
- intra-gravel dissolved oxygen > 8 mg/L, and
- low concentrations (< 20-30%) of fine sediments that can fill interstitial spaces and starve eggs of oxygen (Tappel and Bjornn 1983).
Since 2001, the ONAFD have been recording characteristics of Okanagan Chinook Salmon spawning sites between Oliver, B.C. and McIntyre Dam by identifying redd size and the presence of holding Chinook Salmon. Data collected over seven years indicate that the water depth and velocity, and substrate size preferred by Okanagan Chinook fall within the ranges outlined above. Fish begin spawning in early October (Figure 6) when water temperatures in the Okanagan River decrease from summer highs (> 18°C) to 16°C (Alderdice and Velsen 1978).
Three separate methods have been used to estimate the capacity of spawning habitat for Chinook Salmon in the Okanagan River:
- the “cells method” estimated a maximum of 4,340 spawning pairs (Phillips et al. 2005);
- the “channel intersection method” yielded an estimate of 1,460 spawning pairs (Phillips et al. 2005);
- a “watershed-area-based” model calculated a maximum estimate of 1,700 spawning pairs (Parken et al. 2006).
These models were developed using average spawning habitat quality from representative Chinook populations and therefore likely overestimate the capacity of spawning habitat in the Okanagan River, which is patchy and of low quality. That being said, it is unlikely that spawning habitat alone is currently limiting abundance (see Population Size and Trends - Abundance).
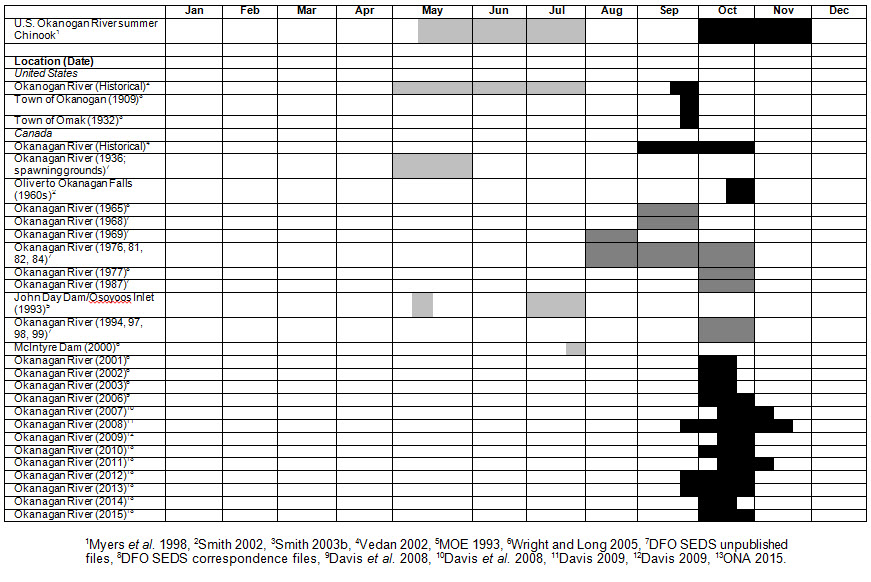
Long description for Figure 6
Matrix illustrating historical and recent Chinook Salmon observations in the Okanagan River and selected historical observations in the upper Columbia River basin, by month. Colour coding of cells indicates adult freshwater migration, spawning, and presence documentation.
Habitat trends
Okanagan River
Habitat quality, quantity and access have been reduced by numerous factors, including water withdrawals, construction of dams (for power generation and water diversion) that limit fish passage or entrain and harm migrating fish, and degradation of habitat through industrial, agricultural and urban usage (Raymond, 1988; Myers et al. 1998). Much of the habitat alteration occurred between 1910 and the 1950s. The Okanagan River channel remained unchanged for 50 years (Davis et al.2007; DFO 2008), but recently there has been a trend toward increasing habitat quality, quantity and access as a result of restoration efforts and improved fish passage.
Modifications to the Okanagan River began in 1910 with changes to the outlet of Okanagan Lake (Machin et al. 2014). Since then, dams have been constructed at the outlets of Okanagan Lake (Penticton Dam), Skaha Lake (Okanagan Falls Dam), Vaseux Lake (McIntyre Dam), and Osoyoos Lake (Zosel Dam in the U.S.). Zosel Dam is regularly passable to upstream migrating fish, and fish passage was provided at McIntyre Dam in 2009, allowing salmonids to access the habitat upstream of Vaseux Lake. While this has increased the available spawning and rearing habitat by 11 river km, the quality of this habitat is currently unknown.
In addition to loss of access to habitat, there have been direct losses of spawning and rearing habitat in the Okanagan River. Much of the river (up to 84%, Machin et al. 2014) between Okanagan and Osoyoos lakes was channelized, straightened, narrowed and dyked in the 1950s (Symonds 2000), leaving only 16% of the river (4.9 km) in a natural or semi-natural state (Machin et al. 2014). Bull (1999) estimated that there has been a 91% loss of natural accessible river channel, and a 90% reduction in riparian vegetation and wetland habitat (Bull et al. 2000). Little is known as to the amount of summer rearing habitat in the river (i.e., groundwater-fed side channels) that has been lost. It is likely that little usable summer habitat remains in the dyked sections of channel due to the absence of side channels and other areas where groundwater inflow may have a significant temperature-moderating effect.
Water temperatures in the Okanagan River prior to the construction of mainstem dams and other channel modifications are unknown. Currently the Okanagan River is used by spawning adults and may be used by rearing juveniles for a period ranging from days to months. High water temperatures in the river may limit the period when mature adults can enter the river, both for migration and spawning, and may limit the area available for rearing juveniles. During the summer months, water temperatures approach the lethal limit for Chinook Salmon (25°C; Myrick and Cech 1998), except in groundwater-fed side channels (ONA 2003). Juvenile salmonids from the Okanagan River have been observed in side channels of the river when temperatures in the mainstem were 24°C (Alexis et al. 2003).
Since 2000, restoration efforts in the Okanagan River have aimed to enhance the quantity and quality of spawning and rearing habitat for salmonids. The Okanagan River Restoration Initiative (ORRI) was initiated in 2000 to return channelized portions of the river to a more natural state. ORRI conducted five restoration projects in the mainstem Okanagan River from 2008 to 2013 to:
- reconnect floodplain habitat,
- re-meander the river,
- connect side channels and oxbows,
- modify in-river structures to enhance fish habitat, and
- create wetland (Machin et al. 2014).
In 2014, ORRI created a 480 m2 (20 x 24 m) Chinook Salmon spawning platform in the Penticton Channel between Skaha and Okanagan lakes. Gravel ranging in size from 50 to 100 mm was used for this platform (Rivard-Sirois 2014), conforming to the gravel size range (40 to 90 mm) that Okanagan Chinook appear to prefer. To date, Chinook Salmon have not been observed using this spawning platform. The ONAFD are conducting surveys to enumerate Okanagan Chinook, assess the distribution of spawners throughout the watershed, and determine if spawners are using this new habitat.
ORRI has conducted two years (2013-2014) of post-restoration aquatic monitoring to date; however, there has been a focused effort on monitoring Sockeye Salmon colonization of spawning platforms. Continued monitoring is required to determine the effectiveness of these restoration efforts specifically for Okanagan Chinook.
Columbia River basin
Hydroelectric dams in the mainstem Columbia River have altered the migration corridor of Chinook Salmon migrating to (adults) and from (juveniles) the Okanagan River. Nine hydroelectric dams are found within the Columbia River Basin: four that are federally operated (Bonneville, Dalles, John Day, and McNary) and five that are operated by Public Utility Districts (Priest Rapids, Wanapum, Rock Island, Rocky Reach, and Wells). Damming and inundating the Columbia River has changed the selection pressures on salmon within the Columbia River - juveniles must survive downstream passage and adults must locate fishways and navigate slack water in reservoirs (Waples et al. 2007).
Environmental conditions in the Columbia River are strongly influenced by dam operations (Angilletta Jr. et al. 2008). Reservoirs increase water residence time and solar gain (Hamblin and McAdam 2003), creating significant thermal stratification upstream of dams. Such stratification has created temperature gradients within fishways, causing slowed and failed upstream migrations of Chinook Salmon (Caudill et al. 2013). Elevated water temperatures in the Columbia River have also influenced predation on out-migrating juvenile salmon (Petersen and Kitchell 2001) and the migration behaviour and rate of adult Chinook Salmon (Goniea et al. 2006).
Pacific Ocean
Increased survival of Columbia River Chinook Salmon since the mid-1990s has coincided with favourable conditions in the Pacific Ocean. Scheuerell and Williams (2005) found evidence that 3- to 4-fold increases (i.e., < 1% to 3-4%) in smolt-to-adult survival of Chinook Salmon were related to coastal upwelling through bottom-up forcing of the marine food web. Coastal upwelling of cool, nutrient-rich water increased primary and zooplankton production, creating favourable foraging conditions for stream-type Chinook Salmon (Scheuerell and Williams 2005). More recently, the decline in the abundance of the populations that comprised the UCSF ESU in the mid-2000s has been attributed to unfavourable ocean conditions from 2002 to 2007 (Hess et al. 2014).
Biology
General biological information presented in the following section draws from two main sources, Healey (1991) and Myers et al. (1998). Characteristics of the Okanagan Chinook population are derived from recent and limited data from a series of reports written by the ONAFD, Aboriginal Traditional Knowledge (Vedan 2002) and sporadic past observations.
Life cycle and reproduction
Chinook Salmon
Chinook Salmon have four distinct life stages, beginning as eggs that are deposited in gravel- and cobble-sized substrate in small to large rivers in late summer and early fall. Eggs incubate over the fall and winter months, and hatch and emerge in the spring. Juvenile life stages vary among populations, and rear in fresh water for either one year (stream-type) or 2-5 months (ocean-type) after emergence and then migrate out to the ocean. Juveniles are typically planktivores in fresh water, but eventually become piscivorous in the marine environment.
Adults return to fresh water to spawn as 3- to 7-year-olds, but most commonly as 4- and 5-year-olds. Age-at-maturity is measured from the time when eggs are deposited to their return as spawners. Return migration timing to fresh water is diverse (Keefer et al. 2004, Parken et al. 2008). Fraser River populations of Chinook Salmon, for example, enter fresh water as early as the first week of April and as late as mid-October (Parken et al. 2008). Return migration timing is correlated with juvenile life history, whereby populations returning earlier in the year are more likely to be dominated by juveniles that out-migrate as stream-types than ocean-types. Like most Oncorhynchus species, Chinook Salmon are semelparous; however, there is some evidence that males that mature as stream-types (precocious parr) can survive to spawn more than once when reared in a hatchery post-spawning (Unwin et al. 1999).
Okanagan chinook salmon
Okanagan Chinook spawn in the fall (Ernst and Vedan 2000; Wright and Long 2005; Armstrong 2015), with most fish spawning in October (Figure 6). Migration timing data for Chinook Salmon in the upper Columbia River, are summarized in Figure 6. Okanagan Chinook spawning is likely initiated by a reduction in water temperatures below 16°C (Healey 1991), which occurs in the Okanagan River in late September or early October (Hyatt and Rankin 1999).
Historically, Chinook Salmon were observed arriving in the Okanagan River upstream of Osoyoos Lake in spring and early summer (Vedan 2002; Armstrong 2015). Spring migrants would have likely resided in the lake over the summer and spawned at a similar time to the summer-fall migrating population (Myers et al. 1998). Ongoing environmental DNA studies suggest the use of small tributaries by Chinook is a characteristic of stream-type populations (Pearl, pers. comm., 2016). Use of small tributaries by spring migrating stream-type Chinook Salmon is confirmed by Aboriginal Traditional Knowledge (Vedan 2002; Armstrong 2015). Spring-run fish were the preferred Chinook run because the fish were firmer, lasted longer, tasted better, and were larger than the summer-fall run (Armstrong 2015). However, the small number of recent returns and the lack of genetic samples makes it unclear if these fish constitute a separate DU. This report focuses on the summer-migrating, ocean-type Okanagan River Chinook population that return to fresh water in the summer (June to August) and spawn in October.
Little information is available on the age distribution of spawners in the Okanagan River. Assessments of the populations in the U.S. Okanogan River, however, have identified approximately 21% as three-year-old males, 44% as four-year-old (both sexes), and 34% as five-year-old (both sexes) (Howell et al. 1985; Chapman et al. 1994). No two-year-old (i.e., age 1+) spawners were recorded in the U.S. Okanogan River and only one percent of spawners were identified as six-year-olds.
In the Okanagan Watershed, most of the small Chinook that have been caught in Osoyoos Lake have been identified as two-year-olds (ONAFD, unpublished data, 2005). Prior to 2005, seven adult Chinook from the Okanagan River were aged; one was a four-year-old (sex unknown), while the other six (three males and three females) were at least five years old (Wright and Long 2005). Of the 23 Chinook sampled from the Okanagan River in 2005, 43% were three-year-olds (5 males, 5 females), 48% four-year-olds (4 males, 7 females), and 9% five-year-olds (1 male, 1 female) (ONAFD, unpublished data, 2005). Taken together, these data suggest that the dominate age-at-maturity is probably 4 years, which is typical of ocean-type populations. This gives a generation time of 4 years.
Juvenile Okanagan Chinook have been observed migrating downstream from the Okanagan River to Osoyoos Lake in late May - early June (Benson, pers. comm., 2015). This juvenile life history is commonly associated with populations that migrate upstream in late summer - early fall.
No survival data exists for any Okanagan Chinook life stage. Generally, egg-to-smolt survival can be highly variable for Chinook populations. Bradford (1995) reviewed 65 years of egg-to-smolt survival across seven populations of Chinook Salmon and found that survival was higher for Chinook than for other Oncorhynchus species (ocean-type Chinook = 8.6%, stream-type Chinook = 6.4%, Sockeye = 2.0%, and Coho = 1.5%). Stream-type Chinook also demonstrated the highest interannual variability in egg-to-smolt survival (Bradford 1995).
Residency and residualization
It has been hypothesized that Okanagan Chinook exhibit an unusual life history characteristic, whereby juveniles rear entirely in fresh water and forgo the anadromous life history. Individuals with anadromous parents that spend their entire lives in fresh water are referred to as residuals, while individuals with non-anadromous parents that spend their entire lives in fresh water are referred to as residents. Chinook juveniles that residualize (typically males) are common in the Columbia River (Ford et al. 2015). Freshwater residency, however, has not been observed in the U.S. portion of the Okanagan Watershed (i.e., Similkameen River). Fish collected in 2003 as potential resident individuals were not Chinook Salmon according to genetic analysis (DFO, unpublished data, 2007). Furthermore, microchemistry analysis of otoliths and stable isotope analysis of tissue indicated that fish thought to have been resident in fresh water actually migrated to the ocean and remained in nearshore areas (Davis 2010).
Physiology and adaptability
Chinook Salmon are ectothermic, whereby changes in water temperature modify physiological functions (e.g., growth, swimming performance, metabolic rate) that can in turn influence survival (Farrell et al. 2008). Lower and upper temperatures for 50% pre-hatch mortality of Chinook Salmon embryos are 3°C and 16°C, respectively (Alderdice and Velsen 1978).
Water percolation through spawning gravel is critical for egg and alevin survival, a requirement that can be severely compromised by siltation of spawning beds (Healey 1991). Shelton (1955) concluded that when percolation rates were at least 0.03 cm/s, survival to hatching was high (> 97%). Eighty-seven percent of fry emerged after hatching when percolation rates were < 0.06 cm/s.
Chinook Salmon exhibit a high degree of life history variation among and within populations, as evidenced by the high degree of variability in the duration of freshwater and saltwater rearing stages, age at maturity, spawning habitat requirements, and rearing habitat requirements (Waples et al. 2001). Moran et al. (2013) suggest that many Chinook Salmon life history traits are either highly plastic or evolutionarily labile. Such variation in life history characteristics also suggests a high degree of adaptability (Healey 1991).
Chinook Salmon have been produced in hatcheries in North America for more than a century. Hatchery-raised Chinook Salmon have been introduced to a wide range of rivers with and without wild Chinook Salmon populations (Myers et al. 1998). Chinook Salmon have also been successfully introduced into the Laurentian Great Lakes (Crawford 2001) and New Zealand rivers (Quinn et al. 2001). Since introduction in the early 1900s (i.e., approximately 20 generations), Chinook Salmon have shown considerable adaptation to local conditions throughout New Zealand (Quinn and Unwin 1993) demonstrating their adaptability.
Dispersal and migration
Fry move downstream primarily at night; however, small numbers move during the day (Healey 1991). Ocean-type Chinook Salmon are commonly found in the nearshore waters of North America; the ocean behaviour of Okanagan Chinook has not been studied to date. Upstream migration of upper Columbia River Chinook, and likely Okanagan River Chinook, occurs from May to July (Keefer et al. 2004) (Figure 6) during daylight hours (Healey 1991). Okanagan River Chinook returning to spawn must either tolerate supraoptimal in-river temperatures in September (16-22°C), or hold downstream of the Okanagan River until water temperatures decrease to approximately 16°C in early October.
Hansen (1996a, b) observed Okanagan Chinook leaving Osoyoos Lake by capturing individuals in a rotary screw trap set 300 m downstream of Zosel Dam. Okanagan Chinook were recorded as an incidental observation to the target species (Sockeye smolts), and little information is provided other than that Chinook Salmon fry were captured in most sampling sessions between April 17 and May 31, 1996. The upstream origin of the observed fry could not be determined. Newly emerged fry were also captured upstream of Osoyoos Lake in April and May (Wright and Long 2005). There are no records of Okanagan Chinook smolts leaving Osoyoos Lake.
Interspecific interactions
Freshwater environment
Predation of juvenile Chinook Salmon is common, whereby piscivorous birds and fish consume juveniles in fresh water, estuarine, and marine environments (Healey 1991). In addition, invertebrate predators have been observed to kill or injure juvenile salmon, but invertebrate predation outside hatchery conditions is not well documented. Mortality rates of 70-90% among fry and fingerling salmon have been recorded for several rivers in the Pacific Northwest (Healey 1991).
Juvenile Chinook Salmon in Osoyoos Lake can be preyed upon by introduced Bluegill (Lepomis macrochirus), Black Crappie (Pomoxis nigromaculatus), Smallmouth Bass (Micropterus dolomieui), Yellow Perch (Perca flavescens) and Largemouth Bass (Micropterus salmoides) (Wright et al. 2002). However, between 2007 and 2009, 203 Yellow Perch were collected for stomach content analysis to determine if juvenile Chinook Salmon were being consumed. Only 4 of the 203 Yellow Perch had fish in their stomachs, of which one contained a salmonid or coregonid. Collectively these data suggest Yellow Perch are not major predators (likely competitors) of juvenile Okanagan Chinook; however, the impact of other introduced species as predators on Okanagan Chinook are unknown.
Chinook fry feed on terrestrial insects, crustacea, chironomids, corixids, caddisflies, mites, spiders, aphids, phantom midge larvae, and ants (Scott and Crossman 1973; Healey 1991). The macrozooplankton community in Osoyoos Lake, upon which rearing Okanagan Chinook feed in part, is dominated by cyclopoids and diaptomids, with substantial populations of Daphnia and Bosmina (Wright et al. 2002). Okanagan Chinook have also been found to be piscivorous, feeding on Sockeye Salmon fry (ONAFD, unpublished data, 2005). The degree of competition for food among cohabiting species of salmon rearing in Osoyoos Lake is unknown.
Mortality from sea mammals and terrestrial and avian predators has likely increased since the damming of the mainstem Columbia River (Myers et al. 1998). Predator control measures have been conducted on the Columbia River as a means of improving downstream smolt survival (Zimmerman 1999, Zimmerman and Ward 1999a, b) and upstream adult survival (Keefer et al. 2012). Predation risk by pinnipeds (California Sea Lions Zalophus californianus, and Steller Sea Lions Eumetopias jubatus) on upper Columbia River Chinook Salmon is low due to relatively low predator densities during the timing of the spawning migration (Keefer et al. 2012).
Okanagan Chinook may also interact with Sockeye Salmon on spawning grounds. Recent and substantial increases in abundance of Okanagan River Sockeye Salmon, and the observation of Sockeye spawning over top of Chinook redds (i.e., redd superimposition), are a cause for concern (Davis 2010). If such an interaction disturbs and displaces Chinook eggs, there would be a subsequent reduction in egg-to-fry survival.
Marine environment
Juvenile Chinook Salmon in the marine environment eat mainly fish, particularly herring, with invertebrates (squids, amphipods, shrimp, euphausiids, crab larvae) comprising the remainder of their diet (Scott and Crossman 1973; Healey 1991). The relative abundance of fish in the stomach contents of commercially caught Chinook Salmon increases with the size of the fish. In general, invertebrate taxa form a relatively small component of the diet of adult Chinook Salmon in the ocean, although there is considerable seasonal and regional variation in diet composition (Healey 1991). The peak feeding periods for Chinook Salmon in the ocean appear to be spring and summer, with spring being the best period in the southern part of their North American range and summer the best period along the coast of Canada (Healey, 1991). Ocean-type Chinook Salmon may experience competition with Pink Salmon (O. gorbuscha) during marine residence, and Ruggerone and Goetz (2004) suggest that the degree of competition may be a function of climate and is greatest during strong El Niño events.
Adult Chinook Salmon comprise 70-80% of the diet of Resident Killer Whales (Orcinus orca) during the summer Killer Whale range along the coast of British Columbia (Ford and Ellis 2006; Ford et al. 2015). While there are no empirical data showing that Killer Whales selectively forage on upper Columbia River summer Chinook Salmon, this ESU comprises a large proportion of ocean-type fish in the Columbia River Basin (McClure et al. 2003) that is made available for Killer Whale feeding off the North Pacific Coast.
Population sizes and trends
Sampling effort and methods
Since 2001, the ONAFD have enumerated Chinook Salmon spawning in the Okanagan River annually during their Sockeye Salmon enumeration program (Long 2002; Wright and Long 2005). Spawning surveys are conducted primarily to count Sockeye Salmon; however, Chinook Salmon are also counted when observed. Surveys are assumed to overlap with the spawning timing of Okanagan Chinook (Benson pers. comm. 2015). Survey methods have included stream walks, spot checks and rafting of specific sites and river reaches including the 8 km reach of semi-natural habitat that Chinook predominantly spawn in (Table 6). Estimates of Okanagan River Chinook abundance are based on summing the counts of live and dead individuals (Benson, pers. comm. 2015). These are likely overestimates of the true population size because counts from each survey are summed and the days between surveys is much lower than the time a typical Chinook would be available to be counted, thus there is a high potential for double counting. Counts of Okanagan Chinook during spawning surveys are likely to be highly uncertain due to the low number of Chinook Salmon and high number of co-spawning Sockeye Salmon (Benson pers. comm. 2015). Uncertainty in the indices of abundance have not been quantified. Observer efficiencies (proportion of fish observed) and survey life (time a fish is in the survey area to be observed) have not been estimated for this population. Therefore, area-under-the-curve (AUC) estimates of abundance have not been generated from these counts.
| Section | Method | Start location | End location |
|---|---|---|---|
| Upper River | Section is enumerated using two methods: (1) two surveyors walking the vertical drop structures and counting the number of fish on the upstream side; and (2) walking the right bank downstream. | Skaha Lake | McIntyre Dam |
| Middle River | Section is enumerated using two methods: (1) a four-person crew rafting downstream with one person enumerating Chinook; and (2) walking the left bank downstream. | McIntyre Dam | Fairview Bridge in Oliver, B.C. |
| Lower River | Section is enumerated by two surveyors walking the VDS structures and counting the number of fish on the upstream side. | Fairview Bridge in Oliver, B.C. | Osoyoos Lake |
Abundance
In 2015, the minimum spawner abundance of Okanagan Chinook increased to 112 individuals (103 live, 9 dead; Figure 7). Spawner abundance data presented in Figure 7 do not include a small number of adipose fin-clipped fish that have been observed during spawning ground surveys; however, the number of confirmed hatchery fish on the spawning grounds can be found in Figure 8. Adipose fin-clipped fish are likely strays from nearby hatchery-supplemented populations in the upper Columbia River. Notably, there are several unknowns about these hatchery strays that have implications for the population assessment of Okanagan Chinook. For example, it is unknown as to the specific hatchery and program (i.e., integrated versus segregated) that these fish are from, as there have been no genetic analyses conducted on adipose fin-clipped fish collected in the Okanagan River. Consequently, it is unknown whether these strays provide a positive (increased abundance of wild fish) or negative (genetic and fitness impacts; see Araki et al. 2007) effect on Okanagan Chinook. COSEWIC Guidelines on Manipulated Populations (Guideline #7 - Supplemented Populations) stipulate that adipose fin-clipped fish should not be considered when assessing adult population size.
Figure 7. Abundance index of Chinook Salmon returning to the Okanagan River from 2001 to 2015. Adipose fin-clipped fish are not included in this abundance index (see Figure 8). Data courtesy of ONAFD.
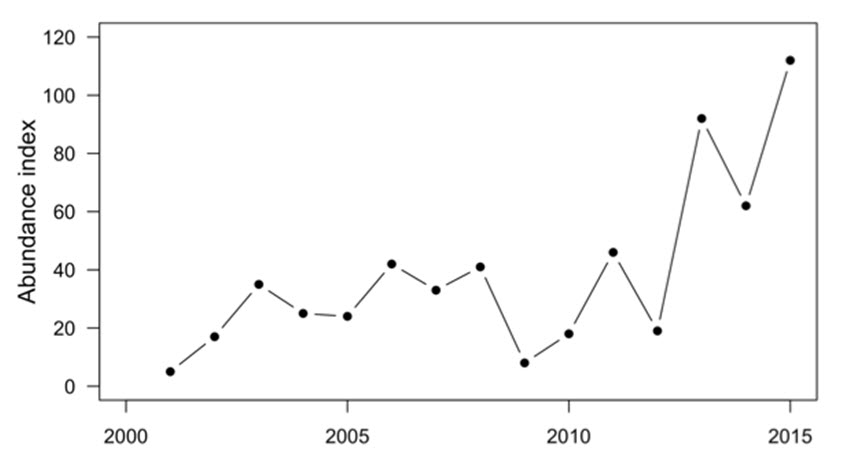
Long description for Figure 7
Chart illustrating abundance index of Chinook Salmon returning to the Okanagan River from 2001 to 2015 (not including adipose fin-clipped fish).
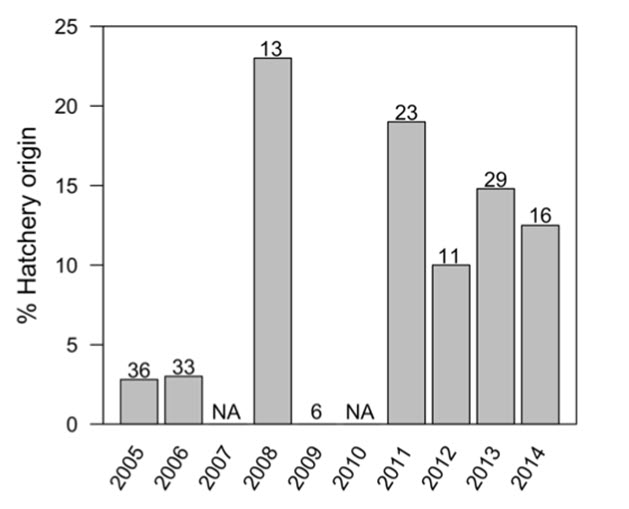
Long description for Figure 8
Chart illustrating percentage of hatchery-origin Chinook Salmon sampled by ONAFD from 2005 to 2014, with sample sizes given above bars.
Fluctuations and trends
Historically, the Okanagan Chinook population was large enough to support an important food, commercial, and economic trade fishery prior to non-native human settlement (Ernst and Vedan 2000; Vedan 2002; Armstrong 2015) and run sizes were likely to be in the several thousands. By 1874, however, it was estimated that over half of the upper Columbia River Chinook Salmon (including the Okanagan) were harvested in the downstream commercial fishery. By the 1890s, there was a marked decline in upper Columbia River Chinook abundance (Moore et al. 2004).
Since 1965, observations made during routine monitoring of Sockeye Salmon escapement have noted the presence of Chinook Salmon (Table 5) (Northcote et al. 1972; Wright and Long 2005). Allen and Meekin (1980) present the only evidence of discontinuity in the presence of Okanagan Chinook in the Okanagan Watershed, where these fish were absent from gillnetting samples in Osoyoos Lake in 1972. However, Okanagan Chinook were captured in gillnet sampling of Osoyoos Lake in 1971 by Northcote et al. (1972).
Spawning ground surveys have been conducted in the U.S. Okanogan and Similkameen Rivers since 1956. Unexpanded redd counts from 1956 to 1998 were relatively stable, and have increased markedly since 1999 (Figure 9). Such an increase is likely due to high run-off during smolt out-migration and improved ocean survival in recent years (Scheuerell and Williams 2005; Bailey pers. comm. 2015). Murdoch and Miller (1999) estimated a spawner escapement of about 1,300 ocean-type Chinook Salmon in 1998, where 47% of these individuals were of hatchery origin. Historical accounts of Chinook in the U.S. Okanogan River do not include run size estimates, but local newspapers between the 1880s and 1930s regularly mentioned active food fisheries (Smith 2003a, b).
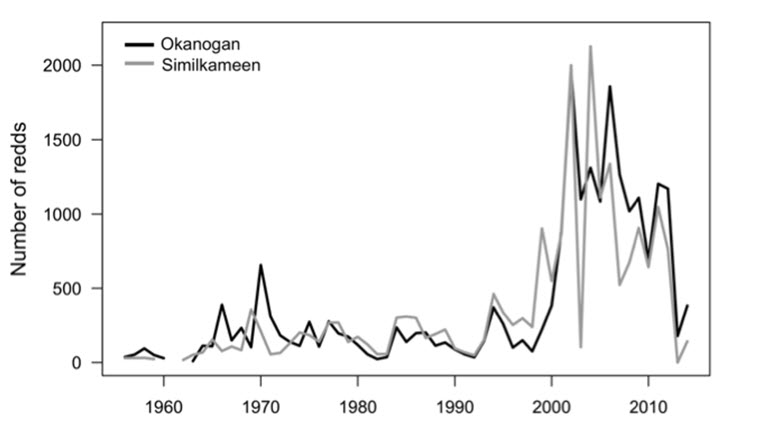
Long description for Figure 9
Chart showing numbers of redds recorded during aerial surveys of the U.S. Okanogon and Similkameen Rivers from 1956 to 2014.
Rescue effect
Five populations (Hanford Reach, Methow River, Wenatchee River, Okanogan River, Similkameen) comprise the UCSF ESU (McClure et al. 2003) and offer potential rescue of Okanagan River Chinook Salmon through the dispersal of colonizers. Annual escapement estimates of these populations date back to the mid-1960s and were generated using fishway counts, redd counts and streamwalk surveys (Table 7). Escapement ranged from 21,110 in 1981 to 266,328 in 2015 in Hanford Reach, 298 in 1983 to 4,630 in 2002 in Methow River, 3,984 in 1998 to 14,330 in 2006 in Wenatchee River, and 341 in 1992 to 13,857 in 2002 in Okanogan River. Although the abundance of the Similkameen River population is low compared to other UCSF ESU populations, several past genetics studies suggest that fish dispersing from the Similkameen River have contributed the largest amount of gene flow (Davis et al.2007 - Appendix B).
Currently there is potential for Chinook Salmon from wild populations and hatcheries in the upper Columbia River to stray into the Okanagan River. Keefer and Caudill (2014) reviewed stray rates for hatchery salmonids in the Columbia River Basin using coded wire tags (CWT) capture data and found that ocean-type Chinook stray rates ranged from 10% to over 55% (mean: 35%) across all studies. Evidence of adipose fin-clipped Chinook Salmon spawning in the Okanagan River also support this conclusion (Figure 8), where the occurrence of hatchery-origin fish in samples has increased over the past ten years (range: 0 to 23% of fish sampled). Fish from the Similkameen River are closely related to Okanagan Chinook due to non-significant differentiation in allele frequencies among the populations (Figure 3). Such genetic relatedness is likely due to interbreeding among populations, and could allow for significant supplementation to the spawner abundance of Okanagan Chinook. Considering the high adaptability of Chinook Salmon (see Biology), and the close proximity of the Okanagan River to the spawning grounds of these U.S. populations, it is possible that these strays would be adapted to the environmental conditions of the Okanagan River. In general, little suitable habitat is available in the Okanagan River (see Habitat Trends); however, the spawning and rearing habitat that is currently available is not fully seeded.
Hatchery production in the upper Columbia River could supplement spawner abundance of Okanagan Chinook. Historically, hatchery production began in the upper Columbia River with facilities on the Methow and Wenatchee Rivers in 1899. In the 1900s, both local and, occasionally, lower Columbia River Chinook populations were used for propagation (Mullan 1987; Myers et al. 1998). From the mid-1990s to mid-2000s, between 300,000 and 1,000,000 stream-type and ocean-type Chinook Salmon were stocked annually in the U.S. Okanogan River (Fish Passage Center 2004).
| Year | Escapement Estimates Hanford Reacho |
Escapement Estimates Methow Riverp |
Escapement Estimates Wenatchee Riverq |
Escapement Estimates Okanogan Riverr |
Escapement Estimates UCSF ESU Total |
Escapement Estimates Okanagan Rivers |
|---|---|---|---|---|---|---|
| 1964 | 29,118 | NA | NA | NA | 29,118 | NA |
| 1965 | 39,873 | NA | NA | NA | 39,873 | NA |
| 1966 | 39,096 | NA | NA | NA | 39,096 | NA |
| 1967 | 38,185 | 3,364 | NA | 955 | 42,504 | NA |
| 1968 | 35,091 | 3,023 | NA | 1,416 | 39,530 | NA |
| 1969 | 42,311 | 1,510 | NA | 810 | 44,631 | NA |
| 1970 | 28,455 | 3,233 | NA | 4,284 | 35,972 | NA |
| 1971 | 34,722 | 2,579 | NA | 2,232 | 39,533 | NA |
| 1972 | 30,500 | 1,491 | NA | 967 | 32,958 | NA |
| 1973 | 46,164 | 1,680 | NA | 843 | 48,687 | NA |
| 1974 | 45,234 | 1,023 | NA | 1,085 | 47,342 | NA |
| 1975 | 43,708 | 1,981 | NA | 2,049 | 47,738 | NA |
| 1976 | 67,758 | 877 | NA | 1,336 | 69,971 | NA |
| 1977 | 73,826 | 1,674 | NA | 1,749 | 77,249 | 17 |
| 1978 | 30,969 | 2,325 | NA | 2,093 | 35,387 | NA |
| 1979 | 34,699 | 2,855 | NA | 1,352 | 38,906 | NA |
| 1980 | 22,812 | 1,584 | NA | 1,314 | 25,710 | NA |
| 1981 | 21,110 | 896 | NA | 819 | 22,825 | NA |
| 1982 | 31,849 | 651 | NA | 385 | 32,885 | NA |
| 1983 | 58,580 | 298 | NA | 424 | 59,302 | NA |
| 1984 | 84,299 | 744 | NA | 2,412 | 87,455 | NA |
| 1985 | 128,202 | 753 | NA | 2,083 | 131,038 | NA |
| 1986 | 162,487 | 753 | NA | 3,298 | 166,538 | NA |
| 1987 | 121,243 | 778 | 9,831 | 1,588 | 133,440 | NA |
| 1988 | 116,169 | 440 | 10,389 | 1,392 | 128,390 | NA |
| 1989 | 79,410 | 561 | 12,764 | 1,652 | 94,387 | NA |
| 1990 | 56,204 | 1,268 | 9,343 | 788 | 67,603 | NA |
| 1991 | 50,730 | 474 | 7,144 | 480 | 58,828 | NA |
| 1992 | 41,269 | 332 | 9,312 | 341 | 51,254 | NA |
| 1993 | 37,254 | 477 | 7,469 | 1,395 | 46,595 | NA |
| 1994 | 62,541 | 961 | 8,006 | 3,572 | 75,080 | NA |
| 1995 | 55,208 | 1,107 | 6,178 | 2,738 | 65,231 | NA |
| 1996 | 43,249 | 615 | 4,946 | 5,374 | 54,184 | NA |
| 1997 | 47,411 | 697 | 4,719 | 2,189 | 55,016 | NA |
| 1998 | 35,393 | 675 | 3,984 | 1,092 | 41,144 | NA |
| 1999 | 30,607 | 986 | 4,376 | 3,617 | 39,586 | NA |
| 2000 | 47,960 | 1,550 | 4,396 | 3,701 | 57,607 | NA |
| 2001 | 61,361 | 2,763 | 9,142 | 10,857 | 84,123 | 5 |
| 2002 | 84,252 | 4,630 | 13,706 | 13,857 | 116,445 | 17 |
| 2003 | 110,907 | 3,930 | 9,695 | 3,420 | 127,952 | 35 |
| 2004 | 86,860 | 2,209 | 8,093 | 6,780 | 103,942 | 25 |
| 2005 | 73,089 | 2,561 | 8,184 | 8,890 | 92,724 | 24 |
| 2006 | 50,017 | 2,733 | 14,330 | 8,601 | 75,681 | 42 |
| 2007 | NA | 1,364 | 4,327 | 4,417 | 10,108 | 33 |
| 2008 | 23,336 | 1,947 | 5,380 | 6,974 | 37,637 | 41 |
| 2009 | 26,044 | 1,758 | 7,449 | 7,544 | 42,795 | 8 |
| 2010 | NA | 2,484 | 7,424 | 5,949 | 15,857 | 18 |
| 2011 | 65,724 | 2,917 | 9,818 | 9,680 | 88,139 | 46 |
| 2012 | 57,631 | 2,947 | 8,532 | 4,952 | 74,062 | 19 |
| 2013 | 174,841 | NA | 10,209 | NA | 185,050 | 92 |
| 2014 | 183,759 | 1,531 | 10,443 | 10,597 | 206,330 | 62 |
| 2015 | 266,328 | NA | 4,185 | NA | 270,513 | 112 |
n Data source: https://fortress.wa.gov/dfw/score/score/maps/map_wria.jsp
o Total escapement estimates based on counts of adult Chinook at McNary Dam minus Chinook counts at Ice Harbor and Priest Rapids dams, minus estimated returns to the Yakima River and Yakima River and Hanford Reach harvest.
p Total escapement estimates based on redd counts from the confluence with the Columbia River upstream to the town of Winthrop (RM 87.2).
q Escapement estimates based on peak redd counts from foot surveys from 1987 to 2013. Escapement estimates from 2014 and 2015 are based on census surveys conducted weekly throughout spawning.
r Total escapement estimates based on redd counts in the mainstem Okanogan and Similkameen (Okanogan tributary) rivers in 1996 to 2009, 2012 and 2014. Escapement estimates from 1967 to 1995 and 2010-2011 are total abundance estimates based on redd counts in the mainstem Okanogan only.
s Data courtesy of ONAFD.
Several hatcheries propagate Chinook Salmon in the upper Columbia River. Ocean-type (sub-yearling) fish produced in hatcheries have the potential to rescue Okanagan River Chinook Salmon; stream-type (yearling) fish are not considered in this report. Broadly, these hatcheries have two separate programs that differ in their objectives and methods. Integrated programs use wild brood to conserve and replenish wild populations of upper Columbia River salmonids. Segregated programs use hatchery brood to provide additional opportunities for harvest and subsistence (Pearl pers. comm. 2016). Individuals propagated from Wells Hatchery and Chief Joseph Hatchery (CJH) have the potential to rescue Okanagan River Chinook Salmon by dispersing to the Okanagan River.
Since 1993, the Wells Hatchery has been releasing summer and fall migrating ocean-type Chinook Salmon smolts into the Columbia River as part of a segregated program (Table 8; Snow et al. 2014). On average the Wells Hatchery releases 426,461 smolts annually (range: 187,382 - 541,923; Table 9), whereby fish are adipose fin-clipped and tagged with a CWT. To date, the adipose fin-clipped hatchery-origin fish found on spawning grounds in the Okanagan River were most likely strays from Wells Hatchery but their origin has not been confirmed.
| Information | Wells Hatchery | Chief Joseph Hatchery | Chief Joseph Hatchery |
|---|---|---|---|
| Location | Wenatchee, Washington | Bridgeport, Washington | Bridgeport, Washington |
| Program | Segregated | Integrated | Segregated |
| Marking methods | AFC, CWT | AFC, CWT and PIT | AFC, CWT and PIT |
| Broodstock origin | Wells Hatchery Channel Trap (hatchery origin) and Wells Dam Fishway (wild origin) | Okanogan River (wild origin) | Okanogan River (hatchery origin) |
| Release location | Columbia River at Wells Hatchery | Okanogan (at Omak, Riverside and Tonasket, Washington) and Similkameen Rivers | Columbia River at Chief Joseph Dam |
Notes: AFC = adipose fin-clipped, CWT = code-wire-tag, PIT = passive integrated transponder.
Segregated hatchery programs use hatchery brood to provide additional opportunities for harvest and subsistence.
Integrated hatchery programs use wild brood to conserve and replenish wild populations of upper Columbia River salmonids.
All fish at Wells Hatchery are marked with an adipose fin-clip and tagged with a CWT.
All fish at Chief Joseph Dam Hatchery are marked with an adipose fin-clip and a subset of 100,000 fish are tagged with a CWT.
Other nearby hatchery facilities (Methow Hatchery, Carlton Rearing Pond, Dryden Pond) release yearling Chinook Salmon.
| Brood Year | Wells Hatcheryt Segregated |
Chief Joseph Hatcheryu Integrated |
Chief Joseph Hatcheryu Segregated |
|---|---|---|---|
| 1993 | 187,382 | NA | NA |
| 1994 | 450,935 | NA | NA |
| 1995 | 408,000 | NA | NA |
| 1996 | 473,000 | NA | NA |
| 1997 | 541,923 | NA | NA |
| 1998 | 370,617 | NA | NA |
| 1999 | 363,600 | NA | NA |
| 2000 | 498,500 | NA | NA |
| 2001 | 376,027 | NA | NA |
| 2002 | 473,100 | NA | NA |
| 2003 | 425,271 | NA | NA |
| 2004 | 471,123 | NA | NA |
| 2005 | 430,203 | NA | NA |
| 2006 | 396,538 | NA | NA |
| 2007 | 402,527 | NA | NA |
| 2008 | 427,131 | NA | NA |
| 2009 | 471,286 | NA | NA |
| 2010 | 442,821 | NA | NA |
| 2011 | 492,777 | NA | NA |
| 2012 | NA | NA | NA |
| 2013 | NA | 186,050 | 256,656 |
| 2014 | NA | 300,546 | 375,315 |
| 2015 | NA | 222,000 | 240,000 |
t Data from Snow et al. 2014
u Data provided by A. Pearl (Colville Confederated Tribes)
The CJH was initiated in 2013 and has integrated and segregated programs. Under the integrated program, where wild brood are collected from the U.S. Okanogan and Methow Rivers, stream-type and ocean-type juvenile Chinook Salmon are released in the U.S. Okanogan (at Omak, Riverside, and Tonasket, Washington) and Similkameen Rivers. Under the segregated program, fish are released exclusively into the Columbia River at Chief Joseph Dam. All fish are adipose fin-clipped, with a subset being tagged with CWT or passive integrated transponder (PIT) tags (Table 8). The CJH released 186,050, 300,546 and 222,000 ocean-type Chinook Salmon smolts in 2013, 2014 and 2015, respectively, as part of the integrated program (Table 9). In the future, the CJH proposes to release between 200,000 and 400,000 ocean-type smolts into the U.S. Okanogan and Similkameen Rivers from 2016 to 2018 (Pearl pers. comm. 2016). Similar numbers of spring migrating stream-type Chinook will be released into the U.S. Okanogan River from 2016 to 2019. With four-year-olds being the dominant life history of ocean-type Chinook Salmon, it is anticipated that the vast majority of ocean-type fish released in 2014 will return to the U.S. Okanogan and Columbia Rivers in 2017.
No other Canadian Chinook Salmon populations are able to repopulate the Okanagan Chinook population simply due to a lack of access to this watershed. Transplanting other populations of Canadian Chinook Salmon into the Okanagan River is not a viable option for recovery as there are no other populations within Canada that migrate through the Columbia River.
It is clear that hatchery-produced Chinook have strayed into the Okanagan River. It is also possible that fish originating from spawning in the Similkameen River may have strayed into the Okanagan but this has not been demonstrated. It is also unknown whether strays provide positive (increase in the abundance of wild fish) or negative (genetic and fitness impacts) effects on Okanagan Chinook. While there may be adequate physical habitat for migrants because of restoration efforts, high water temperatures, water pollution and water withdrawals continue to be problematic (see below). Therefore, it is unclear whether these strays can mitigate extinction risk (rescue) of the Okanagan Chinook DU.
Threats and limiting factors
The overall threats to Okanagan Chinook were scored High-Medium (Appendix 1). The main threats are described below.
Agriculture and aquaculture
Broodstock collection for hatcheries in the upper Columbia River could potentially intercept Okanagan River Chinook Salmon. In 2014 and 2015, 656 U.S. Okanogan River Chinook were collected each year for broodstock (Colville Confederated Tribes 2014, 2015). Future fish collection will increase if juvenile release targets are to be met. Currently the program objectives are to take wild broodstock from the U.S. Okanogan River Chinook population. For context, the number of fish taken for broodstock in 2014 and 2015 was 10% and 4% of the number of fish harvested in-river, upstream of Wells Dam, respectively (Table 10), and likely less than 0.5% of the fish taken in fisheries below Wells Dam in both years.
Hatcheries have been shown to negatively affect the genetics and fitness of wild populations (Araki et al. 2007; Williamson et al. 2010; Neff et al. 2015). This topic has been extensively reviewed for salmonid populations, and studies show that even when hatchery-reared fish are taken from wild broodstock (integrated program), they have lower fitness than their wild-born and -reared counterparts (Araki et al. 2008). Genetic and fitness impacts are likely greater for hatchery programs that use hatchery broodstock (segregated program) (Araki et al.2007). Of course, these negative effects are particularly important to consider when the potential supplementation is large relative to the recipient population size, in this case the number of strays from nearby hatcheries relative to the abundance of the recipient population (Okanagan Chinook). Not knowing the specific program in which the hatchery-origin fish found in the Okanagan River were propagated highlights the uncertainty in the broodstock origin and thus the potential effects on Okanagan Chinook. High extinction risk associated with a small population may outweigh any risk of supplementation on the populations’ genetics or fitness; this trade-off has not been explored for Okanagan Chinook.
| Year | Wells Dam abundance | Okanogan Mouth Purse Seine | WDFW Tangle Net and Beach Seine | Below CJD Snag Fishery | Columbia River Tribal Platform | Okanogan River Net and Weir | Harvest by CCT (% Wells Dam abundance) | Estimated exploitation rate by catch year (%) |
|---|---|---|---|---|---|---|---|---|
| 2011 | 29,821 | 146 | 0 | 1,413 | 10 | 0 | 1,569 (5.3%) |
1.4% |
| 2012 | 38,588 | 1,763 | 75 | 1,384 | 19 | 0 | 3,241 (8.4%) |
2.1% |
| 2013 | 49,451 | 1,205 | 13 | 1,961 | 39 | 16 | 4,679 (9.5%) |
2.3% |
| 2014 | 49,255 | 582 | 0 | 2,330 | 19 | 270 | 6,313 (12.8%) |
- |
| 2015 | 62,129 | 705 | 0 | 8,984 | 12 | 19 | 16,527 (26.6%) |
- |
Additional exploitation is calculated by multiplying the percent of fish that escaped harvest downstream of Wells Dam (Table 11) by the percentage of fish that escaped harvest by the CCT upstream of Wells Dam. Note that these estimates do not account for incidental mortalities or drop-back at Wells Dam, and assume harvest is equal among age classes. WDFW = Washington Department of Fish and Wildlife.
CJD = Chief Joseph Dam. CCT = Colville Confederated Tribes.
Biological resource use
Historical and current fishing impacts on Okanagan Chinook have been substantial. Okanagan Chinook are part of a complex of populations that spawn in tributaries of the upper Columbia River (DFO 2008). This complex is fished from southeast Alaska to the mouth of the Columbia River, as well as large in-river fisheries as they migrate up the Columbia River and in the U.S. Okanogan River. Okanagan Chinook Salmon likely migrate with the upper Columbia River summer Chinook Salmon, although direct observations to confirm this are not available. Information presented in this section is largely derived from data collected and analyzed by the Pacific Salmon Commission (Parken pers. comm. 2016).
The Joint Chinook Technical Committee (CTC) of the Pacific Salmon Commission use 36 indicator populations to monitor exploitation rates (ER) of Chinook in the ocean (PSC 2003). Well’s Hatchery is the one exploitation indicator for upper Columbia summer Chinook populations. Exploitation rates are tracked using CWT implanted in juveniles before being released at the hatchery. CWT recoveries in all fisheries (including associated incidental mortality) and escapement are used to reconstruct cohort size by brood year for each indicator stock. Based on these data, total fishing mortalities by catch year (Figure 10) and brood year (Figure 11) exploitation rates are estimated. Updates to the cohort reconstruction model may result in slight differences between the data presented here and the previous assessment (COSEWIC 2006); the data presented herein should be considered up-to-date. Estimates of uncertainty for exploitation rates range from 20 to 50% standard error (i.e., one standard error is within 20 to 50% of the mean estimate) (Pacific Salmon Commission Coded Wire Tag Working Group 2008). Uncertainty in exploitation rate estimates decrease with increasing exploitation rates (i.e., higher tag recovery); therefore, estimates for upper Columbia River summer Chinook Salmon are likely in the lower end of the uncertainty range given the high exploitation rates in most years (Pacific Salmon Commission Coded Wire Tag Working Group 2008).
The overall exploitation rate of upper Columbia River summer Chinook up to Wells Dam has been very high over the past 10 years, averaging 76% (Figure 10). Canadian exploitation rates by catch year have been consistently lower than U.S. exploitation rates (Parken pers. comm. 2016; Figure 10 and 11). Between 2004 and 2013, the south U.S. fishery has accounted for nearly half of the exploitation of upper Columbia River summer Chinook Salmon (ER from 31 to 51%) (Table 11). In Canada, the highest estimated ERs are in Northern B.C. (ER from 4 to 14%) and the west coast of Vancouver Island (ER from 5 to 15%) (Table 11). Total exploitation rates by catch year have been high with a slight downward trend for the Canadian fishery since 2004 (ER from 69 to 82%) (Figure 10) when compared to historical exploitation rates pre-2004 (ER from 27 to 90%). When exploitation rates by catch year are summarized by country, there appears to be a decline in Canadian exploitation rates and an increase in U.S. exploitation rates for all Chinook Salmon fisheries in each country (Figure 10 aligned by catch year, and 11 aligned by year of spawning).
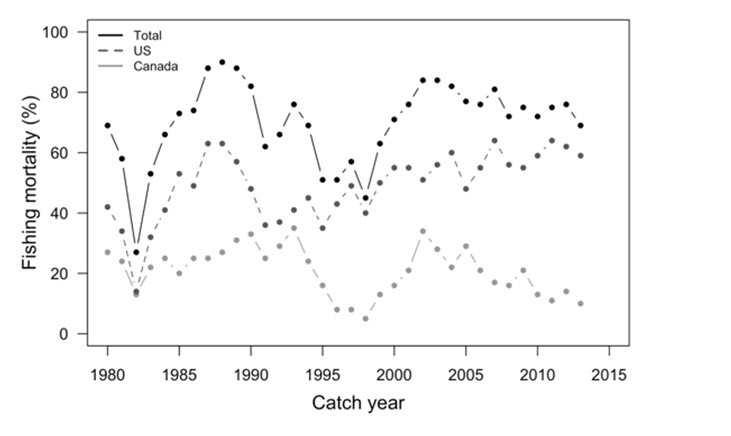
Long description for Figure 10
Chart illustrating upper Columbia River summer Chinook Salmon (Well’s Hatchery indicator population) fishing mortality (percentages) by catch year for Canadian and U.S. fisheries from 1980 to 2013.

Long description for Figure 11
Chart illustrating upper Columbia River summer Chinook Salmon (Well’s Hatchery indicator population) fishing mortality (percentages) by brood year for Canadian and U.S. fisheries from 1975 to 2008.
| Year | Aggregated Abundance Based Management Northern BC T |
Aggregated Abundance Based Management Northern BC S |
Aggregated Abundance Based Management WCVI T |
Aggregated Abundance Based Management WCVI S |
Aggregated Abundance Based Management Central BC T |
Aggregated Abundance Based Management Central BC N |
Aggregated Abundance Based Management Central BC S |
Aggregated Abundance Based Management Georgia Straight T |
Aggregated Abundance Based Management Georgia Straight N |
Aggregated Abundance Based Management Georgia Straight S |
Individual Stock Based Management Northern BC N |
Individual Stock Based Management Northern BC S |
Individual Stock Based Management Northern BC S |
Individual Stock Based Management WCVI N |
Individual Stock Based Management WCVI S |
SEAK T |
SEAK N |
SEAK S |
South U.S. (WA/OR) T |
South U.S. (WA/OR) N |
South U.S. (WA/OR) S |
Esc |
|---|---|---|---|---|---|---|---|---|---|---|---|---|---|---|---|---|---|---|---|---|---|---|
| 1977 | See v | See v | See v | See v | See v | See v | See v | See v | See v | See v | See v | See v | See v | See v | See v | See v | See v | See v | See v | See v | See v | See v |
| 1978 | See v | See v | See v | See v | See v | See v | See v | See v | See v | See v | See v | See v | See v | See v | See v | See v | See v | See v | See v | See v | See v | See v |
| 1979 | See v | See v | See v | See v | See v | See v | See v | See v | See v | See v | See v | See v | See v | See v | See v | See v | See v | See v | See v | See v | See v | See v |
| 1980 | 9% | 0% | 11% | 0% | 2% | 0% | 0% | 1% | 0% | 1% | 2% | 0% | 0% | 0% | 0% | 29% | 1% | 1% | 2% | 8% | 2% | 31% |
| 1981 | 8% | 0% | 7% | 0% | 3% | 0% | 2% | 0% | 1% | 0% | 2% | 0% | 0% | 0% | 0% | 26% | 0% | 1% | 1% | 5% | 2% | 42% |
| 1982 | 5% | 0% | 5% | 0% | 0% | 1% | 0% | 0% | 1% | 0% | 1% | 0% | 0% | 0% | 0% | 9% | 0% | 0% | 1% | 3% | 1% | 73% |
| 1983 | 12% | 0% | 4% | 0% | 2% | 2% | 0% | 0% | 0% | 0% | 1% | 0% | 0% | 0% | 0% | 23% | 0% | 0% | 1% | 7% | 0% | 47% |
| 1984 | 11% | 0% | 9% | 0% | 2% | 0% | 0% | 0% | 0% | 0% | 1% | 0% | 0% | 0% | 0% | 21% | 1% | 0% | 0% | 16% | 2% | 34% |
| 1985 | 8% | 0% | 8% | 0% | 0% | 0% | 0% | 0% | 2% | 0% | 2% | 0% | 0% | 0% | 0% | 16% | 3% | 0% | 1% | 29% | 4% | 27% |
| 1986 | 8% | 0% | 13% | 0% | 2% | 1% | 0% | 0% | 0% | 0% | 1% | 0% | 0% | 0% | 0% | 10% | 1% | 0% | 2% | 32% | 4% | 26% |
| 1987 | 13% | 0% | 9% | 1% | 2% | 0% | 0% | 0% | 0% | 0% | 0% | 0% | 0% | 0% | 0% | 19% | 2% | 0% | 2% | 36% | 4% | 12% |
| 1988 | 10% | 0% | 14% | 0% | 1% | 1% | 0% | 0% | 0% | 0% | 1% | 0% | 0% | 0% | 0% | 11% | 2% | 0% | 2% | 44% | 3% | 10% |
| 1989 | 14% | 0% | 13% | 1% | 0% | 0% | 0% | 0% | 1% | 1% | 1% | 0% | 0% | 0% | 0% | 14% | 1% | 0% | 7% | 33% | 2% | 12% |
| 1990 | 11% | 0% | 19% | 0% | 1% | 1% | 0% | 0% | 0% | 0% | 1% | 0% | 0% | 0% | 0% | 15% | 0% | 1% | 5% | 25% | 3% | 18% |
| 1991 | 7% | 0% | 14% | 1% | 1% | 1% | 0% | 0% | 1% | 0% | 1% | 0% | 0% | 0% | 0% | 9% | 1% | 2% | 5% | 14% | 5% | 38% |
| 1992 | 5% | 0% | 19% | 0% | 1% | 0% | 0% | 0% | 0% | 0% | 2% | 0% | 0% | 0% | 1% | 14% | 1% | 0% | 4% | 12% | 6% | 34% |
| 1993 | 8% | 0% | 24% | 1% | 0% | 0% | 0% | 0% | 0% | 0% | 1% | 0% | 0% | 0% | 0% | 17% | 0% | 0% | 3% | 15% | 6% | 24% |
| 1994 | 10% | 2% | 9% | 1% | 0% | 0% | 0% | 0% | 0% | 0% | 1% | 1% | 0% | 0% | 0% | 14% | 3% | 0% | 0% | 17% | 11% | 31% |
| 1995 | 3% | 0% | 12% | 0% | 0% | 0% | 0% | 0% | 0% | 0% | 1% | 0% | 0% | 0% | 0% | 14% | 0% | 3% | 1% | 12% | 5% | 49% |
| 1996 | 2% | 0% | 2% | 0% | 0% | 0% | 0% | 0% | 0% | 1% | 2% | 0% | 0% | 0% | 10% | 1% | 0% | 3% | 23% | 7% | 49% | blank cell |
| 1997 | 4% | 1% | 2% | 0% | 0% | 0% | 0% | 0% | 0% | 0% | 0% | 0% | 0% | 0% | 18% | 1% | 6% | 4% | 14% | 8% | 43% | blank cell |
| 1998 | 1% | 3% | 0% | 0% | 0% | 0% | 0% | 0% | 0% | 0% | 0% | 0% | 0% | 0% | 17% | 3% | 3% | 2% | 9% | 6% | 55% | blank cell |
| 1999 | 7% | 1% | 0% | 3% | 0% | 0% | 1% | 0% | 0% | 1% | 0% | 0% | 0% | 1% | 20% | 0% | 4% | 6% | 12% | 8% | 37% | blank cell |
| 2000 | 1% | 2% | 5% | 6% | 0% | 0% | 0% | 0% | 1% | 1% | 0% | 0% | 0% | 0% | 33% | 2% | 4% | 3% | 7% | 5% | 29% | blank cell |
| 2001 | 1% | 1% | 15% | 3% | 0% | 0% | 1% | 0% | 0% | 0% | 0% | 0% | 0% | 0% | 19% | 3% | 2% | 19% | 4% | 9% | 24% | blank cell |
| 2002 | 14% | 2% | 15% | 1% | 0% | 0% | 0% | 0% | 0% | 0% | 0% | 0% | 0% | 0% | 27% | 0% | 2% | 10% | 4% | 8% | 16% | blank cell |
| 2003 | 13% | 2% | 11% | 1% | 0% | 0% | 0% | 0% | 0% | 0% | 0% | 1% | 0% | 0% | 31% | 1% | 1% | 7% | 7% | 9% | 16% | blank cell |
| 2004 | 6% | 2% | 12% | 1% | 0% | 0% | 0% | 0% | 0% | 0% | 0% | 0% | 0% | 0% | 17% | 1% | 1% | 10% | 13% | 17% | 18% | blank cell |
| 2005 | 10% | 4% | 13% | 2% | 0% | 0% | 0% | 0% | 0% | 0% | 0% | 0% | 0% | 0% | 15% | 0% | 1% | 8% | 12% | 12% | 23% | blank cell |
| 2006 | 6% | 1% | 11% | 2% | 0% | 0% | 0% | 0% | 0% | 0% | 0% | 0% | 0% | 0% | 17% | 1% | 1% | 3% | 17% | 16% | 24% | blank cell |
| 2007 | 3% | 3% | 8% | 2% | 0% | 1% | 0% | 0% | 0% | 0% | 0% | 0% | 0% | 0% | 15% | 3% | 2% | 5% | 13% | 25% | 19% | blank cell |
| 2008 | 2% | 1% | 8% | 4% | 0% | 0% | 0% | 0% | 0% | 0% | 0% | 1% | 0% | 1% | 13% | 0% | 0% | 4% | 25% | 14% | 28% | blank cell |
| 2009 | 4% | 1% | 6% | 7% | 0% | 0% | 0% | 0% | 0% | 1% | 0% | 0% | 0% | 1% | 16% | 1% | 1% | 2% | 23% | 12% | 25% | blank cell |
| 2010 | 2% | 2% | 7% | 1% | 0% | 0% | 0% | 0% | 0% | 1% | 0% | 0% | 0% | 0% | 10% | 0% | 2% | 8% | 28% | 11% | 28% | blank cell |
| 2011 | 2% | 2% | 3% | 3% | 0% | 0% | 0% | 0% | 0% | 0% | 0% | 1% | 0% | 0% | 13% | 0% | 1% | 4% | 29% | 17% | 25% | blank cell |
| 2012 | 4% | 1% | 5% | 3% | 0% | 0% | 0% | 0% | 0% | 0% | 0% | 0% | 0% | 0% | 14% | 1% | 1% | 9% | 15% | 22% | 24% | blank cell |
| 2013 | 3% | 1% | 2% | 2% | 0% | 0% | 0% | 0% | 0% | 0% | 0% | 0% | 0% | 0% | 7% | 0% | 0% | 6% | 29% | 16% | 31% | blank cell |
| 2014 | See w | See w | See w | See w | See w | See w | See w | See w | See w | See w | See w | See w | See w | See w | See w | See w | See w | See w | See w | See w | See w | blank cell |
v From 1977-1979, the CWT program for this stock did not have all cohorts marked with CWTs. Thus, the summary stats were not reported.
w Escapement data are not yet available for 2014
Harvest of Chinook Salmon above Wells Dam is not accounted for in the Pacific Salmon Commission exploitation rate estimates. Fish are harvested in five fisheries in the mainstem Columbia River and in the U.S. Okanogan River (Table 10). Harvest rates on the fish that pass Wells Dam ranged from 5.3 to 26.6% from 2011 to 2015 (Table 10). Over the same years, both the abundance of upper Columbia River summer Chinook Salmon past Wells Dam and harvest rates have increased steadily. Abundances and harvest rates are likely to increase given the planned releases of juvenile Chinook Salmon from the CJH. The addition of this harvest to the total exploitation rates by catch year increases the estimates of exploitation rates by 1.4, 2.1, and 2.3% in 2011, 2012, and 2013, respectively (Table 10). Note that these estimates do not account for incidental mortalities or fallback at Wells Dam, and assume harvest is equal among age classes, and thus provide a coarse estimate of additional exploitation.
Other fisheries that may catch Chinook Salmon as bycatch have not been accounted for in any of the exploitation or harvest rate data presented herein. Substantial numbers of Chinook Salmon may be intercepted as bycatch in the Pacific Coast groundfish fishery (managed by the Pacific Fishery Management Council), Bering Sea - Aleutian Island and Gulf of Alaska groundfish fishery (managed by the North Pacific Fishery Management Council) (Dygert 2012), and the Pacific sardine fishery (managed by the Pacific Fishery Management Council). Chinook Salmon bycatch can be as high as 129,000 fish (in 2007) in the Bering Sea - Aleutian Island fishery (Dygert 2012). The impact of these fisheries on upper Columbia River summer Chinook Salmon is unknown. No summaries exist for Chinook Salmon bycatch in Canadian fisheries (Parken pers. comm. 2016).
Natural systems modifications
Fire and fire suppression
Wildfires are a common occurrence in the Okanagan. Fires in the region are anticipated to increase in incidence and severity in the future (Nitschke and Innes 2008), and thus pose a potential threat to habitat and salmonids in the Okanagan River. Recent research has suggested that wildfires can generate thermal heterogeneity in aquatic ecosystems and increase stream temperature (Amaranthus et al.1989; Isaak et al.2010), resulting in environmental conditions that can stress the bioenergetics of salmonids (Beakes et al.2014). In addition, the use of fire-retardant chemicals and suppressant foams can pose a risk to the health of aquatic ecosystems (Backer et al.2004). No research has been conducted to date on the impacts of wildfires and fire suppression practices on Okanagan Chinook.
Dams
Okanagan River Chinook Salmon migrate over 990 km in the Columbia River on their way to and from the ocean, passing through nine hydroelectric dams. The impacts of dams on salmonid migrations and survival are well documented (Nehlsen et al. 1991, Caudill et al. 2007, Burnett et al. 2014). For example, Caudill et al. (2007) show that Snake River adult Chinook Salmon migrating upstream slow their migration around hydroelectric dams, leading to increased mortality. Caudill et al. (2007) evaluated the percent of successful migrants that passed each dam, four of which (Bonneville, Dalles, John Day, and McNary) are also passed by Okanagan River Chinook. Mortality rates associated with the dams common to both populations were the highest (6 to 13%) out of the eight dams examined. Note that these mortality estimates do not represent the cumulative mortality (i.e., total migration mortality). In another study, Ferguson et al. (2005) estimated total migration mortalities of 15 to 20% for adult Snake River Chinook Salmon through the same network of dams. It is reasonable to assume that these estimates of total migration mortality could be similar for Okanagan Chinook.
Mortality rates for out-migrating smolts are estimated to be between 9 and 14% at each dam for stream-type Chinook Salmon (summarized in Moore et al. 2004), which suggests that approximately 26 to 43% of the smolts that leave the Okanagan River make it through Bonneville Dam. Such estimates of migration mortality are a combination of natural and dam-related mortalities. While it is difficult to disentangle these two sources of mortality, there is a substantial body of work that provides a weight of evidence that the presence of dams along migration corridors negatively impacts salmonid survival.
Water withdrawal
The Okanagan Watershed is in a semi-arid region of British Columbia and experiences dry conditions throughout the year with an annual rainfall of 300-400 mm. Consequently, there have been long-standing challenges around water management in the watershed. Specifically, the trade-offs among water demands for the economically important agricultural industry, flood control, and water for fish have been difficult to manage (DFO 2008). Between 1982 and 1997, there was frequent non-compliance with river and lake levels set out in the Okanagan Watershed Implementation Agreement. This led to a water management initiative directed at improving decision-making for the benefit of fish in the mainstem river and lakes (Hyatt and Stockwell 2013). During this process, a fish and water management tool was developed that would be used to improve compliance. Hyatt et al. (2015) show that the use of the Fish Water Management Tool has dramatically improved water management over an 11-year period (2003 to 2013) by increasing the frequency of fish friendly flows while minimizing damage to water management structures, agriculture, or riparian areas. Although there have been major improvements to water management since 2002, water withdrawals remain a significant threat to Okanagan River salmonids, especially in the face of climate change and increasing human demands for water (Merritt et al. 2006) (see Threats - Climate Change section).
Invasive and other problematic species and genes
Invasive freshwater shrimp, Mysis diluviana, have been introduced into the Okanagan Watershed. M. relicta has been present in Osoyoos Lake since at least 1998 (Hyatt and Rankin 1999), having invaded from upstream lakes where it is well established. Limnetic fish populations typically exhibit a decrease in abundance after an M. relicta invasion (Lasenby et al. 1986), and this has already been documented for Kokanee (Oncorhyncus nerka) populations in Okanagan Lake. While Chinook Salmon are more often found in littoral areas and feed less on zooplankton (i.e., less competition with mysids), this behaviour has not been established for Osoyoos Lake, where the littoral zone is likely inaccessible through much of the growing season due to high water temperatures (ONAFD, unpublished data 2005). Little information is available on the potential impacts of M. relicta on the short freshwater residency of juvenile Okanagan Chinook.
Invasive Eurasian Milfoil (Myriophyllum spicatum) has spread rapidly in Okanagan littoral areas and provides additional habitat for invasive ‘ambush’ predator species such as largemouth bass (Wright et al. 2002). No research to date, however, has examined the relationships among Eurasian Milfoil, ambush predator species and juvenile Okanagan Chinook.
Thirteen invasive fish species could potentially prey on juvenile Chinook Salmon; however, only yellow perch have been assessed. Stomach contents from 203 Yellow Perch indicated that they were not a major predator of juvenile Chinook (see Biology - Interspecific Interactions section).
Cyanobacteria can be a problematic native species for salmonids in lakes in the Okanagan watershed (Andrusak et al. 2005). Low nitrogen to phosphorus ratios tend to support the dominance of this group of plankton (Cumming et al. 2015). Zooplankton do not typically feed on cyanobacteria and the dominance of cyanobacteria in the phytoplankton community can limit the growth of zooplankton (Stockner and Shortreed 1989). Poor growth in zooplankton communities can lead to reduced food availability for fish communities (Stockner and Shortreed 1989). However, the effects of a cyanobacteria-dominated phytoplankton community on juvenile Chinook have not been assessed.
Pollution
Water quality in the Okanagan Watershed improved from 1990 to 2007 (Dessouki 2009); however, conditions remain poor and may negatively affect Okanagan Chinook. The main causes of water quality issues in the Okanagan River and Osoyoos Lake include sewage from Okanagan communities and agricultural effluents released both adjacent to and upstream of the two water bodies (Dessouki 2009). Summer water temperatures are also above the BC aquatic life guidelines (see Habitat Requirements, and Threats - Climate Change sections). Dissolved oxygen in Osoyoos Lake decreased at four monitoring sites from 2011-2014 and there is evidence of increased nitrogen and phosphorus concentrations throughout the lake (Self and Larratt 2014). No research to date has linked water quality metrics to impacts on Okanagan Chinook.
The impacts of plastic pollution in the marine environment on fish is an emerging concern (Wilcox et al. 2016). Recent studies have shown impacts of these plastics on egg survival and juvenile behaviour in fish (Lonnstedt and Eklov 2016). However, exposure and impacts of plastics in the marine environment on Chinook Salmon have not been studied.
Climate change and severe weather
Under various climate change scenarios, Merritt et al. (2006) predicted an increase in both winter and summer temperatures in the Okanagan River of 1.5-4.0°C and 2-4°C, respectively. Changes to winter temperatures could impact egg-to-fry survival through changes in developmental rates and juvenile hatch and emergence timing. Current temperatures in the Columbia and Okanagan Rivers during the migration and spawning season, respectively, are high for Chinook Salmon (i.e., >18°C) (migration - Caudill et al. 2013; spawning - Water Survey Canada, Station 08NM247). Further increases in temperature could increase pre-spawning mortality and reduce spawning success. Hydrology predictions from Merritt et al. (2006) suggest reduced annual flow volumes, which will likely have negative impacts on Okanagan Chinook through increased temperatures during spawning, incubation and emergence periods and reduced water availability for agricultural and domestic use.
Limiting factors
Habitat
Habitat limiting factors for Okanagan Chinook Salmon are discussed in the Habitat Trends section. Briefly, they include:
- loss of access to habitat due to the construction of dams in the Okanagan River,
- major direct losses of spawning and rearing habitat due to the Okanagan River being channelized, straightened, narrowed and dyked,
- high water temperatures that exceed thermal optima,
- direct losses of juveniles and adults to injury, predation and migration mortality through the network of Columbia River dams and their impoundments, and
- unknown ecological effects of invasive species, including several competitive and predatory fish species, Eurasian Milfoil and Mysis relicta (planktonic crustacean) in Osoyoos Lake.
Number of locations
Spawner distributions from 2010 to 2015 indicate that 96-100% of Okanagan Chinook spawn below McIntyre Dam (Table 6) in October (Benson, pers. comm., 2015). Chemical spills, landslides, or any major event that could compromise water quality enough to cause mass mortality occurring at this one specific location would result in substantial risk to the population. Therefore, there is one location for Okanagan Chinook.
Protection, status and ranks
Legal protection and status
In May 2005, COSEWIC assessed the Okanagan Chinook as Endangered (D1) in an Emergency Assessment. COSEWIC re-examined the status of Okanagan Chinook in April 2006 and designated the population as Threatened (D1+2) due to the potential for rescue from nearby populations of Chinook Salmon in the upper Columbia River. In 2010, the federal Minister of Environment recommended that the Okanagan Chinook population not be listed under the federal Species at Risk Act. Reasons not to list Okanagan Chinook include substantial losses in revenue to the BC economy ($19 million per year) and the fact that in the complete absence of fisheries exploitation the recovery potential is considered to be low (Government of Canada 2010). COSEWIC re-examined the status of Okanagan Chinook in April 2017 as Endangered (D1).
Provincial and federal statutes and policies exist to protect fish and their freshwater and marine habitats. The British Columbia Water Act controls the diversion, usage, and storage of surface waters in British Columbia, which aims to provide protection to spawning and rearing habitat in the Okanagan River. The federal International Boundary Waters Treaty Act and International Rivers Improvement Act regulate the diversion, damming, and obstruction of international waterways, such as the Okanagan River and Osoyoos Lake, and provide protection for migratory routes. DFO’s Fisheries Act regulates fishing and protects fish habitat from harmful alterations or destruction, and thus protects fish and their habitats throughout Canada.
Non-legal status and ranks
Chinook Salmon are listed as ‘S4 - secure’ province-wide by the BC Ministry of Environment (BC Conservation Data Centre 2017). Okanagan Chinook have not been assessed as a separate unit.
Habitat protection and ownership
Okanagan River Chinook Salmon spawn predominantly between Oliver, B.C. and McIntyre Dam (Benson, pers. comm., 2015). Nearly the entire accessible spawning area in Canada is dyked, and thus the channel is either actively managed by the B.C. Ministry of Water, Land and Air Protection, or is within the boundaries of Osoyoos Indian Band reserve lands. Development is limited along the river channel where it passes through the Indian Reserve.
In the Canadian portion of the Okanagan Watershed, provincial parks account for 15% of land ownership. Indian Reserve lands comprise an additional 4%, and 50% is municipal or privately owned land. The remaining land base (approximately 30%) is designated as Crown lands. In addition, 32% of the land base (distributed throughout these designations) is held in the Agricultural Land Reserve.
Acknowledgements and authorities contacted
The report writers thank the following individuals for providing insights and guidance during the preparation of this document: Alan Sinclair, Ryan Benson and Richard Bussanich (Okanagan Nation Alliance Fisheries Department); Chuck Parken, Dean Allan, and Richard Bailey (Fisheries and Oceans Canada); Andrea Pearl (Colville Confederated Tribes); and Mark Miller (BioAnalysts Inc.). In addition, helpful comments from several reviewers greatly improved previous versions of this report.
Authorities contacted
Allan, Dean. B.C. Interior Area Resource Manager, DFO, Kamloops, BC.
Bailey, Richard. Chinook/Coho Program Head, Chinook/Coho Program, DFO, Kamloops, BC.
Benson, Ryan. Fisheries Biologist, Okanagan Nation Alliance, Penticton, BC.
Bussanich, Richard. Stock Assessment/Fisheries Co-Management, Okanagan Nation Alliance, Penticton, BC.
Candy, John. Research Scientist, DFO, Nanaimo, BC.
Miller, Mark. President, BioAnalysts Inc., Boise, ID.
Miller, Todd. Fish & Wildlife Biologist, Washington Department of Fish and Wildlife, Dayton, WA.
Parken, Chuck. Biologist, DFO, Kamloops, BC.
Pearl, Andrea. Fisheries Biologist, Colville Tribes Fish & Wildlife, Omak, WA.
Whelan, Christie. Science Advisor, DFO, Ottawa, ON.
Withler, Ruth. Geneticist, DFO, Nanaimo, BC.
Information sources
Alexis, F., H. Alex, and S. Lawrence. 2003. Exotic Species Risk Assessment: Contribution No. 2 to an Evaluation of an Experimental Re-introduction of Sockeye Salmon into Skaha Lake: Year 3 of 3. Okanagan Nation Alliance Fisheries Department, Westbank, B.C.
Allen, R.L. and T.K. Meekin. 1980. Columbia River Sockeye Salmon study, 1971-1974. State of Washington, Department of Fisheries. Progress Report No. 120.
Allendorf, F.W., G. Luikart, and S.N. Aitken. 2013. Conservation and the Genetics of Populations, 2nd edition. John Wiley and Sons.
Alderdice, D.F. and F.P.J. Velsen. 1978. Relation between temperature and incubation time for eggs of Chinook Salmon (Oncorhynchus tshawytscha). J. Fish. Res. Board. Can. 35:69-75.
Allan, D., pers. comm. 2016. Phone correspondence to D. Braun and N. Burnett. January 2016. Resource Manager, Fisheries and Oceans Canada, Kamloops, British Columbia.
Amaranthus, M., H. Jubas, and D. Arthur. 1989. Stream shading, summer streamflow and maximum water temperature following intense wildfire in headwater streams. USDA Forest Service Gen. Tech. Rep. PSW-109. 4 pp.
Andrusack, H., Matthews, S., Wilson, A., Andrusak, G., Webster, J., Sebastian, D., Scholten, G., Woodruff, P., Rae, R., Vidmanic, L., Stockner, J., and Northwest Hydraulic Consultants. Okanagan Lake Action Plan Year 10 (2005) Report. Fisheries Project Report No. RD 115. 2006. Fisheries Management Branch, Ministry of Water, Land and Air Protection, Province of British Columbia.
Angilletta, M.J., Jr, E. Ashley Steel, K.K. Bartz, J.G. Kingsolver, M. Scheuerell, B.R. Beckman, and L.G. Crozier. 2008. Big dams and salmon evolution: changes in thermal regimes and their potential evolutionary consequences. Evolutionary Applications 1: 286-299.
Araki, H., Berejikian, B.A., Ford, M.J., and M.S. Blouin. 2008. Fitness of hatchery-reared salmonids in the wild. Evolutionary Applications. 1:342-355. doi: 10.1111/j.1752-4571.2008.00026.x
Araki, H., Cooper, B., M.S. Blouin. 2007. Genetic effects of captive breeding cause a rapid, cumulative fitness decline in the wild. Science. 318:100-102.
Armstrong, J.C. 2015. ATK Gathering Report on Chinook Salmon Okanagan population.
B.C. Conservation Data Centre. 2017. Species Summary: Oncorhynchus tshawytscha. B.C. Minist. of Environment. Available: http://a100.gov.bc.ca/pub/eswp/ (accessed May 6, 2017).
Backer, D.M., Jensen, S.E., and McPherson, G.U.Y. 2004. Impacts of Fire-Suppression Activities on Natural Communities. Conservation Biology 18:937-946.
Bailey, R., pers. comm. 2015. Phone correspondence to D. Braun and N. Burnett. December 2015. Chinook/Coho Program Head, Fisheries and Oceans Canada, Kamloops, British Columbia.
Beacham, T.D., K.L. Jonsen, J. Supernault, M. Wetklo, L. Deng, and N. Varnavskaya. 2006. Pacific rim population structure of Chinook Salmon as determined from microsatellite analysis. Transactions of the American Fisheries Society 135:1604-1621.
Beacham, T.D., M. Wetklo, C. Wallace, J.B. Olsen, B.G. Flannery, J.K. Wenburg, W.D. Templin, A. Antonovich, and L.W. Seeb. 2008. The application of microsatellites for stock identification of Yukon River Chinook Salmon. North American Journal of Fisheries Management 28:283-295.
Beakes, M.P., Moore, J.W., Hayes, S.A., and Sogard, S.M. 2014. Wildfire and the effects of shifting stream temperature on salmonids. Ecosphere 5:1-14.
Benson, R., pers. comm. 2016. Email and phone correspondence to D. Braun and N. Burnett. January 2016. Fisheries Biologist, Okanagan Nation Alliance, Westbank, British Columbia.
Bjornn, T., and D.W. Reiser. 1991. Habitat requirements of salmonids in streams. American Fisheries Society Special Publication 19.
Bradford, M.J. 1995. Comparative review of Pacific salmon survival rates. Canadian Journal of Fisheries and Aquatic Sciences 52:1327-1338.
Braun, D.C., J.W. Moore, J. Candy, and R.E. Bailey. 2016. Population diversity in salmon: linkages among response, genetic and life history diversity. Ecography 39:317-328.
Briggs, J.C. 1953. The behaviour and reproduction of salmonid fishes in a small coastal stream. Calif. Dep. Fish Game Fish. Bull. 94:62 p.
Bull, C. 1999. Fisheries Habitat in the Okanagan River. Phase 1: Options for protection and restoration. 61 pp. Glenfir Resources, Penticton.
Bull, C., M. Gaboury, and R. Newbury. 2000 Okanagan River Habitat Restoration Feasibility. Prepared for Public Utility District No. 1 of Douglas County, Washington and Ministry of Environment, Lands and Parks. Kamloops, BC.
Burnett, N.J., S.G. Hinch, D.C. Braun, M.T. Casselman, C.T. Middleton, S.M Wilson, and S.J. Cooke. 2014. Burst swimming in areas of high flow: delayed consequences of anaerobiosis in wild adult Sockeye Salmon. Physiological and Biochemical Zoology87:587-598. Government of Canada. 2010. Canada Gazette Part ii. 144 (6): 240-407.
Candy, J.R., J.R. Irvine, C.K. Parken, S.L. Lemke, R.E. Bailey, M. Wetklo, and K. Jonsen. 2002. A discussion paper on possible new stock groupings (conservation units) for Fraser River Chinook Salmon. Fisheries and Oceans Canada, Canadian Science Advisory Secretariat, Research Document 2002/085.
Cavalli-Sforza, L.L., and A.W.F. Edwards. 1967. Phylogenetic analysis: models and estimation procedures. Evolution 21:550-570.
Caudill, C.C., W.R. Daigle, M.L. Keefer, C.T. Boggs, M.A. Jepson, B.J. Burke, R.W. Zabel, T.C Bjornn, and C.A. Peery. 2007. Slow dam passage in adult Columbia River salmonids associated with unsuccessful migration: delayed negative effects of passage obstacles or condition-dependent mortality? Canadian Journal of Fisheries and Aquatic Sciences 64:979-995.
Caudill, C.C., M.L. Keefer, T.S. Clabough, G.P. Naughton, B.J. Burke, and C.A. Peery. 2013. Indirect effects of impoundment on migrating fish: Temperature gradients in fish ladders slow dam passage by adult Chinook Salmon and steelhead. PLoS One 8: e85586.
Chapman, D., A. Giorgi, T. Hillman, D. Deppert, M. Erho, S. Hays, C. Peven, B. Suzumoto, and R. Klinge. 1994. Status of Summer/Fall Chinook Salmon in the Mid-Columbia Region. Don Chapman Consultants, Boise, Idaho.
Clemens, W.A., D.S. Rawson, and J.L. McHugh. 1939. A biological survey of Okanagan Lake, British Columbia. Bulletin of the Fisheries Research Board of Canada LVI, Ottawa, 70 p.
Colville Confederated Tribes. 2014. Chief Joseph Hatchery Production Plan. http://www.colvilletribes.com/by_2014_hatchery_production_plan.php.
Colville Confederated Tribes. 2015. Chief Joseph Hatchery Production Plan. http://www.colvilletribes.com/by_2015_hatchery_production_plan.php.
Collings, M.R., R.W. Smith, and G.T. Higgins. 1972 Hydrology of four streams in western Washington as related to several Pacific salmon species: Humptulips, Elchoman, Green and Wynoochee rivers: open file report. United States Geological Survey, Tacoma, Washington. 128 p.
COSEWIC 2006. COSEWIC assessment and status report on the Chinook Salmon Oncorhynchus tshawytscha (Okanagan population) in Canada. Committee on the Status of Endangered Wildlife in Canada. Ottawa. vii + 41 pp.
COSEWIC. 2015. Guidelines for Recognizing Designatable units. Committee on the Status of Endangered Wildlife in Canada. Website: http://www.cosewic.gc.ca/default.asp?lang=En&n=DD31EAEE-1. Accessed March 2017.
Crawford, S.S. 2001. Salmonine introductions to the Laurentian Great Lakes: an historical review and evaluation of ecological effects. Vol. 132. NRC Research Press.
Crête-Lafrenière, A., L.K. Weir, and L. Bernatchez. 2012. Framing the Salmonidae family phylogenetic portrait: a more complete picture from increased taxon sampling. PLoS One 7: e46662.
Cumming, B., Laird, K.R., Gregory-Eaves, I., Simpson, K.G., Sokal, M.A., Nordin, R.N. and I.R. Walker. 2015. Tracking past changes in lake-water phosphorus with a 251-lake calibration dataset in British Columbia: tool development and application in a multiproxy assessment of eutrophication and recovery in Osoyoos Lake, a transboundary lake in Western North America. Frontiers in Ecology and Evolution. 3: 84. doi: 10.3389/fevo.2015.00084
Davis, C., H. Wright, T. Brown, B. Phillips, R. Sharma, and C. Parken. 2007. Scientific information in support of recovery potential analysis for Chinook Salmon Okanagan Population, Oncorhynchus tshawytscha. DFO Canadian Science Advisory Secretariat Research Document. 2007/065
Davis, C., Wright, H., K. Long and N. Audy. 2008. Okanagan River Chinook Salmon (Oncorhynchus tschawytscha) 2006 brood year summary report. Okanagan Nation Alliance Fisheries Department. Westbank, BC.
Davis, C., H. Wright, and K. Long. 2008. Okanagan River Chinook (Oncorhynchus tschawytscha) stock and habitat assessments 2007. Okanagan Nation Alliance Fisheries Department. Westbank, BC.
Davis, C. 2009. Okanagan River Chinook Salmon (Oncorhynchus tschawytscha) 2008 brood year summary report. Okanagan Nation Alliance Fisheries Department. Westbank, BC.
Davis, C. 2010. Okanagan River Chinook Salmon (Oncorhynchus tschawytscha) compilation report 2006 - 2010. Okanagan Nation Alliance Fisheries Department. Westbank, BC. 20 p.
Dessouki, T.C.E. 2009. Water quality assessment of the Okanagan River near Oliver, British Columbia (1990-2007). BC Ministry of Enviornment and Environment Canada. p 28
DFO. 2008. Recovery potential assessment for the Okanagan population of Chinook Salmon (Oncorhynchus tschawytscha). DFO Canadian Science Advisory Secretariate Science Advisory Report. 2008/021
Dygert, P. 2012. Memorandum to Ray Hilborn. Bycatch of Chinook Salmon in U.S. Fisheries Directed at Non-salmonid Species. July 18, 2012. 7 pp.
Einum, S., I.A. Fleming, I.M. Côté, and J.D. Reynolds. 2003. Population stability in salmon species: effects of population size and female reproductive allocation. Journal of Animal Ecology. 72:811-821.
Ernst, A. 1999. Okanagan Nation Fisheries Commission Dam Research. Prepared for: Okanagan Nation Fisheries Commission.
Ernst, A. and A. Vedan. 2000. Aboriginal Fisheries Information within the Okanagan watershed. Prepared for the Okanagan Nation Fisheries Commission.
Farrell, A.P., S.G. Hinch, S.J. Cooke, D.A. Patterson, G.T. Crossin, M. Lapointe, and M.T. Mathes. 2008. Pacific salmon in hot water: applying aerobic scope models and biotelemetry to predict the success of spawning migrations. Physiological and Biochemical Zoology. 81:697-709.
Ferguson, J.W., G.M. Matthews, R.L. McComas, R.F. Absolon, D.A. Brege, M.H. Gessel, and L.G. Gilbreath. 2005. Passage of Adult and Juvenile Salmon Through Federal Columbia River Power System Dams. NOAA Technical Memorandum. Fish Ecology Division, Northwest Fisheries Science Center, National Marine Fisheries service, national oceanic and atmospheric administration.
Fish Passage Center. 2004. Hatchery release data for spring and summer Chinook releases into the Okanogan River and its tributaries. www.fpc.org
Ford, J.K., and G.M. Ellis. 2006. Selective foraging by fish-eating killer whales Orcinus orca in British Columbia. Marine Ecology Progress Series. 316:185-199.
Ford, M., Pearsons, T.N., and Murdoch, A. 2015. The spawning success of early maturing resident hatchery Chinook Salmon in natural river system. Transactions of the American Fisheries Society. 114: 539-548.
Ford, M.J., J. Hempelmann, M.B. Hanson, K.L. Ayres, R.W Baird, C.K. Emmons, J.I. Lundin, G.S. Schorr, S.K. Wasser, and L.K. Park. 2016. Estimation of a killer whale (Orcinus orca) population’s diet using sequencing analysis of DNA from feces. PLoS One 11: e0144956.
Gallagher, S.P. and M.F. Gard. 1999. Relationship between Chinook Salmon (Oncorhynchus tshawytscha) redd densities and PHABSIM-predicted habitat in the Merced and Lower American Rivers, California. Can. J. Fish. Aquat. Sci. 56:570-577.
Goniea, T.M., M.L. Keefer, T.C. Bjornn, C.A. Peery, D.H. Bennett, and L.C Stuehrenberg. 2006. Behavioral thermoregulation and slowed migration by adult fall Chinook Salmon in response to high Columbia River water temperatures. Transactions of the American Fisheries Society 135:408-419.
Hallock, R.J., R.F. Elwell, and D.H. Fry. 1970. Migrations of adult king salmon Oncorhynchus tshawytsha in the San Joaquin delta as demonstrated by the use of sonic tags. Calif. Dept. Fish. Game. Fish. Bull. 151: 92 p.
Hamblin, P.F., and S.O. McAdam. 2003 Impoundment effects on the thermal regimes of Kootenay Lake, the Arrow Lakes Reservoir and Upper Columbia River. Hydrobiologia 504:3-19.
Hansen, J. 1996a. Cassimer Bar hatchery juvenile Sockeye Salmon (Oncorhynchus nerka) outmigration from Lake Osoyoos, Washington - 1994. Prepared for Public Utility District No. 1 of Douglas County by Colville Confederated Tribes, Nespelem, Washington.
Hansen, J. 1996b. Cassimer Bar hatchery juvenile Sockeye Salmon (Oncorhynchus nerka) outmigration from Lake Osoyoos, Washington - 1995. Prepared for Public Utility District No. 1 of Douglas County by Colville Confederated Tribes, Nespelem, Washington.
Healey, M.C. 1991. Life history of Chinook Salmon (Oncorhynchus tshawytscha). Pages 311-394 in C. Groot and L. Margolis, editors. Pacific Salmon Life Histories. University of British Columbia Press, Vancouver, B.C.
Hess, J.E., J.M. Whiteaker, J.K. Fryer, and S.R. Narum. 2014. Monitoring stock-specific abundance, run timing, and straying of Chinook Salmon in the Columbia River using genetic stock identification (GSI). North American Journal of Fisheries Management 34:184-201.
Howell, P., K. Jones, D. Scarnecchia, L. LaVoy, W. Kendra, D. Ortmann, C. Neff, C. Petrosky, and R. Thurow. 1985. Stock assessment of Columbia River anadromous salmonids. Volume I: Chinook, Coho, Chum, and Sockeye stock summaries. Report to U.S. Dep. Energy, Contract DE-A179-84BP12737, project 83- 335, 585 p. Available Bonneville Power Administration, P.O. Box 3621, Portland, OR 97208.
Hyatt, K.D. and D.P. Rankin. 1999. A habitat based evaluation of Okanagan Sockeye salmon escapement objectives. Canadian stock assessment secretariat research document 99/191. Pacific Biological Station: Nanaimo BC.
Hyatt, K.D., and M.M. Stockwell. 2013. Fish and water management tools project assessments: record of management strategy and decisions for the 2007-2998 water year. Canadian Manuscript Report of Fisheries and Aquatic Sciences 3022.
Hyatt, K.D., Alexander, C.A.D., and M.M. Stockwell. 2015. A decision support system for improving “fish friendly” flow compliance in the regulated Okanagan Lake and River System of British Columbia, Canadian Water Resources Journal / Revue canadienne des ressources hydriques, 40:1, 87-110, DOI: 10.1080/07011784.2014.985510
Isaak, D.J., Luce, C.H., Rieman, B.E., Nagel, D.E., Peterson, E.E., Horan, D.L., Parkes, S. and Chandler, G.L., 2010. Effects of climate change and wildfire on stream temperatures and salmonid thermal habitat in a mountain river network. Ecological Applications 20:1350-1371.
Keefer, M.L., C.A. Peery, T.C. Bjornn, M.A. Jepson, and L.C. Stuehrenberg. 2004. Hydrosystem, dam, and reservoir passage rates of adult Chinook Salmon and steelhead in the Columbia and Snake rivers. Transactions of the American Fisheries Society 133:1413-1439.
Keefer, M.L., R.J. Stansell, S.C. Tackley, W.T. Nagy, K.M. Gibbons, C.A. Peery, and C.C. Caudill. 2012. Use of radiotelemetry and direct observations to evaluate sea lion predation on adult Pacific salmonids at Bonneville Dam. Transactions of the American Fisheries Society 141:1236-1251.
Keefer, M.L., and C.C. Caudill. 2014. Homing and straying by anadromous salmonids: a review of mechanisms and rates. Rev. Fish. Biol. Fisheries 24:333-368.
Lasenby, D., T. Northcote, and M. Furst. 1986. Theory, practice and effects of Mysis relicta introductions to North American and Scandinanvian lakes. Canadian Journal of Fisheries and Aquatic Sciences 43:1277-1284.
Long, K. 2002. Okanagan River Sockeye spawner enumeration and biological sampling 2001. Prepared for the Okanagan Nation Fisheries Commission.
Lonnstedt, O.M., and P. Eklov. 2016. Environmentally relevant concentrations of microplastic particles influence larval fish ecology. Science. 352: 1213-1216.
Machin, D., K. Alex, C. Louie, C. Mathieu, and C. Rivard-Sirois. 2014. Aquatic monitoring of the Okanagan River Restoration Initiative (ORRI) - Post-construction 2014. Prepared by Okanagan Nation Alliance Fisheries Department. Westbank, BC. 91 p.
McClure, M.M., Holmes, E.E., Sanderson, B.L., and Jordan, C. E. 2003. A large-scale, multispecies status assessment: anadromous salmonids in the Columbia River Basin. Ecological Applications 13:964-989.
McPhail, J.D. 2007. Freshwater Fishes of British Columbia. Vol. 6. University of Alberta.
Merritt, W.S., Alila, Y., Barton, M., Taylor, B., Cohen, S., and D. Neilsen. 2006. Hydrologic response to scenarios of climate change in sub watersheds of the Okanagan watershed, British Columbia. Journal of Hydrology. 326:79-108.
Miller, T. 2004. 2002 Upper Columbia River Summer Chinook Spawning Ground Surveys. Washington Department of Fish and Wildlife. October 21, 2004 Memo to Chuck Peven, Chelan County Public Utility District.
Moore, D., C. Bull, C. Stroh, D. Sheardown, L. Wetengel, D. Whiting, and K. Wolf, editors. 2004. Okanagan Watershed Subwatershed Plan. Prepared for the Northwest Power and Conservation Council.
Moore, J.W., M. McClure, L.A. Rogers, and D.E. Schindler. 2010. Synchronization and portfolio performance of threatened salmon. Conservation Letters 3:340-348.
Moran, P., D.J. Teel, M.A. Banks, T.D. Beacham, M.R. Bellinger, S.M. Blankenship, J.R. Candy, J.C. Garza, J.E. Hess, S.R. Narum, and L.W. Seeb. 2013. Divergent life-history races do not represent Chinook Salmon coast-wide: the importance of scale in Quaternary biogeography. Canadian Journal of Fisheries and Aquatic Sciences 70:415-435.
Mullan, J.W. 1987. Status and propagation of Chinook Salmon in the mid-Columbia River through 1985. U.S. Fish and Wildlife Service Biological Report 89(3). Leavenworth, WA.
Murdoch, A.R., and T. Miller. 1999. Summer Chinook Spawning Ground Survey in the Methow and Okanogan River Watersheds in 1998. WDFW. Prepared for Public Utility District No. 1 of Chelan County.
Myers, J.M., R.G. Kope, G.J. Bryant, D. Teel, L.J. Lierheimer, T.C. Wainwright, W.S. Grand, F.W. Waknitz, K. Neely, S.T. Lindley and R.S. Waples. 1998. Status Review of Chinook Salmon from Washington, Idaho, Oregon and California. U.S. Dept. Commerce, NOAA. Tech. Memo. NMFS-NWFSC-35, 443 p.
Myrick, C.A. and Cech, J.J.Jr. 1998. Bay-Delta Modeling Forum Technical Publication 01-1. Temperature effects on Chinook Salmon and steelhead: a review focusing on California’s Central Valley populations. 57pp.
Neff, B.D., Garner, S.R., Fleming, I.A., M.R. Gross. 2015. Reproductive success in wild and hatchery male Coho salmon. Royal Society Open Science. 2:150161. http://dx.doi.org/10.1098/rsos.150161
Nehlsen, W., J.E. Williams, and J.A. Lichatowich. 1991. Pacific salmon at the crossroads: stocks at risk from California, Oregon, Idaho, and Washington. Fisheries 16:4-21.
Nitschke, C.R., and Innes, J.L. 2008. Climatic change and fire potential in South-Central British Columbia, Canada. Global Change Biology 14:841-855.
Northcote, T.G., T.G. Halsey, and S.J. MacDonald. 1972. Task 115, Fish as indicators of water quality in the Okanagan Watershed lakes, British Columbia. Canada-British Columbia Okanagan Watershed Agreement. British Columbia Fish and Wildlife Branch, Department of Recreation and Conservation, Victoria, B.C.
ONA (Okanagan Nation Alliance). 2003. 2002 Okanagan River Sockeye spawning habitat assessment. Okanagan Nation Alliance Fisheries Department. Seattle, Wa.
Pacific Salmon Commission Joint Chinook Technical Committee. 2003. Catch and escapement of Chinook Salmon under Pacific Salmon Commission jurisdiction, 2002. Vancouver, B.C.
Pacific Salmon Commission Coded Wire Tag Workgroup. 2008. An action plan in response to Coded Wire Tag (CWT) Expert Panel Recommendations. Pacific Salmon Comm. Tech. Rep. No. 25: 170 p.
Parken, C., pers. comm. 2016. Email correspondence to D. Braun. January and February 2016. Biologist, Fisheries and Oceans Canada, Kamloops, British Columbia.
Parken, C.K., R.E. McNicol, and J.R. Irvine. 2006. Habitat-based methods to estimate escapement goals for data limited Chinook Salmon stocks in British Columbia, 2004. DFO Canadian Scientific Advisory Secretariat Research Document 2006/083.
Parken, C.K., J.R. Candy, J.R. Irvine, and T.D. Beacham. 2008. Genetic and coded wire tag results combine to allow more-precise management of a complex Chinook Salmon aggregate. North American Journal of Fisheries Management 28:328-340.
Pearl, A., pers. comm. 2016. Email and phone correspondence to N. Burnett. January 2016. Fisheries Biologist, Colville Tribes Fish & Wildlife, Omak, Washington.
Petersen, J.H., and J.F. Kitchell. 2001. Climate regimes and water temperature changes in the Columbia River: bioenergetic implications for predators of juvenile salmon. Canadian Journal of Fisheries and Aquatic Sciences 58:1831-1841.
Phillips, B., H. Wright and K. Long. 2005. Okanagan River Chinook habitat usage and availability. Summit Environmental Consultants Ltd. and Okanagan Nation Alliance Fisheries Department, Westbank, B.C.
Quinn, T P., M.T. Kinnison, and M.J. Unwin. 2001. Evolution of Chinook Salmon (Oncorhynchus tshawytscha) populations in New Zealand: pattern, rate, and process. Genetica 112:493-513.
Quinn, T.P., and M.J. Unwin. 1993. Variation in life history patterns among New Zealand Chinook Salmon (Oncorhynchus tshawytscha) populations. Canadian Journal of Fisheries and Aquatic Sciences 50:1414-1421.
Raymond, H.L. 1988. Effects of hydroelectric development and fisheries enhancement on spring and summer Chinook Salmon and steelhead in the Columbia River Basin. North American Journal of Fisheries Management 8:1-24.
Riebe, C.S., L.S. Sklar, B.T. Overstreet, and J.K. Wooster. 2014. Optimal reproduction in salmon spawning substrates linked to grain size and fish length. Water Resources Research 50:898-918.
Rivard-Sirois, C. 2014. Okanagan River Restoration Initiative (ORRI) Spawning Platforms No.1 & No.2 in the Penticton Channel - Construction Works. 2013-2014. Prepared for the ORRI Steering Committee and PRCC Committee. Prepared by Okanagan Nation Alliance Fisheries Department. Westbank, BC. 92 p.
Ruggerone, G.T., and F.A. Goetz. 2004. Survival of Puget Sound Chinook Salmon (Oncorhynchus tshawytscha) in response to climate-induced competition with Pink Salmon (Oncorhynchus gorbuscha). Canadian Journal of Fisheries and Aquatic Sciences 61:1756-1770.
Scheuerell, M.D., and J.G. Williams. 2005. Forecasting climate-induced changes in the survival of Snake River spring/summer Chinook Salmon (Oncorhynchus tshawytscha). Fisheries Oceanography 14:448-457.
Scott, W.B. and E.J. Crossman. 1973. Freshwater fishes of Canada. Bull. Fish. Res. Board Can. 184:1-966.
Self, J. and H. Larratt, 2014. Okanagan Collaborative Synthesis Report - November 2014. Prepared by Larratt Aquatic Consulting Ltd. Prepared for British Columbia Ministry of Environment.
Sharma, R., and T.P. Quinn. 2012. Linkages between life history type and migration pathways in freshwater and marine environments for Chinook Salmon, Oncorhynchus tshawytscha. Acta Oecologica 41:1-13.
Shelton, J.M. 1955. The hatching of Chinook Salmon eggs under simulated stream conditions. Prog. Fish-Cult.95:183-187.
Smith, S. 2002. Okanogan fishery references (information from the Portland State University library and personal interviews). Prepared for Colville Confederated Tribes, Nespelem, WA.
Smith, S. 2003a. An investigation of salmon and steelhead in the Similkameen River above the site of Enloe Dam (newspaper and journal accounts). Prepared for Colville Confederated Tribes, Nespelem, WA.
Smith, S. 2003b. Review of Okanogan fishery resources in watershed newspapers and journals. Prepared for Colville Confederated Tribes, Nespelem, WA.
Snow, C., C. Frady, A. Repp, B. Goodman, and A. Murdoch. 2014. Monitoring and evaluation of the Wells Hatchery and Methow Hatchery programs: 2013 annual report. Report to Douglas PUD, Grant PUD, and the Wells HCP Hatchery Committee, East Wenatchee, WA.
Stockner, JG and KS Shortreed. 1989. Algal picoplankton production and contribution to food-webs in oligotrophic British Columbia lakes. Hydrobiologica. 173: 151-166.
Symonds, B.J. 2000. Background and History of Water Management of Okanagan Lake and River. Ministry of Environment, Lands and Parks, Water Management Branch, Penticton, British Columbia. 8 p.
Tappel, P.D., and T.C. Bjornn. 1983. A new method of relating size of spawning gravel to salmonid embryo survival. North American Journal of Fisheries Management 3:123-135.
Teel, D.J., G.B. Milner, G.A. Winans, and W.S. Grant. 1999. Genetic population structure and origin of life history types in Chinook Salmon in British Columbia, Canada. Trans. Am. Fish. Soc. 129:194-209.
Unwin, M.J., M.T. Kinnison, and T.P. Quinn. 1999. Exceptions to semelparity: postmaturation survival, morphology, and energetics of male Chinook Salmon (Oncorhynchus tshawytscha). Canadian Journal of Fisheries and Aquatic Sciences 56:1172-1181.
Vedan, A. 2002. Traditional Okanagan environmental knowledge and fisheries management. Okanagan Nation Fisheries Commission, Westbank, B.C.
Vronskiy, B.B. 1972. Reproductive biology of the Kamchatka River Chinook Salmon (Oncorhynchus tshawytscha (Walbaum)). Journal of Ichthyology 12:259-273.
Waknitz, F.W., G.M. Matthews, T. Wainwright, and G.A. Winans. 1995. Status review for mid-Columbia River summer Chinook Salmon. U.S. Department of Commerce, NOAA Technical Memorandum NMFS-NWFSC-22.
Waples, R S. 1991. Pacific salmon, Oncorhynchus spp., and the definition of "species" under the Endangered Species Act. Marine Fisheries Review 53:11-22.
Waples, R.S., R.G. Gustafson, L.A. Weitkamp, J.M. Myers, O.W. Johnson, P.J. Busby, J.J. Hard, G.J. Bryant, F.W. Waknitz, K. Neely, and D. Teel. 2001. Characterizing diversity in Pacific salmon. Journal of Fish Biology 59:1-41.
Waples, R.S., D.J. Teel, J.M. Myers, and A.R. Marshall. 2004. Life-history divergence in Chinook Salmon: historic contingency and parallel evolution. Evolution 58:386-403.
Waples, R.S., R.W. Zabel, M.D. Scheuerell, and B.L. Sanderson. 2007. Evolutionary responses by native species to major anthropogenic changes to their ecosystems: Pacific salmon in the Columbia River hydropower system. Molecular Ecology 17:84-96.
Wilcox, C., Mallos, N.J., Leonard, G.H., Rodriquez, A., and B.D. Hardesty. 2016. Using expert elicitation to estimate the impacts of plastic pollution on marine wildlife. Marine Policy 65: 107-114.
Williamson, K.C., Murdoch, A.R., Pearsons, T.N., Ward, E.J., and M.J. Ford. 2010. Factors influenceing the relative fitness of hatchery and wild spring Chinook Salmon (Oncorhynchus tshawytscha) in the Wenatchee River, Washington, USA. Canadian Journal of Fisheries and Aquatic Sciences 67:1840-1851.
Williamson, K.C., and B. May. 2005. Homogenization of fall-run Chinook Salmon gene pools in the Central Valley of California, USA. N. Am. J. Fish. Manage 25:993-1009.
Wright, R.H., C.J. Bull, and K.D. Hyatt. 2002. Possible impacts of exotic species introductions on the indigenous aquatic communities of the Okanagan Valley mainstem lakes. Submitted for AFS special publication on Okanagan system. May Ecosystem conference.
Wright, R.H., and K. Long. 2005. Documentation of Chinook (Oncorhynchus tshawytscha) information from Okanagan Nation Alliance Fisheries Department field work (1999-2004). Okanagan Nation Alliance Fisheries Department. March 2005.
Zimmerman, M.P. 1999. Food Habits of Smallmouth Bass, Walleyes, and Northern Pikeminnow in the Lower Columbia River Basin during Outmigration of Juvenile Anadromous Salmonids. Transactions of the American Fisheries Society 128:1036-1054.
Zimmerman, M.P., and D.L. Ward. 1999a. Response of Smallmouth Bass to Sustained Removals of Northern Pikeminnow in the Lower Columbia and Snake Rivers. Transactions of the American Fisheries Society 128:1020-1035.
Zimmerman, M.P., and D.L. Ward. 1999b. Index of Predation on Juvenile Salmonids by Northern Pikeminnow in the Lower Columbia River Basin, 1994-1996. Transactions of the American Fisheries Society 128:995-1007.
Biographical summary of report writer(s)
Douglas Braun and Nicholas Burnett were the primary writers of this report.
Douglas Braun has a PhD in Biology from Simon Fraser University and has been working as a consultant at InStream Fisheries Research Inc. in Vancouver, B.C. for the past four years.
Nicholas Burnett has an MSc in Biology from Carleton University and has been working as a consultant at InStream Fisheries Research Inc. in Vancouver, B.C. for two years.
Appendix I. Threats Classification Table for Chinook Salmon, Okanagan population.
Threats assessment worksheet
See instructions in 'Instructions' worksheet. Scroll down in top pane to view the entire table.
- Species or ecosystem scientific name:
- Chinook Salmon, Okanagan population
- Date:
- 05/04/2016
- Assessor(s):
- Dean Allan, Bruce Atkinson, Dan Benoit, Doug Braun (status report writer), Richard Bussanich, Ross Claytor, Ian Fleming, Dave Fraser (facilitator), Carrie Holt, Sean McConnachie, John Neilson, Craig Purchase, Alan Sinclair (Marine Fishes SSC co-chair), Peter Westley, Christie Whelan, Greg Wilson. COSEWIC Secretariat (non-assessor): Bev McBride
- References:
- draft status report
| Threat impact | Threat impact (descriptions) | Level 1 Threat impact counts: high range |
Level 1 Threat impact counts: low range |
|---|---|---|---|
| A | Very high | 0 | 0 |
| B | High | 0 | 0 |
| C | Medium | 3 | 0 |
| D | Low | 1 | 4 |
| - | Calculated overall threat impact: | High | Medium |
- Overall threat comments
- Generation time = 4 years
| Threat | Threat description | Impact (calculated) | Impact (calculated) description | Scope (next 10 Yrs) | Severity (10 Yrs or 3 Gen.) | Timing | Comments |
|---|---|---|---|---|---|---|---|
| 1 | Residential & commercial development | blank cell | blank cell | blank cell | blank cell | blank cell | blank cell |
| 1.1 | Housing & urban areas | blank cell | blank cell | blank cell | blank cell | blank cell | blank cell |
| 1.2 | Commercial & industrial areas | blank cell | blank cell | blank cell | blank cell | blank cell | blank cell |
| 1.3 | Tourism & recreation areas | blank cell | blank cell | blank cell | blank cell | blank cell | blank cell |
| 2 | Agriculture & aquaculture | blank cell | Unknown | Pervasive (71-100%) | Unknown | High (Continuing) | blank cell |
| 2.1 | Annual & perennial non-timber crops | blank cell | blank cell | blank cell | blank cell | blank cell | blank cell |
| 2.2 | Wood & pulp plantations | blank cell | blank cell | blank cell | blank cell | blank cell | blank cell |
| 2.3 | Livestock farming & ranching | blank cell | blank cell | blank cell | blank cell | blank cell | blank cell |
| 2.4 | Marine & freshwater aquaculture | blank cell | Unknown | Pervasive (71-100%) | Unknown | High (Continuing) | Population not seen to be declining right now. Severity depends upon the numbers of hatchery fish that survive and interbreed with Okanagan Chinook Salmon. There is also uncertainty relative to the incidence of pathogens (e.g., IHN, PKD) and other aquaculture facilities or operations (i.e., BC Freshwater fisheries society (Summerland) and kokanee outplants/waste water and waste treatment, Arctic Charr (Oliver) during years with high water temperatures and low flows…) |
| 3 | Energy production & mining | blank cell | blank cell | blank cell | blank cell | blank cell | blank cell |
| 3.1 | Oil & gas drilling | blank cell | blank cell | blank cell | blank cell | blank cell | blank cell |
| 3.2 | Mining & quarrying | blank cell | blank cell | blank cell | blank cell | blank cell | blank cell |
| 3.3 | Renewable energy | blank cell | Not Calculated (outside assessment timeframe) | blank cell | blank cell | Low (Possibly in the long term, >10 yrs) | Low likelihood for next 10 years. |
| 4 | Transportation & service corridors | blank cell | blank cell | blank cell | blank cell | blank cell | blank cell |
| 4.1 | Roads & railroads | blank cell | blank cell | blank cell | blank cell | blank cell | blank cell |
| 4.2 | Utility & service lines | blank cell | blank cell | blank cell | blank cell | blank cell | blank cell |
| 4.3 | Shipping lanes | blank cell | blank cell | blank cell | blank cell | blank cell | blank cell |
| 4.4 | Flight paths | blank cell | blank cell | blank cell | blank cell | blank cell | blank cell |
| 5 | Biological resource use | CD | Medium - Low | Pervasive (71-100%) | Moderate - Slight (1-30%) | High (Continuing) | blank cell |
| 5.1 | Hunting & collecting terrestrial animals | blank cell | blank cell | blank cell | blank cell | blank cell | blank cell |
| 5.2 | Gathering terrestrial plants | blank cell | blank cell | blank cell | blank cell | blank cell | blank cell |
| 5.3 | Logging & wood harvesting | blank cell | blank cell | blank cell | blank cell | blank cell | blank cell |
| 5.4 | Fishing & harvesting aquatic resources | CD | Medium - Low | Pervasive (71-100%) | Moderate - Slight (1-30%) | High (Continuing) | Population not seen to be declining right now. Ocean survival might be masking exploitation effect. Very low poaching (interception) rate, i.e. not significant. |
| 6 | Human intrusions & disturbance | blank cell | blank cell | blank cell | blank cell | blank cell | blank cell |
| 6.1 | Recreational activities | blank cell | Unknown | Small (1-10%) | Unknown | High (Continuing) | Recreational tubing in the Penticton channel, and Oliver section. Some recreational activities happen over spawning areas but not when spawning is taking place. Only a small percentage of fish would experience recreational inner-tubers. |
| 6.2 | War, civil unrest & military exercises | blank cell | blank cell | blank cell | blank cell | blank cell | blank cell |
| 6.3 | Work & other activities | blank cell | blank cell | blank cell | blank cell | blank cell | blank cell |
| 7 | Natural system modifications | CD | Medium - Low | Pervasive (71-100%) | Moderate - Slight (1-30%) | High (Continuing) | blank cell |
| 7.1 | Fire & fire suppression | blank cell | Unknown | Unknown | Unknown | Moderate (Possibly in the short term, < 10 yrs) | blank cell |
| 7.2 | Dams & water management/use | CD | Medium - Low | Pervasive (71-100%) | Moderate - Slight (1-30%) | High (Continuing) | Population not seen to be declining right now. Scope: Affects the entire population. Severity: Upstream migration mortality through each of 8 dams is 6 - 13%, cumulative mortality ranges from 35%-67%. Other studies indicate the mortality ranges from 15%-20% through all 8 dams. Downstream migration cumulative mortality rates are estimated at 57% - 74%. |
| 7.3 | Other ecosystem modifications | blank cell | blank cell | blank cell | blank cell | blank cell | blank cell |
| 8 | Invasive & other problematic species & genes | D | Low | Pervasive (71-100%) | Slight (1-10%) | High (Continuing) | blank cell |
| 8.1 | Invasive non-native/alien species | D | Low | Pervasive (71-100%) | Slight (1-10%) | High (Continuing) | Population not seen to be declining right now. Possible effects of bass, perch, mysids -- it is not clear what exactly is causing mortality. Large shrimp populations are nearshore but Chinook are in deeper waters. In Canada seeing about 10% of tagged population disappearing but downstream seeing 60%. |
| 8.2 | Problematic native species | blank cell | Unknown | Pervasive (71-100%) | Unknown | High (Continuing) | Cyanobacteria |
| 8.3 | Introduced genetic material | blank cell | blank cell | blank cell | blank cell | blank cell | Hatchery impacts considered above under aquaculture. |
| 9 | Pollution | blank cell | Unknown | Pervasive (71-100%) | Unknown | High (Continuing) | Many effects likely indirect. |
| 9.1 | Household sewage & urban waste water | blank cell | Unknown | Pervasive (71-100%) | Unknown | High (Continuing) | Sewage treatment from Okanagan communities. Uncertainty as to whether impact is negative or beneficial. |
| 9.2 | Industrial & military effluents | blank cell | blank cell | blank cell | blank cell | blank cell | blank cell |
| 9.3 | Agricultural & forestry effluents | blank cell | Unknown | Pervasive (71-100%) | Unknown | High - Moderate | Some contaminants delivered to waterways by, for instance, the Teslin slide. |
| 9.4 | Garbage & solid waste | blank cell | Unknown | Unknown | Unknown | High (Continuing) | Plastics at sea |
| 9.5 | Air-borne pollutants | blank cell | blank cell | blank cell | blank cell | blank cell | blank cell |
| 9.6 | Excess energy | blank cell | blank cell | blank cell | blank cell | blank cell | blank cell |
| 10 | Geological events | blank cell | blank cell | blank cell | blank cell | blank cell | blank cell |
| 10.1 | Volcanoes | blank cell | blank cell | blank cell | blank cell | blank cell | blank cell |
| 10.2 | Earthquakes/tsunamis | blank cell | blank cell | blank cell | blank cell | blank cell | blank cell |
| 10.3 | Avalanches/landslides | blank cell | blank cell | blank cell | blank cell | blank cell | blank cell |
| 11 | Climate change & severe weather | CD | Medium - Low | Pervasive (71-100%) | Moderate - Slight (1-30%) | High (Continuing) | blank cell |
| 11.1 | Habitat shifting & alteration | blank cell | Unknown | Pervasive (71-100%) | Unknown | High (Continuing) | blank cell |
| 11.2 | Droughts | CD | Medium - Low | Pervasive (71-100%) | Moderate - Slight (1-30%) | High (Continuing) | Population not seen to be declining right now. Would require low water multiple years in a row. |
| 11.3 | Temperature extremes | CD | Medium - Low | Pervasive (71-100%) | Moderate - Slight (1-30%) | High (Continuing) | Population not seen to be declining right now. Would require warm water multiple years in a row. |
| 11.4 | Storms & flooding | blank cell | blank cell | blank cell | blank cell | blank cell | blank cell |
Classification of Threats adopted from IUCN-CMP, Salafsky et al. (2008).