Pacific sardine (Sardinops sagax) COSEWIC assessment and status report: chapter 7
Population Sizes and Trends
Traditional ecological knowledge
Researchers and historicans (Drucker 1951; Sapir and Swadesh 1939) as well as the historical account of Jewitt (Stewart 1987) have documented the pre- and post-contact importance of sardines (Sardinops sagax) along the west coast of Vancouver Island in Nuu-chah-nulth communities. Archeological evidence recovered from sites in Nuu-chah-nulth territories has conclusively revealed the use of sardines pre-dating modern-day commercial fisheries. Research indicates that sardines were highly valued when the fall salmon runs were low in abundance. During these times, Nuu-chah-nulth gathered both sardines and herring to supplement their diet. Interestingly, Williamson (1930) noted that “the indians knew these fish, which they called “seetons”: they did not find them palatable”. The Nuu-chah-nulth word for sardines is "Tsee'pin".
Recent stock status
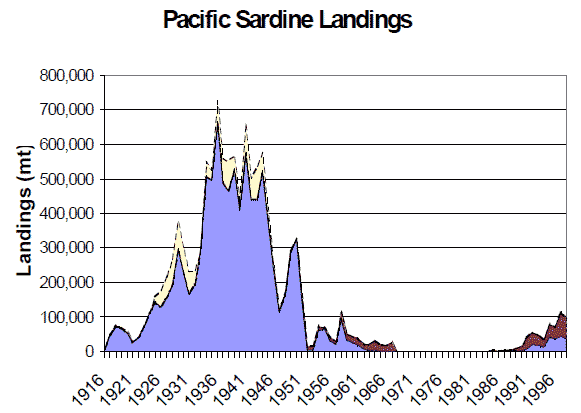
The history of the Pacific sardine fishery has been extensively documented by Murphy (1966), Culley (1971) and Radovich (1982). The fishery began in California in 1916-17 with a catch of about 25 000 tonnes. It was primarily used as a canned product to compete in the European markets where domestic production had been curtailed by the war (Figure 3). Thereafter, catches for reduction to meal and oil increased substantially, peaking in 1936-37 at 718 000 tonnes. The fishery remained stable at about the 500 000 tonne level until 1945-46, when it declined markedly to catches of 20 to 40 000 tonnes annually. The fishery remained at this level until 1967, when legislation was introduced to limit pressure on the depleted stocks (Radovich 1982). A moratorium on landings was instituted in California until the spawning population recovered to 20 000 short tonnes (1 short ton = 2000 lbs.). The moratorium was lifted in 1986 when the biomass exceeded this level.
The major reduction fishery began in 1925, which is coincident with the exponential growth in landings. In British Columbia, this fishery began in 1917-18 at 70 tonnes and increased rapidly to 44 000 tonnes by 1926-27. This level was surpassed and sustained until 1947-48, when the population was collapsing and only 444 tonnes were landed in Canadian waters (Radovich 1982).
Figure 3. History of catches in the Pacific sardine fishery from 1916 to present.

The factors causing the demise of the California sardine stocks appear to have been a combination of overfishing and unfavourable environmental conditions for sardine survival (Radovich 1982, Murphy 1966, 1978, MacCall 1979). As the stock collapsed the range of the population contracted and fewer and fewer fish migrated to the Pacific northwest (Radovich 1982). Around this time, the northern anchovy populations were beginning to increase in abundance, and it remains uncertain whether interspecific competition with the anchovy was responsible for, or accelerated, the decline of the Pacific sardine stocks (Murphy 1966, 1978; Radovich 1982).
Murphy (1967) estimated that the stock would require 24 years to recover to maximum productivity in the presence of moderate fishing. In the mid- to late 1980s, there were indications that the sardine population was increasing rapidly. In 1986, it was estimated that the tonnage off California had exceeded 20000 short tons, which provided the opportunity for a small, directed quota of 1000 short tons for the California fleet. The fishery in the United States has continued to expand as the sardine population increases (Figure 4). The entire sardine population is estimated to exceed one million metric tonnes, a level approaching that of the 1930s. The recent dramatic increase in abundance is largely a function of strong recruitment (Figure 5) that appears to be related to recent elevated sea-surface temperatures (Conser et al. 2001).
Figure 4. Recent Pacific sardine stock biomass (x1,000 mt) of age 1 and older fish, estimated from an age-structured stock assessment model (see Conser et al. 2001). The assessment is for the entire North American population, the majority of which (~90%) resides in US waters.

Figure 5. Recent Pacific sardine recruitment (billions of 0 age fish) estimated from an age-structured stock assessment model (see Conser et al. 2001). The assessment is for the entire North American population, the majority of which (~90%) resides in US waters.

As the California sardine population increases it continues to expand its range. As a result, the sardine re-appeared in British Columbia waters in 1992 (Hargreaves et al. 1994). The abundance of sardine in Canadian waters has increased through the 1990s and may be approaching historical levels of 10% of the coastwide biomass (McFarlane and Beamish 2001, Ware 1999, 2001, Schweigert and McFarlane, 2001).
Rate of increase
The rate of increase of the sardine population was calculated from Figure 4 using formulae provided by COSEWIC. It indicates a 322% increase in abundance during the past 10 years, which suggests an annual rate of increase of 14%. In other words, the population has more than tripled during the past decade.