
Canada and British Columbia southern mountain caribou protection study 2017: chapter 1
2. Biological review and study context
2.1 Population numbers and trends
Within the SMNEA, the federal recovery strategy establishes 24 caribou LPUs, 21 of which are primarily or wholly in BC and 3 that are primarily or wholly in Alberta. LPUs are used in the federal recovery strategy to describe groups of subpopulations that, historically, are assumed to have been part of the same population. Some LPUs contain a single subpopulation (sometimes referred to as a herd).
LPUs have been established and mapped in the federal recovery strategy using two different methods. For the Southern Group (known as “mountain caribou” in BC), LPU boundaries were based on BC's MCRIP, which refers to large, contiguous "Mountain Caribou Planning Units” which groups individual subpopulations within administrative planning boundaries. This results in a LPU often covering large areas that are not currently occupied by caribou as well as matrix habitatFootnote7.
For the Northern and Central Groups, LPUs were established using information and expertise about geographic areas currently or recently (i.e. last ~30 years) occupied by southern mountain caribou subpopulations. This was considered the best information available to ECCC at the time the recovery strategy was prepared. This results in the LPU boundaries in the Central and Northern Groups largely equating to the boundary of the subpopulation(s) within them.
The Southern Group ranges throughout the southern interior wet belt of the Province. Caribou in this region are adapted to deep snow environments, feeding almost exclusively on arboreal lichens in the winter, moving seasonally to lower elevations to access green forage in the early spring and to avoid unconsolidated snow in early winter (Apps et al. 2001).
The Central and Northern Groups use shallow-snow winter ranges in low-elevation pine-lichen forest stands or on high-elevation windswept ridges, where they crater for terrestrial lichens. The Central and Northern Groups are distinguished from each other less by behavioural differences than by genetics and the physical barrier provided by the Peace River (COSEWIC 2014).
The three Central Group LPUs that fall mostly or entirely within BC, and which are the focus of phase one of this Study, are the Pine River, Quintette and Narraway. Of the six subpopulations that are included in these three LPUs, one is extirpated (Burnt Pine) and at least three others have experienced long-term declines (Table 1).
| Group | #b | Prov | Local Population Unit (LPU) | Subpopulation | Population - Estimatec | Population Estimatec - Year | Population Trendd- Current | Population Trendd- Long-term |
|---|---|---|---|---|---|---|---|---|
| Northern Group | 1 | BC | Chilcotin | Rainbows | 50e | 2008 | Decreasing | Decreasing |
| Northern Group | 1 | BC | Chilcotin | Charlotte Alplands | 21f | 2001 | Decreasing | Decreasing |
| Northern Group | 1 | BC | Chilcotin | Itcha-Ilgachuz | 1,350g | 2016 | Decreasingh | Stablei |
| Northern Group | 2 | BC | Tweedsmuir | Tweedsmuir | 165j | 2016 | Decreasingk | Decreasing |
| Northern Group | 3 | BC | Telkwa | Telkwa | 16l | 2016 | Decreasing | Decreasing |
| Northern Group | 4 | BC | Takla | Takla | 70 | 2015 | Decreasingm | Unknownn |
| Northern Group | 5 | BC | Wolverine | Wolverine | 362o | 2016 | Increasing | Stable |
| Northern Group | 6 | BC | Chase | Chase | 475p | 2009 | Unknown | Unknown |
| Northern Group | 7 | BC | Graham | Graham | 298q | 2016 | Stable to Decreasingr | Unknowns |
| Northern Group | - | BC | Northern Group Total | - | 2,807 | - | Unknown | Unknown |
| Central Group | 8 | BC | Pine River | Scott | 54t | 2016 | Increasingu | Unknown |
| Central Group | 8 | BC | Pine River | Moberly | 54t | 2016 | - | - |
| Central Group | 8 | BC | Pine River | Kennedy Siding | 50v | 2016 | Stable | Decreasing |
| Central Group | 8 | BC | Pine River | Burnt Pine | 0w | 2013 | Extirpated | - |
| Central Group | 9 | BC | Quintette | Quintette | 62x | 2016 | Decreasing | Decreasing |
| Central Group | 10 | BC/AB | Narraway | Narraway | 53y | 2016 | Decreasing | Decreasing |
| Central Group | 11 | AB | Redrock-Prairie Creek | Redrock-Prairie Creek | 127 | 2012 | Decreasing | Decreasing |
| Central Group | 12 | AB | A La Peche | A La Peche | 88 | 2012 | Decreasing | Decreasing |
| Central Group | 13 | AB | Jasper-Banff | Tonquin | 34 | 2014 | Decreasing | Decreasing |
| Central Group | 13 | AB | Jasper-Banff | Maligne | <5z | 2014 | Decreasing | Decreasing |
| Central Group | 13 | AB | Jasper-Banff | Brazeau | 15aa | 2014 | Decreasing | Decreasing |
| Central Group | 13 | AB | Jasper-Banff | Banff | 0 | 2009 | Extirpated | - |
| Central Group | - | BC/ AB | Central Group Total | - | 488 | - | Decreasing | Decreasing |
| Southern Group | 14 | BC | Hart Ranges | Hart Ranges | 375bb | 2016 | Decreasingcc | Decreasing |
| Southern Group | 15 | BC | Upper Fraser | North Cariboo Mountains | 146dd | 2016 | Decreasing | Decreasing |
| Southern Group | 15 | BC | Upper Fraser | George Mountainee | 0 | 2004 | Extirpated | - |
| Southern Group | 15 | BC | Upper Fraser | Narrow Lake | 36ff | 2016 | Stablegg | Decreasing |
| Southern Group | 16 | BC | Mount Robson | Mount Robsonhh | 0 | - | N/A | N/A |
| Southern Group | 17 | BC | Quesnel Highlands | Barkerville | 72ii | 2016 | Decreasing36jj | Increasing |
| Southern Group | 17 | BC | Quesnel Highlands | Wells Gray (North) | 200kk | 2015 | Decreasing | Decreasing |
| Southern Group | 18 | BC | Wells Gray-Thompson | Wells Gray (South) | 121ll | 2015 | Decreasing | Decreasing |
| Southern Group | 18 | BC | Wells Gray-Thompson | Groundhog | 19 | 2016 | Increasingmm | Decreasing |
| Southern Group | 19 | BC | Revelstoke-Shuswap | Columbia North | 152nn | 2013 | Decreasing | Decreasing |
| Southern Group | 19 | BC | Revelstoke-Shuswap | Frisby-Boulder | 11 | 2013oo | Decreasing | Decreasing |
| Southern Group | 19 | BC | Revelstoke-Shuswap | Columbia South | 4 | 2016pp | Decreasing | Decreasing |
| Southern Group | 20 | BC | Kinbasket | Central Rockies | 3qq | 2008 | Decreasingrr | Decreasing |
| Southern Group | 21 | BC | South Monashee | Monashee | 1 | 2016 | Extirpatedss | - |
| Southern Group | 22 | BC | Central Kootenay | Central Selkirkstt | 35 | 2016uu | Decreasing | Decreasing |
| Southern Group | 23 | BC | Southwest Kootenay | South Selkirks | 12vv | 2016 | Decreasing | Decreasing |
| Southern Group | 24 | BC | Southeast Kootenay | Purcells Central | 0 | 2005 | Extirpated | - |
| Southern Group | 24 | BC | Southeast Kootenay | Purcells South | 16ww | 2016 | Stable | Decreasing |
| Southern Group | - | BC | Southern Group Total | - | 1,205 | - | Decreasing | Decreasing |
SMNEA Total = 4,500 Population Estimate
a "Population sizes" are estimates of total animals in the population
b “#” corresponds to LPU number in Figure 4
c Population estimates are based on survey data unless otherwise noted and include all age classes
d Current trend based on interviews with jurisdictional experts. Long-term trend derived from three-generation (27 years) trends based on survey data for Southern and Northern Groups, and on population vital rates (radio-collared adult mortality, late winter calf recruitment) for Central Group and Tweedsmuir subpopulation of the Northern Group
e Total estimate of 50 is based on a total of 44 caribou seen (38 adults, 6 calves) during an absolute abundance survey (Freeman 2009). This subpopulation will be re-surveyed in October 2016 (N. Dodd, pers. comm. 2016)
f The 23 caribou (7 bulls, 12 cows, 4 calves) observed is a minimum count (Young et al. 2001) and given the vast terrain and the small groups the Charlotte Alplands caribou are observed in, variability in the survey observations is not unexpected (i.e., caribou were likely missed) (N. Dodd, pers. comm. 2016). There was a decline in the breeding component from 29 cows in 1993 to 12 cows in 2001 (Young et al. 2001). Given anecdotal sightings of 6 and 9 animals in 2009, the subpopulation has likely decreased and it would be reasonable to suggest that there are currently <25 animals (N. Dodd, pers. comm. 2016)
g The 2014 population estimate (1350) was a mark-resight absolute abundance survey (Dodd in draft)
h The short-term population trend is decreasing (2003-2014) with a change in population size of 51.8% and the current trend of surveys done in 2012 and 2014 is down with a change in caribou numbers of -15.6% (Dodd in draft)
i The long-term population trend (1994-2014) is stable with change in population size of -3.6%. Although the 20 year trend suggests stability, the Itcha-Ilgachuz caribou herd did experience population growth in the late 1990 and early 2000s, during which time the population increased from approximately 1500 animals to a peak of 2800 between 1995 and 2003. Since then, numbers have steadily declined and the population appears to be similar in size to that of the early 1990s (Dodd in draft))
j Midpoint between estimate of 150-180. The lower bound based on mark-recapture assessment using collars and upper bound still requiring confirmation. Estimate based on surveys in October 2015 and March 2016, and mark-capture analysis of fall 2015 survey. Minimum population count on March 16 2016 was 120 caribou (A. Roberts, pers. comm. 2016)
k Current assessment of population trend indicates continued population decline (A. Roberts, pers. comm. 2016)
l J. Campbell, pers. comm. 2016
m The Takla herd declined 44%, or about 7% per year, between 2004 and 2012. It is unclear why this herd appears to be declining despite reasonably high calf recruitment (17-20% calves in the population). The decline was not equivalent among the different portions of the herd's range (Seip 2015)
n Recent historical population estimates include a minimum count of 102 in 1998 (Poole et al. 2000), 125 counted in 2004 (Wilson et al.), and 70 counted in 2012 (Klohn Crippen Berger Ltd.)
o A total of 258 caribou were counted in the study area, including 6 calves/100 cows and 31 bulls/100 cows. Applying detectability and area correction factors yielded a population estimate of 362 caribou within the Wolverine caribou range (Hansen and Paterson 2016)
p A survey was conducted in 2010 with an estimate of 347, but the 2009 survey is used as the estimate (COSEWIC 2014)
q Population estimate is based on late winter aerial inventory of alpine complexes within the core winter range of the Graham herd (12 survey blocks between Butler Ridge and the Halfway River), an estimate of sightability, and accounting for the proportion of the collared sample located outside the survey blocks at the time of inventory (Culling and Culling 2016)
r Twelve percent calf recruitment (assuming 50% females), coupled with 7-10% adult female mortality, suggests a short-term population trend of stable to slightly declining (λ 1.01-0.98) (Culling and Culling 2016)
s COSEWIC (2014) indicates a stable long-term trend from 1989 to 2009, with the population estimate being 708 caribou in 2009. However, between 2009 and 2016 there was a 58% decline (i.e., 708 to 298) in the Graham herd
t Combined count of caribou from both the Scott and Moberly subpopulation (Seip and Jones 2016). In 2013, the Scott and Moberly subpopulations had estimates of 20-40 and 16 caribou, respectively (Seip and Jones). COSEWIC (2014) reports a population estimate of 22 caribou for the Moberly subpopulation in 2014
u Based on the combined high adult survival rate and relatively high calf recruitment rate resulting in a population increase from 42 caribou in 2015. The improved population status corresponds to the combination of maternal penning and wolf control in 2015 (Seip and Jones 2016)
v Population count based on motion-sensor camera photographs. The population of 50 caribou was identical to the number counted in 2015, and similar to population estimates since 2011 (e.g., 41 in 2013 (Seip and Jones)) indicating that the Kennedy Siding herd has been stable over recent years. The number of caribou counted in 2015, however, was substantially lower than the 120 caribou counted in 2007 (Seip and Jones 2016)
w The last known caribou observed in the Burnt Pine area was an uncollared cow in March 2013 that may be have been a Kennedy Siding caribou and there is no evidence that there are any remaining caribou that use the Burnt Pine range over the entire year (Seip and Jones 2013). Ongoing monitoring of the population will confirm whether or not this subpopulation has been extirpated (COSEWIC 2014)
x Overall population estimate accounted for sightability. Minimum survey count was 39, of which 33 were in the high elevation census area (Seip and Jones 2016). Population estimate was 114-129 in 2013 (Seip and Jones) and 106 (98-113) in 2014 (COSEWIC 2014). Based on recent estimates, there's been a 58% decline from 2014 to 2016
y Population estimate for the Bearhole-Redwillow subgroup (18 minimum): the minimum count of caribou was 18 (excluding the Quintette caribou), which is comparable to numbers counted in recent years, and consistent with an ongoing decline from a minimum count of 49 caribou and a population estimate of 80 caribou in 2008 (Seip and Jones 2016) and 24 in 2013 (Seip and Jones). Population estimate for South Narraway Subgroup (35 minimum): a total of 35 caribou were counted including five calves for a calf recruitment of 14.3 %. This represents an ongoing decline in the minimum count from at least 102 caribou in 2008 (Seip and Jones 2016) and 50 in 2013 (Seip and Jones)
z No more than 5 have been observed at once in the past few years (L. Neufeld, pers. comm. 2016)
aa Population estimate is based on a minimum count of 13 (L. Neufeld, pers. comm. 2016)
bb Population estimate applies to Hart South (246) and Parsnip (129) subpopulations (Klaczek and Heard 2016)
cc Survey results suggest that the Hart South and Parsnip subpopulations have declined by 40-50% over the last decade and the Hart South has declined by 40% since 2012 and the Parsnip has remained stable since 2012 (Klaczek and Heard 2016)
dd Census of Sugar Bowl and Haggen blocks only. Survey results suggest that the North Cariboo Mountain subpopulation has declined by 40-50% over the last decade and appears stable since 2012 (Klaczek and Heard 2016)
ee Range no longer managed by Province of BC for caribou.
ff 42 animals observed in 2014 (Courtier and Heard 2014)
gg Survey results suggest that the Narrow Lake subpopulation has declined by 40-50% over the last decade and appears stable since 2012 (Klaczek and Heard 2016)
hh The Mount Robson LPU includes only small portions of the Central Group's Tonquin and A La Peche subpopulation ranges; population size and trend estimates for those subpopulations are included in the Central Group. Mount Robson was not included in COSEWIC's assessment and status report (2014)
ii Minimum count was 51. Population estimate (72) was corrected using a sightability correction factor (0.709) specific to the Barkerville subpopulation (N. Dodd, pers. comm. 2016)
jj 2012 estimate was 90, with minimum count of 75 (N. Dodd, pers. comm. 2016)
kk Minimum count was 164. Survey estimate corrected with sightability correction factor (0.857) was 191. Subjective population estimate, adjusted for fresh tracks of caribou that were not visible due to vegetation, was 200 (N. Dodd, pers. comm. 2016)
ll 2013 is the most recent complete count for Wells Gray (South) (133). A partial count was done in 2015 and with some extrapolation the population estimate was 121 (J. Surgenor, pers. comm. 2016)
mm The population estimate was 14 and 19 caribou for the for Groundhog subpopulation in 2015 and 2016, respectively (J. Surgenor, pers. comm. 2016)
nn Includes those caribou counted directly (148) and estimated from tracks observed (4). Not a calculated population estimate accounting for sightability (Legebokow and Serrouya 2013)
oo Includes those caribou counted directly (11) and not a calculated population estimate accounting for sightability (Legebokow and Serrouya 2013)
pp S.Boyle, Parks Canada Agency (Mount Revelsoke Glacier National Park), pers.comm.2016
qq Includes those caribou counted directly (3) and not a calculated population estimate accounting for sightability (Legebokow and Serrouya 2013)
rr Serrouya et al. (2014) states that this LPU may be extirpated
ss One caribou was associated with one small caribou track network observed and survey team was confident that this was the only caribou at that site. Surveyors concluded that there was only one caribou left in the known recent range of the South Monashee herd and consider the herd to be functionally extirpated (van Oort, H. and R. Laubman 2016). Three caribou were observed in 2013 (Legebokow and Serrouya 2013)
tt Since 2005, the Central Selkirk caribou subpopulation has been divided into the Nakusp and Duncan blocks. However, since 2010, caribou have been consistently sighted in between the Duncan and Nakusp blocks and were not technically part of either. Thus, the BC Ministry of Forests, Lands and Natural Resource Operations returned to the convention of using the term “Central Selkirks” without further division into blocks (DeGroot 2014), which has been adopted in this amendment. Thus, the total population estimate of 35 includes caribou from both the Nakusp and Duncan blocks.
uu The sub population declined approximately 50% between 1999 and 2002, and then remained relatively stable for a decade. The results of this year's census indicate a 40% decline from the last census in 2012 and a 77% decline since comprehensive census work began in the mid 1990's (DeGroot 2014)
vv Total population count. All were in British Columbia at time of survey. Caribou spend most of their time in Canada with occasional movements into the US (L. DeGroot, pers. comm. 2016)
ww L. DeGroot, pers. comm. 2016
As of 2016, the total population estimate for the extant subpopulations of Central Group Woodland Caribou within BC is 219 individuals (Seip and Jones 2016). In addition to the extirpation of the Burnt Pine subpopulation before 2015, remaining subpopulations have declined by at least 50% over the past 10 years, with the exception of the Moberly. The Moberly subpopulation has increased since 2014, likely due to a combination of maternity penning and wolf control; however, the current population size of the Moberly subpopulation is less than 25% of its estimated population in 1997 (Seip and Jones 2016).
Surveys indicate that rates of both adult female survival and of juvenile recruitment are too low in most years to maintain stable populations. As elsewhere, the most common cause of adult female caribou mortality is wolf predation (Seip and Jones 2016). The ultimate drivers of higher wolf predation on caribou have been identified or hypothesized as:
- Habitat loss and disturbance at high elevations, causing caribou to move lower where they are more likely to encounter wolves and other predators (BC Ministry of Environment 2013);
- Increases in the density of linear features, which are used by wolves for hunting and can increase their ability to exploit caribou (Dickie et al. 2016);
- Increases in early seral vegetation that result in population increases among moose, deer and elk and a consequent increase in wolves (Latham et al. 2011, Serrouya 2013);
- Warming winter temperatures, which improve over-winter survival of deer and therefore more prey for wolves and a consequent increase in wolf populations (Dawe and Boutin 2016); and,
- Generally low hunting and trapping pressure on wolves, leading to higher populations than those observed through most of the 20th century when fur prices were higher and wolf control was widespread and aggressive (BC Ministry of Forests, Lands and Natural Resource Operations 2014).
These broad landscape and climate changes might also be affecting caribou health and nutrition (e.g., Parker et al. 2009), as well as population responses of other predators like black bears (e.g., DeMars 2015). The relative importance of these factors in driving rates of wolf predation on caribou is an area of active research and not all factors can be addressed through habitat protection.
2.2 Population and distribution objectives
2.2.1 Federal Caribou objectives
The federal recovery strategy states that:
“To guide recovery efforts, the population and distribution objectives are, to the extent possible, to:
- stop the decline in both size and distribution of all LPUs;
- maintain the current distribution within each LPU; and
- increase the size of all LPUs to self-sustaining levels and, where appropriate and attainable, to levels that can sustain a harvest with dedicated or priority access to Indigenous peoples.
LPUs are considered to be self-sustaining when:
- the LPU on average demonstrates stable or positive population growth over the short-term (≤20 years) and is large enough to withstand random events and persist over the long-term (≥50 years) without the need for ongoing active management intervention; and
- there is an increase to at least 100 caribou within LPUs that currently consist of fewer than 100 caribou and there is no reduction in the number of caribou within LPUs that currently consist of over 100 caribou.”
2.2.2 BC's Caribou objectives
The population, timing and distribution goal for South Peace Northern CaribouFootnote8 set out in the provincial Implementation Plan for the Ongoing Management of South Peace Northern Caribou in British Columbia (B.C. Ministry of Environment, 2013) is:
"Increase the population of South Peace Northern Caribou to ≥ 1200 animals within 20 years across their range."
The implementation objectives from the B.C. plan are:
- "Protect 90% of identified high elevation winter habitat across the range of South Peace Northern Caribou:
- protect ≥ 90% of identified high elevation winter habitat in the Graham, Moberly, Burnt Pine, Scott, Kennedy Siding, and Narraway herd ranges; and
- protect ≥ 80% of identified high elevation winter habitat in the Quintette herd range.
- Conduct South Peace Northern Caribou population management to address non-habitat related threats (e.g., predation) to certain South Peace Northern Caribou herds.
- In all ranges, manage the industrial footprint in identified high and low elevation habitats by requiring standardized industry management practices across all industry sectors to reduce or prohibit surface disturbance and habitat alteration, and support long-term sustainable caribou habitat conditions.
- In all ranges, monitor the compliance and effectiveness of management actions and modify actions accordingly to ensure the population and distribution goal is being achieved."
2.3 Recovery actions
BC has made significant contributions and investments toward the protection and recovery of southern mountain caribou. These contributions include investment in direct recovery action and have also required extensive engagement with stakeholders and First Nations and consideration of the full range of implications to find a balance between environmental, social, and economic considerations.
The exact amount of indirect costs to the Crown for any new protection measures in the form of lost rent from resource development is currently unknown, but will need to be carefully developed to avoid unnecessarily impacting resource development activities. As an example, the capital investment, economic activity and associated job creation of the mining, wind power, petroleum and natural gas sectors within the Study area that has the potential to be impacted by caribou-related land use decisions exceeds $20 billion. An additional $1 billion in economic activity in the forest sector has the potential to be impacted.Footnote 9
Actions taken by BC as the lead jurisdiction have been informed by research and inventory conducted in the region. Direct investment in southern mountain caribou subpopulations by the provincial government, industry, compensation programs, Indigenous peoples, the federal government, and stakeholders in the past 10 years alone has been more than $12.5 million.
An integral component of BC's recovery actions has been the identification and management of suitable caribou habitat, as described in later sections of this Study. Provincial and federal recovery plans recognize that habitat protection alone does not fully address the current causes of declining caribou populations. Declines are a result of a complex interaction of legacy habitat impacts, current land use practices, likely climate effects and interacting predator-prey dynamics.
In BC's view, the full suite of ultimate and proximate pathways to decline need to be addressed within the constraints of what is acceptable to Indigenous peoples, local stakeholders and the broader public.
Whether the recovery of small and declining caribou subpopulations is possible within these constraints is a topic of active debate among wildlife managers and biologists. To date, no jurisdiction in Canada has implemented a program that has demonstrated sustained success at recovering caribou at a landscape scale.
Despite these uncertainties, BC's management actions for southern mountain caribou have included the following:
2.3.1 Predation control
Predation by wolves, cougars, and bears is the most important proximate factor influencing the sustainability of many caribou herds. Direct removal of some predators has occurred through liberalized trapping and hunting seasons, aerial shooting of wolves, and expanded harvest limits for cougars near many caribou herds, especially in central BC. All Wildlife Management Units (WMU) overlapping or adjacent to caribou herds have extended seasons and larger bag limits for wolves. In the Kootenay Region (Southern Group), a trapper training and carcass recovery program was in place from 2008 to 2012 to increase trappers' wolf trapping skills and their interest in pursuing wolves. This initiative did stimulate interest from trappers, but was discontinued because it only succeeded in removal of partial packs, and the isotope analysis performed on the carcasses to determine the extent to which caribou comprised part of the wolves' diet was largely inconclusive.
2.3.2 Aerial wolf removal
Aerial wolf removal during winter conditions has been conducted in two areas (South Peace, South Selkirks) annually since January 2014. The goal is to remove 80% or more of the wolves in the treatment area. In the South Selkirk area (Southern Group), there were an estimated total of 16 wolves in four distinct packs; 9 of these wolves (two packs) were removed. In the South Peace (Central Group) there were an estimated total of 166 wolves in 17 distinct packs; 140 of these wolves (14 packs) were removed. Part of the removal program includes a fall and early winter live trapping program to enable radio collaring wolves. If there are collared wolves in each pack, the overlap with caribou habitat can be confirmed and the packs more efficiently located for removal. The removal program was designed for a five year duration and as such it is premature to assess benefits to local caribou subpopulations. However, there are indications that wolf removal in the South Peace has contributed to success in the maternity penning project and an increase in the Moberly caribou subpopulation. Results remain somewhat inconclusive. Approximately $1.5 million has been spent on aerial wolf removal, plus government staff time.
2.3.3 Indirect measures by sterilizing alpha pairs
A wolf sterilization pilot project was undertaken in the Quesnel Highlands LPU of the Southern Group from 2001 to 2012. Sterilization of adult male and female wolves effectively stopped reproduction, strongly limiting the rate of increase of wolf populations. By 2008, 39-77% of wolf packs were fertility-treated, and wolf densities were reduced by 39-48% from 2009-2012. Wolf radio-telemetry studies showed sterilized adult wolves maintained their territories, displayed normal survival rates, and sustained sexual pair bonds. However, there was no change in Quesnel Highland caribou recruitment. Moose harvest was increased after 2001 in an attempt to reduce prey biomass for wolves, but whether the moose population responded was not adequately assessed. An independent assessment recommended continuing a slightly modified sterilization program, but challenges with staffing logistics and worker safety have been insurmountable obstacles. Approximately $760,000 was spent on sterilization, plus government staff time.
2.3.4 Primary prey reduction
A primary prey (moose) and predator (wolf) reduction program has operated in the Kootenay Region (Revelstoke area – provincial wildlife management units 4-39 and 4-38) since 2003. Moose numbers were reduced using sport hunting from 1650 in 2003 (1.58/km2) to 286 (0.27/km2) in 2014. The decline led to a reduction in wolves from over 30 wolves /10,000 km2 to about 12 wolves /10,000 km2 by 2014. From 2003 to 2014, the Columbia North caribou subpopulation stabilized and may have increased. Other similarly sized caribou populations adjacent to but outside the moose reduction area declined during this time (e.g. Wells Gray and Central Selkirks). Approximately $600,000 was spent on the moose reduction pilot project, plus government staff time.
2.3.5 Maternity penning
Predation is viewed as the main proximate factor limiting population growth of southern mountain caribou. Most predation occurs in spring within six weeks of birth and penning cows and calves during this time can protect calves from grizzly and black bears, wolverines, cougars and wolves. The ecological implications of removing such a variety of species are not tenable. Rather than removing large numbers of predators to generate small incremental gains in caribou survival, alternative means are being considered in order to reduce calf mortality.
Maternity penning projects are underway in the Moberly (Central Group) and Columbia North (Southern Group) subpopulations. Initial results indicate that maternity penning is effective when combined with predator control in areas proximate to the pen. These trials were designed for a five year duration. Approximately $3.6 million has been spent on the projects, including approximately $220,000 in capital costs, plus an unquantified amount of government staff time.
Provincial staff working in the MCRIP area are working with biologists from Idaho Fish and Game, Washington Department of Wildlife, Kalispell Tribe, US Forest Service, US Fish and Wildlife Service (USFWS), and the Fish and Wildlife Compensation Program – Columbia Basin on trans-boundary caribou conservation in the South Selkirks subpopulation (Southern Group). With an emphasis on addressing the causes of adult mortality and low recruitment, this group recently committed to implementing a maternity penning project in the Southwest Kootenay LPU. This work is being undertaken in coordination with the USFWS as part of an effort to refresh the USFWS caribou recovery process and the recently signed agreement on cooperation under the Canada/Mexico/U.S. Trilateral Committee for Wildlife and Ecosystem Conservation and Management.
Penning projects to date have yielded promising results and practitioners are continuing to refine methods to increase success. The technique could be applied in other Central Group subpopulations, if required.
2.3.6 Herd augmentation (transplant, captive breeding)
The MCRIP committed to “Boost caribou numbers in threatened herds with animals transplanted from elsewhere to ensure herds achieve critical mass for self-sufficiency.” The Purcells-South subpopulation was identified as the highest ranked priority to receive augmentation (Mountain Caribou Science Team 2008). In 2010, an augmentation plan was developed for the Purcells-South herd. In March 2012, Ministry of Forests, Lands, and Natural Resource Operations (MFLNRO) completed phase 1 of a 2 phase transplant by moving 20 northern ecotype caribou to the Purcells-South herd. The capture and relocation of caribou was an initial success, but the project suffered from higher than expected caribou mortalities on the transplanted animals. In fall 2012, MFLNRO postponed phase 2 of the transplant for one year due to the lack of success with phase 1. Staff completed a review of the program and recommended significant operational changes to increase transplant success. Lessons learned from this transplant are expected to inform transplants for other caribou herds that are critically threatened. However, there has been no further planning for augmenting the Purcells-South herd. Approximately $900,000 has been spent on the transplant project and an unquantified amount of government staff time.
2.3.7 Captive breeding
Captive breeding of caribou has been considered for mountain caribou (i.e. Southern Group) since 2008. The province is considering translocation-based management to help recover woodland caribou populations in several parts of their range, and at least six herds have been considered for translocation. After several assessments, it has been confirmed that there are few suitable source populations for wild transplants. Captive breeding is one option for supplying caribou for translocation without depleting wild source populations. Over the past six years the province, the Calgary Zoo, University of Calgary, the oil and gas industry, and Parks Canada have all expressed interest in collaboratively developing a captive rearing facility.
In January 2016, the Calgary Zoo hosted a captive breeding workshop to investigate and develop augmentation options for boreal caribou, including captive breeding. Large, in-situ enclosures were determined to be the method most likely to be successful. Alberta has announced support for such a project in west central Alberta. BC has not committed to large exclosures, but continues to examine caribou herds for their suitability as founder herds for a facility oriented/based approach to captive breeding. On the basis of an objective assessment of caribou founder herds in the Northern Mountain designatable unit, radio-collars were installed on caribou in the Muskwa herd. Radio telemetry data and recruitment surveys will help refine the initial indication that this herd could contribute caribou to a captive breeding program. This assessment is ongoing. Approximately $50,000 has been spent on researching captive breeding plus an unquantified amount of government staff time.
2.3.8 Wildlife collaring and monitoring
Monitoring and research programs have been implemented to assess how key wildlife populations (e.g. caribou, moose, wolf) respond to natural (e.g. fire and insect outbreak) and human (e.g. logging, winter recreation) factors. This can lead to an increased understanding of the animal and herd dynamics and help refine management tools. Approximately $1.5 million has been invested in wildlife monitoring program plus government staff time.
2.3.9 Caribou surveys
Population monitoring is on-going. Many caribou herds are surveyed on a regular basis. Ideally each herd is surveyed every third year. Where significant investment in management is occurring, surveys occur more frequently. This information enables tracking of population trends and assessment of response to management actions. Approximately $2.5million has been invested in caribou survey work plus staff time.
2.3.10 Management of human disturbance (Recreation Activities)
Caribou are susceptible to disturbance and displacement by winter recreation. Recreational snowmobile access has been closed in many areas of mountain caribou range and for some northern herds. Annual winter enforcement flights are undertaken to promote compliance and ticket those violating the closures. Heli-ski tenure holders are subject to conditions in a Memorandum of Understanding to reduce the effects from helicopters. Tenure holders (i.e. those who have authorization to use Crown land for commercial recreation) are required to annually submit information on wildlife sightings and their operational responses to encounters. There is a moratorium on granting additional commercial recreation tenures in mountain caribou areas. Approximately $634,000 has been spent on monitoring snowmobile closed areas plus an unquantified amount of staff time.
2.3.11 Industry Management Practices
Standardized Industry Management Practices [Word Doc 10.2 MB] for forestry, oil and gas, mineral exploration and other land base activities have been developed and are in the process of being formally endorsed. Guidelines provide sound technical, but not legally binding, advice to resource professionals for mitigating possible impacts to caribou. Investment has been primarily in the form of staff time.
2.3.12 Summary of financial investment in direct management of southern mountain caribou
| Management tool | Budget expended ($) |
|---|---|
| Transplant | 900,000 |
| Research | 302,000 |
| Maternal Penning | 3,600,000 |
| Wolf collaring, surveys, and inventory | 370,000 |
| Wolf removal | 1,500,000 |
| Alternate prey reduction | 600,000 |
| Wolf sterilization | 760,000 |
| Caribou surveys | 2,500,000 |
| Caribou collaring and monitoring | 1,130,000 |
| Snowmobile monitoring | 634,000 |
| Recreational management | 61,000 |
| Habitat Management | 168,000 |
| Total | 12,525,000 |
2.4 Critical habitat identification
Critical habitat is defined in SARA subsection 2(1) as “the habitat that is necessary for the survival or recovery of a listed wildlife species and that is identified as the species' critical habitat in the recovery strategy or in an action plan for the species.” Critical habitat for this species is identified at the landscape scale in the federal recovery strategy. Recovery is defined by population and distribution objectives; therefore, critical habitat is the habitat necessary to achieve the population and distribution objectives for southern mountain caribou.
The federal recovery strategy identified six categories of range as critical habitat (Table 3). All areas of each LPU where the biophysical attributes of critical habitat outlined in the recovery strategy exist are identified as critical habitat. For some categories of critical habitat, the federal recovery strategy establishes thresholds for the minimum amount of undisturbed habitat considered necessary to achieve recovery of caribou within the LPUs.
Thresholds were estimated from best available information at the time of the drafting of the recovery strategy. They also draw on experience from the development of the recovery strategy for boreal populations of woodland caribou. Thresholds are defined in part because of the link between landscape disturbance and increasing deer, moose and elk populations, and therefore predator density, in caribou range. However, disturbance is not the only mechanism by which prey and predator numbers can be artificially elevated (e.g., see Bradley and Neufeld 2012 for an explanation of the decline of woodland caribou in Jasper National Park, where disturbance thresholds have not been exceeded). Additionally, disturbance interacts with many other habitat and non-habitat factors to characterize favourable or unfavourable conditions for caribou. Therefore, defining with confidence the level of habitat disturbance that is consistent with survival and recovery of caribou is challenging.
For the purpose of calculating the amount of disturbance in ranges subject to a threshold of a minimum of 65% undisturbed habitat, disturbance is defined as the area affected by human-caused disturbance visible on Landsat imagery at a scale of 1:50,000 scale including a 500m buffer, and/or fire disturbance in the last 40 yearsFootnote10. Table 3 shows the different categories of critical habitat identified in the recovery strategy and the associated minimum undisturbed habitat thresholds. The locations of these six different critical habitat categories were not fully mapped at a fine scale in the federal recovery strategyFootnote11. As a result, currently available information was used to temporarily define high elevation habitat for the purpose of this Study (for example, see section 2.6).
Critical habitat for southern mountain caribou is comprised of three components: location, amount, and type.
2.4.1 Critical habitat locations
Critical habitat as defined in the federal recovery strategy is found within the following locations (italicized text is excerpted directly from the recovery strategy):
- “the high elevation winter and/or summer (spring, calving, summer, fall/rut) range delimited by the LPU boundaries for all Groups;
- the low elevation summer (spring, calving, summer, fall/rut) range delimited by the LPU boundaries for the Northern Group;
- the low elevation spring and/or early winter range delimited by the LPU boundaries for the Southern Group;
- the LPU boundaries of the Northern and Central Groups, which provides for an overall ecological condition for low elevation winter range and Type 1 matrix range that will allow for an ongoing recruitment and retirement cycle of habitat, which maintains a perpetual state of a minimum of 65% of the area as undisturbedFootnote12; and,
- Type 2 matrix range for all Groups, and Type 1 matrix range for the Southern Group that provides for an overall ecological condition that will allow for low predation risk, defined as wolf population densities less than 3 wolves/1000 km2.
Existing, essentially permanent features such as maintained trails, roads and existing infrastructure (e.g., buildings), and agricultural fields are not generally considered components of critical habitat, even where they occur within a critical habitat polygon.”
2.4.2. Critical habitat amounts
The amount of critical habitat is described as follows:
- “In low elevation winter ranges and Type 1 matrix range in the Northern and Central Groups with less than 65% undisturbed habitat, critical habitat includes that which is currently suitable as well as adjacent habitats that over time would contribute to the attainment of 65% undisturbed habitat.
- In low elevation winter ranges and Type 1 matrix range in the Northern and Central Groups with 65% or more undisturbed habitat, critical habitat includes at least 65% undisturbed suitable habitat in low elevation winter and Type 1 matrix range, recognizing that habitat will change over time given the dynamic nature of the forest in these ranges.
- In high elevation winter and/or summer ranges for all Groups, low elevation summer ranges for the Northern Group, and low elevation spring and/or early winter range for the Southern Group, critical habitat includes that which is currently suitable as well as adjacent habitat that over time would become suitable through restoration.”
2.4.3. Critical habitat type
“Type” describes the biophysical attributes of critical habitat (may be interpreted as “parts” of critical habitat). Biophysical attributes are those habitat characteristics required by southern mountain caribou to carry out life processes; for example, access to food sources, low predation risk, low sensory disturbance. General descriptions of biophysical attributes for all three groups (i.e. North, Central, and Southern), and for the different categories of critical habitat, are provided in Appendix C of the 2014 federal recovery strategy.
| Category of critical habitat range | Northern group | Central group | Southern group |
|---|---|---|---|
| High Elevation Winter Range | Minimal disturbance | Minimal disturbance | Minimal disturbance |
| High Elevation Summer Range | Minimal disturbance | Minimal disturbance | Minimal disturbance |
| Low Elevation Winter Range | Minimum 65% undisturbed | Minimum 65% undisturbed | n/aFootnote13 |
| Low Elevation Summer Range | Minimal disturbance | n/a | n/a |
| Low Elevation Early Winter and/or Spring Range | n/a | n/a | Minimal disturbance |
| Type 1 Matrix | Minimum 65% undisturbed | Minimum 65% undisturbed | Wolf densities of <3/1000km2 |
| Type 2 MatrixFootnote14 | Wolf densities of < 3/1000km2 | Wolf densities of < 3/1000km2 | Wolf densities of < 3/1000km2 |
2.5 Important Caribou habitat identified by BC
As noted previously, BC's implementation plans do not use the term “critical habitat”. Seasonal suitability maps for the Central Group have been developed (Map 2). The maps were based on resource selection function models of data collected on radio-collared caribou throughout the three LPUs in BC, as well as on maps of habitat attributes. The suitability maps identify different classes of caribou habitat selection in both high- and low-elevation portions of LPUs. Core high elevation winter ranges incorporated between 87-95% of high elevation winter telemetry locations, core high elevation summer ranges incorporated 83-92% of summer locations, and core low elevation winter ranges incorporated 81-98% of low elevation winter locations. The habitat areas that contribute to the predator-prey system on a caribou range, but are not core caribou habitat areas, constitute matrix habitat (Seip and Jones 2015).
Suitability mapping was used by BC to inform the boundaries of legal designations (see legislative review below). The South Peace Northern Caribou implementation plan prioritized the protection of 80-90% of high elevation habitats, and required the development of Caribou Mitigation and Monitoring Plans in high elevation habitats where development is planned. Low elevation winter range for caribou is managed through objectives in designated areas that aim to maintain caribou habitat attributes and minimize habitat fragmentation.
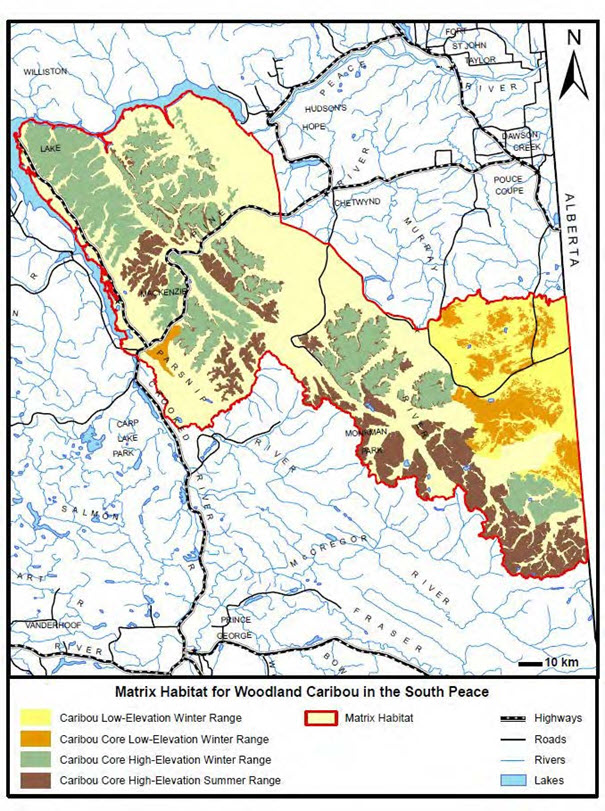
Long description for Map 2
This map shows different types of habitat that provincial biologists have categorized for caribou in the South Peace area of BC. Core high elevation winter range is in green, and core high elevation summer range is in brown. These areas follow mountainous areas in a northwest to southeast direction. Low elevation winter range is bright yellow, mostly in the eastern areas near the Alberta border. Core low elevation winter range is orange, within the low elevation winter range area. Matrix habitat is shown in light yellow as the remaining habitat within an outer boundary shown as a thick red line.
2.6 Disturbance in low elevation winter and type 1 matrix ranges
As discussed earlier, the federal recovery strategy requires that LPUs be maintained or restored to a condition that includes at least 65% “undisturbed” (or conversely no more than 35% “disturbed”) habitat in low elevation winter range and Type 1 matrix habitat. In 2012, ECCC mapped disturbances in subpopulation ranges as they were defined at the time, following methodology similarFootnote15 to that completed for a Scientific Assessment to Inform the Identification of Critical Habitat for Boreal Caribou (Environment Canada 2011), which defines disturbance as anthropogenic disturbances visible on Landsat 5 imagery at 1:50:000 viewing scaleFootnote16 with a 500 m buffer added, as well as fire disturbance in the last 40 years with no buffer. For the purposes of this Study, the 2012 disturbance mapping was used to calculate the amount of disturbance in all areas within the boundaries of the LPUs as they were defined in the federal recovery strategy except those identified as high elevation seasonal range (for which the management objective is “minimal disturbance”).
Although Type 1 matrix range can contain high elevation areas, low elevation winter range and Type 1 matrix habitat are hereafter referred to as “non-high elevation”, to distinguish these critical habitat types which are subject to the minimum 65% undisturbed habitat threshold from the high elevation seasonal ranges where the management objective is “minimal disturbance”. The high elevation seasonal range areas were defined according to readily accessible data available at the time of the Study (Annex 2). The inverse of these areas represents the total non-high elevation range. The amount of disturbance in non-high elevation areas exceeds the maximum 35% habitat disturbance threshold in all three BC Central Group LPUs (Table 4, Maps 3, 4, and 5).
| LPU | LPU Total Area (ha) | Non-high elevation habitat (ha) | Disturbed area (ha) (seismic lines excludedFootnote17) | % disturbed (seismic lines excluded) | % disturbed (seismic lines included) |
|---|---|---|---|---|---|
| Narraway | 1,311,744 | 940,479 | 418,280 | 44.5 | 50.4 |
| Quintette | 618,245 | 477,309 | 258,990 | 54.3 | 57.6 |
| PineRiver | 1,155,611 | 787,145 | 489,130 | 62.1 | 62.6 |
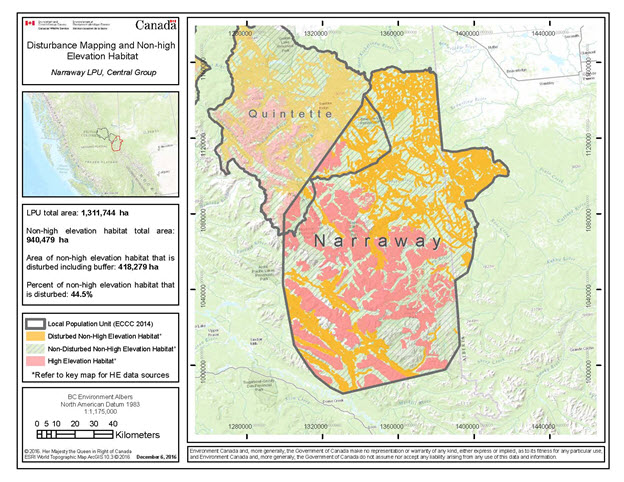
Long description for Map 3
This map shows the boundary of the Narraway Local Population Unit in a dark grey line. Inside that area, disturbed non-high elevation habitat is shown in orange, and occurs mostly in the northern half of the LPU boundary. In the southern half there is also some disturbed area mapped, in between high elevation habitat which is shown in pink. The areas in between high elevation habitat and disturbed non-high elevation habitat are non-disturbed non-high elevation habitat.
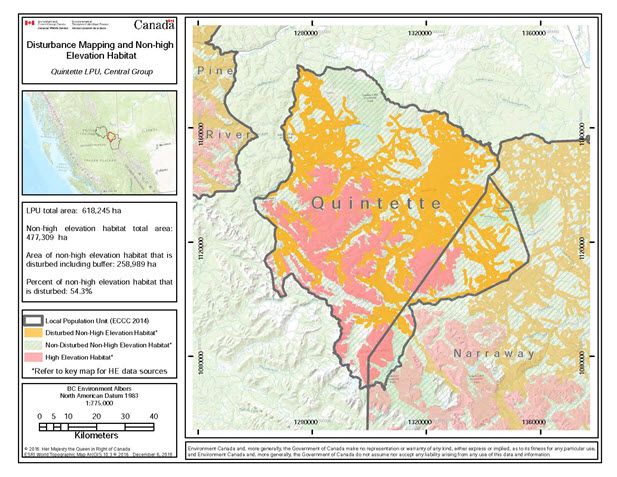
Long description for Map 4
This map shows the boundary of the Quintette Local Population Unit in a dark grey line. Inside that area, disturbed non-high elevation habitat is shown in orange, and occurs mostly in the northern half of the LPU boundary. In the southern half there is also some disturbed area mapped, in between high elevation habitat which is shown in pink. The areas in between high elevation habitat and disturbed non-high elevation habitat are non-disturbed non-high elevation habitat.
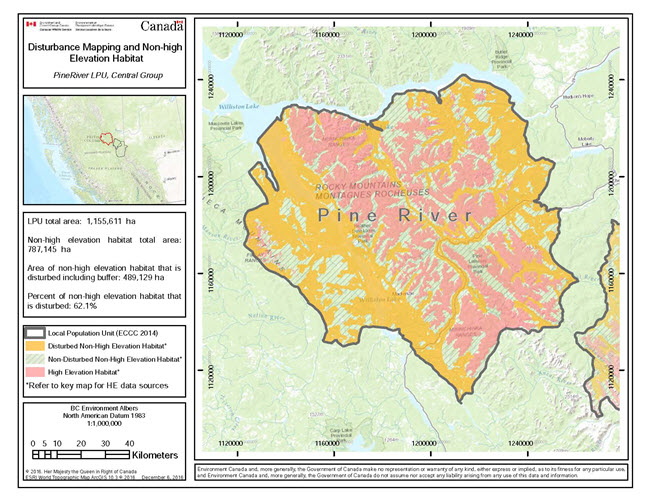
Long description for Map 5
This map shows the boundary of the Pine River Local Population Unit in a dark grey line. Inside that area, disturbed non-high elevation habitat is shown in orange, and occurs mostly in the northern half of the LPU boundary. In the southern half there is also some disturbed area mapped, in between high elevation habitat which is shown in pink. The areas in between high elevation habitat and disturbed non-high elevation habitat are non-disturbed non-high elevation habitat.
A recent analysis of the Quintette LPU found that 62% of the low elevation/matrix habitat was disturbed (Glencore 2016). This analysis followed the Environment Canada (2011) methodology for boreal caribou as applied to 2015 Landsat imagery. As such, it reflects more recent imagery, and therefore is likely indicative of additional recent disturbance, possibly explaining the higher disturbance value (62%) compared to the 58% reflected in Table 4, which is based on 2011 imagery.
Note that, unlike low elevation winter range and Type 1 matrix range, a minimum amount of 65% undisturbed habitat is not part of the definition of critical habitat for high elevation range.
2.7 Activities likely to result in destruction of critical habitat
The federal recovery strategy indicates that habitat destruction would result if a portion of the critical habitat were degraded, either permanently or temporarily, by activities occurring either within or external to the critical habitat, such that the habitat function provided by the degraded portion is no longer available to the species when needed.
The activities likely to result in destruction of critical habitat are listed in the federal recovery strategy as follows:
“Relevant to all categories of critical habitat, except Type 2 matrix range across all groups and Type 1 matrix range for the Southern Group, activities likely to result in destruction of critical habitat include, but are not limited to, the following:
- Any activity resulting in the direct loss of southern mountain caribou critical habitat. Examples of such activities include: conversion of habitat to agriculture, mines, and industrial and infrastructure development.
- Any activity resulting in the degradation of critical habitat leading to a reduced, but not total loss of both habitat quality and availability for southern mountain caribou. Examples of such activities include: forestry cut blocks, pollution, drainage of an area, and flooding.
- Any activity resulting in the cumulative fragmentation of habitat by human-made linear features during the time frame over which population and distribution objectives are to be achieved. Examples of such activities include: road development, seismic lines, pipelines, and hydroelectric corridors.
- Any activity that, if not sufficiently mitigated, results in displacement of southern mountain caribou from part or all of their seasonal ranges, and/or from the biophysical attributes of those ranges, that is sufficient to cause a reduction in their movements and/or reproductive success, or to lead to higher mortality leading to range retraction or population decline.
- Any activity that, if not sufficiently mitigated, increases the likelihood of increased predator density in critical habitat (e.g., alteration of habitat to conditions favourable to other ungulates).
- Any activity that, if not sufficiently mitigated, facilitates predator access to and within critical habitat (e.g., snowmobiling, snowshoeing, backcountry skiing).
Activities that are likely to result in the destruction of critical habitat of Type 2 matrix range across all groups and Type 1 matrix range in the Southern Group include, but are not limited to, the following:
- any activity that, if not sufficiently mitigated, increases the likelihood of increased predator density in critical habitat (e.g., alteration of habitat to conditions favourable to other ungulates); and/or,
- any activity that, if not sufficiently mitigated, reduces the effectiveness of predator management.”
ECCC has developed a draft flowchart to assist in determining whether a given activity is likely to result in destruction of critical habitat. This is shown in Figure One below.
As noted in section 2.6, preliminary disturbance mapping indicates that the federal recovery strategy threshold of 35% maximum disturbance for low elevation winter range and Type 1 matrix habitat has been exceeded in all three LPUs within the Central Group. Therefore critical habitat includes that which is currently undisturbed as well as adjacent habitats that over time would contribute to the attainment of 65% undisturbed habitat. In high elevation ranges, critical habitat includes that which is currently undisturbed as well as adjacent habitat that would become undisturbed through restoration.
The Study has identified five broad groupings of activities with the potential to impact caribou critical habitat, based on the threat assessment in the federal recovery strategy.
These groupings include:
- Forest harvesting –related (including road building)
- Mining-related (including coal & mineral exploration & road / transmission line building)
- Oil & gas-related (including road building, pipelines, and forest harvesting as a precursor)
- Renewable energy-related (e.g. windfarms, independent power projects & associated roads / infrastructure)
- Recreation-related (e.g. winter motorized & non-motorized recreation, ski hill expansion, summer ORV use)
Long description for figure 1
This figure describes a draft process to determine whether an activity is likely to result in destruction of critical habitat. It includes considerations about whether biophysical attributes are present, whether they would be removed, whether the effects of the activity are expected to be permanent or temporary, and whether the effects could facilitate predator access or contribute to increased prey density.