
Wild Species 2005: chapter 12
Summary of overall results
This report represents a huge achievement, by presenting general status assessments for all of Canada's vascular plant species, all of Canada's vertebrate species, and four groups of invertebrates. The largest group assessed was the vascular plants, with 5074 species, demonstrating the commitment of botanists across the country to assessing and conserving Canada's plants. Despite the number and variety of species assessed, this report represents only about 10% of the total number of species that have been described in Canada! The most species rich regions are Ontario (4052 species, Figure 3-1), British Columbia (3628 species) and Quebec (3328 species), due to the variation in climate and geology that provide diverse habitats in which different species can survive. However, the region with the highest diversity (species richness/area) is Prince Edward Island; the region where you can see the highest number of species in the smallest area!
The majority of the 7732 species assessed in this report received Canada ranks of Secure (3541 species, 46%, Figures 3-1 and 3-2). This number varied by species group, ranging from 17% (fishes) to 70% (tiger beetles). Similarly the proportion of species with Canada ranks of At Risk and May Be At Risk ranged from 0% (crayfishes) to 32% (reptiles, Figure 3-3). However, part of the variation in the proportion of species with low or high levels of risk is associated with variation in the proportion of species with Canada ranks of Undetermined, Not Assessed, Exotic or Accidental (e.g. fishes has a large proportion of species ranked Undetermined and Not Assessed, and a correspondingly small proportion of species ranked Secure). Therefore, to get a clearer picture of which species groups are most secure, or most at risk, we can focus just on species with Canada ranks of At Risk, May Be At Risk, Sensitive and Secure (Figure 3-4). This shows that reptiles and freshwater mussels have the lowest proportion of species with Canada ranks of Secure and the highest proportion of species with Canada ranks of At Risk and May Be At Risk. Amphibians also have a high proportion of species ranked At Risk. A similar graph, comparing regional ranks among provinces, territories and ocean regions, shows that the four ocean regions, and especially the Eastern Arctic Ocean region, have relatively high proportions of species ranked At Risk (Figure 3-5).
Exotic species have been introduced to Canada, both deliberately and accidentally, from around the world. In addition, species with regional ranks of Exotic are often native species that have been moved from regions of the country in which they traditionally occur, to regions in which they are not naturally found. Whether from abroad, or from a different part of Canada, Exotic species can cause problems for native species in a variety of ways, including competition for space and resources, predation, hybridization and introduction of new diseases. Most of the species that were given a Canada rank of Exotic in this report are vascular plants (Table 3-1); in fact, vascular plants have the highest proportion of Exotic species of any group covered in this report (Figure 3- 6). Crayfishes also have a high proportion of species with Canada ranks of Exotic. However, the species group with the lowest proportion of regularly occurring, native species is the birds, since a large proportion of bird species are Accidental (i.e. do not regularly occur in Canada). The proportion of regularly occurring, native species is higher in the territories than in the provinces (Figure 3-7). This is probably due to a combination of reduced human activity in the north, the harsh climate, which makes it difficult for new species to survive, and the distance from sources of non-native species.
For most species groups and regions, the proportion of species ranked Undetermined or Not Assessed is low, typically less than 10% (Figures 3-8 and 3-9). This shows how much importance was placed on gathering together enough information to allow a true assessment of each species. We hope that this report will encourage more information to be collected on species currently ranked Undetermined or Not Assessed. The fishes, in particular the marine fishes, had a much higher proportion of species with Canada ranks of Undetermined or Not Assessed than any other group. This reflects the difficulty of surveying fishes in remote, off-shore locations. Without information on the status of these species, it is difficult to judge how human uses of the oceans affect ocean ecosystems and species.
One of the important achievements of this report is to update the status assessments of ferns and orchids, freshwater fishes, amphibians, reptiles, birds and mammals. Updates have resulted in the addition of 28 new species to the national list, due to a combination of species that are new to Canada, and taxonomic changes. Just as importantly, 35 species have been removed from the national list, primarily due to taxonomic changes. Updating the national species lists in this way, keeps the general status program and the Wild Species series abreast of the latest scientific knowledge.
Of the 1330 species that were ranked in both 2000 and 2005, the vast majority have retained the Canada rank they were given in 2000 (1164 species, 87%, Figure 3-10). Of the 166 changes that were made to Canada ranks, most were due to changes in process (40%, 67 changes, Figure 3- 11) or to new or updated Committee on the Status of Endangered Wildlife in Canada (COSEWIC) assessments (33%, 54 changes). Only 10 changes (6%) were wholly or partly due to biological change in species population size, distribution, threats or trends. In total, 39% of changes involved species moving into a rank with an increased level of risk (65 changes), 31% involved species moving into a rank with a reduced level of risk (51 changes), and 30% involved species moving into or out of the Undetermined, Not Assessed, Accidental or Extirpated ranks (50 species). Considering only the species ranked in both 2000 and 2005, changes in Canada rank have had no significant impact on the proportion of species in each general status category.
One of the aims of the Wild Species series is to help COSEWIC prioritize species for detailed status assessments. In this report, three groups that have not yet been covered by COSEWIC have been assessed; crayfishes, tiger beetles and odonates. Thirty-two of the 250 species in these three groups have been given Canada ranks of May Be At Risk (Table 3-1), suggesting that these species may require detailed COSEWIC status assessments. In addition, the general status program has built contacts and relationships with people working on these species groups that will benefit both the general status program, and COSEWIC. In the future we hope that the Wild Species series will continue to assess groups that have not been assessed by COSEWIC, in order to help prioritize species for detailed COSEWIC assessments. However, as the Wild Species program assesses species groups which are not well-known or well-studied in Canada (e.g. grasshoppers and crickets), the proportion of species that receive ranks of Undetermined and Not Assessed is likely to rise.
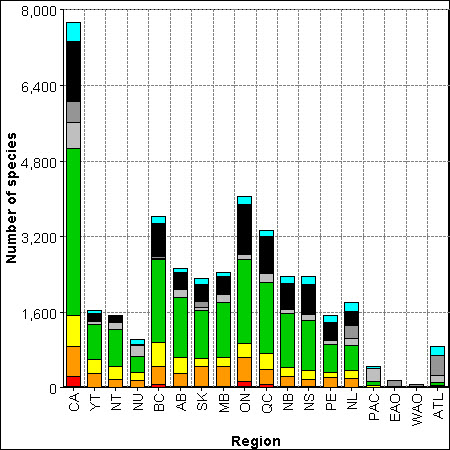
Long description for Figure 3-1
Figure 3-1 illustrates species richness and the 2005 general status ranks of wild species in Canada and by region. In Canada as a whole there were 30 extirpated, 5 extinct, 206 at risk, 634 may be at risk, 657 sensitive, 3541 secure, 534 undetermined, 465 not assessed, 1254 exotic, and 406 accidental species for a total of 218 species. Broken down by region: In the Yukon there was 1 species at risk, 296 may be at risk, 300 sensitive, 757 secure, 62 undetermined, 2 not assessed, 139 exotic and 72 accidental for a total of 1649 species. In the Northwest Territories there were 4 species at risk, 183 may be at risk, 258 sensitive, 793 secure, 152 undetermined, 17 not assessed, 98 exotic and 39 accidental species for a total of 1544 species. In Nunavut there was 1 species ranked extirpated, 1 extinct, 2 at risk, 149 may be at risk, 168 sensitive, 349 secure, 221 undetermined, 10 not assessed, 15 exotic, and 106 accidental species for a total of 1022 species. In British Columbia there were 8 species ranked extirpated, 1 extinct, 64 at risk, 382 may be at risk, 515 sensitive, 1748 secure, 19 undetermined, 57 not assessed, 699 exotic and 135 accidental species for a total of 3628 species. In Alberta there were 4 species ranked extirpated, 1 extinct, 24 at risk, 286 species that may be at risk, 326 sensitive, 1272 secure, 175 undetermined, 23 not assessed, 324 exotic and 100 accidental species for a total of 2535 species. In Saskatchewan there were 3 species ranked extirpated, 1 extinct, 34 at risk, 418 may be at risk, 157 sensitive, 1022 secure, 75 undetermined, 118 not assessed, 361 exotic and 119 accidental species for a total of 2308 species. In Manitoba there were 6 species ranked extirpated, 1 extinct, 29 at risk, 426 may be at risk, 189 sensitive, 1155 secure, 178 undetermined, 2 not assessed, 375 exotic and 79 accidental species for a total of 2440 species. In Ontario there were 30 species ranked extirpated, 2 extinct, 109 at risk, 511 may be at risk, 291 sensitive, 1779 secure, 98 undetermined, 3 not assessed, 1056 exotic and 173 accidental species for a total of 4052 species. In Quebec there were 14 species ranked extirpated, 4 extinct, 60 at risk, 308 may be at risk, 350 sensitive, 1486 secure, 198 undetermined, 7 not assessed, 773 exotic and 128 accidental species for a total of 3328 species. In New Brunswick there were 13 species ranked extirpated, 3 extinct, 17 at risk, 200 may be at risk, 206 sensitive, 1138 secure, 80 undetermined, 4 not assessed, 554 exotic and 147 accidental species for a total of 2362 species. In Nova Scotia there were 16 species ranked extirpated, 3 extinct, 18 at risk, 143 may be at risk, 183 sensitive, 1062 secure, 134 undetermined, 2 not assessed, 622 exotic and 179 accidental species for a total of 2362 species. In Prince Edward Island there were 12 species ranked extirpated, 1 extinct, 3 at risk, 208 may be at risk, 99 sensitive, 607 secure, 80 undetermined, 2 not assessed, 375 exotic and 150 accidental species for a total of 1537 species. In Newfoundland and Labrador there were 2 extinct species, 8 at risk, 181 may be at risk, 189 sensitive, 521 secure, 148 undetermined, 281 not assessed, 295 exotic, and 174 accidental species for a total of 1799 species. In the Pacific Ocean Region there were 11 species at risk, 7 may be at risk, 26 sensitive, 83 secure, 282 undetermined, 3 not assessed, and 45 accidental species for a total of 457 species. In the Eastern Arctic Ocean there were 2 species at risk, 8 sensitive, 10 secure, 15 undetermined and 130 not assessed species for a total of 165 species. In the Western Arctic Ocean region there was 1 species at risk, 2 sensitive, 12 secure, 7 undetermined, 50 not assessed, and 9 accidental for a total of 81 species. In the Atlantic Ocean Region there was 1 species ranked extirpated, 1 extinct, 12 at risk, 11 may be at risk, 30 sensitive, 69 secure, 139 undetermined, 430 not assessed, and 178 accidental species for a total of 871 species.
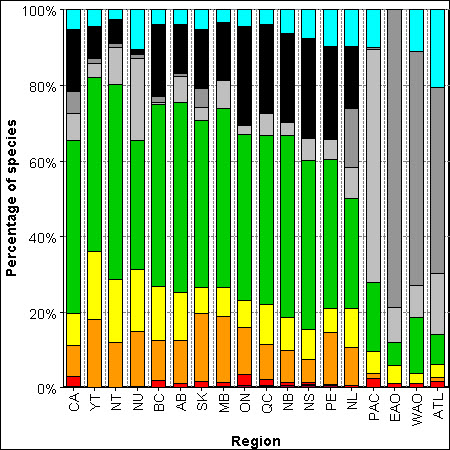
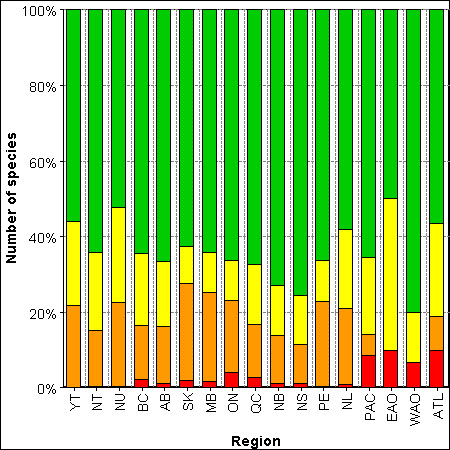
Long description for Figure 3-2
Figure 3-2 compares the general status ranks of species as a percentage across the provincial, territorial and ocean regions of Canada. In Canada as a whole 3.2% of species were at risk, 8% may be at risk, 8% were sensitive, 46% were secure, 7% were undetermined, 6% were not assessed, 16% were exotic, and 5% were accidental. Broken down by region: In the Yukon 18% of species may be at risk, 18% were sensitive, 46% were secure, 7% were undetermined, 6% were not assessed, 16% were exotic and 5% were accidental. In the Northwest Territories 12% of species may be at risk, 17% were sensitive, 51% were secure, 10% were undetermined, 1% was not assessed, 6% were exotic and 3% were accidental. In Nunavut 15% of species may be at risk, 16% were sensitive, 34% secure, 22% undetermined, 1% not assessed, 1% exotic, and 10% accidental. In British Columbia 2% of species were at risk, 11% may be at risk, 14% were sensitive, 48% were secure, 1% was undetermined, 2% were not assessed, 19% were exotic and 4% were accidental. In Alberta 1% of species were at risk, 11% may be at risk, 13% were sensitive, 50% were secure, 7% were undetermined, 1% were not assessed, 13% were exotic and 4% were accidental. In Saskatchewan 1% of species were at risk, 18% may be at risk, 7% were sensitive, 44% were secure, 3% were undetermined, 5% were not assessed, 16% were exotic and 5% were accidental. In Manitoba 1% of species were at risk, 17% may be at risk, 8% were sensitive, 47% were secure, 7% were undetermined, 15% were exotic and 3% were accidental. In Ontario 1% of species were extirpated, 3% were at risk, 13% may be at risk, 7% were sensitive, 44% were secure, 2% were undetermined, 26% were exotic and 4% were accidental. In Quebec 2% of species were at risk, 9% may be at risk, 11% were sensitive, 45% were secure, 6% were undetermined, 23% were exotic and 4% were accidental. In New Brunswick 1% of species were extirpated, 1% were at risk, 8% may be at risk, 9% were sensitive, 48% were secure, 3% were undetermined, 23% were exotic and 6% were accidental. In Nova Scotia 1% of species were extirpated, 1% were at risk, 6% may be at risk, 8% were sensitive, 45% were secure, 6% were undetermined, 26% were exotic and 8% were accidental. In Prince Edward Island 1% of species were extirpated, 14% may be at risk, 6% were sensitive, 39% were secure, 5% were undetermined, 24% were exotic and 10% were accidental. In Newfoundland and Labrador 10% of species may be at risk, 11% were sensitive, 29% were secure, 8% were undetermined, 16% were not assessed, 16% were exotic and 10% were accidental. In the Pacific Ocean Region 2% of species were at risk, 2% may be at risk, 6% were sensitive, 18% were secure, 62% were undetermined, 1% was not assessed and 10% were accidental species. In the Eastern Arctic Ocean Region 1% of species were at risk, 5% were sensitive, 6% were secure, 9% were undetermined, and 79% were not assessed. In the Western Arctic Ocean Region 1% of species were at risk, 2% were sensitive, 15% were secure, 9% were undetermined, 62% were not assessed and 11% were accidental. In the Atlantic Ocean Region Ocean Region 1% of species were at risk, 1% may be at risk, 3% were sensitive, 8% were secure, 16% were undetermined, 49% were not assessed and 20% were accidental.
| Rank | CA | YT | NT | NU | BC | AB | SK | MB | ON | QC | NB | NS | PE | NL | PAC | EAO | WAO | ATL |
|---|---|---|---|---|---|---|---|---|---|---|---|---|---|---|---|---|---|---|
| Extirpated | 30 | 0 | 0 | 1 | 8 | 4 | 3 | 6 | 30 | 14 | 13 | 16 | 12 | 0 | 0 | 0 | 0 | 1 |
| Extinct | 5 | 0 | 0 | 1 | 1 | 1 | 1 | 1 | 2 | 4 | 3 | 3 | 1 | 2 | 0 | 0 | 0 | 1 |
| At risk | 206 | 1 | 4 | 2 | 64 | 24 | 34 | 29 | 109 | 60 | 17 | 18 | 3 | 8 | 11 | 2 | 1 | 12 |
| May be at risk | 634 | 296 | 183 | 149 | 382 | 286 | 418 | 426 | 511 | 308 | 200 | 143 | 208 | 181 | 7 | 0 | 0 | 11 |
| Sensitive | 657 | 300 | 258 | 168 | 515 | 326 | 157 | 189 | 291 | 350 | 206 | 183 | 99 | 189 | 26 | 5 | 2 | 30 |
| Secure | 3541 | 757 | 793 | 349 | 1748 | 1272 | 1022 | 1155 | 1779 | 1486 | 1138 | 1062 | 607 | 521 | 83 | 10 | 12 | 69 |
| Undetermined | 534 | 62 | 152 | 221 | 19 | 175 | 75 | 178 | 98 | 198 | 80 | 134 | 80 | 148 | 282 | 15 | 7 | 139 |
| Not assessed | 465 | 22 | 17 | 10 | 57 | 23 | 118 | 2 | 3 | 7 | 4 | 2 | 2 | 281 | 3 | 130 | 50 | 430 |
| Exotic | 1254 | 139 | 98 | 15 | 699 | 324 | 361 | 375 | 1056 | 773 | 554 | 622 | 375 | 295 | 0 | 0 | 0 | 0 |
| Accidental | 406 | 72 | 39 | 106 | 135 | 100 | 119 | 79 | 173 | 128 | 147 | 179 | 150 | 147 | 45 | 0 | 9 | 178 |
| Total | 7732 | 1649 | 1544 | 1022 | 3628 | 2535 | 2308 | 2440 | 4052 | 3328 | 2362 | 2362 | 1537 | 1799 | 457 | 165 | 81 | 871 |
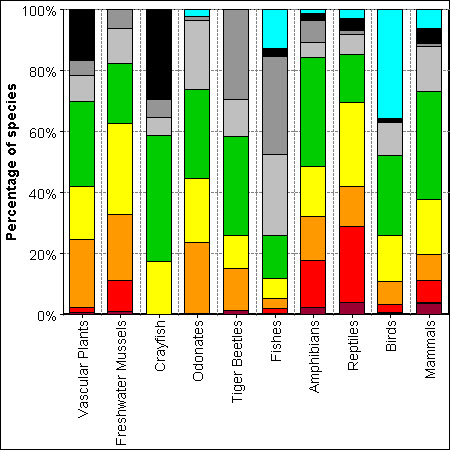
Long description for Figure 3-3
Figure 3-3 compares the 2005 general status ranks of wild species, as a percentage, for 10 taxonomic groups in Canada: vascular plants, freshwater mussels, crayfish, odonates, tiger beetles, fishes, amphibians, reptiles, birds and mammals. Vascular plant species were 2% at risk, 11% may be at risk, 9% sensitive, 51% secure, 2% undetermined, 1% not assessed, and 24% exotic. Freshwater mussel species were 2% extirpated, 15% at risk, 16% may be at risk, 27% sensitive, 35% secure, 4% undetermined, and 2% not assessed. Crayfish species were 18% sensitive, 64% secure and 18% exotic. Odonate species were 13% may be at risk, 13% sensitive, 69% secure, 3% undetermined, and 1% accidental. Tiger beetle species were 2% at risk, 11% may be at risk, 9% sensitive, 51% secure, 2% undetermined, 1% not assessed, and 24% exotic. Fish species were 2% at risk, 1% may be at risk, 5% sensitive, 17% secure, 28% undetermined, 31% not assessed, 1% exotic, and 14% accidental. Amphibian species were 20% at risk, 15% sensitive, and 65% secure. Reptile species were 6% extirpated, 28% at risk, 4% may be at risk, 26% sensitive, 26% secure, 2% undetermined, 4% exotic and 4% accidental. Bird species were 4% at risk, 2% may be at risk, 6% sensitive, and 55% secure, 1% undetermined, 2% exotic and 30% accidental. Mammal species were 6% at risk, 5% may be at risk, 11% sensitive, 64% secure, 5% undetermined, 5% exotic and 3% accidental.
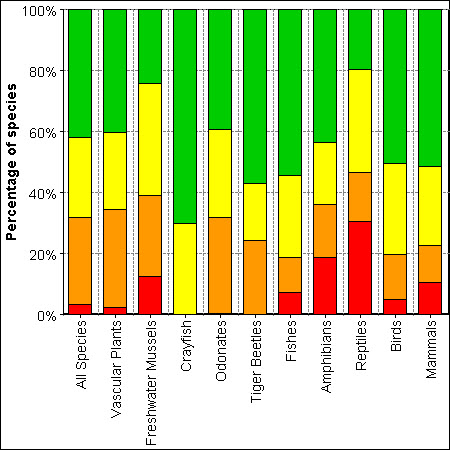
Long description for Figure 3-4
Figure 3.4 illustrates the percentages of 2005 status ranks for each of the 10 taxonomic groups (vascular plants, freshwater mussels, crayfish, odonates, tiger beetles, fishes, amphibians, reptiles, birds, and mammals) as well as all species combined. Species ranked extinct, extirpated, undetermined, not assessed, exotic and accidental were excluded. Ranks for all species compiled were: 4% at risk, 13% may be at risk, 13% sensitive, and 70% secure. Vascular plant species were 3% at risk, 15% may be at risk, 12% sensitive, and 70% secure. Freshwater mussel species were 16% at risk, 18% may be at risk, 29% sensitive, and 37% secure. Crayfish species were 22% sensitive and 78% secure. Odonate species were 14% may be at risk, 14% sensitive, and 73% secure. Tiger beetle species were 17% may be at risk, 10% sensitive, and 72% secure. Fish species were 8% at risk, 5% may be at risk, 19% sensitive, and 69% secure. Amphibian species were 20% at risk, 15% sensitive, and 65% secure. Reptile species were 33% at risk, 5% may be at risk, 31% sensitive, and 31% secure. Bird species were 6% at risk, 3% may be at risk, 9% sensitive, and 82% secure. Mammal species were 7% at risk, 5% may be at risk, 13% sensitive, and 74% secure.
Long description for Figure 3-5
Figure 3-5 compares the status ranks of species assessed across the different regions of Canada as a percentage. Species ranked extinct, extirpated, undetermined, not assessed, exotic and accidental were excluded. In the Yukon 22% of species may be at risk, 22% were sensitive, and 70% were secure. In the Northwest Territories 15% of species may be at risk, 21% were sensitive and 56% were secure. In Nunavut 22% of species may be at risk, 25% were sensitive, and 52% were secure. In British Columbia 2% of species were at risk, 14% may be at risk, 19% were sensitive, and 65% were secure. In Alberta 1% of species were at risk, 15% may be at risk, 17% were sensitive and 67% were secure. In Saskatchewan 2% of species were at risk, 26% may be at risk, 10% were sensitive and 63% were secure. In Manitoba 2% of species were at risk, 24% may be at risk, 11% were sensitive and 64% were secure. In Ontario 4% of species were at risk, 19% may be at risk, 11% were sensitive and 66% were secure. In Quebec 3% of species were at risk, 14% may be at risk, 16% were sensitive and 67% were secure. In New Brunswick 1% of species were at risk, 13% may be at risk, 13% were sensitive and 73% were secure. In Nova Scotia 1% of species were at risk, 10% may be at risk, 13% were sensitive and 76% were secure. In Prince Edward Island 23% of species may be at risk, 11% were sensitive and 66% were secure. In Newfoundland and Labrador 1% of species were at risk, 20% may be at risk, 21% were sensitive and 58% were secure. In the Pacific Ocean Region 9% of species were at risk, 5% may be at risk, 21% were sensitive and 65% were secure. In the Eastern Arctic Ocean Region 10% of species were at risk, 40% were sensitive and 50% were secure. In the Western Arctic Ocean Region 10% of species were at risk, 13% were sensitive and 80% were secure. In the Atlantic Ocean Region Ocean Region 8% of species were at risk, 10% may be at risk, 25% were sensitive and 57% were secure.
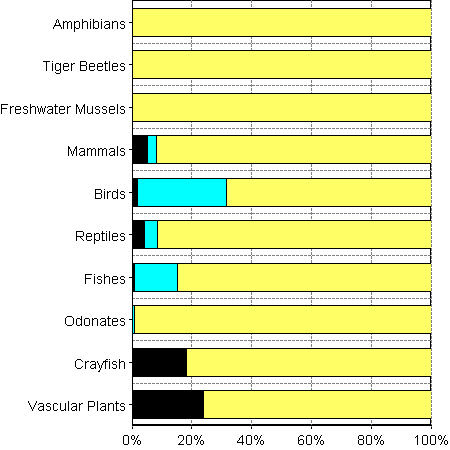
Long description for Figure 3-6
Figure 3-6 compares the proportion of species ranked as exotic or as accidental among the species groups. There were no species of amphibians, tiger beetles, or freshwater mussels that were ranked as exotic or accidental. Five percent of mammal species were exotic and 3% were accidental. Two percent of bird species were exotic and 30% were accidental. Four percent of reptile species were exotic and 4% were accidental. One percent of fish species were exotic and 14% were accidental. There were no exotic odonate species, though 1% of them were accidental. Eighteen percent of crayfish species were exotic, though none were accidental. Twenty four percent of vascular plant species were exotic, and none were accidental.
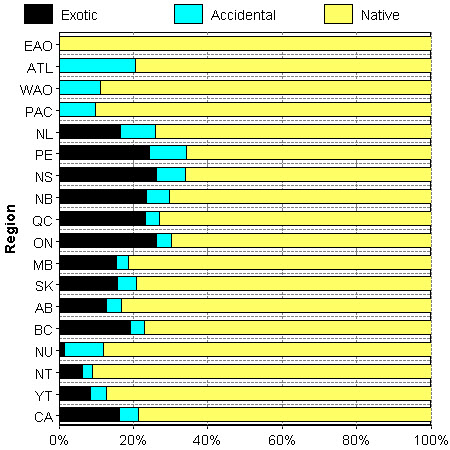
Long description for Figure 3-7
Figure 3-7 compares the proportion of species ranked Exotic and accidental among the regions of Canada. In the Eastern Arctic Ocean region there were no exotic or accidental species. In the Atlantic Ocean region there were no exotic species, and 20% of species were accidental. In the Western Arctic Ocean there were no exotic species, and 11% were considered accidental. In the Pacific Ocean region there were no exotic species, and 10% of species were considered accidental. In Newfoundland and Labrador, 16% of species were exotic and 10% were considered accidental. In Prince Edward Island 24% of species were exotic and 10% were considered accidental. In Nova Scotia 26% of species were exotic and 8% were considered accidental. In New Brunswick 23% of species were exotic and 6% were considered accidental. In Quebec 23% of species were exotic and 4% were considered accidental. In Ontario 26% of species were exotic and 4% were considered accidental. In Manitoba 15% of species were exotic and 3% were considered accidental. In Saskatchewan 16% of species were exotic and 5% were considered accidental. In Alberta 13% of species were exotic and 4% were considered accidental. In British Columbia 19% of species were exotic and 4% were considered accidental. In Nunavut 1% of species were exotic and 10% were considered accidental. In the Northwest Territories 6% of species were exotic and 3% were considered accidental. In the Yukon, 8% of species were exotic and 4% were considered accidental. In Canada as a whole, 16% of species were considered exotic and 5% were accidental.

Long description for Figure 3-8
Figure 3-8 compares the proportion of species ranked Undetermined and Not Assessed among species groups. Neither amphibians nor crayfish included any species ranked undetermined or not assessed. The mammals were comprised of 5% undetermined species and no species that were not assessed. One percent of birds were undetermined and none that were not assessed. Reptiles included 2% of species that were undetermined and none that were not assessed. Fishes included 28% of species that were undetermined and 32% of species that were not assessed. Tiger Beetles included 3% of species that were undetermined and none that were not assessed. Odonates included 3% of species that were undetermined and none that were not assessed. Freshwater mussels included 4% of species that were undetermined and 2% of species that were not assessed. Vascular plants comprised of 2% of species that were undetermined and 1% that were not assessed.
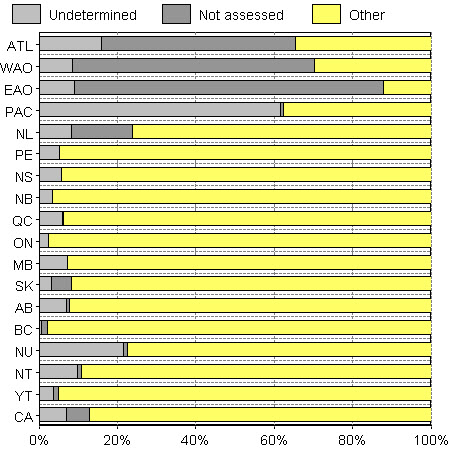
Long description for Figure 3-9
Figure 3-9 compares the proportion of species ranked undetermined and not assessed among the regions of Canada. In the Atlantic Ocean region, 16% of species were undetermined and 50% were not assessed. In the Western Arctic Ocean region 9% of species were undetermined and 62% were not assessed. In the Eastern Arctic Ocean region 9% of species were undetermined and 79% were not assessed. In the Pacific Ocean region 61% of species were undetermined and 1% were not assessed. In Newfoundland and Labrador, 8% of species were undetermined and 16% were unassessed. In Prince Edward Island 5% of species were undetermined and 0% were not assessed. In Nova Scotia 6% of species were undetermined and 0% were not assessed. In New Brunswick 3% of species were undetermined and none were not assessed. In Quebec 6% of species were undetermined and none were not assessed. In Ontario 2% of species were undetermined and 0% were not assessed. In Manitoba 7% of species were undetermined and none were not assessed. In Saskatchewan 3% of species were undetermined and 5% were not assessed. In Alberta 7% of species were undetermined and 1% were not assessed. In British Columbia 1% of species were undetermined and 2% were not assessed. In Nunavut 22% of species were undetermined and 1% were not assessed. In the Northwest Territories 10% of species were undetermined and 1% were not assessed. In the Yukon 4% of species were undetermined and 1% were not assessed. In Canada as a whole 7% of species were undetermined and 6% were not assessed.
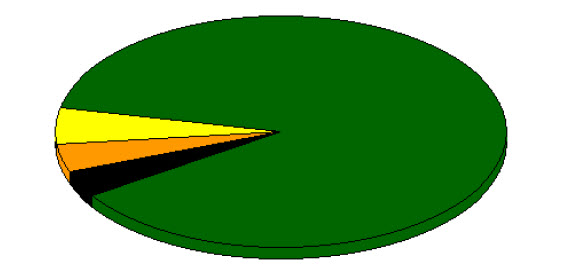
Long description for Figure 3-10
Figure 3-10 is a pie chart showing the numbers of species with changes in Canada rank, for species ranked both in the Wild Species 2000 and 2005 reports. There was no change in rank for 1164 species. Sixty five species changed to a rank with an increased level of risk and 51 species changed to a rank with reduced level of risk. For 50 species the rank changed to or from the categories of undetermined, not assessed, exotic, accidental, or extirpated.
| Classification changement en Canada | Numero |
|---|---|
| Aucun changement | 1164 |
| Passage à une catégorie ayant un niveau de risque supérieur | 65 |
| Passage à une catégorie ayant un niveau de risque inférieur | 51 |
| Passage aux catégories indéterminée, non évaluée, exotique, occasionnelle ou disparue du Canada, ou retrait de celles ci. | 50 |
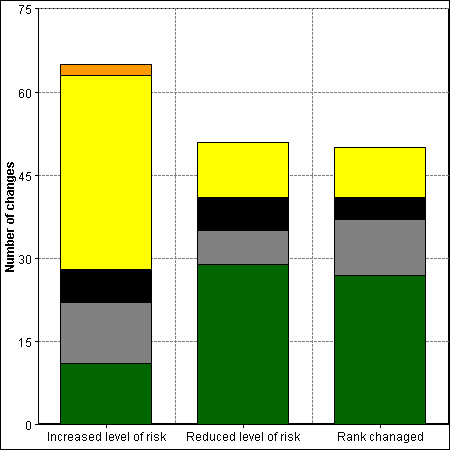
Long description for Figure 3-11
Figure 3-11 presents the reasons for change in Canada ranks since the Wild Species 2000 report. For species that changed rank with an increased level of risk, 11 changes were due to a change in process, 11 were due to improved knowledge of the species, 6 were due to a combination of reasons, 35 were due to new or updated COSEWIC assessment, and 2 were due to a biological change. For species that changed rank with a reduced level of risk, 29 changes were due to a change in process, 6 were due to improved knowledge, 6 were for a combination of reasons, 10 were due to new or updated COSEWIC assessment, and 0 were due to a biological change. For those species whose rank changed to or from the categories of undetermined, not assessed, exotic, accidental or extirpated, 27 changes were due to a change in process, 10 were due to improved knowledge, 4 were for a combination of reasons, 9 were due to new or updated COSEWIC assessment, and 0 were due to a biological change.
| Rank | Process | Improved knowledge | Combination of reasons | New or updated COSEWIC assessment | Biological change |
|---|---|---|---|---|---|
| Change to rank with increased level of risk. | 11 | 11 | 6 | 35 | 2 |
| Change to rank with reduced level of risk. | 29 | 6 | 6 | 10 | 0 |
| Rank changed to or from Undetermined, Not Assessed, Exotic, Accidental or Extirpated categories. | 27 | 10 | 4 | 9 | 0 |
Next Steps
The vision of the Wild Species series is of a single platform for wild species assessment and monitoring: a tool that allows a wide variety of species from all regions of Canada to be ranked under the same system. This allows everyone from the resource manager to the high school student the ability to place a species in a geographic, taxonomic, and ecological context, and to gain an impression of the species' general status in that context. Wild Species 2005 has contributed to this goal by increasing the number and variety of species assessed by the general status program, and by providing updated ranks for species first assessed in 2000. However, the Wild Species series is a product of an ongoing, national program and the next report will aim to include an even broader diversity of species. Priorities for the future of the Wild Species series include:
- Increase the number and variety of species assessed. This report increased the number of species assessed to almost 8000, including all of Canada's vertebrate species, all of Canada's vascular plants, and four important groups of invertebrates. Still, this represents only about 10% of the species known to reside in Canada! The vast majority of species left to be assessed are insects and other invertebrates. To date, the general status program has focused on groups for which experts and information are fairly readily available. However, as the program delves deeper into insects and other invertebrates, non-vascular plants and algae, fungi and lichens, information will be less readily available and the process of assessing Canada's wild species will become even more challenging. Nevertheless, the benefits of assessing these less well-known groups will be enormous, and the results will be helpful to the Committee on the Status of Endangered Wildlife in Canada (COSEWIC) in prioritizing species for detailed status assessments. In particular, the National General Status Working Group is planning on assessing the mosses, lichens, grasshoppers and crickets, and some families of moths for the next Wild Species report.
- Address gaps in coverage for those species groups already assessed. Data were lacking for some species in some regions (Not Assessed), or the data were insufficient to allow a confident assessment of the species' general status to be made (Undetermined). It is hoped that the Wild Species series will continue to raise the profile of existing data gaps and stimulate people either to contribute data for these species, or to collect new data to address these shortfalls. In particular, it is hoped that the Wild Species series will stimulate more basic survey work on the distribution and abundance of Canadian species.
- Continue to update general status assessments. Updating general status assessments has two benefits. Firstly it allows the incorporation of new data and new data sources, to maintain the best possible estimate of species' status. Secondly, periodically updating general status assessments will allow Canadians to track patterns of improvement or decline in species' status through time. Such patterns not only give a better indication of the nature and magnitude of a problem, but also may point the way to improved conservation practices.
- First report under the Species At Risk Act. Under the federal Species At Risk Act (SARA), proclaimed in June 2003, a general report on the status of wildlife in Canada must be prepared every five years and be made available to the public on the SARA public registry. The first of these reports is due in 2008, and Wild Species 2005 will be a major source of information for this report. For more information, please visit the SARA public registry website.
The Wild Species series highlights both the wealth of knowledge we have about Canada's wild species, and the information gaps that need to be filled. In the future, the Wild Species series will continue to consolidate our knowledge of wild species by using information from experts, both amateurs and professionals, to create a baseline for comparison of the status of Canada's species. We hope that people will be encouraged by the release of these reports to contribute data on their own, or to become involved with general status assessments in their province or territory. If you want to help in the effort to collect information on Canada's species, see Appendix I.
Human impacts upon natural systems can be complex, subtle, and ongoing and largescale, long-term programs, like the Wild Species series, are essential in understanding exactly what these impacts are. Future reports will continue to require long hours from experts across the country, but this effort is a small price to pay to help sustain Canada's majestic natural heritage.