
Gulf of Maine quarterly climate impacts and outlook: September 2014
September 2014
Gulf of Maine Significant Events - for June-August 2014
Rounds of heavy rain occurred throughout the region in June. New Brunswick saw 50-80 mm (2-3 in.) of rain from June 5-7, with the highest total of 95 mm (3.75 in.) in Grand Manan. From June 25-26, parts of Maine and New Hampshire saw up to 118 mm (4.66 in.) of rain, which caused flash flooding.
Several consecutive days of heat and high humidity occurred in late June and early July. Heat warnings were in place for New Brunswick for up to a week. On July 2, Miramichi, NB, set a daily record high of 34.5°C (94°F), and Caribou, ME, tied its all-time warmest low temperature of 21.7°C (71°F). In addition, Caraquet, NB, had its warmest July on record (since 1889).
Hurricane Arthur moved through the region on July 4-6. New Brunswick, eastern Maine, and coastal Massachusetts saw heavy rain, with many sites exceeding 100 mm (3.94 in.). The greatest total was reported at Upsalquitch Lake, NB, at 192 mm (7.56 in.). Wind gusts exceeded 90 km/h (56 mph) at nearly 30 locations in the Maritimes, with a max gust of 138 km/h (86 mph) in Greenwood, NS. See the Regional Impacts section for details.
Straight line winds of up to 161 km/h (100 mph) damaged hundreds of trees in Maine, New Hampshire, and Massachusetts in early and mid-July. An EF-1 tornado caused damage in Somerset County, ME, on July 15, and another EF-1 tornado occurred in York County, ME, on July 28. Also on the 28th, an EF-2 tornado touched down in Suffolk County, MA, making it the first tornado to strike the county since records began in 1950.
Due to dry conditions in much of Nova Scotia, the area burned by forest fires this summer was more than twice the recent 5-year average (but less than the 10-year average). New Brunswick had wet conditions, and the area burned by forest fires was about half the recent 5-year and 10-year averages. Abnormally dry conditions persisted through summer in parts of Massachusetts.
Long description
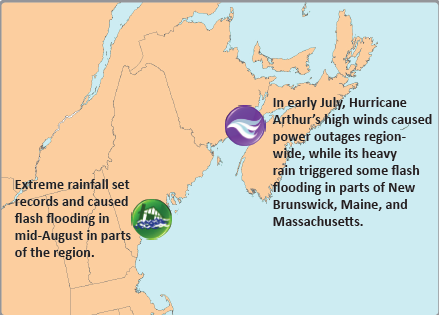
This map shows all states, provinces, and marine areas represented in this report including the American states of Massachusetts, New Hampshire and Maine and the Canadian provinces of New Brunswick, and Nova Scotia. It includes the Atlantic Ocean marine areas bordering these states and provinces. Highlights noted on the map include: In early July, Hurricane Arthur’s high winds caused power outages region-wide, while its heavy rain triggered some flash flooding in parts of New Brunswick, Maine, and Massachusetts. Extreme rainfall set records and caused flash flooding in mid-August in parts of the region.
Extreme rainfall caused flash flooding in parts of the region on August 13-14. Portland, ME, had 163 mm (6.43 in.) of rain on the 13th, making it the greatest daily precipitation for any calendar day that was non-tropical based. The site saw 65 mm (2.57 in.) of rain from 9 p.m. to 10 p.m., setting a new hourly record. Another 42 mm (1.64 in.) of rain fell from 10 p.m. to 11 p.m. The consecutive two-hour rain total of 107 mm (4.21 in.) also set a record. New Brunswick saw up to 111 mm (4.37 in.) of rain. In southern Maine, the runoff overwhelmed sewer systems, prompting the closure of some clam flats and beaches due to potentially contaminated water.
Regional Climate Overview - for June 1-August 31, 2014
Precipitation
Percent of Normal: June 1-August 31, 2014
Long description
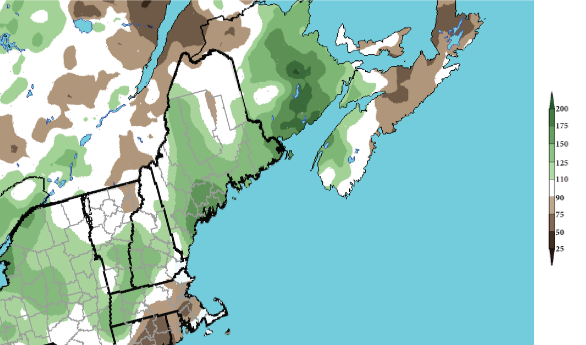
Precipitation Percent of Normal map of the Gulf of Maine region (Massachusetts, New Hampshire, Maine, New Brunswick and Nova Scotia) showing the percent of normal precipitation for June 1 to August 31 2014. The map uses colors ranging from white to shades of darker brown for below normal precipitation and white to shades of dark green for above normal precipitation. This map for the summer indicates that the region saw 50-200% of normal rainfall. Massachusetts, northwestern New Brunswick, and northern New Brunswick were drier than normal. Most of Maine, New Hampshire, and New Brunswick were wetter than normal.
During summer, the region saw 50-200% of normal rainfall. Massachusetts, northwestern New Brunswick, and northern Nova Scotia were drier than normal. Most of Maine, New Hampshire, and New Brunswick were wetter than normal. Precipitation was highly variable in June, ranging from 25% to 225% of normal. The driest areas were in Massachusetts and southern New Hampshire, while the wettest areas were in southern New Brunswick and western Nova Scotia. In July, the U.S. and New Brunswick saw 150-300% of normal rainfall due in part to Hurricane Arthur. The three states ranked this July among their top 15 wettest. Southern Nova Scotia saw near-normal rainfall, but northern areas saw 25-75% of normal. In August, much of the region saw 25-110% of normal precipitation; however, portions of southern coastal Maine saw up to 275% of normal.
Temperature
Departure from Normal: June 1-August 31, 2014
Long description
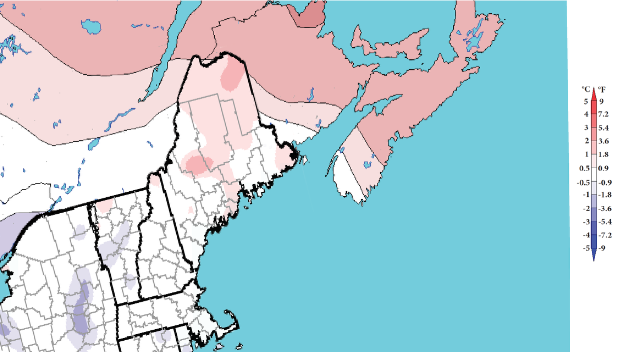
Temperature Departure from Normal map of the Gulf of Maine region (Massachusetts, New Hampshire, Maine, New Brunswick and Nova Scotia) showing the temperature departure from normal in degrees Celsius and degrees Fahrenheit, averaged over the period June 1 to August 31 2014. The map uses colors ranging from white to shades of darker purple for below normal temperatures and white to shades of dark red for above normal temperatures. This map for summer indicates that temperatures were near normal in Massachusetts and New Hampshire, but were up to 2 C (3.6 °F) above normal in parts of Maine. The Maritimes were 1 C (1.8 °F) to 3 C (5.4 °F) warmer than normal.
Summer temperatures were near normal in Massachusetts and New Hampshire, but were up to 2.0°C (3.6°F) above normal in parts of Maine. The Maritimes were 1.0°C (1.8°F) to 3°C (5.4°F) warmer than normal. June temperatures ranged from near normal to 2°C (3.6°F) above normal. July was a little warmer, with temperatures up to 3°C (5.4°F) above normal. Temperatures varied greatly in August. Much of Massachusetts and New Hampshire were 0.5°C (0.9°F) to 2°C (3.6°F) cooler than normal. Maine's temperatures ranged from 2°C (3.6°F) below normal to 2.0°C (3.6°F) above normal. In the Maritimes, temperatures generally ranged from 1.0°C (1.8°F) below normal to 1.0°C (1.8°F) above normal.
Temperature and precipitation normals based on 1981-2010. Canada and ocean precip data: Canadian Precipitation Analysis. U.S. precip data: interpolated station data.
Sea Surface Temperatures
Departure from Normal: June 1-August 31, 2014
Long description
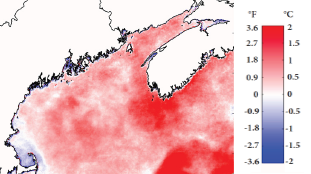
Sea Surface Temperature Departure from Normal map of the Gulf of Maine region (Massachusetts, New Hampshire, Maine, New Brunswick and Nova Scotia and adjacent ocean area) showing the temperature departure from normal sea surface temperature in degrees Celsius and degrees Fahrenheit, averaged over the period June 1 to August 31 2014. The map uses colors ranging from white to shades of darker blue for below normal temperature and white to shades of dark red for above normal temperature. This map for the summer indicates that sea surface temperatures across the region were generally warmer than normal. Warm anomalies of +0.5 C (+0.9°F) to +1.0 C (1.8°F) dominated the Scotian Shelf, the Bay of Fundy, and the Gulf of Maine. The exceptions to the warm pattern were in Massachusetts Bay and directly east of Cape Cod, with cold anomalies of around -0.5°C (-0.9°F).
Sea surface temperatures during summer were generally warmer than normal. Warm anomalies of +0.5°C (+0.9°F) to +1.0°C (+1.8°F) dominated the Scotian Shelf, the Bay of Fundy, and the Gulf of Maine. The warmest anomalies of around +1.5°C (+2.7°F) were located along the inshore portion of the southern Scotian Shelf. The warm anomalies were weakest over the deeper waters of Jordan Basin and the shallow waters of Georges Bank. The exceptions to this warm pattern were in Massachusetts Bay and directly east of Cape Cod, with cold anomalies of around -0.5°C (-0.9°F). The regions of cold anomalies and weak warm anomalies were primarily a result of cooler conditions in July and August.
Sea surface temperature anomalies based on 1985-2014. Mean SST anomalies from NOAA AVHRR data. Credit: University of Maine School of Marine Sciences and NERACOOS
Regional Impacts - for June-August 2014
Hurricane Arthur
Long description
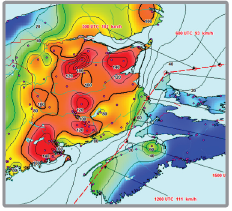
Total Precipitation (mm) on July 4-6 from Arthur map centred on New Brunswick and mainland Nova Scotia. The map uses colour shading and contours in 20 mm increments to indicate total precipitation. The 100 mm contour is bolded. Locations of the rainfall measurements are marked. The map also shows Arthur’s track with the location of the centre at 3 hour intervals. It also gives the maximum sustained wind speed in km/hr at 3 hour intervals. The map shows that the centre tracked northeastward over western Nova Scotia, the Bay of Fundy, eastern New Brunswick, and across the Gulf of St Lawrence. This map shows that the heaviest amounts of over 100 mm were reported west of the track over extreme eastern Maine, as well as a broad swath over southwestern, central, and northeastern New Brunswick. Within that swath are areas where more than 140 mm was reported. The maximum of over 180 mm was located in north central New Brunswick. The map shows amounts of more than 40 mm over parts of western Nova Scotia, near and east of the track, with the highest amounts over 60 mm at Kentville Nova Scotia. The maximum sustained wind speeds were 111 km/hr when the storm centre was over western Nova Scotia and still just over 100 km/hr after it has passed New Brunswick.
Above: Total precipitation (mm) on July 4-6 from Arthur.
Below: Uprooted elm tree and downed power lines in Fredericton, NB, on July 6. Credit: Rick Fleetwood

Long description
The photo shows an uprooted elm tree lying across a sidewalk and street, with a knocked over power pole and downed power lines in the background.
Arthur made its Canadian landfall in western Nova Scotia as a near-hurricane strength post-tropical cyclone on July 5. The maximum sustained winds of near 110 km/h (68 mph) downed trees and power lines across the Maritimes. Nearly 200,000 customers lost power in New Brunswick, making it the largest blackout in the province's history. Around 245,000 customers lost power in Nova Scotia, making it the most severe storm for the province since Hurricane Juan in 2003. Most areas had power restored within several days, but a few spots did not have power for a week or more. Arthur's winds made apple orchards in the Maritimes more susceptible to fire blight, a bacterial infection. Over 90% of apple orchards in Nova Scotia were affected, with many young trees badly damaged. In addition, the storm's heavy rain caused some flash flooding and infrastructure damage. Provincial government offices in Fredericton were closed for a day. (Sources: CBC News, July 14 and September 3)
Ocean Acidification
This spring, Maine became the first U.S. East Coast state to pass an ocean acidification bill into law. The law formed the Maine Ocean Acidification Committee, which held its first meeting on August 1. The group will study and address the effects of ocean acidification on Maine's environment and economy. Ocean acidification occurs when carbon dioxide in the air dissolves into seawater, creating carbonic acid and lowering the water's pH (making it more acidic). Higher acidity can inhibit shell growth in organisms such as lobsters, clams, oysters, etc. In addition, higher acidity makes it difficult for corals to build skeletons. The committee will report its findings in December. (Sources: Portland Press Herald, June 27 and Gulf of Maine Research Institute)
Invasive Species
Invasive green crab populations in the Gulf of Maine soared in 2012 and 2013 with record warm water temperatures. Comparatively fewer green crabs were found in Maine in 2014, likely due to cooler water temperatures along the coast during the 2013-2014 winter. However, crab populations in Massachusetts rebounded by July. Green crabs feed on soft-shell clams, one of Maine's major commercial fisheries, and eelgrass, which acts as a nursery for many marine species. With climate change expected to further warm Gulf waters, scientists anticipate further increases in the green crab population. (Sources: Bangor Daily News, August 14 and Massachusetts Division of Marine Fisheries)
Environment Canada map produced on August 31, 2014.
Long description
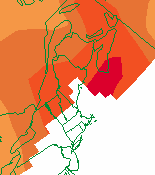
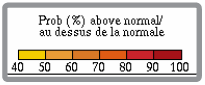
This Environment Canada seasonal forecast map shows the percentage probability of above normal temperatures in the Maritimes for the fall 2014. The map uses colour shading and contours. The scale ranges from 40 % (yellow) to 100% (red) in 10% increments. The map shows the probability of above normal temperatures is 60 to 70% over the northern half of New Brunswick, increasing over the south half of New Brunswick and much of Nova Scotia to 70-80%. The probability of above normal temperatures is 80-90% over southern Nova Scotia.
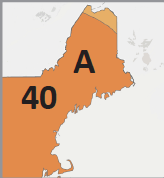
A: Above-normal
40: Probability of above-normal temperatures
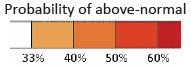
Climate Prediction Center map produced on August 21, 2014.
Long description
This NOAA seasonal forecast map shows the probability of above normal temperatures over the region from Massachusetts to Maine. The map uses colour shading and contours. The scale ranges from 0 to above 60% with intervals at 33%, 40%, 50%, 60%, and above. The map shows that the probability of above normal temperatures is 40 to 50% for most the region, except 33 to 40 % for northern Maine.
Regional Outlook - for Fall 2014
Temperature
Environment Canada and NOAA's Climate Prediction Center are both calling for an increased likelihood of above-normal temperatures for the Gulf of Maine region for September through November. The forecast for above-normal temperatures is supported by climate models. In addition, sea surface temperatures around the Maritimes and in the Gulf of Maine are warmer than normal, which will help maintain warm conditions on land.
Precipitation
Environment Canada and NOAA's Climate Prediction Center are both predicting equal chances of above-, near-, or below-normal precipitation for September-November.
El Niño
While some warming of the tropical Pacific Ocean waters did occur in August, El Niño conditions remained neutral as of early September. However, model forecasts continue to predict El Niño development. According to NOAA, "El Niño is favored to emerge during September-October, and to peak at weak strength during the late fall and early winter." There is a 60-65% chance of El Niño development during fall and winter. (Sources: Climate Prediction Center El Niño forecast and El Niño blog)
Atlantic Hurricane Season
NOAA's updated Atlantic hurricane season outlook, released on August 7, calls for a 70% chance of a below-normal season. The initial outlook from May called for a 50% chance of a below-normal season. The updated outlook, which includes hurricanes Arthur and Bertha, predicts 7-12 named storms, 3-6 hurricanes, and 0-2 major hurricanes. In comparison, the May outlook predicted 8-13 named storms, 3-6 hurricanes, and 1-2 major hurricanes. The outlook changes are due to the development of atmospheric and oceanic conditions that inhibit storm formation, the expectation that unfavorable conditions will persist through the season, and the likely development of El Niño. (Source: Climate Prediction Center Hurricane Outlook)
Gulf of Maine Region Partners
Northeast Regional Climate Center
National Oceanic and Atmospheric Administration
National Operational Hydrologic Remote Sensing Center
Northeast River Forecast Center
Gulf of Maine Research Institute
National Integrated Drought Information System
Cooperative Institute for the North Atlantic Region
Gulf of Maine Council on the Marine Environment, Climate
Network
Northeastern Regional Association of Coastal and Ocean
Systems
Contacts
NOAA:
Ellen Mecray
Samantha Borisoff
Environment Canada:
1-800-668-6767 (in Canada only)
819-997-2800 (long-distance charges apply)
enviroinfo@ec.gc.ca
This is a new publication designed to help others understand climate trends and their impacts. We welcome your feedback.