
Water availability: indicator initiative
Indicator initiative
The sustainability of freshwater supplies is a growing concern worldwide. Pressures - including rapid urbanization, industrial expansion, agricultural intensification, and the impacts of climate change - stress water supply and affect the health of aquatic ecosystems. To ensure continued sustainability of fresh water for human use and ecosystem support, we must be able to track the status of water availability in Canada.
Water availability refers to the volume of water in our rivers compared with the amount of water we are using. This indicator is derived by calculating the ratio of water demand to water availability at the sub-drainage area scale (representing 164 watersheds across Canada) on an annual basis. To calculate the ratio, a geographical information system is used to analyze water use data from several federal water use surveys and streamflow values from Water Survey of Canada HYDAT stations in a spatial and temporal frame relevant to water availability issues. Other available sources of data are used for validation purposes.
The water availability indicator (WAI) provides us with an additional tool with which to assess water resources in Canada. It will help to inform the Canadian public, policy makers, other decision makers and interested groups about water supply and demand. The goal of the initiative is to create an indicator that can be used to provide a nationally and regionally relevant picture of water availability.
The WAI is presented in maps and graphs at a national scale, but is also intended to be regionally relevant. Sub-drainage areas that have existing or potential water scarcity problems like the southern prairies were the initial focus of the project. A case study, with results for 2005 and 2007 in the Mixed Grasslands sub-drainage areas of southern Alberta and Saskatchewan, was published in the 2009-2010 Canada Water Act Annual Report What follows are the first national results of the initiative.
Results for the 2005 and 2007 survey years
The resulting ratios are divided into four categories based on the Organisation for Economic Co-operation and Development (OECD) classification scheme provided belowFootnote1:
- High (more than 40% of available water is used): severe water stress.
- Medium (between 20% and 40% of available water is used): both water supply and water demand need to be managed; conflicts among competing uses will need to be resolved.
- Moderate (between 10% and 20% of available water is used): water availability becomes a constraint on development; significant investment is needed to provide for adequate water supply.
- Low (less than 10% of available water is used): low water stress.
The North
In Northern Canada (Yukon, Northwest Territories, Nunavut, Labrador and northern parts of the provinces of British-Columbia, Alberta, Saskatchewan, Manitoba, Ontario and Quebec) some sub-drainage areas were merged for purposes of data analysis due to the low levels of human activity and the large surface water supply produced by the rivers. In this region, the supply-demand ratio is below 10%; meaning the threat to water availability is “Low”. This means that there was ample water to meet needs during these years. Due to extreme climatic conditions and the particular hydraulic regime of the region (e.g., frozen streams) it was, however, decided that the methodology used in the Water Availability Indicator initiative is not applicable for the extreme northern part of the country.
British-Columbia
In British-Columbia, the ratio is also low (below 10%). The Okanagan Valley was evaluated at the sub-sub-drainage area scale since it is known as a region with water availability concerns. The threat to water availability for this area is rated “Medium” (between 20% and 40%) meaning, based on the OECD classification scheme. that the water availability becomes a constraint on development and significant investment is needed to provide adequate water supply to meet the demand for the resource.
Prairie Region
The southern part of the Prairie region (Alberta, Saskatchewan and Manitoba) is known historically as a dry and arid area where low precipitation means a smaller water supply than in other parts of the country. In this region of the country, the agricultural and industrial sectors are large users of surface water. As a result, the indicator shows a moderate to high threat to water availability. For the northern part of the Prairies, the ratios are below 10% indicating a low threat to water availability.
Ontario
In Ontario, the threat to water availability is high (more than 40%) in the urbanized south-west part of the province. This is caused by large industrial and municipal water use and a low inland surface water supply. According to the OECD classification scheme then, this region was under water stress during these years. In other parts of the province, the results of the indicator calculations show a low threat to water availability.
Quebec
In Quebec, the water availability threat is considered low in the entire province, meaning that there was ample water during 2005 and 2007 to meet user needs. It should be noted that, due to lack of available historical data, the northern part of the province of Quebec has not been evaluated.
Atlantic Region
In Atlantic Canada, the presence of large rivers and relatively low water demand meant that the threat to water availability was ranked as low (below 10%). This region has ample water to meet the different demands placed on the resource at the sub-drainage area level.
Historical comparison
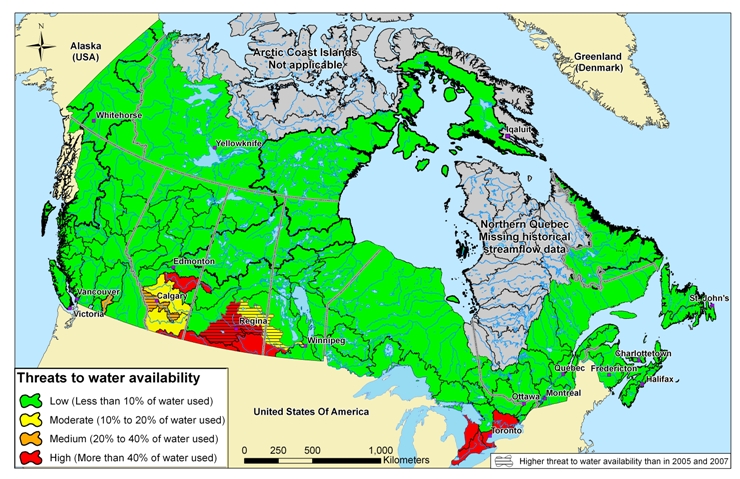
Annually, surface water supply changes based on the weather conditions like temperature, precipitation and humidity. This results in variations in the ratio of water demand to water availability from year to year. In order to compare the 2005 and 2007 WAI results to average values over time, an historical ratio was calculated. In calculating this ratio, yearly average surface water supply is based on a 30-year period (or on as many consecutive years as data is available). For “water use,” an average value for the survey years 2005 and 2007 was employed. Based on the resulting ratio, the majority of the sub-drainage areas remain in the same threat to water availability category as they were in the 2005 and 2007 study period. This is illustrated in the map below. There are a few exceptions; specifically, in some sub-drainage areas in the southern part of the Prairies (e.g. 05B-Bow, 05J-Qu’Appelle and 05M-Assiniboine). In these sub-drainage areas, the ratios indicate a higher threat to water availability when based on the historical ratio than was the case when based on the 2005 and 2007 ratio values. This result indicates that the water supply was above the normal values for these sub-drainage areas in 2005 and 2007.

Long description
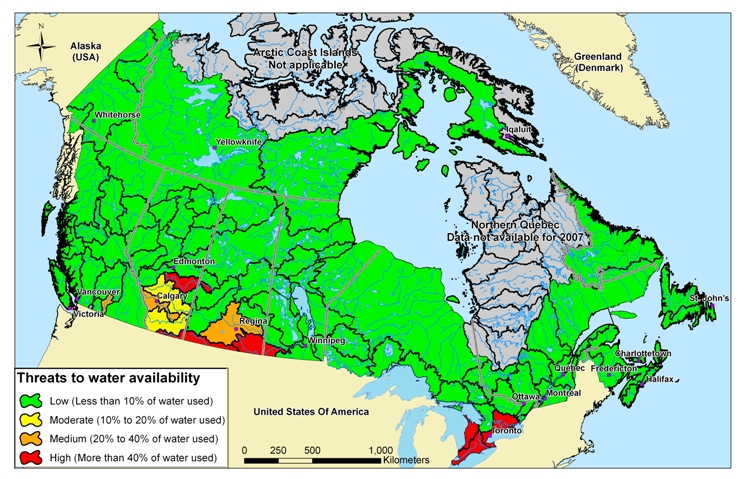
Map of the Water Demand and Availability Indicator for 2005 at the sub-drainage area level. Sub-drainage areas with a high threat to water availability (More than 40% of water use) are the 05F (Battle), 05N (Souris), 11A (Missouri), 02F (Eastern Lake Huron), 02G (Northern Lake Erie) and 02H (Lake Ontario and Niagara Peninsula). The sub-drainage area with a medium threat to water availability (Between 20% and 40% of water use) is the 05J (QuAppelle) and the 08NM sub-sub drainage area (Okanagan). Sub-drainage areas with a moderate threat to water availability (Between 10% and 20% of water use) are the 05A (Upper South Saskatchewan), 05B (Bow) and 05C (Red Deer). All the other regions of the country are in the low threat to water availability category (Less than 10% of water use).
Long description
Map of the Water Demand and Availability Indicator for 2007 at the sub-drainage area level. Sub-drainage areas with a high threat to water availability (More than 40% of water use) are the 05F (Battle), 05N (Souris), 11A (Missouri), 02F (Eastern Lake Huron), 02G (Northern Lake Erie) and 02H (Lake Ontario and Niagara Peninsula). Sub-drainage areas with a medium threat to water availability (Between 20% and 40% of water use) are the 05B (Bow) and 05J (QuAppelle) and the 08NM sub-sub drainage area (Okanagan). Sub-drainage areas with a moderate threat to water availability (Between 10% and 20% of water use) are the 05A (Upper South Saskatchewan) and 05C (Red Deer). All the other regions of the country are in the low threat to water availability category.
Long description
Map of the Water Demand and Availability Indicator based on a 30 years long term yearly average water supply and 2005-2007 water use. Sub-drainage areas with high threat to water availability (More than 40% of water use) are the 05F (Battle), 05J (QuAppelle), 05N (Souris), 11A (Missouri), 02F (Eastern Lake Huron), 02G (Northern Lake Erie) and 02H (Lake Ontario and Niagara Peninsula). The Sub-drainage area with a medium threat to water availability (Between 20% and 40% of water use) is the 05B (Bow) and the 08NM sub-sub drainage area (Okanagan). Sub-drainage areas with a moderate threat to water availability (Between 10% and 20% of water use) are the 05A (Upper South Saskatchewan), 05C (Red Deer) and 05M (Assiniboine). All the other regions of the country are in the low threat to water availability category. The 05B (Bow), 05J (QuAppelle) and 05M (Assiniboine) sub-drainage areas have a higher threat to water availability based on this analysis compared to the 2005 and 2007 ratio values.