
Canadian weather radar visibility maps
Executive summary
Environment and Climate Change Canada (ECCC) manages a network of radars across Canada that gives us important weather services. Our radars help meteorologists predict daily weather and track severe weather events such as thunderstorms, hurricanes, floods, and tornadoes.
However, wind turbines near the radars disturb the important weather information we normally get from them. Since the wind energy sector has grown so quickly, we are asking wind farm developers to contact us early in their plans.
Our goal is to support the progress of renewable energy and at the same time to deliver quality weather services. Below you will find a series of maps that show where wind turbines would likely be seen by the weather radars and thus possibly cause interference. Wind farm developers may use these maps to help find locations where wind turbines are less likely to disturb weather radar data.
Canadian weather radar visibility maps
ECCC should be consulted through radarsmeteo-weatherradars@ec.gc.ca on all wind farm proposals in Canada as early as possible in the project planning phase. ECCC will conduct a preliminary radar impact assessment of the project and will confirm if mitigation measures will be required.
The map below shows the locations in Canada where wind turbines could be visible to ECCC’s 32 operational weather radars. Turbines that are visible to our radars could potentially cause radar interference and therefore impact ECCC’s ability to provide quality weather forecasts and warnings to Canadians. The information shown in the following maps may assist industry in identifying potentially suitable locations for siting turbines. The data displayed on the maps, along with relevant documentation, is available on MSC Open Data.
It is important to note that the radar visibility layers shown in the maps were generated using a simple viewshed tool and does not indicate the degree of visibility to the radars. Therefore, the results may not be completely accurate due to limitations in the data and/or tool. There could be cases where turbines may or may not be visible to ECCC’s radars despite being outside or within these visibility layers. Wind farm developers should contact ECCC regardless of where in Canada their project is taking place. For any questions or feedback regarding the maps, please contact us at radarsmeteo-weatherradars@ec.gc.ca.
For more information on turbine-radar interference, ECCC’s radar impact assessment process and mitigation measures, please visit: Overview of wind turbine interference with weather radar - Canada.ca and Guidelines for wind turbine and weather radar siting.

Long description
The 32 operational weather radars across Canada are marked with a black dot. The colour display surrounding the radars represents whether 150, 200 and 250 metre (above ground level) tall wind turbines could be visible to the radars. The radar sites shown are as follows (west to east):
British Columbia
- Halfmoon Peak
- Prince George
- Aldergrove
- Silver Star Mountain
Alberta
- Spirit River
- Carvel
- Strathmore
- Fort McMurray
- Schuler
- Cold Lake
Saskatchewan
- Radisson
- Bethune
Manitoba
- Foxwarren
- Woodlands
Ontario
- Dryden
- Shuniah
- Montreal River Harbour
- Smooth Rock Falls
- Exeter
- Britt
- King City
- Franktown
Quebec
- Landrienne
- Blainville
- Ste-Françoise
- Mt. Apica
- Val d'Irène
New Brunswick
- Chipman
Nova Scotia
- Gore
- Marion Bridge
Newfoundland
- Marble Mountain
- Holyrood
How to interpret the maps
The radar site locations are marked with a black dot. The hatch-filled red circles around each radar represent a 10 kilometre (km) radius “definite impact zone”, where significant impacts to the radar are more likely to occur and therefore turbines should not be built within this zone. The dashed circles around each radar represent a 10-60 km radius “moderate impact zone”, where moderate-to-significant impacts to the radar are more likely to occur if turbines are built within this zone.
The colour display surrounding the radars represents the locations where wind turbines could be visible to the radars. The radar visibility maps have been created for turbine models with total heights (i.e. tower base to blade tip) of 150, 200 and 250 metres above ground level (mAGL). If any part of a turbine is visible to a weather radar, some radar interference is expected.
Any region not covered by the colour display indicates that a wind turbine with a total height less than or equal 250 mAGL should likely not be visible to the radars. However, a turbine with a total height greater than 250 mAGL may be visible to a radar in those areas and therefore further analysis is required.
Radar locations
Radar locations
results out of
Filters
Results
Results
-
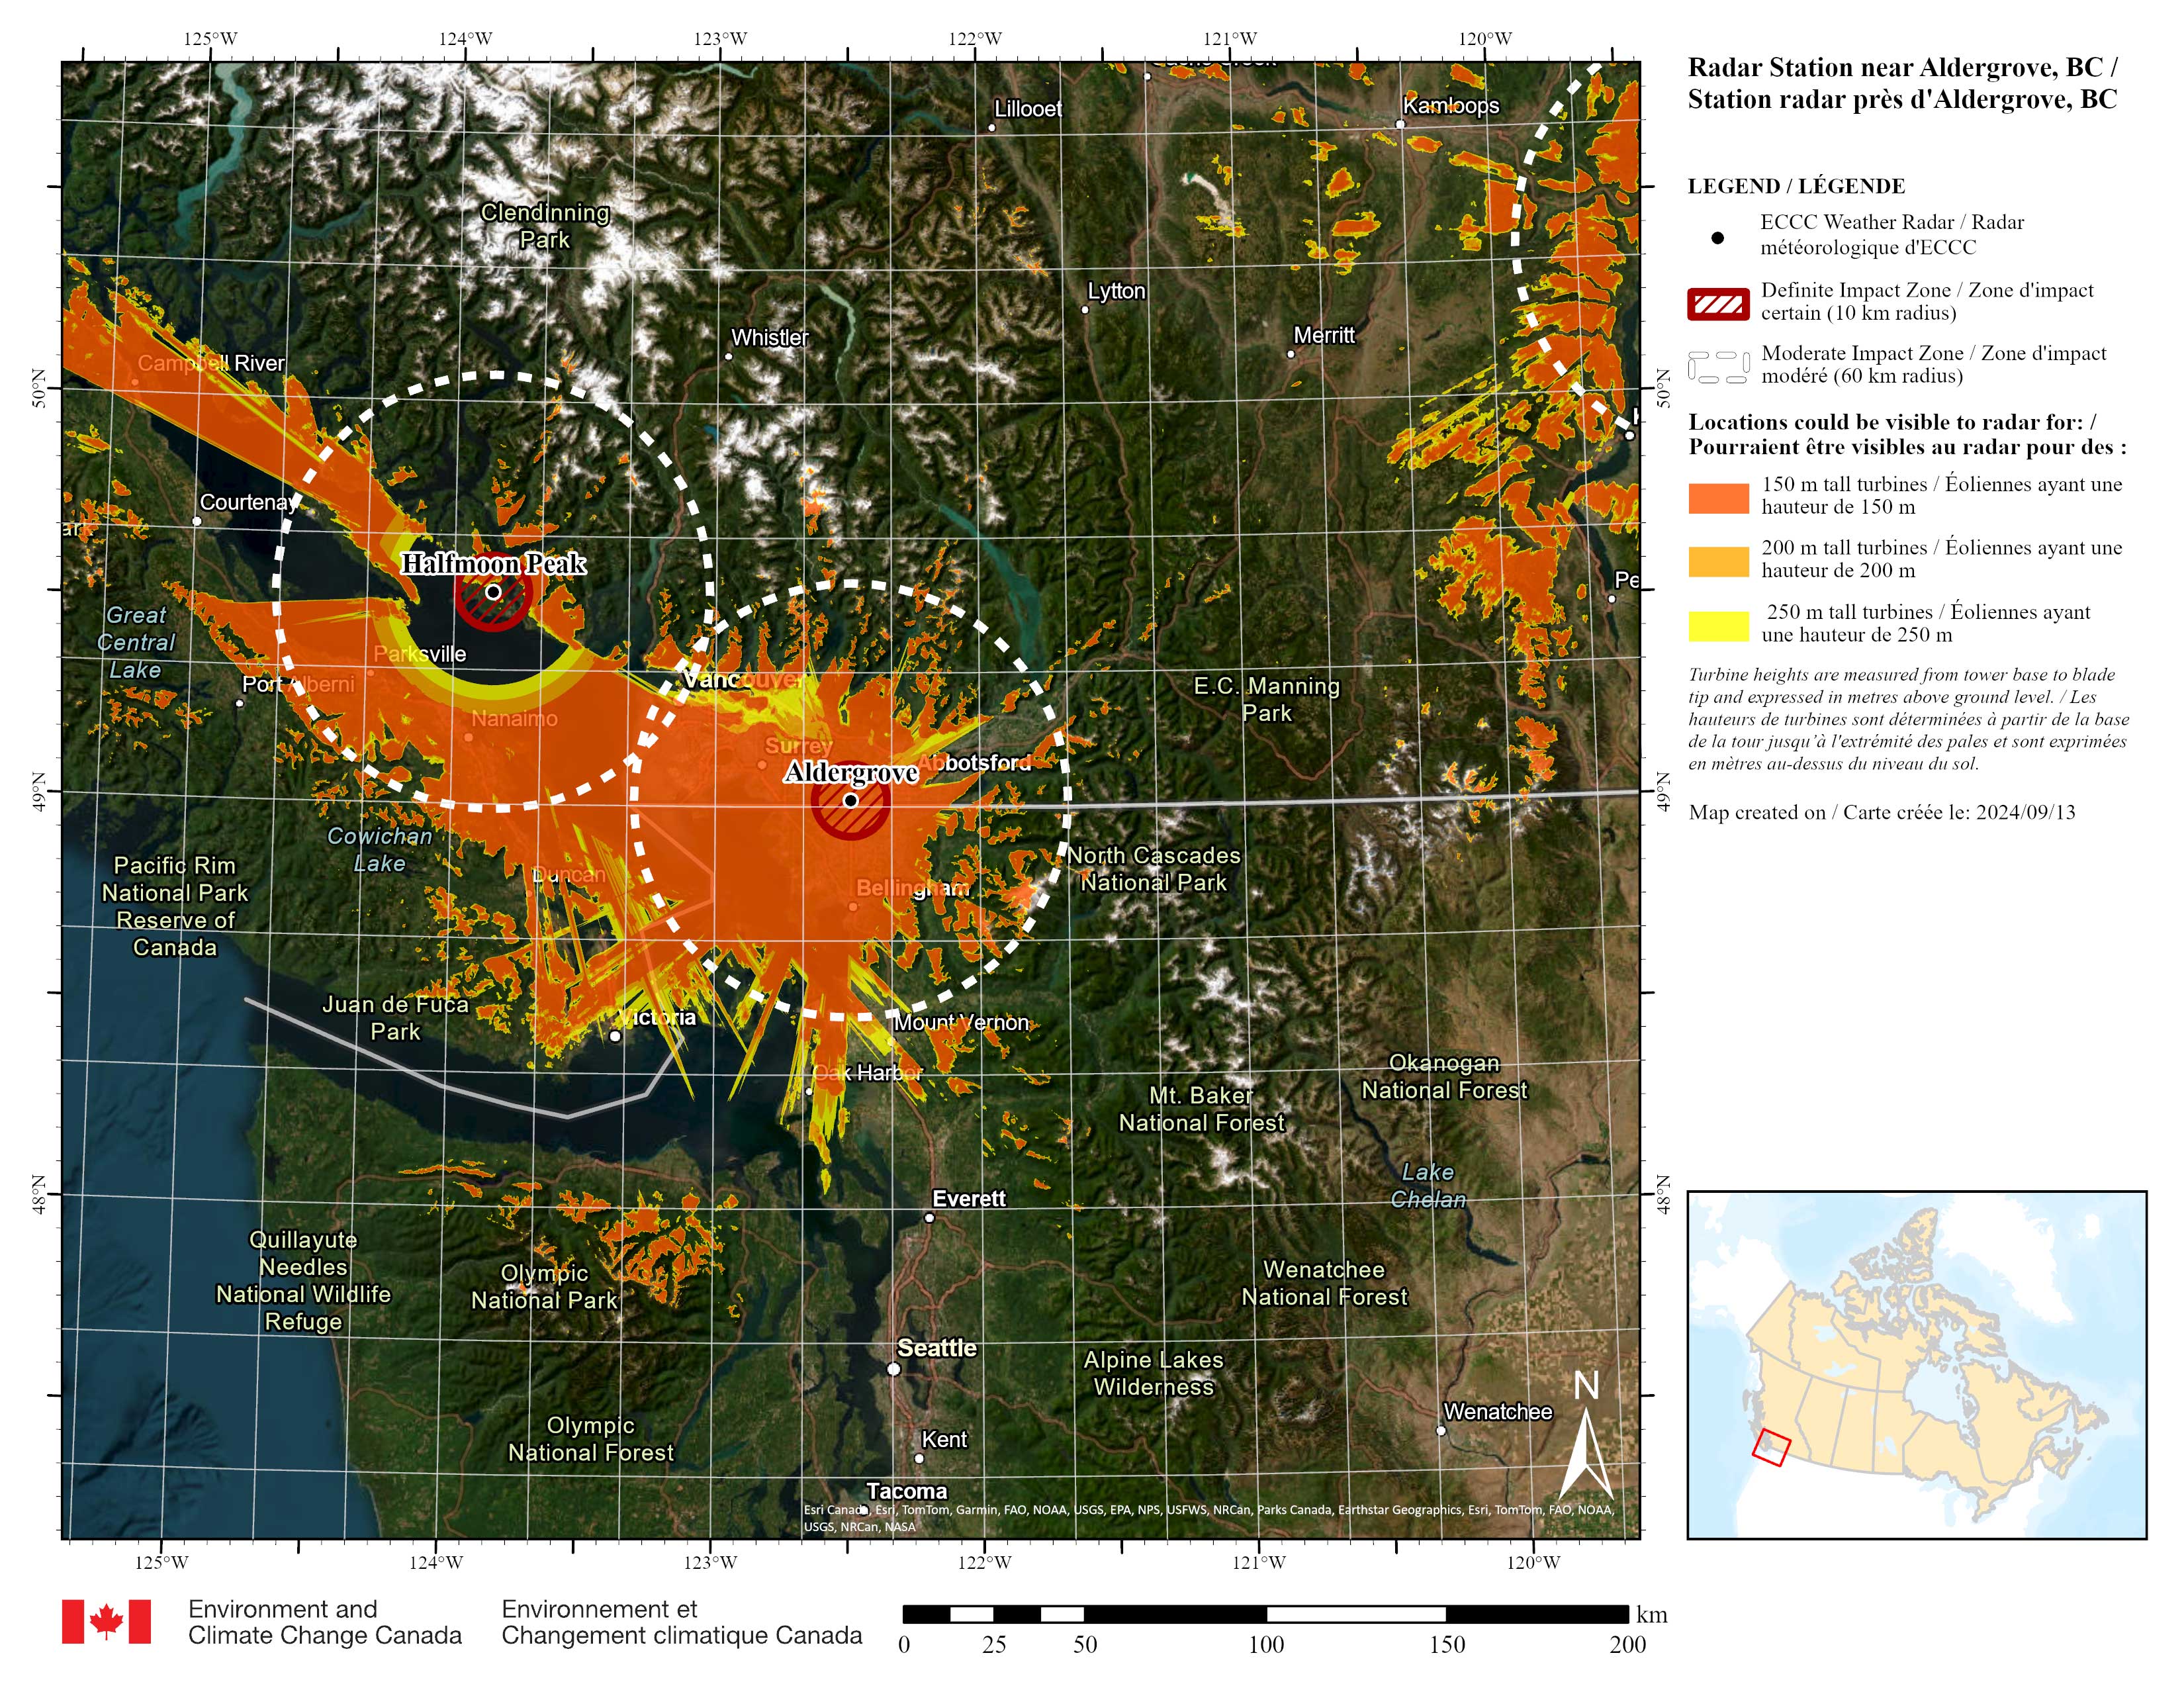
Aldergrove radar visibility map
British Columbia
Long description
Map is centered on the radar station near Aldergrove, British Columbia. Legend: The black dot indicates where the weather radar is located. Dark orange areas indicate locations where 150 metre (m) tall turbines are likely to be visible to the radars. Light orange areas indicate locations where 200 m tall turbines are likely to be visible to the radars. Yellow areas indicate locations where 250 m tall turbines are likely to be visible to the radars. Turbine heights are measured from tower base to blade tip and expressed in metres above ground level. Hatch-filled red circles around each radar represent a 10 kilometre (km) radius “definite impact zone”, where significant impacts to the radar are more likely to occur and therefore turbines should not be built within this zone. Dashed circles around each radar represent a 10-60 km radius “moderate impact zone”, where moderate-to-significant impacts to the radar are more likely to occur if turbines are built within this zone.
-
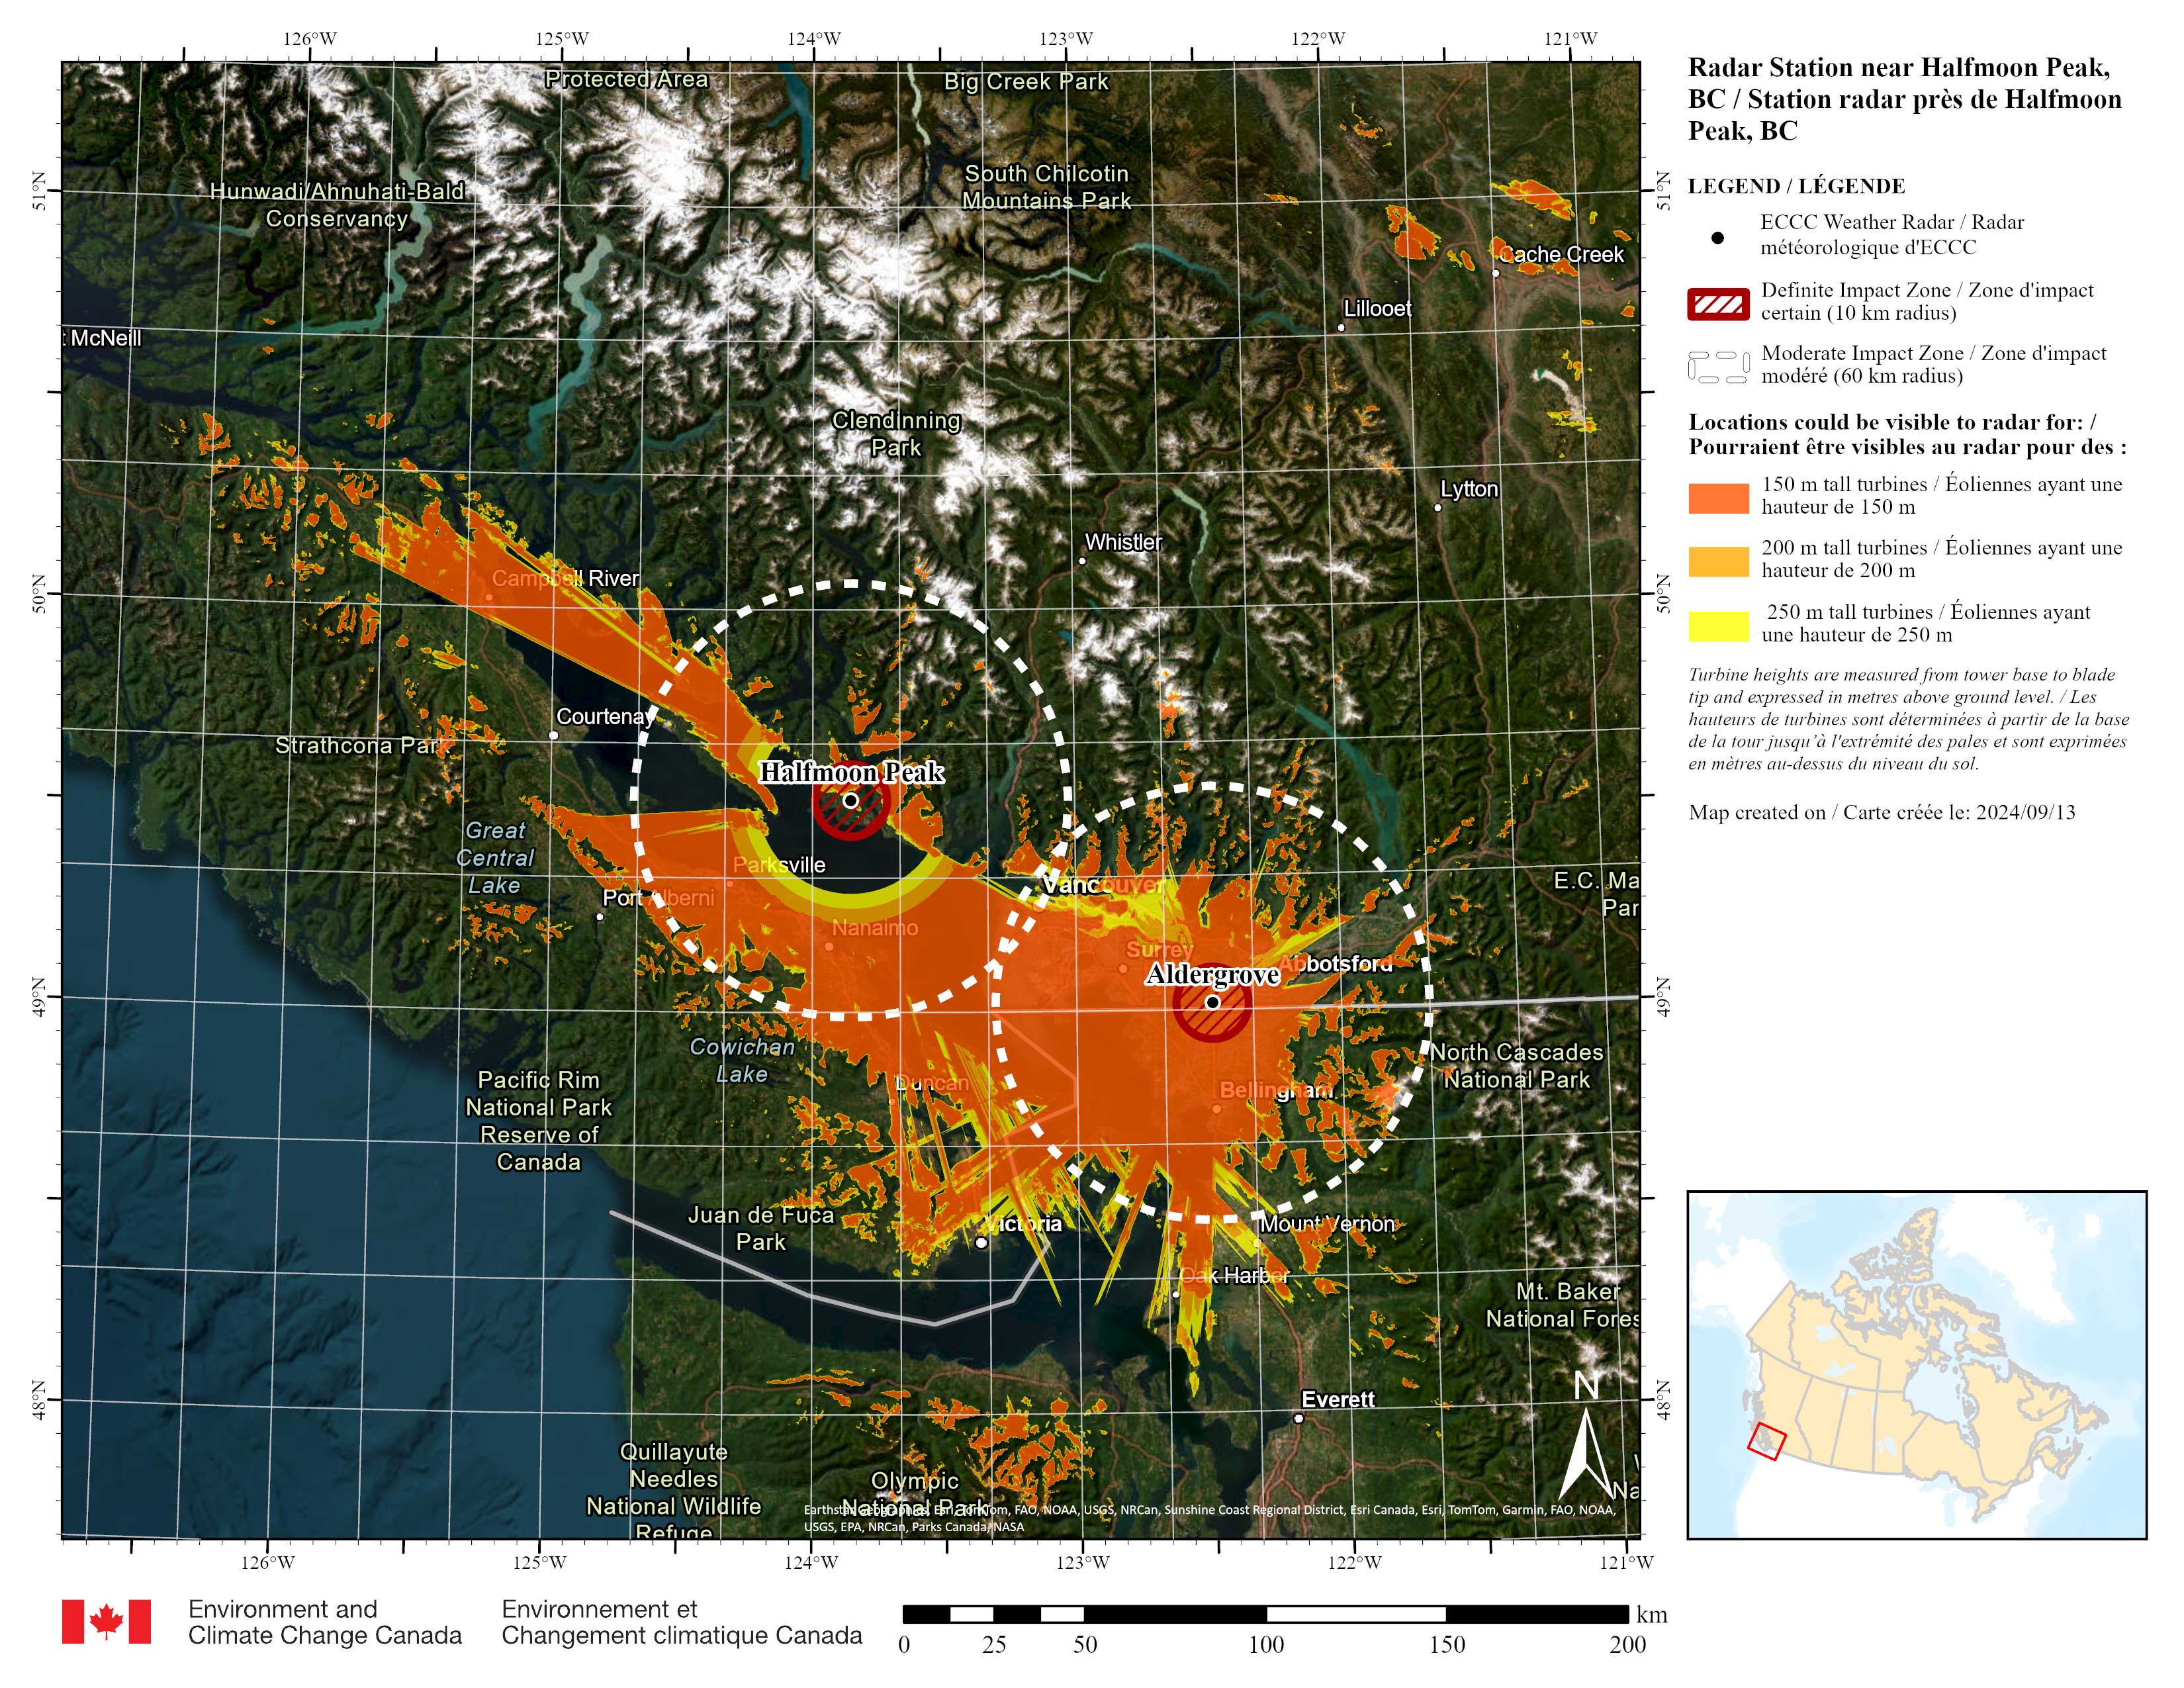
Halfmoon Peak radar visibility map
British Columbia
Long description
Map is centered on the radar station near Halfmoon Peak, British Columbia. Legend: The black dot indicates where the weather radar is located. Dark orange areas indicate locations where 150 metre (m) tall turbines are likely to be visible to the radars. Light orange areas indicate locations where 200 m tall turbines are likely to be visible to the radars. Yellow areas indicate locations where 250 m tall turbines are likely to be visible to the radars. Turbine heights are measured from tower base to blade tip and expressed in metres above ground level. Hatch-filled red circles around each radar represent a 10 kilometre (km) radius “definite impact zone”, where significant impacts to the radar are more likely to occur and therefore turbines should not be built within this zone. Dashed circles around each radar represent a 10-60 km radius “moderate impact zone”, where moderate-to-significant impacts to the radar are more likely to occur if turbines are built within this zone.
-
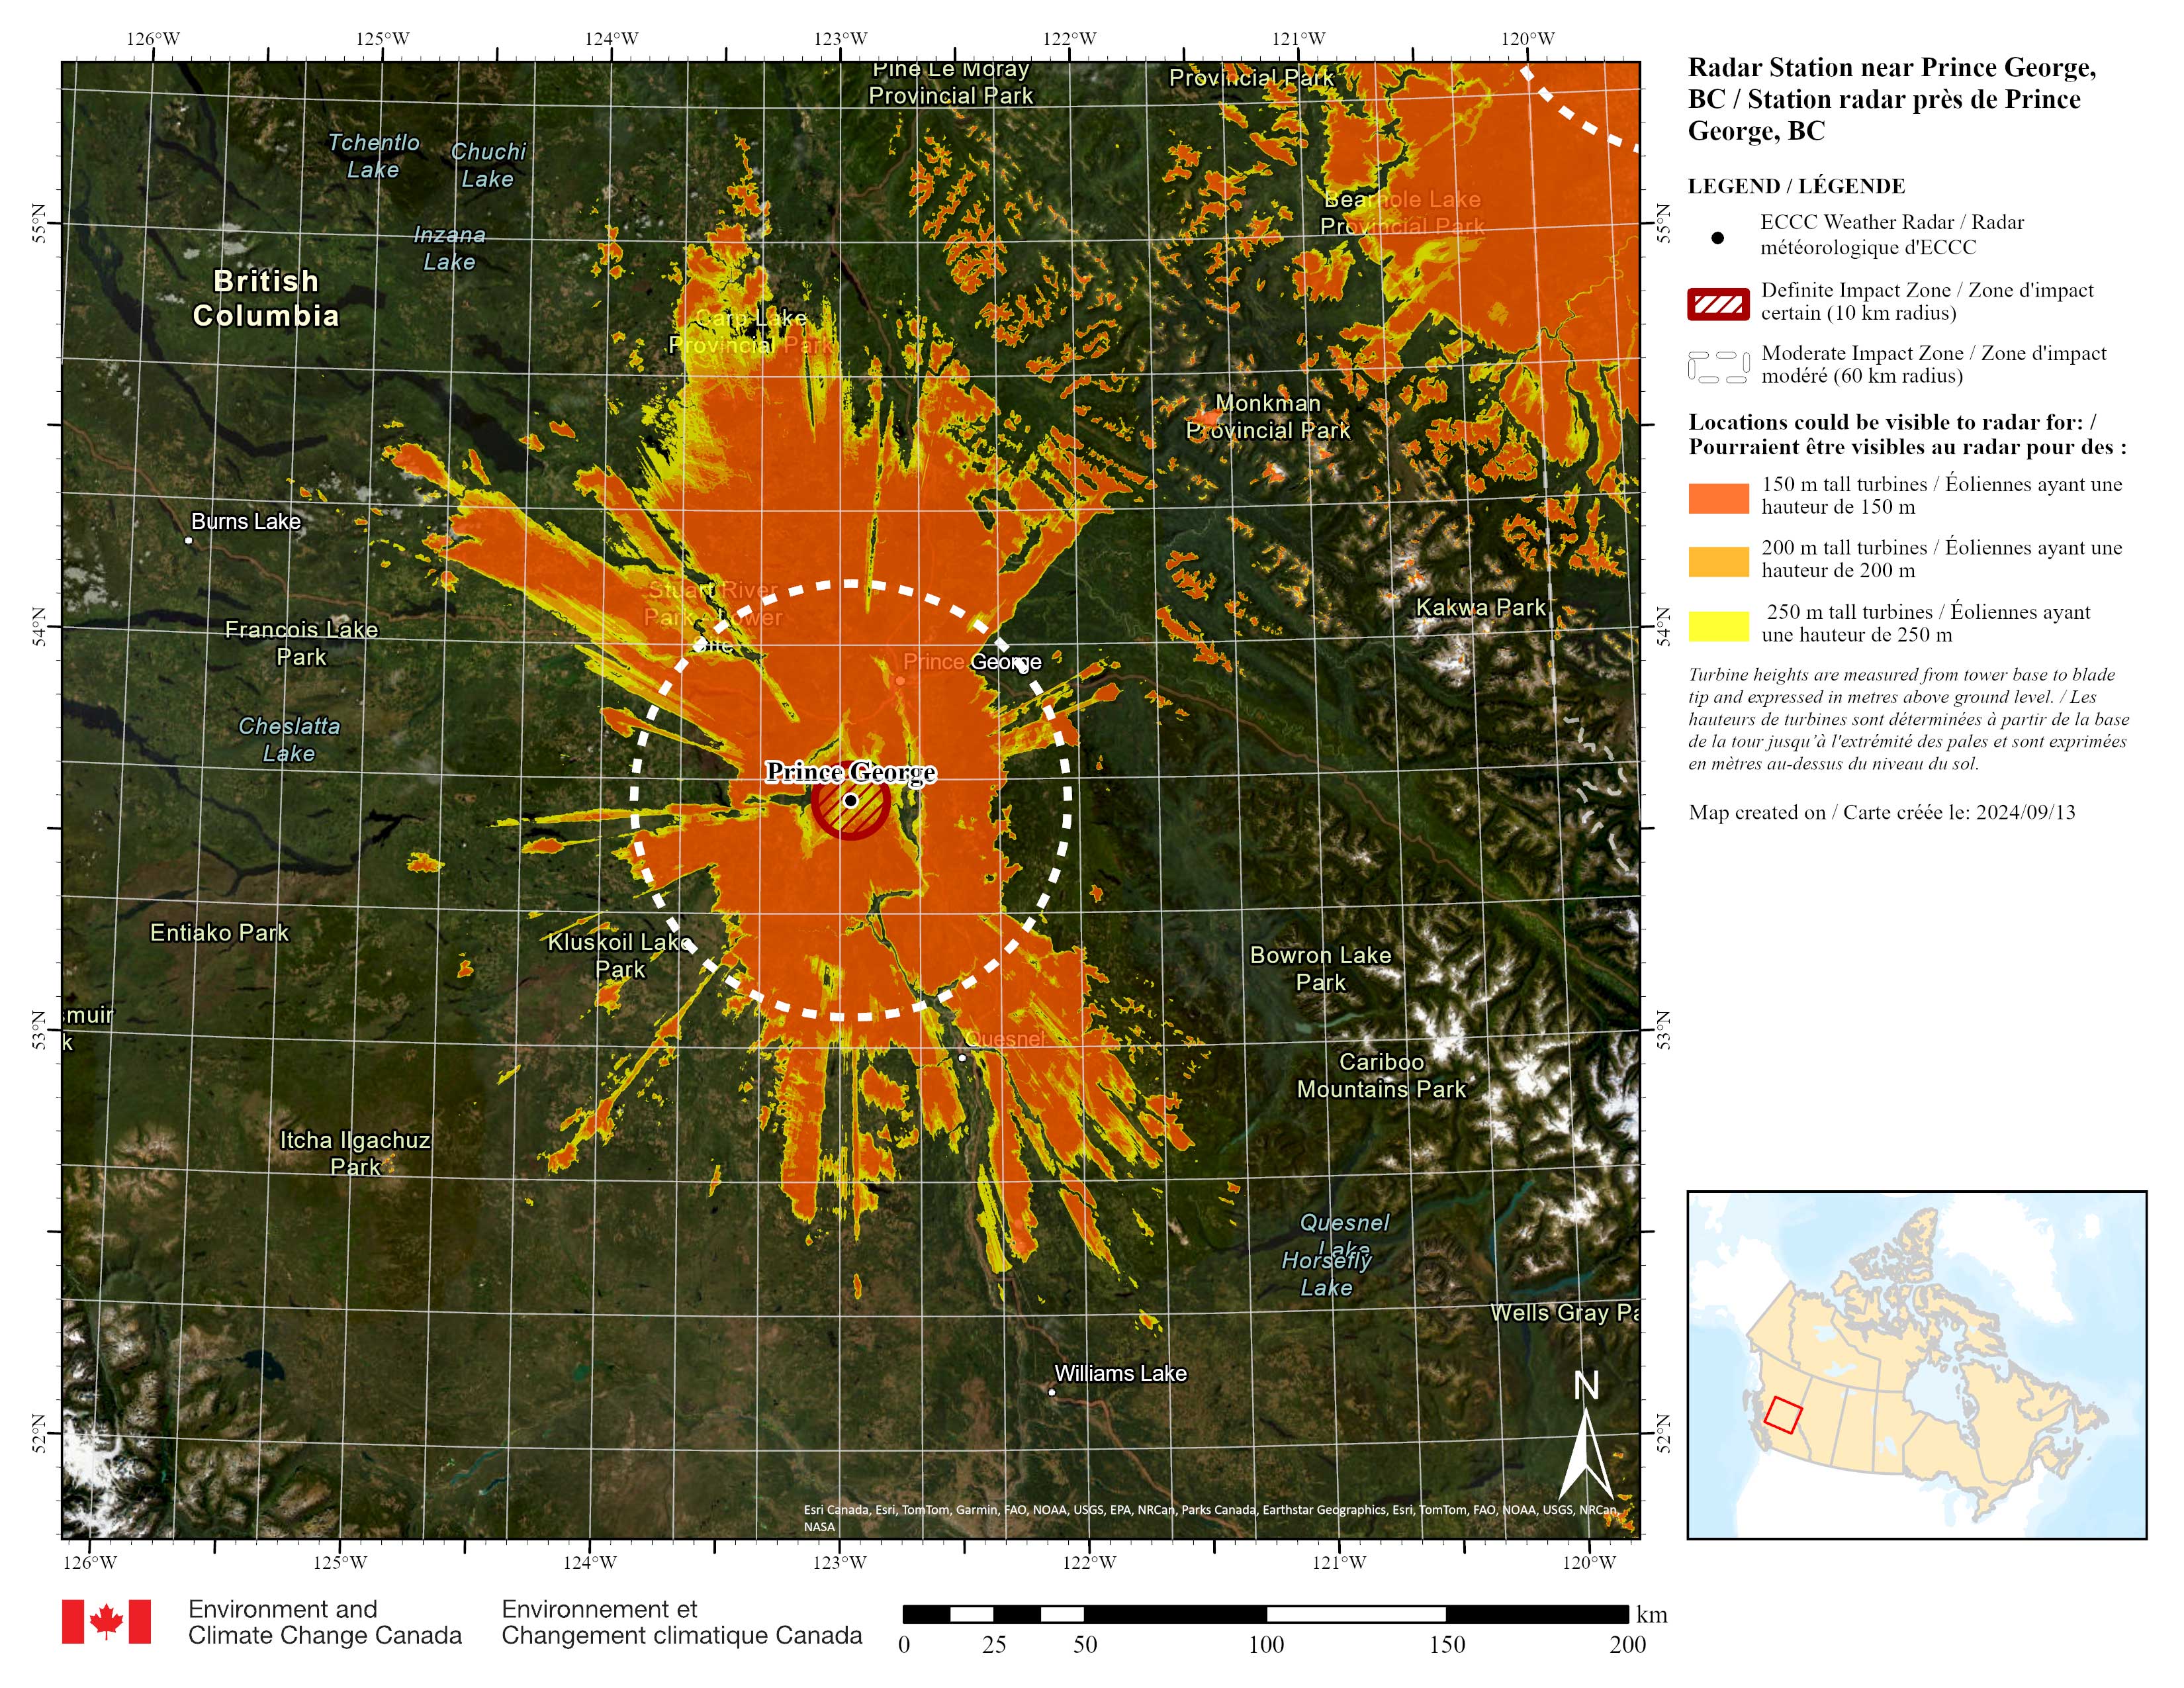
Prince George radar visibility map
British Columbia
Long description
Map is centered on the radar station near Prince George, British Columbia. Legend: The black dot indicates where the weather radar is located. Dark orange areas indicate locations where 150 metre (m) tall turbines are likely to be visible to the radars. Light orange areas indicate locations where 200 m tall turbines are likely to be visible to the radars. Yellow areas indicate locations where 250 m tall turbines are likely to be visible to the radars. Turbine heights are measured from tower base to blade tip and expressed in metres above ground level. Hatch-filled red circles around each radar represent a 10 kilometre (km) radius “definite impact zone”, where significant impacts to the radar are more likely to occur and therefore turbines should not be built within this zone. Dashed circles around each radar represent a 10-60 km radius “moderate impact zone”, where moderate-to-significant impacts to the radar are more likely to occur if turbines are built within this zone.
-
Silver Star Mountain radar visibility map
British Columbia

Long description
Map is centered on the radar station near Silver Star Mountain, British Columbia. Legend: The black dot indicates where the weather radar is located. Dark orange areas indicate locations where 150 metre (m) tall turbines are likely to be visible to the radars. Light orange areas indicate locations where 200 m tall turbines are likely to be visible to the radars. Yellow areas indicate locations where 250 m tall turbines are likely to be visible to the radars. Turbine heights are measured from tower base to blade tip and expressed in metres above ground level. Hatch-filled red circles around each radar represent a 10 kilometre (km) radius “definite impact zone”, where significant impacts to the radar are more likely to occur and therefore turbines should not be built within this zone. Dashed circles around each radar represent a 10-60 km radius “moderate impact zone”, where moderate-to-significant impacts to the radar are more likely to occur if turbines are built within this zone.
-
Carvel radar visibility map
Alberta

Long description
Map is centered on the radar station near Carvel, Alberta. Legend: The black dot indicates where the weather radar is located. Dark orange areas indicate locations where 150 metre (m) tall turbines are likely to be visible to the radars. Light orange areas indicate locations where 200 m tall turbines are likely to be visible to the radars. Yellow areas indicate locations where 250 m tall turbines are likely to be visible to the radars. Turbine heights are measured from tower base to blade tip and expressed in metres above ground level. Hatch-filled red circles around each radar represent a 10 kilometre (km) radius “definite impact zone”, where significant impacts to the radar are more likely to occur and therefore turbines should not be built within this zone. Dashed circles around each radar represent a 10-60 km radius “moderate impact zone”, where moderate-to-significant impacts to the radar are more likely to occur if turbines are built within this zone.
-
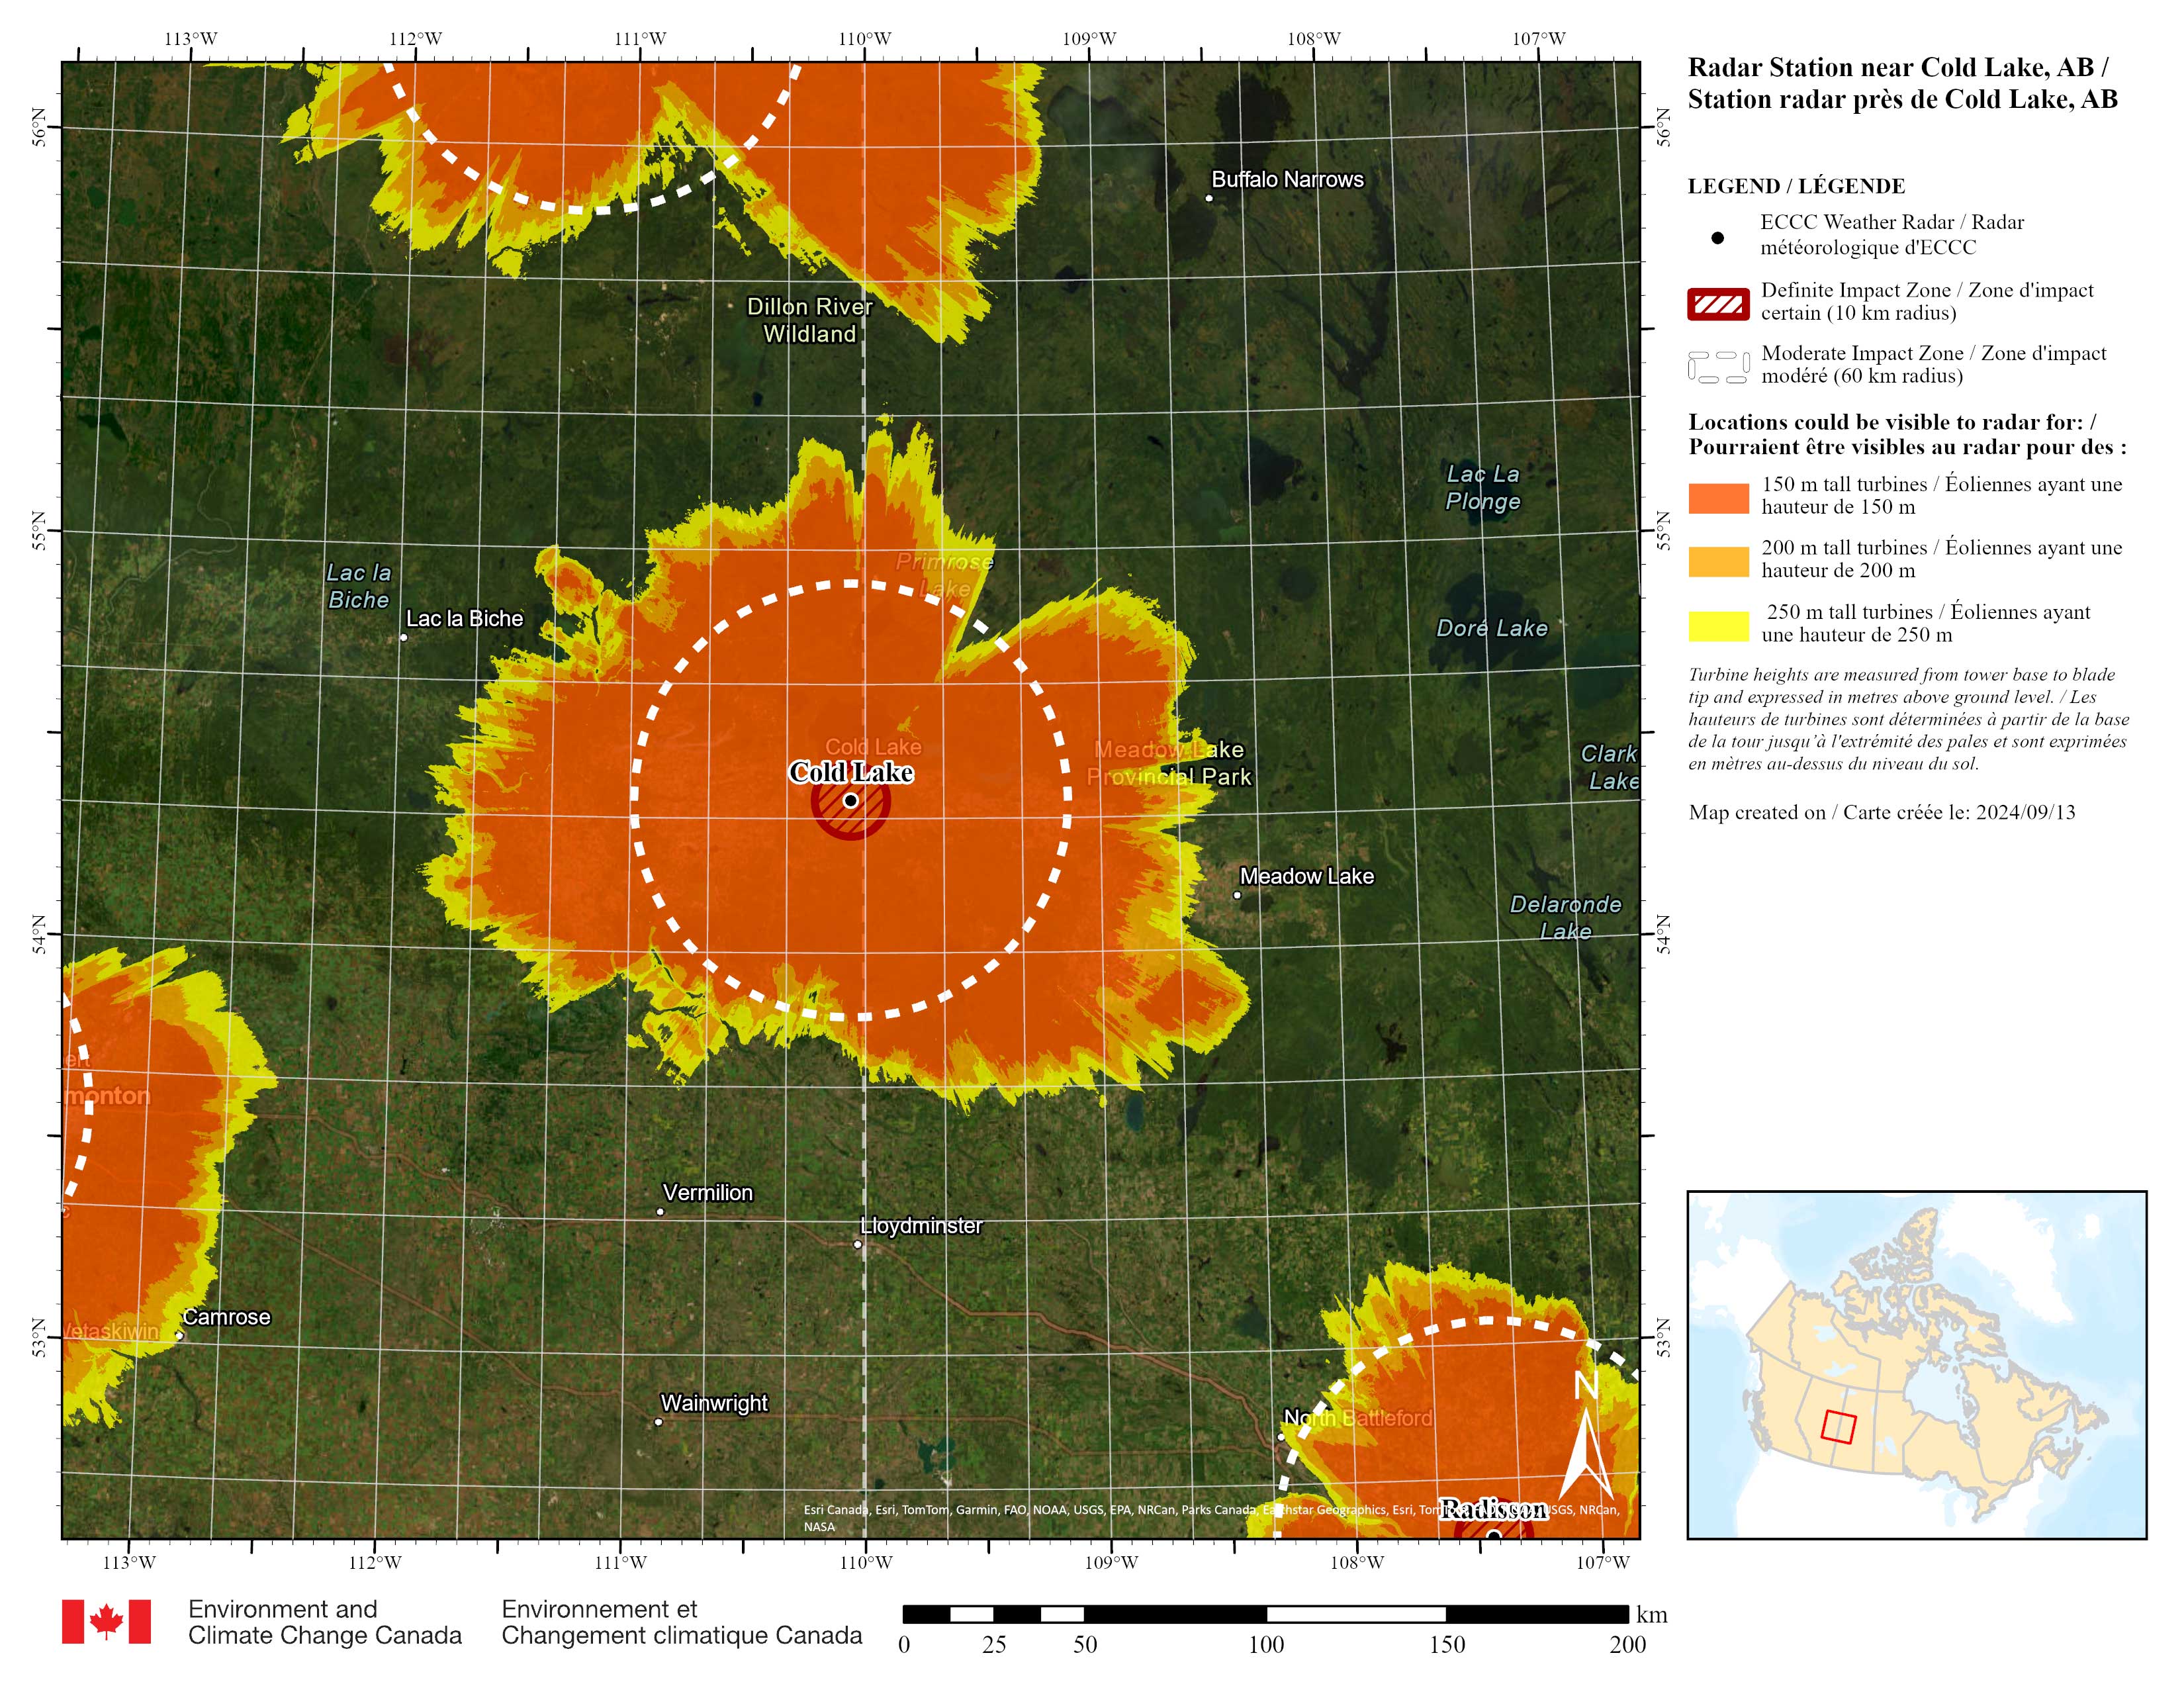
Cold Lake radar visibility map
Alberta
Long description
Map is centered on the radar station near Cold Lake, Alberta. Legend: The black dot indicates where the weather radar is located. Dark orange areas indicate locations where 150 metre (m) tall turbines are likely to be visible to the radars. Light orange areas indicate locations where 200 m tall turbines are likely to be visible to the radars. Yellow areas indicate locations where 250 m tall turbines are likely to be visible to the radars. Turbine heights are measured from tower base to blade tip and expressed in metres above ground level. Hatch-filled red circles around each radar represent a 10 kilometre (km) radius “definite impact zone”, where significant impacts to the radar are more likely to occur and therefore turbines should not be built within this zone. Dashed circles around each radar represent a 10-60 km radius “moderate impact zone”, where moderate-to-significant impacts to the radar are more likely to occur if turbines are built within this zone.
-
Fort McMurray radar visibility map
Alberta

Long description
Map is centered on the radar station near Fort McMurray, Alberta. Legend: The black dot indicates where the weather radar is located. Dark orange areas indicate locations where 150 metre (m) tall turbines are likely to be visible to the radars. Light orange areas indicate locations where 200 m tall turbines are likely to be visible to the radars. Yellow areas indicate locations where 250 m tall turbines are likely to be visible to the radars. Turbine heights are measured from tower base to blade tip and expressed in metres above ground level. Hatch-filled red circles around each radar represent a 10 kilometre (km) radius “definite impact zone”, where significant impacts to the radar are more likely to occur and therefore turbines should not be built within this zone. Dashed circles around each radar represent a 10-60 km radius “moderate impact zone”, where moderate-to-significant impacts to the radar are more likely to occur if turbines are built within this zone.
-
Schuler radar visibility map
Alberta
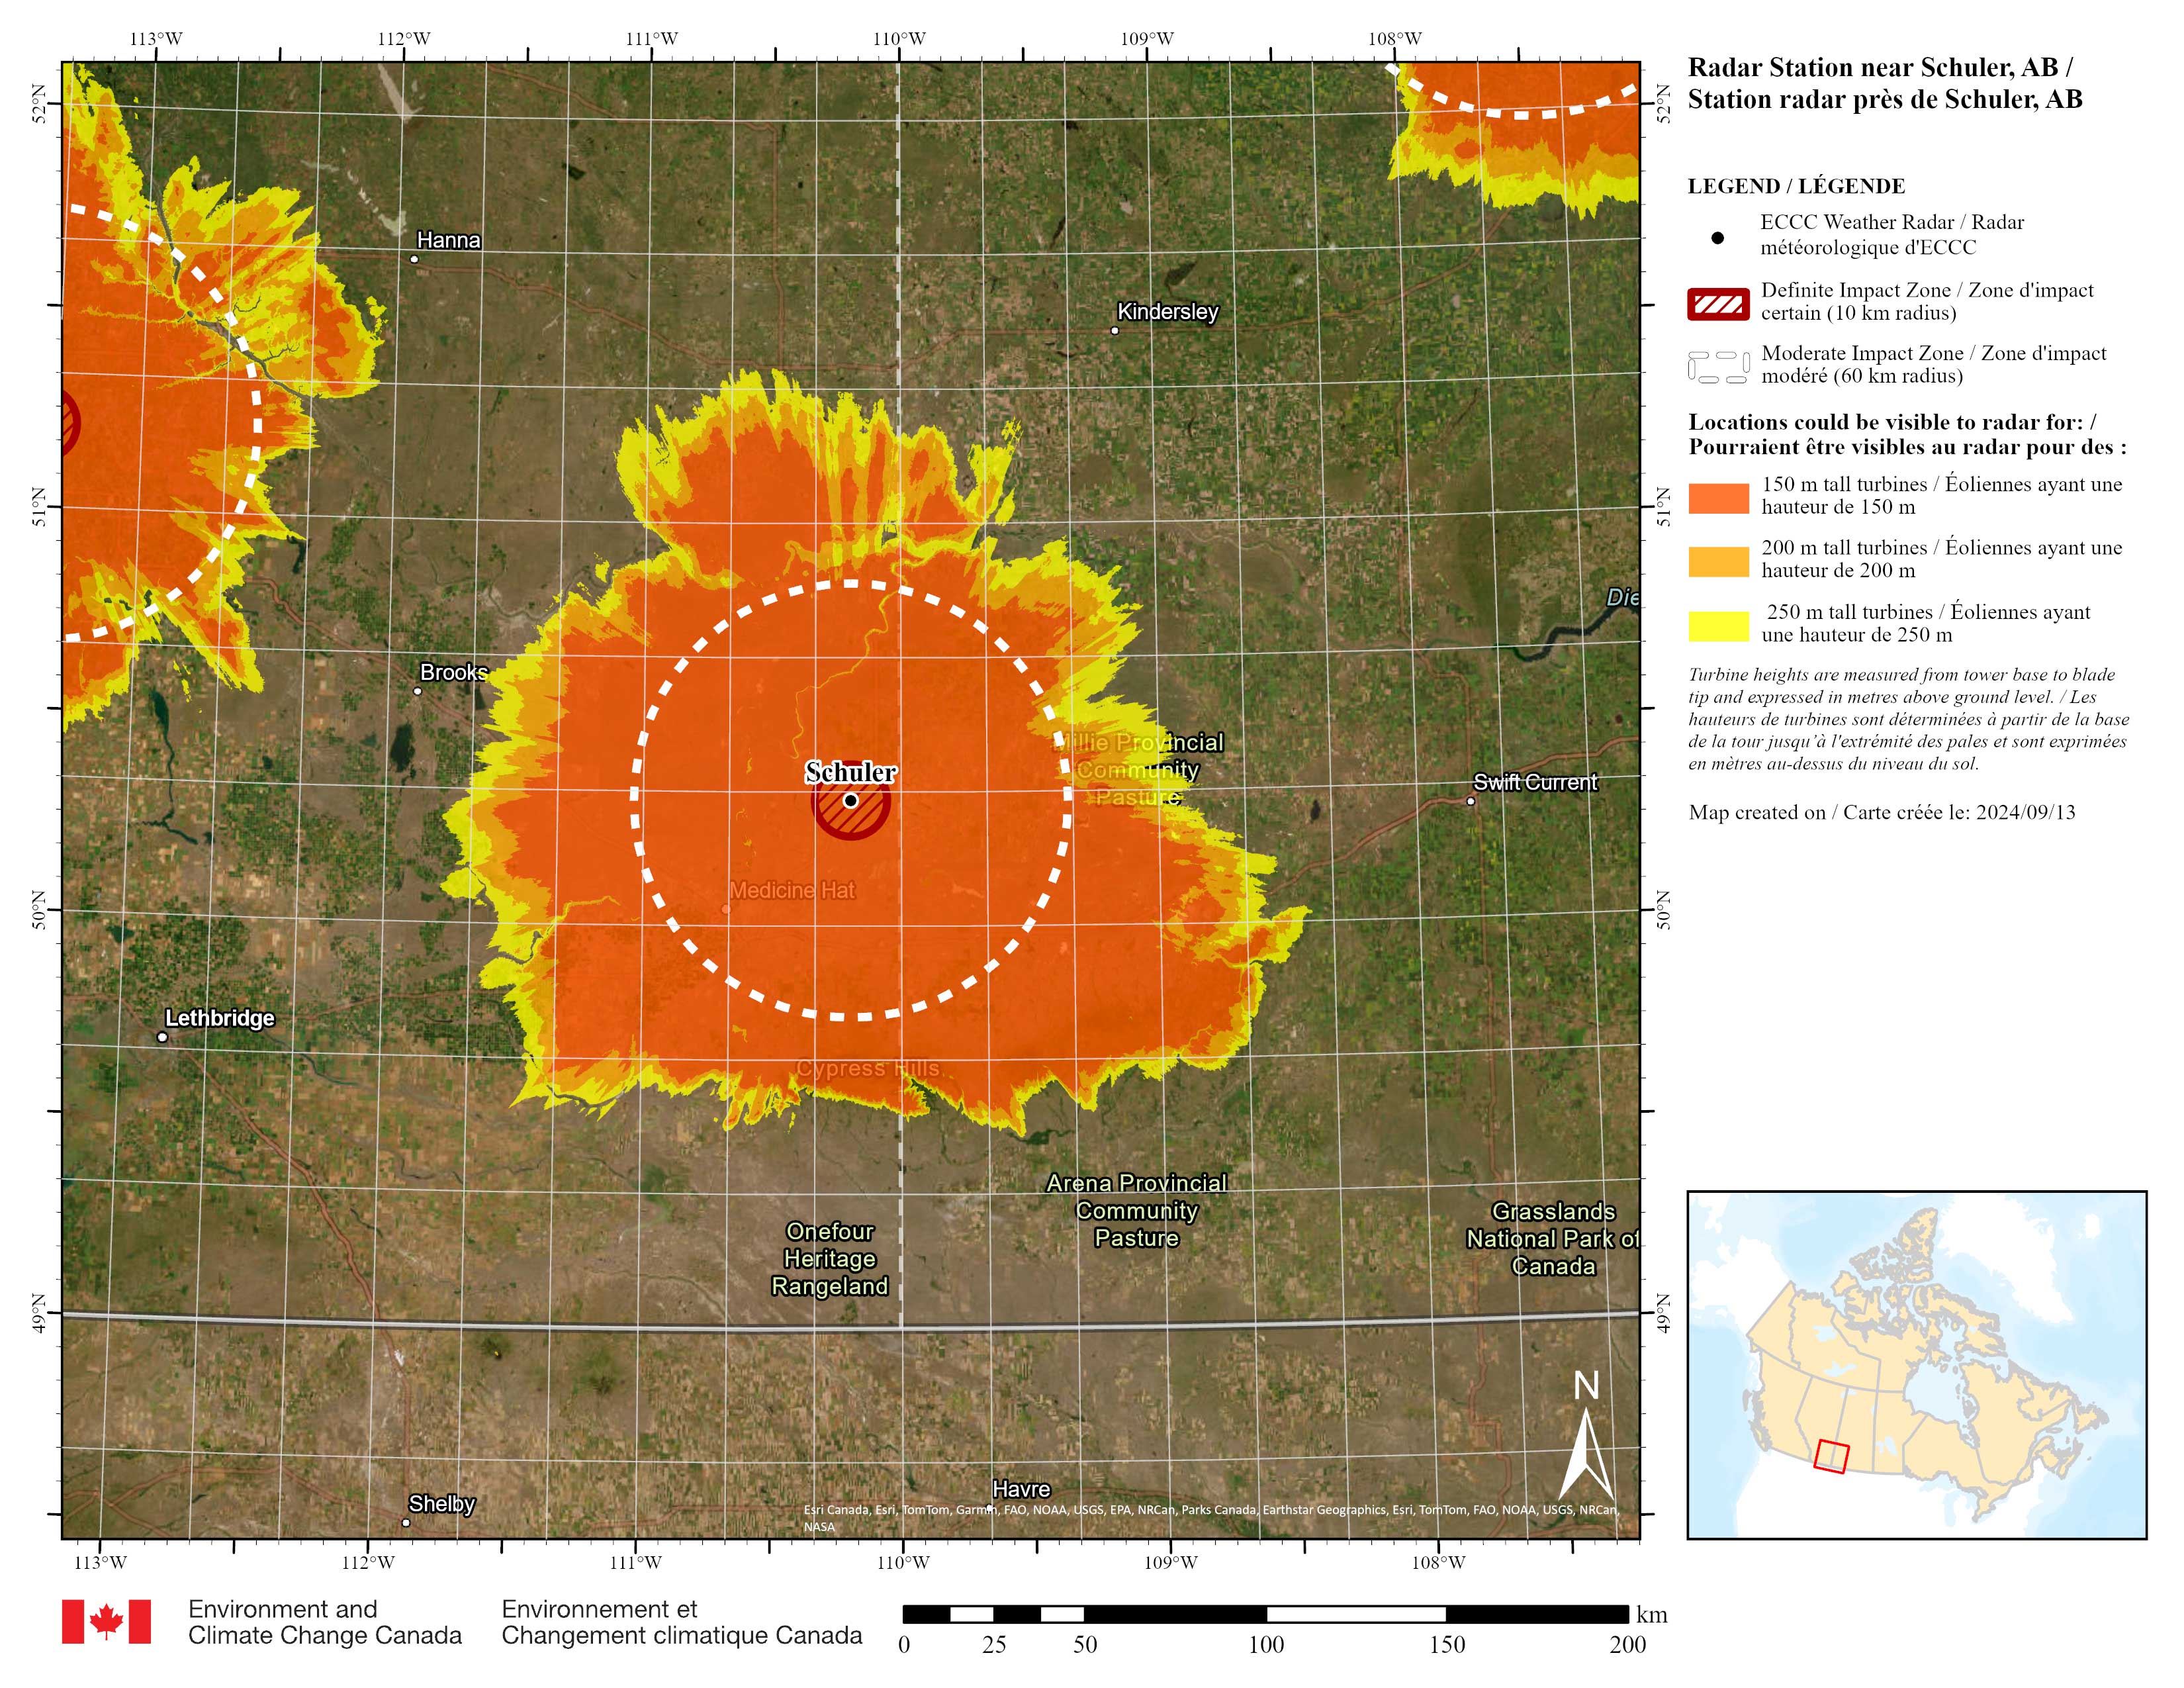
Long description
Map is centered on the radar station near Schuler, Alberta. Legend: The black dot indicates where the weather radar is located. Dark orange areas indicate locations where 150 metre (m) tall turbines are likely to be visible to the radars. Light orange areas indicate locations where 200 m tall turbines are likely to be visible to the radars. Yellow areas indicate locations where 250 m tall turbines are likely to be visible to the radars. Turbine heights are measured from tower base to blade tip and expressed in metres above ground level. Hatch-filled red circles around each radar represent a 10 kilometre (km) radius “definite impact zone”, where significant impacts to the radar are more likely to occur and therefore turbines should not be built within this zone. Dashed circles around each radar represent a 10-60 km radius “moderate impact zone”, where moderate-to-significant impacts to the radar are more likely to occur if turbines are built within this zone.
-
Spirit River radar visibility map
Alberta

Long description
Map is centered on the radar station near Spirit River, Alberta. Legend: The black dot indicates where the weather radar is located. Dark orange areas indicate locations where 150 metre (m) tall turbines are likely to be visible to the radars. Light orange areas indicate locations where 200 m tall turbines are likely to be visible to the radars. Yellow areas indicate locations where 250 m tall turbines are likely to be visible to the radars. Turbine heights are measured from tower base to blade tip and expressed in metres above ground level. Hatch-filled red circles around each radar represent a 10 kilometre (km) radius “definite impact zone”, where significant impacts to the radar are more likely to occur and therefore turbines should not be built within this zone. Dashed circles around each radar represent a 10-60 km radius “moderate impact zone”, where moderate-to-significant impacts to the radar are more likely to occur if turbines are built within this zone.
-
Strathmore radar visibility map
Alberta
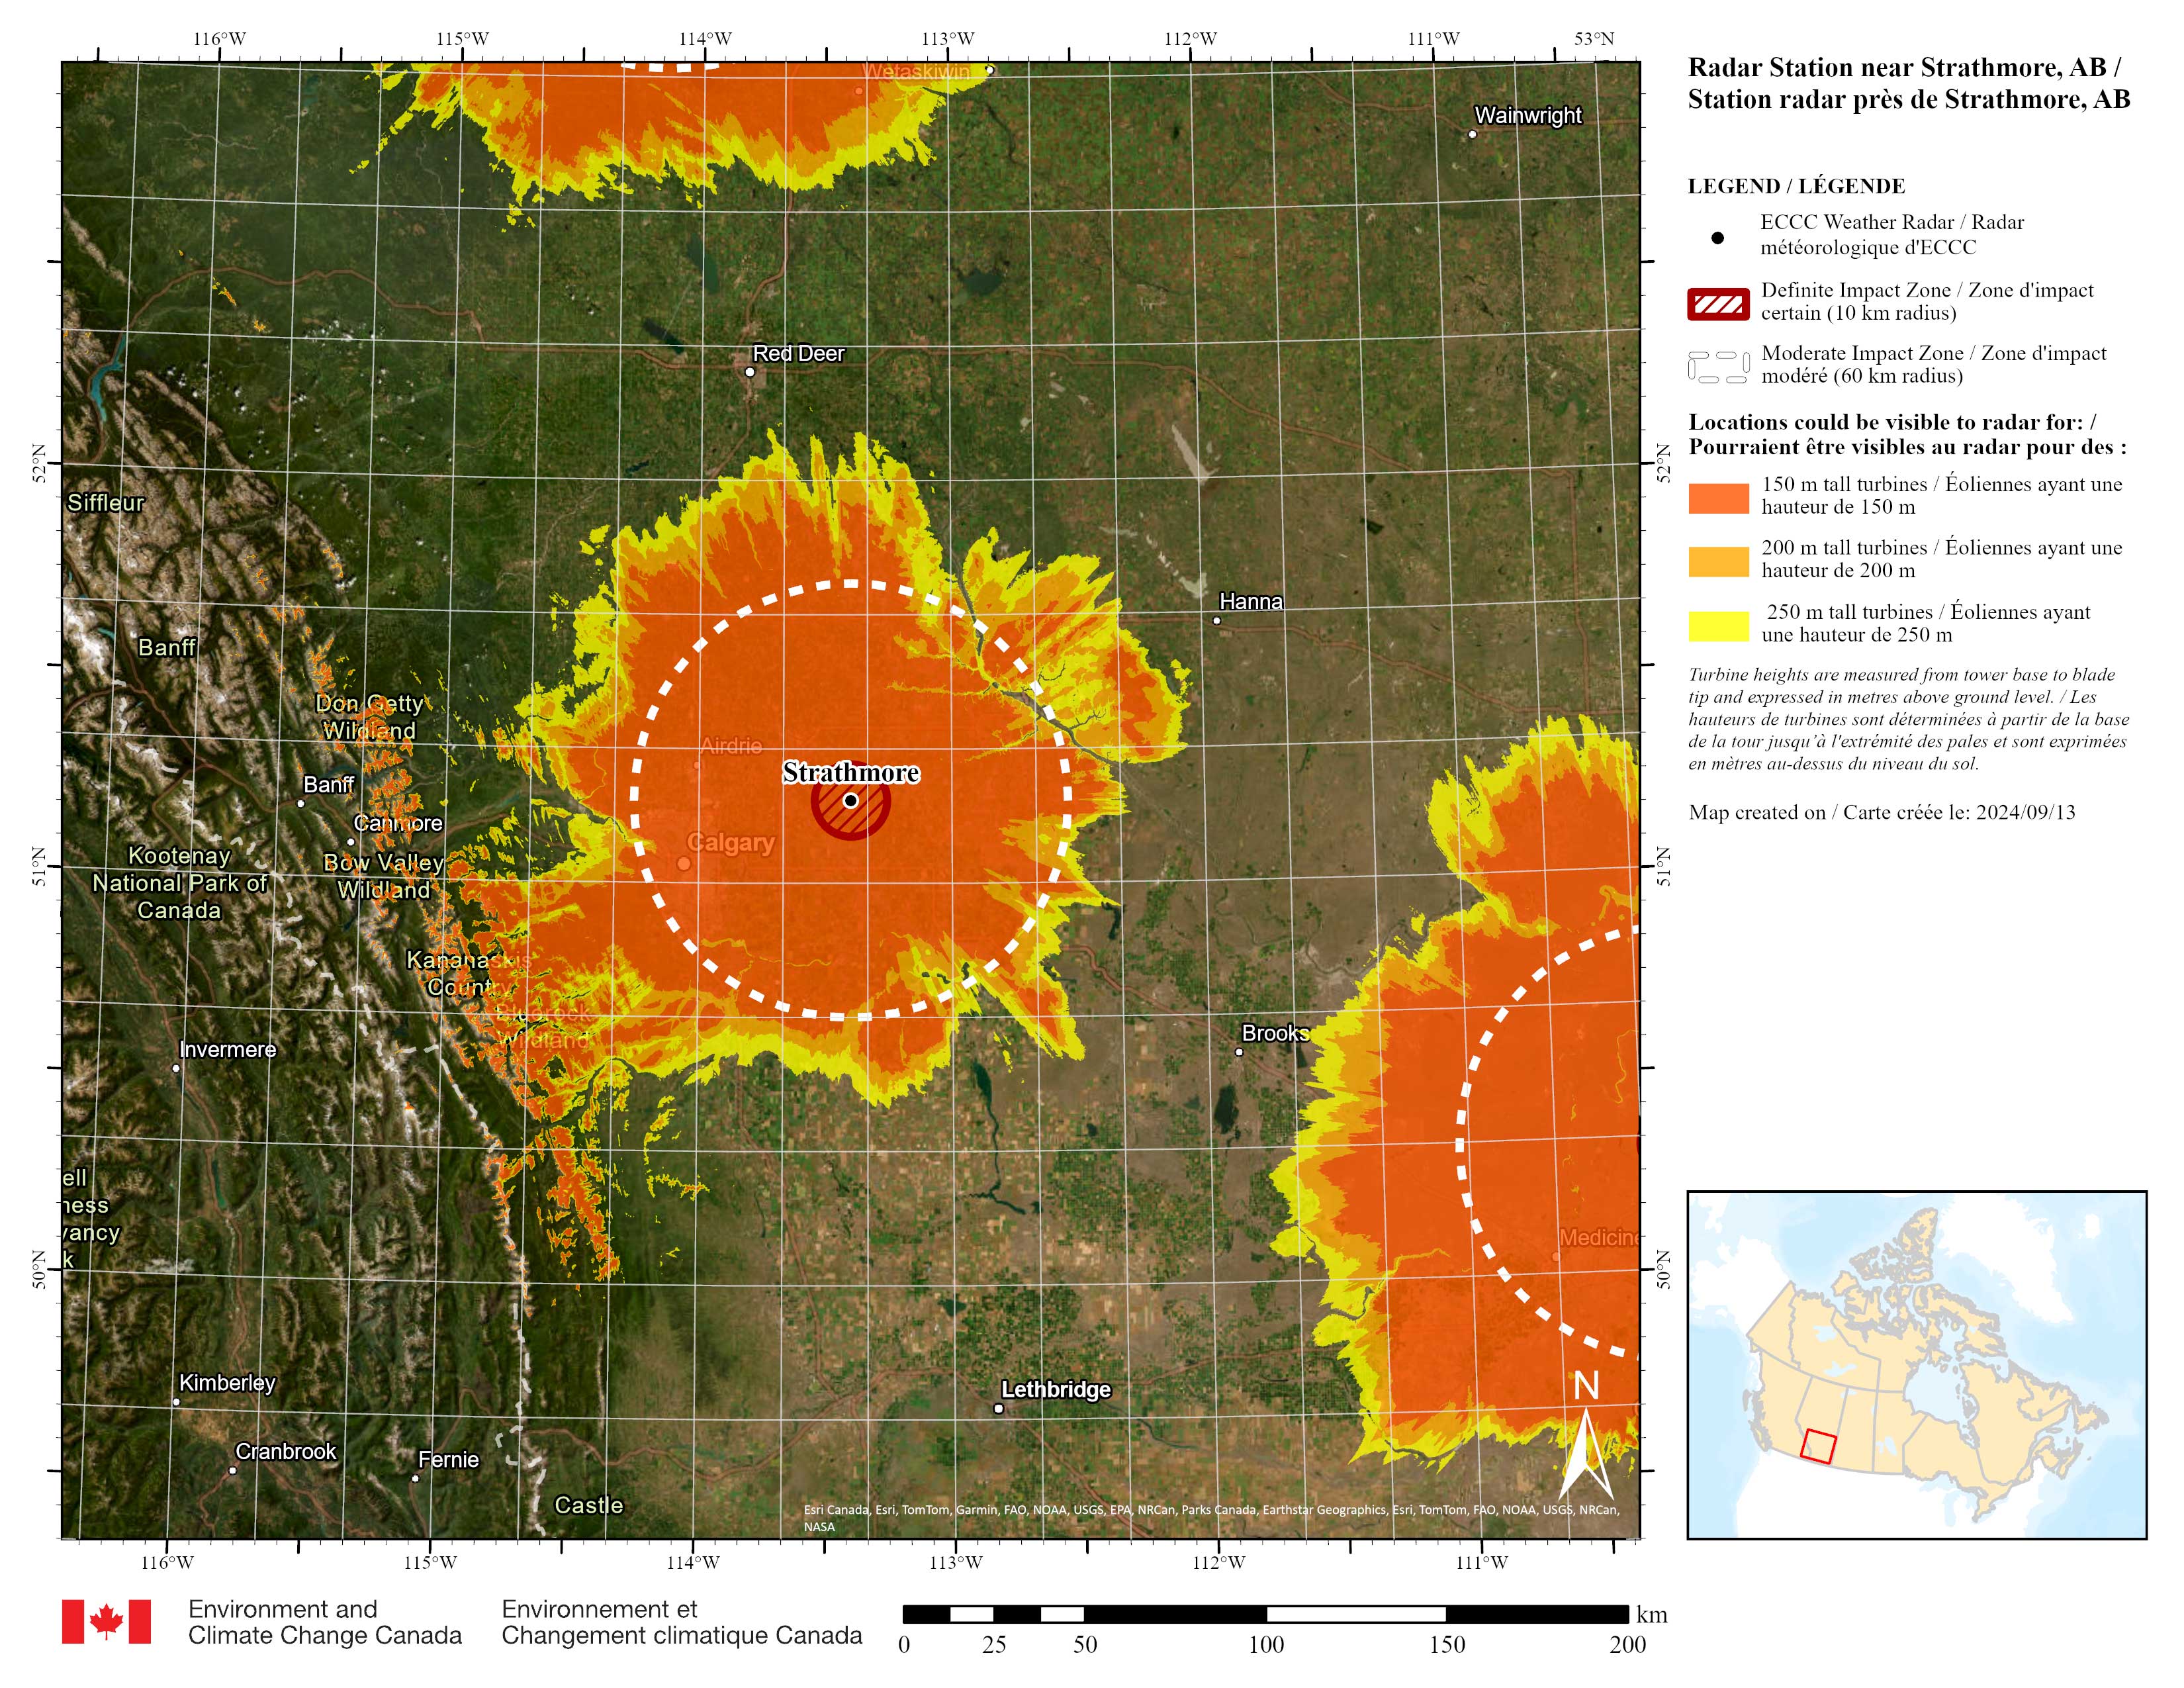
Long description
Map is centered on the radar station near Strathmore, Alberta. Legend: The black dot indicates where the weather radar is located. Dark orange areas indicate locations where 150 metre (m) tall turbines are likely to be visible to the radars. Light orange areas indicate locations where 200 m tall turbines are likely to be visible to the radars. Yellow areas indicate locations where 250 m tall turbines are likely to be visible to the radars. Turbine heights are measured from tower base to blade tip and expressed in metres above ground level. Hatch-filled red circles around each radar represent a 10 kilometre (km) radius “definite impact zone”, where significant impacts to the radar are more likely to occur and therefore turbines should not be built within this zone. Dashed circles around each radar represent a 10-60 km radius “moderate impact zone”, where moderate-to-significant impacts to the radar are more likely to occur if turbines are built within this zone.
-
Bethune radar visibility map
Saskatchewan

Long description
Map is centered on the radar station near Bethune, Saskatchewan. Legend: The black dot indicates where the weather radar is located. Dark orange areas indicate locations where 150 metre (m) tall turbines are likely to be visible to the radars. Light orange areas indicate locations where 200 m tall turbines are likely to be visible to the radars. Yellow areas indicate locations where 250 m tall turbines are likely to be visible to the radars. Turbine heights are measured from tower base to blade tip and expressed in metres above ground level. Hatch-filled red circles around each radar represent a 10 kilometre (km) radius “definite impact zone”, where significant impacts to the radar are more likely to occur and therefore turbines should not be built within this zone. Dashed circles around each radar represent a 10-60 km radius “moderate impact zone”, where moderate-to-significant impacts to the radar are more likely to occur if turbines are built within this zone.
-
Radisson radar visibility map
Saskatchewan
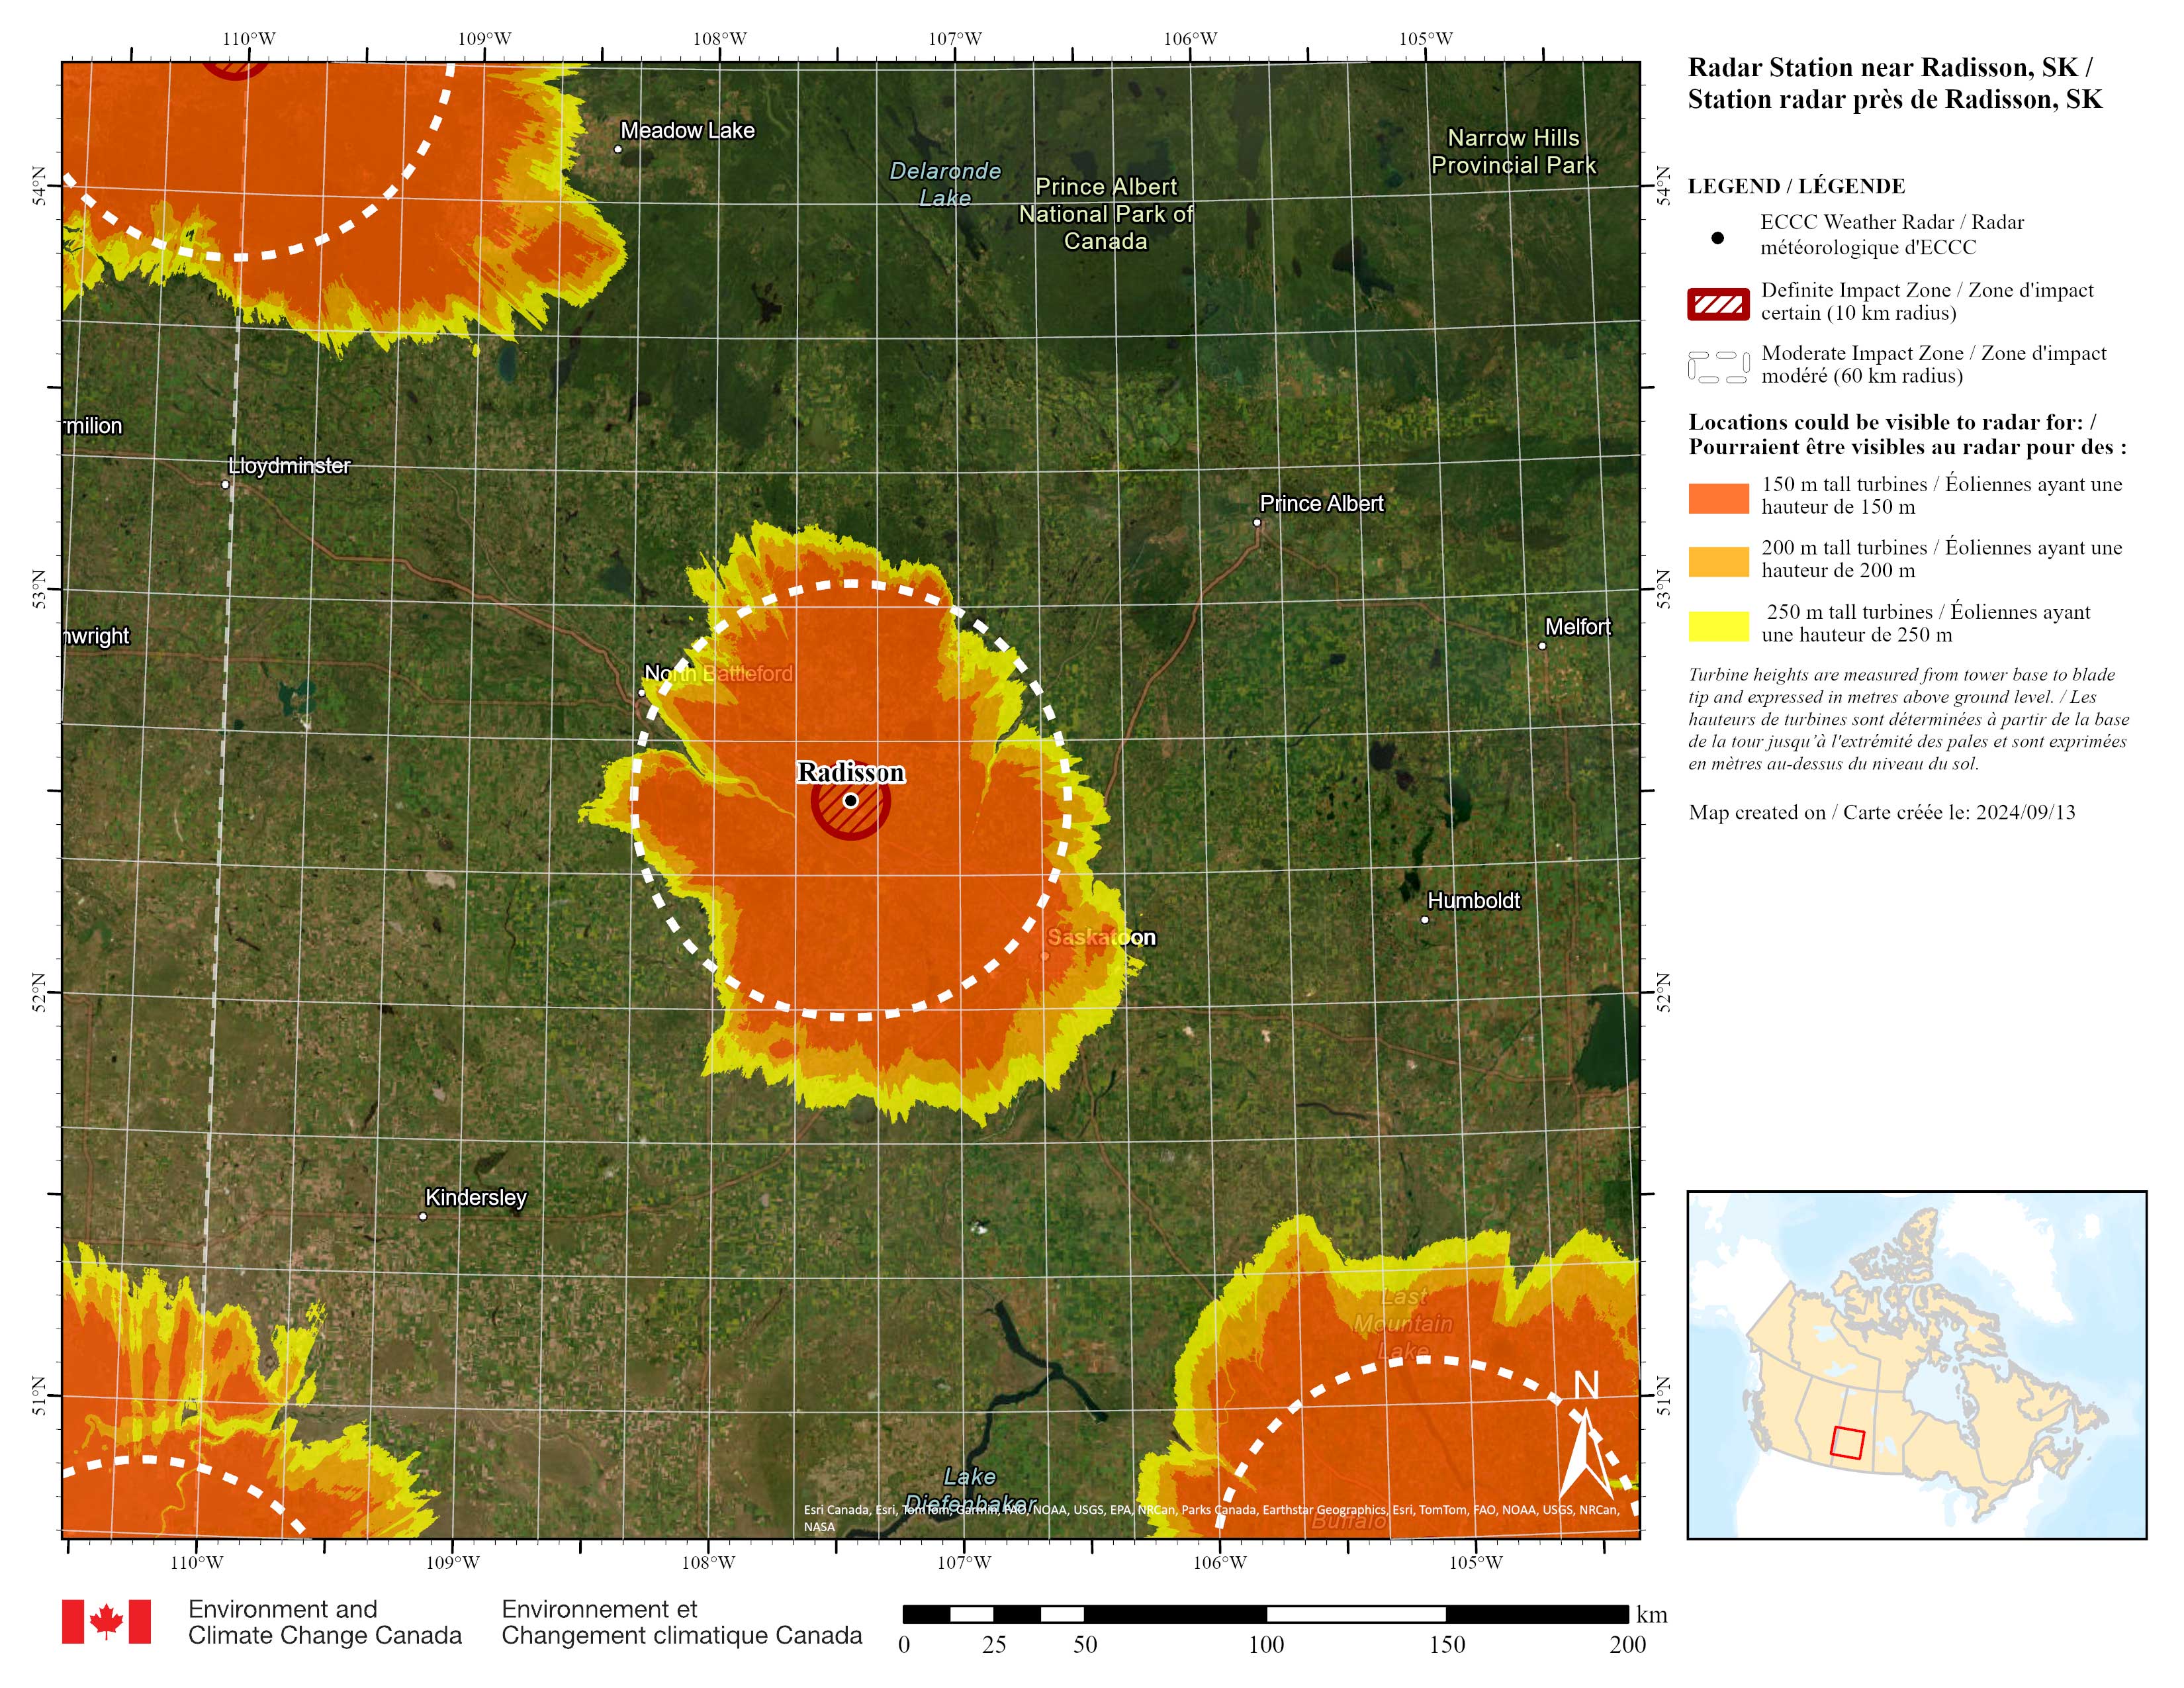
Long description
Map is centered on the radar station near Radisson, Saskatchewan. Legend: The black dot indicates where the weather radar is located. Dark orange areas indicate locations where 150 metre (m) tall turbines are likely to be visible to the radars. Light orange areas indicate locations where 200 m tall turbines are likely to be visible to the radars. Yellow areas indicate locations where 250 m tall turbines are likely to be visible to the radars. Turbine heights are measured from tower base to blade tip and expressed in metres above ground level. Hatch-filled red circles around each radar represent a 10 kilometre (km) radius “definite impact zone”, where significant impacts to the radar are more likely to occur and therefore turbines should not be built within this zone. Dashed circles around each radar represent a 10-60 km radius “moderate impact zone”, where moderate-to-significant impacts to the radar are more likely to occur if turbines are built within this zone.
-
Foxwarren radar visibility map
Manitoba
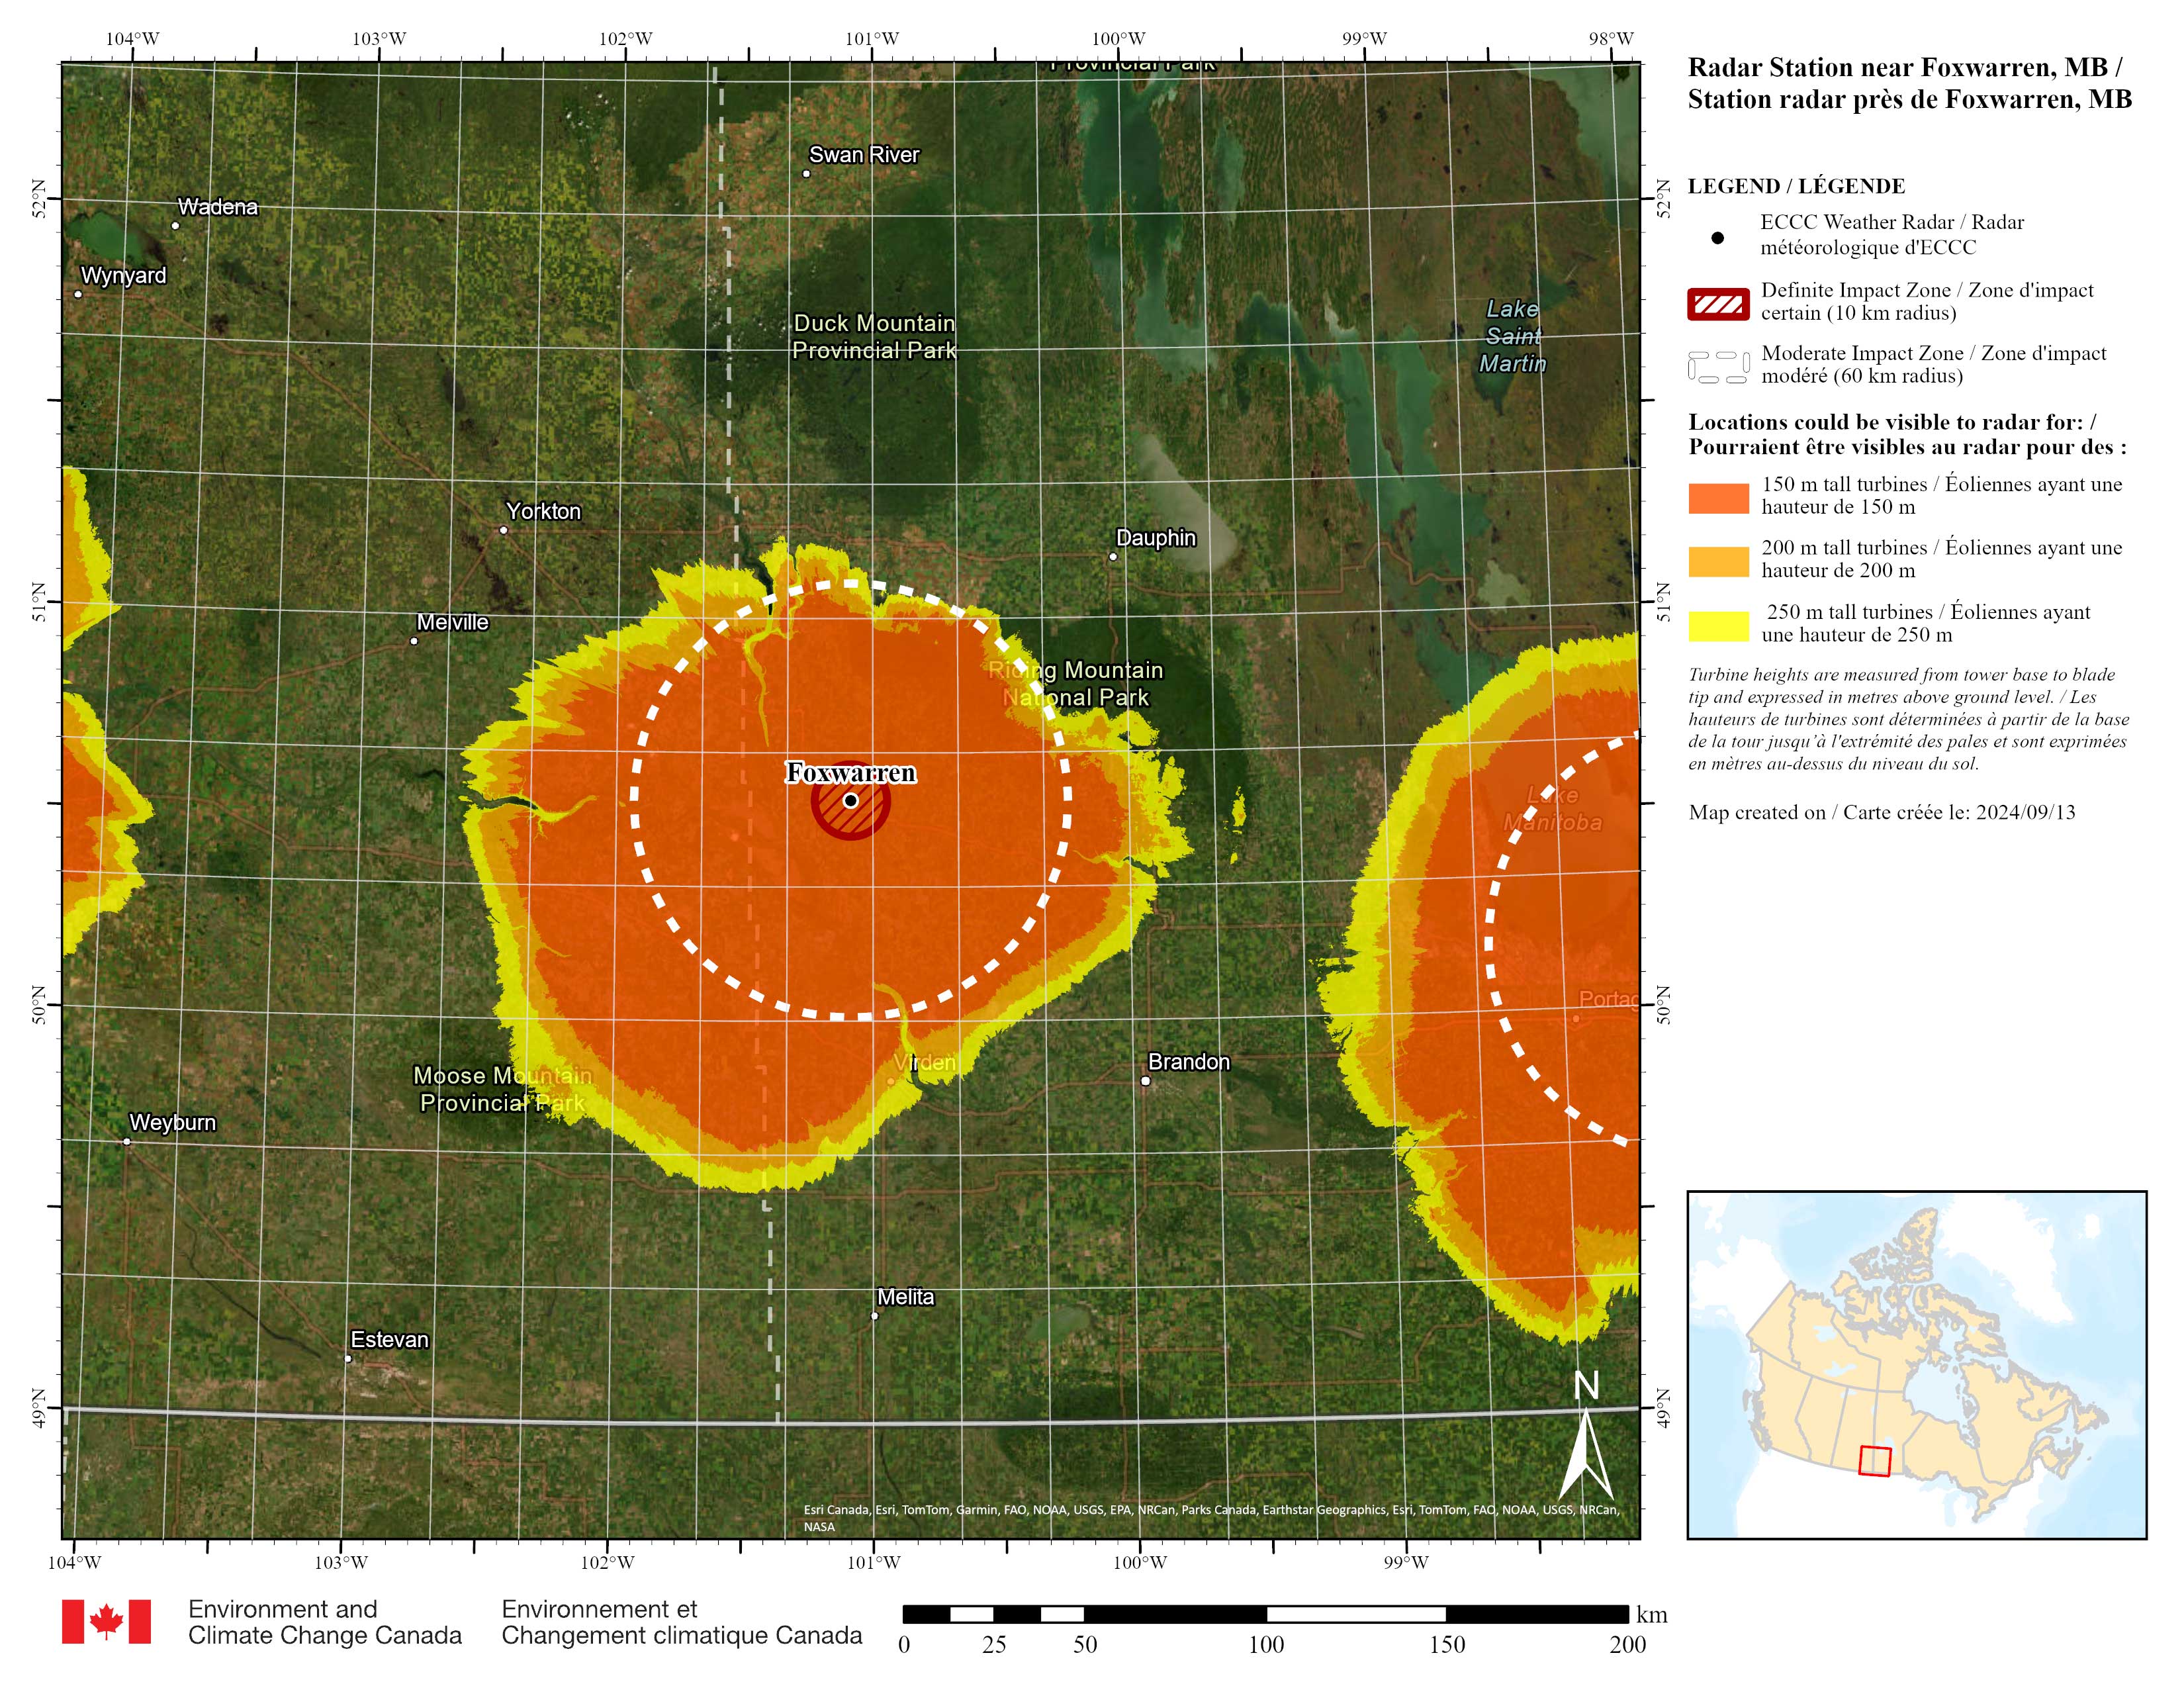
Long description
Map is centered on the radar station near Foxwarren, Manitoba. Legend: The black dot indicates where the weather radar is located. Dark orange areas indicate locations where 150 metre (m) tall turbines are likely to be visible to the radars. Light orange areas indicate locations where 200 m tall turbines are likely to be visible to the radars. Yellow areas indicate locations where 250 m tall turbines are likely to be visible to the radars. Turbine heights are measured from tower base to blade tip and expressed in metres above ground level. Hatch-filled red circles around each radar represent a 10 kilometre (km) radius “definite impact zone”, where significant impacts to the radar are more likely to occur and therefore turbines should not be built within this zone. Dashed circles around each radar represent a 10-60 km radius “moderate impact zone”, where moderate-to-significant impacts to the radar are more likely to occur if turbines are built within this zone.
-
Woodlands radar visibility map
Manitoba

Long description
Map is centered on the radar station near Woodlands, Manitoba. Legend: The black dot indicates where the weather radar is located. Dark orange areas indicate locations where 150 metre (m) tall turbines are likely to be visible to the radars. Light orange areas indicate locations where 200 m tall turbines are likely to be visible to the radars. Yellow areas indicate locations where 250 m tall turbines are likely to be visible to the radars. Turbine heights are measured from tower base to blade tip and expressed in metres above ground level. Hatch-filled red circles around each radar represent a 10 kilometre (km) radius “definite impact zone”, where significant impacts to the radar are more likely to occur and therefore turbines should not be built within this zone. Dashed circles around each radar represent a 10-60 km radius “moderate impact zone”, where moderate-to-significant impacts to the radar are more likely to occur if turbines are built within this zone.
-
Britt radar visibility map
Ontario
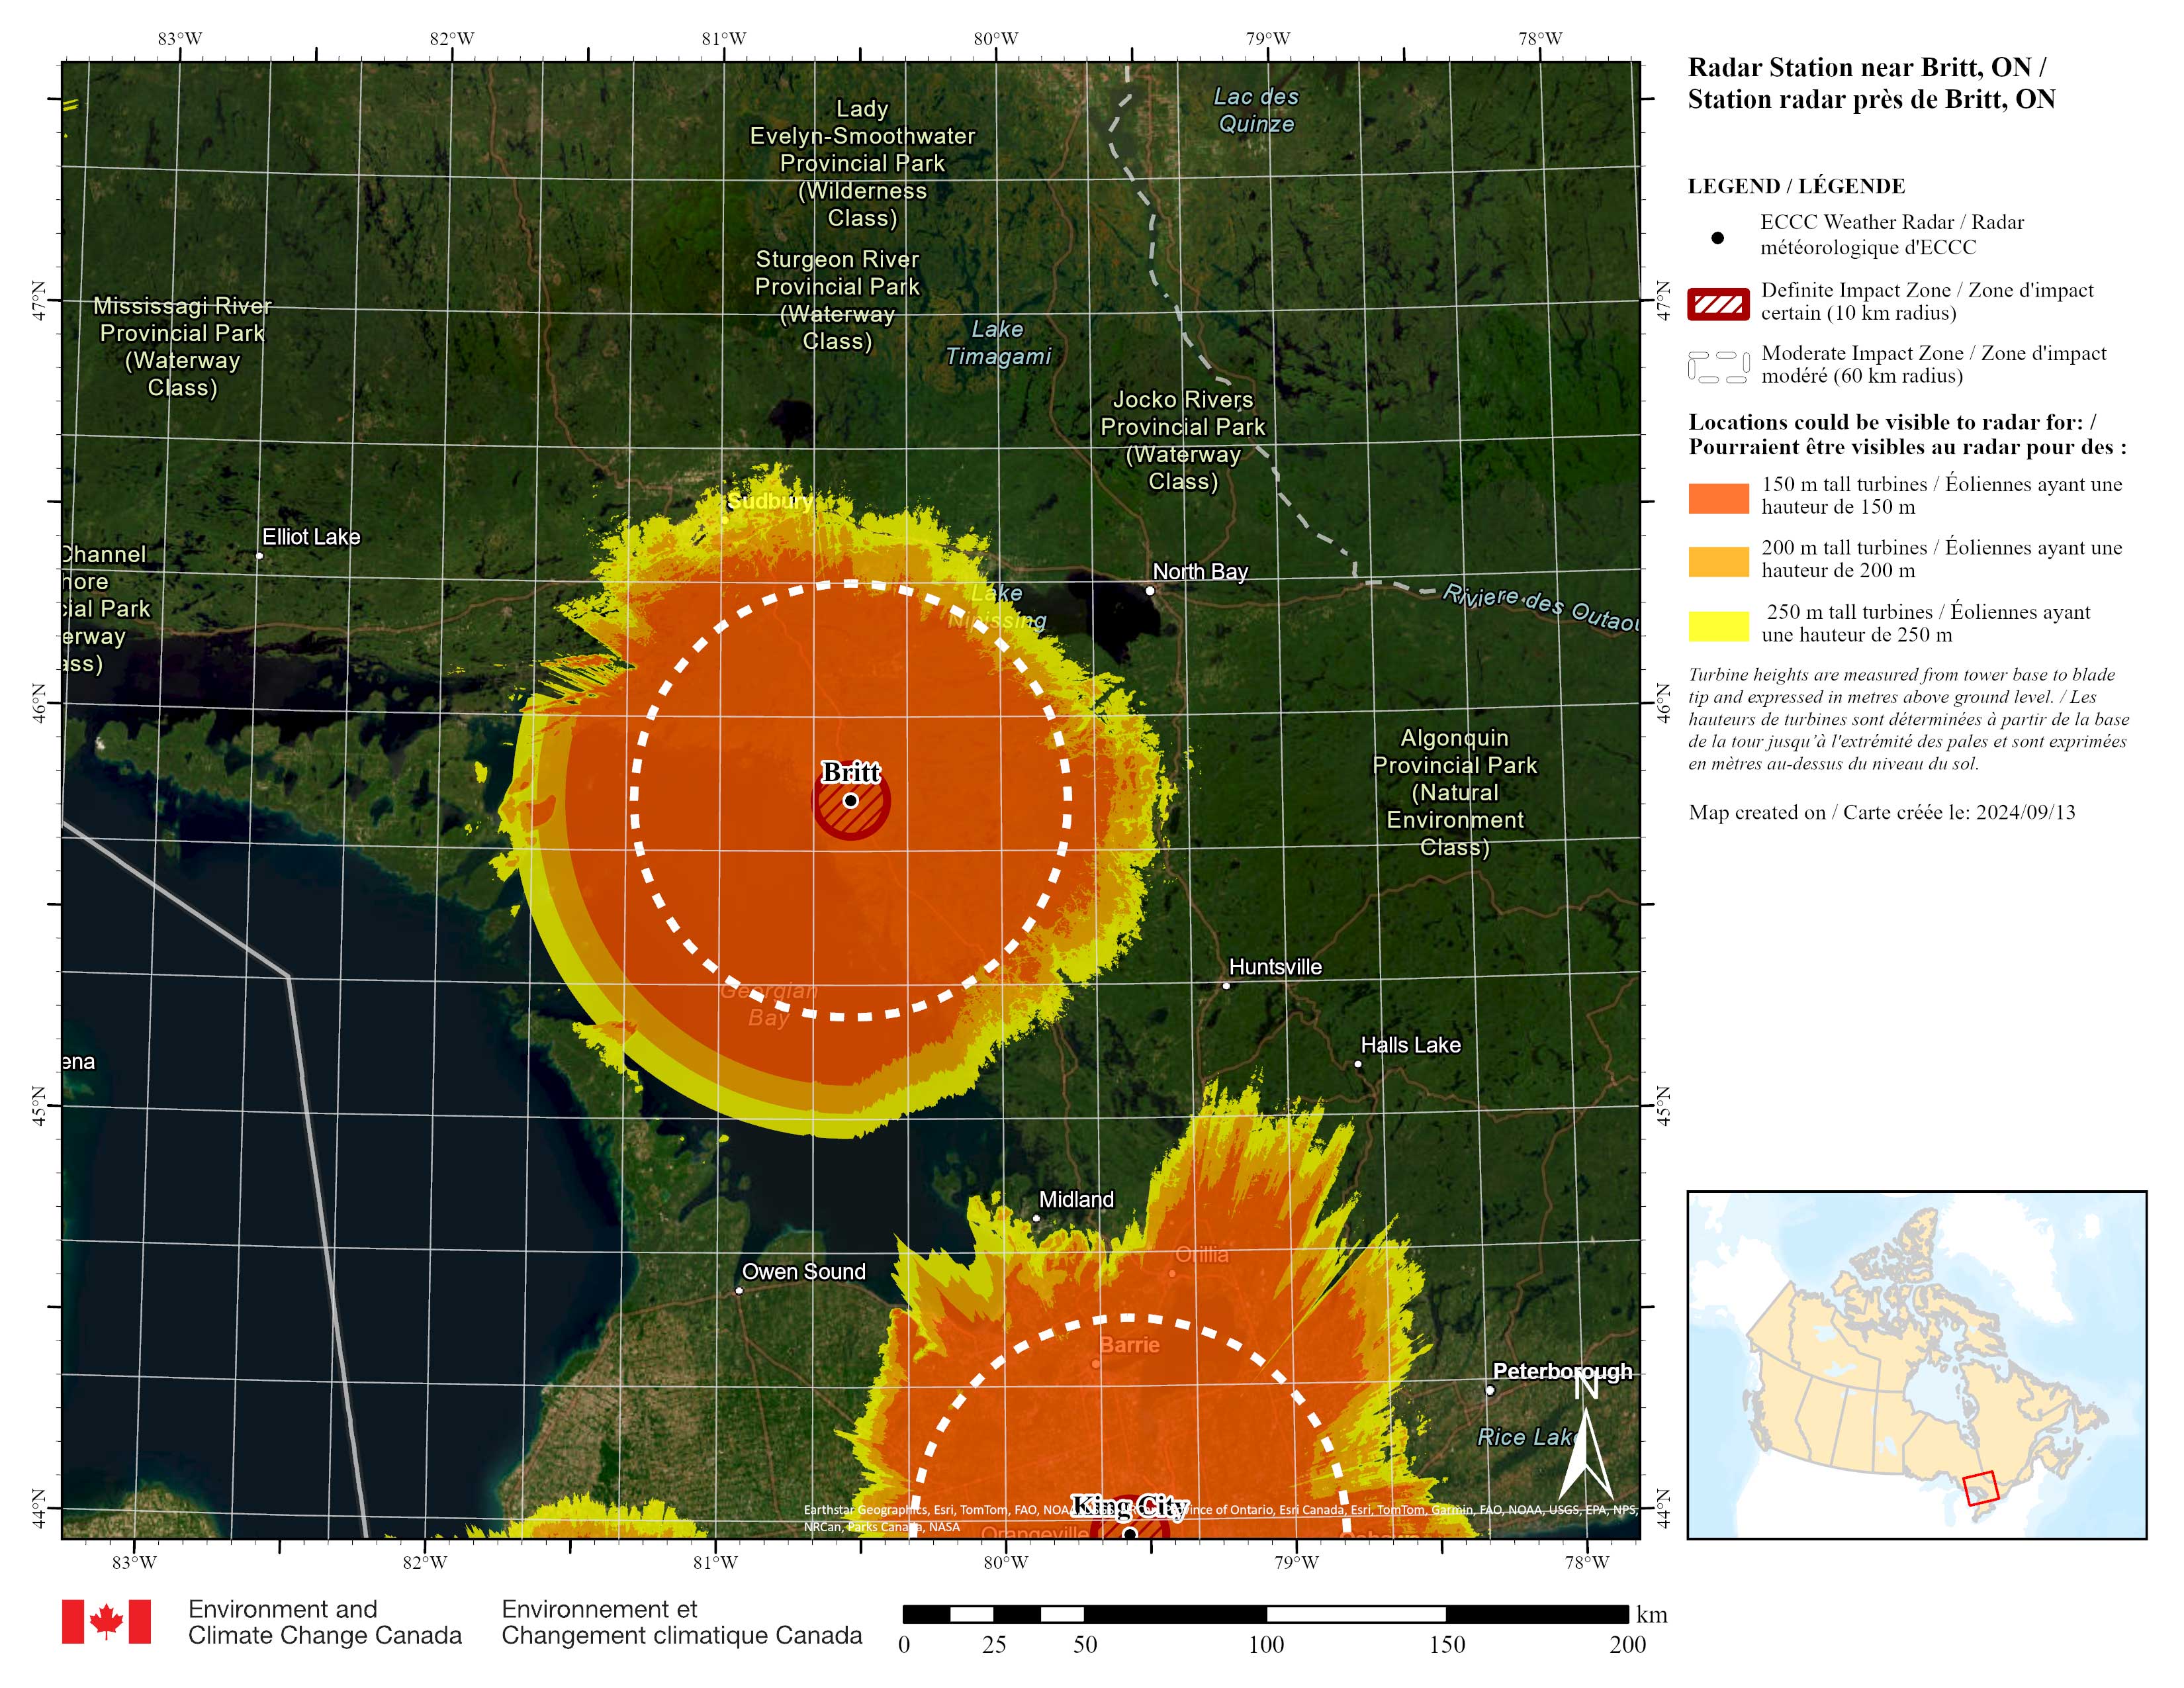
Long description
Map is centered on the radar station near Britt, Ontario. Legend: The black dot indicates where the weather radar is located. Dark orange areas indicate locations where 150 metre (m) tall turbines are likely to be visible to the radars. Light orange areas indicate locations where 200 m tall turbines are likely to be visible to the radars. Yellow areas indicate locations where 250 m tall turbines are likely to be visible to the radars. Turbine heights are measured from tower base to blade tip and expressed in metres above ground level. Hatch-filled red circles around each radar represent a 10 kilometre (km) radius “definite impact zone”, where significant impacts to the radar are more likely to occur and therefore turbines should not be built within this zone. Dashed circles around each radar represent a 10-60 km radius “moderate impact zone”, where moderate-to-significant impacts to the radar are more likely to occur if turbines are built within this zone.
-
Dryden radar visibility map
Ontario
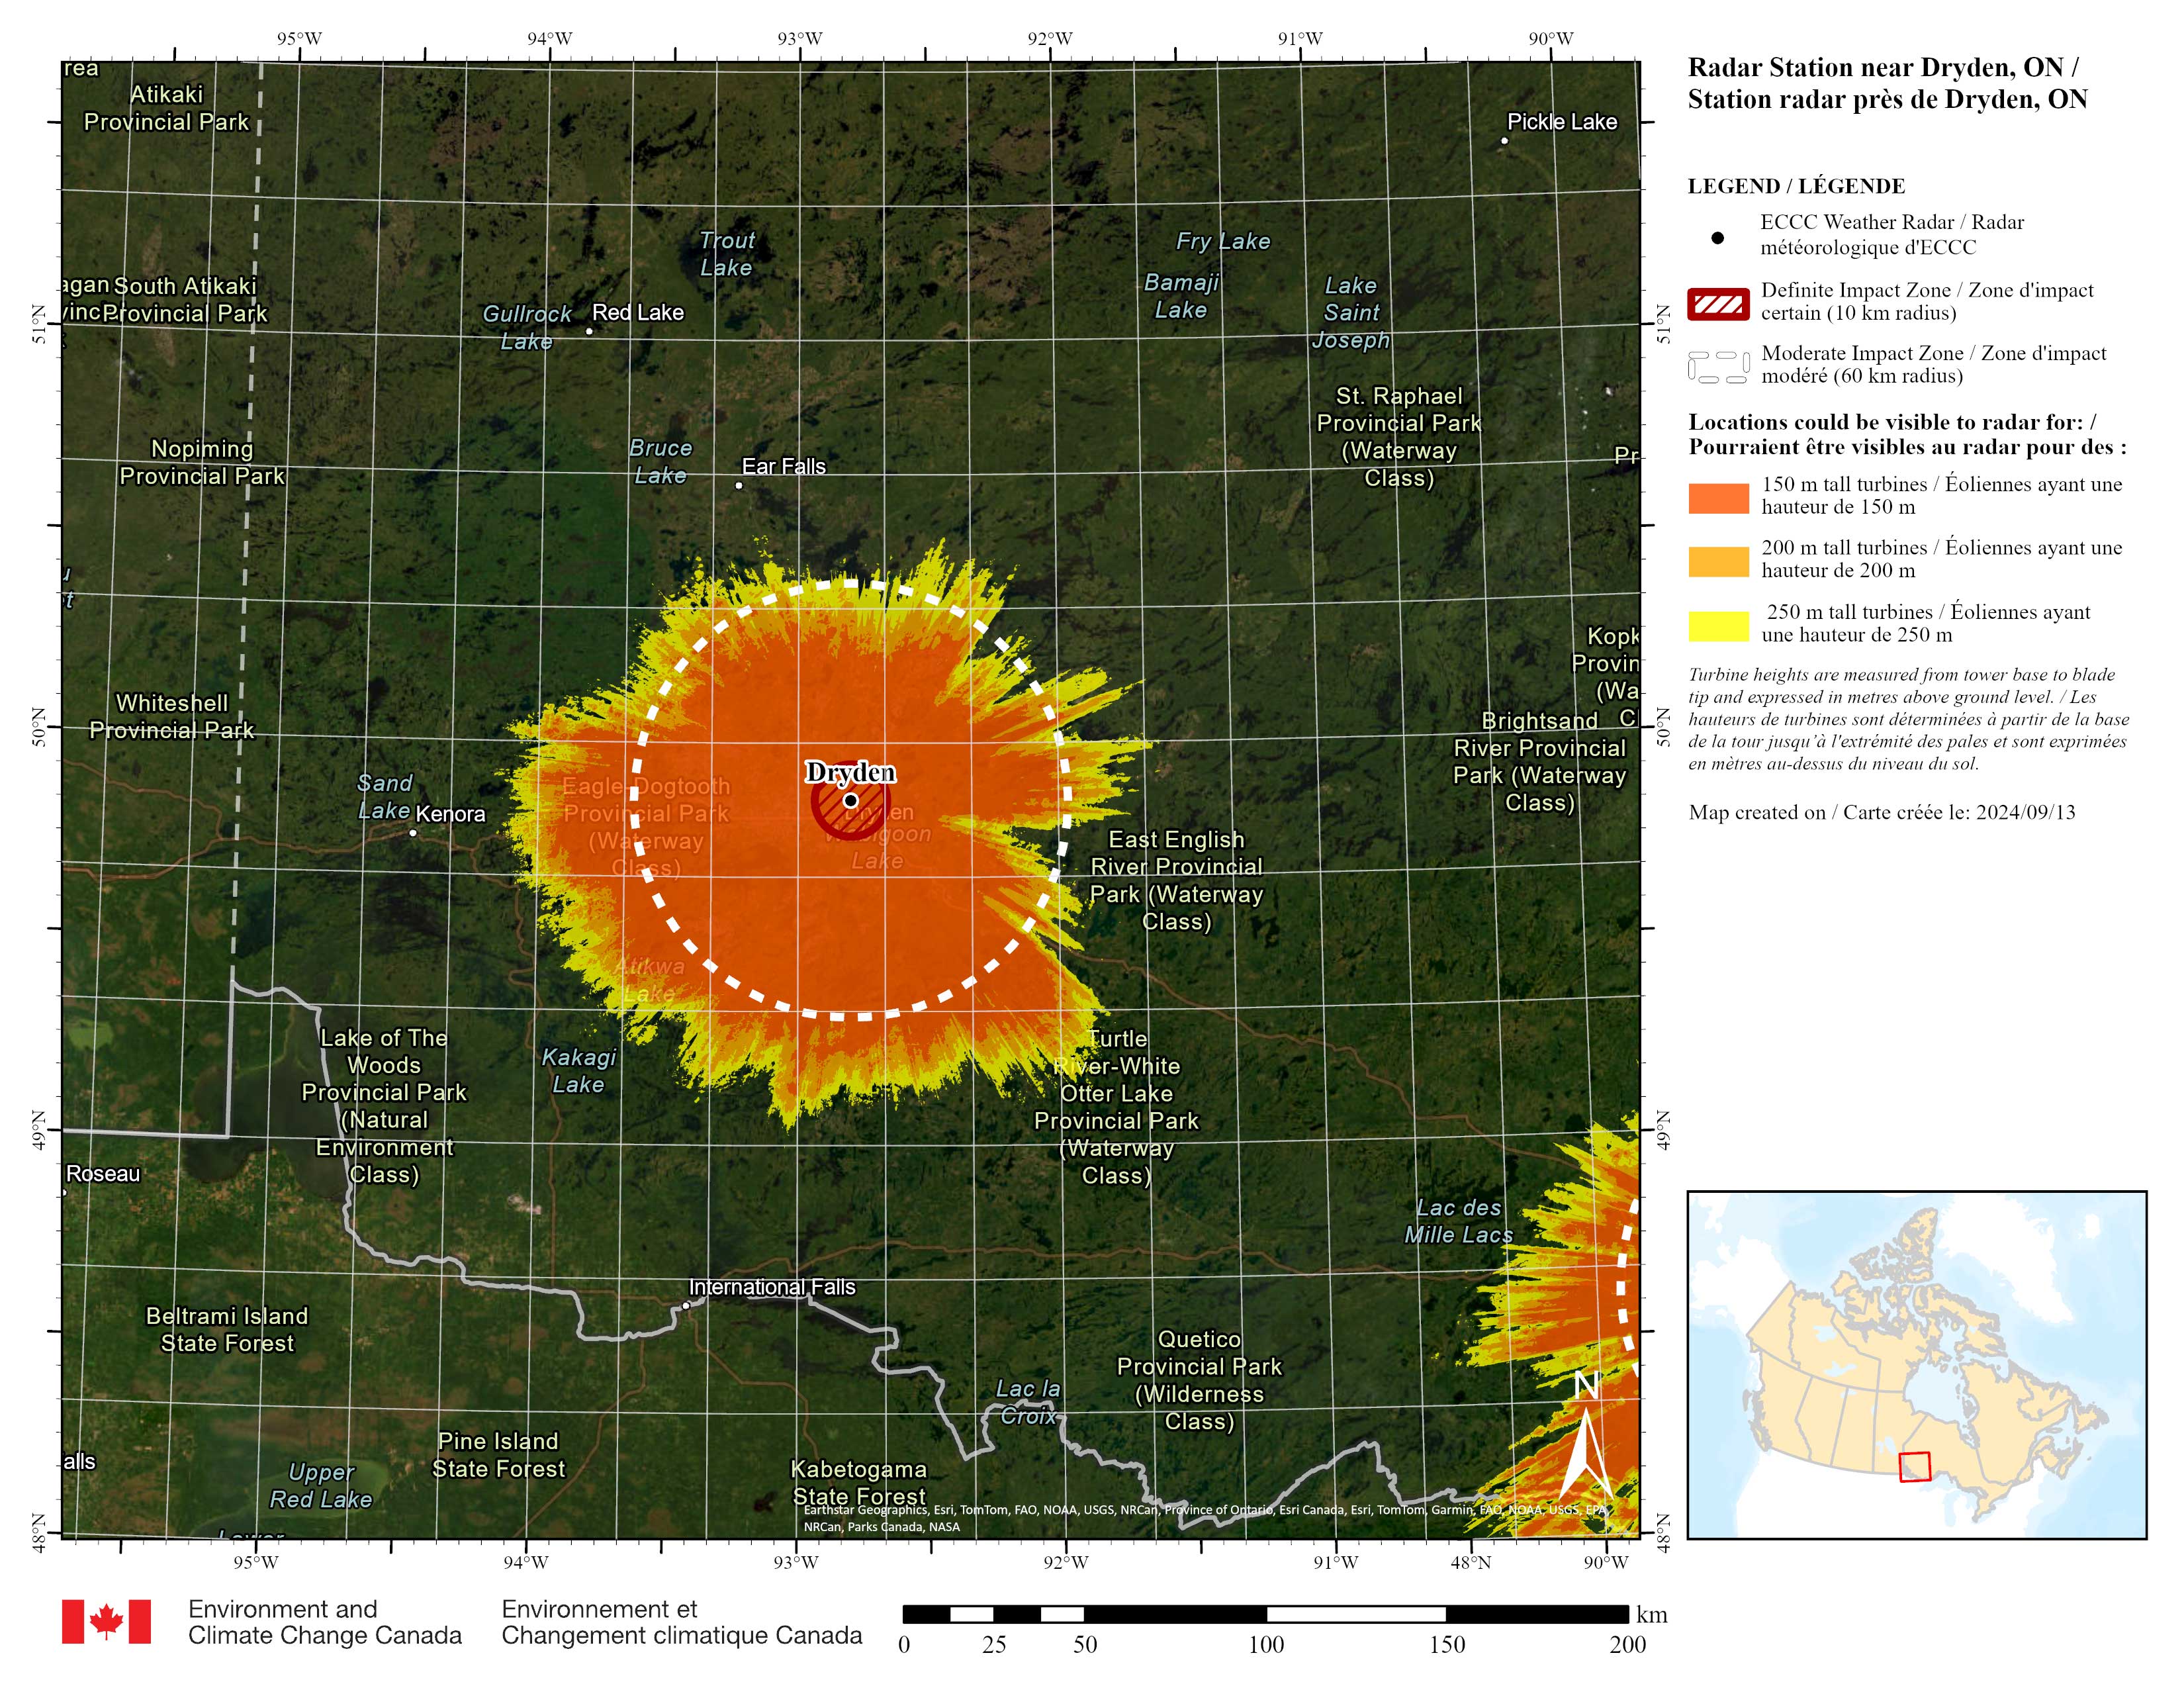
Long description
Map is centered on the radar station near Dryden, Ontario. Legend: The black dot indicates where the weather radar is located. Dark orange areas indicate locations where 150 metre (m) tall turbines are likely to be visible to the radars. Light orange areas indicate locations where 200 m tall turbines are likely to be visible to the radars. Yellow areas indicate locations where 250 m tall turbines are likely to be visible to the radars. Turbine heights are measured from tower base to blade tip and expressed in metres above ground level. Hatch-filled red circles around each radar represent a 10 kilometre (km) radius “definite impact zone”, where significant impacts to the radar are more likely to occur and therefore turbines should not be built within this zone. Dashed circles around each radar represent a 10-60 km radius “moderate impact zone”, where moderate-to-significant impacts to the radar are more likely to occur if turbines are built within this zone.
-
Exeter radar visibility map
Ontario

Long description
Map is centered on the radar station near Exeter, Ontario. Legend: The black dot indicates where the weather radar is located. Dark orange areas indicate locations where 150 metre (m) tall turbines are likely to be visible to the radars. Light orange areas indicate locations where 200 m tall turbines are likely to be visible to the radars. Yellow areas indicate locations where 250 m tall turbines are likely to be visible to the radars. Turbine heights are measured from tower base to blade tip and expressed in metres above ground level. Hatch-filled red circles around each radar represent a 10 kilometre (km) radius “definite impact zone”, where significant impacts to the radar are more likely to occur and therefore turbines should not be built within this zone. Dashed circles around each radar represent a 10-60 km radius “moderate impact zone”, where moderate-to-significant impacts to the radar are more likely to occur if turbines are built within this zone.
-
Franktown radar visibility map
Ontario
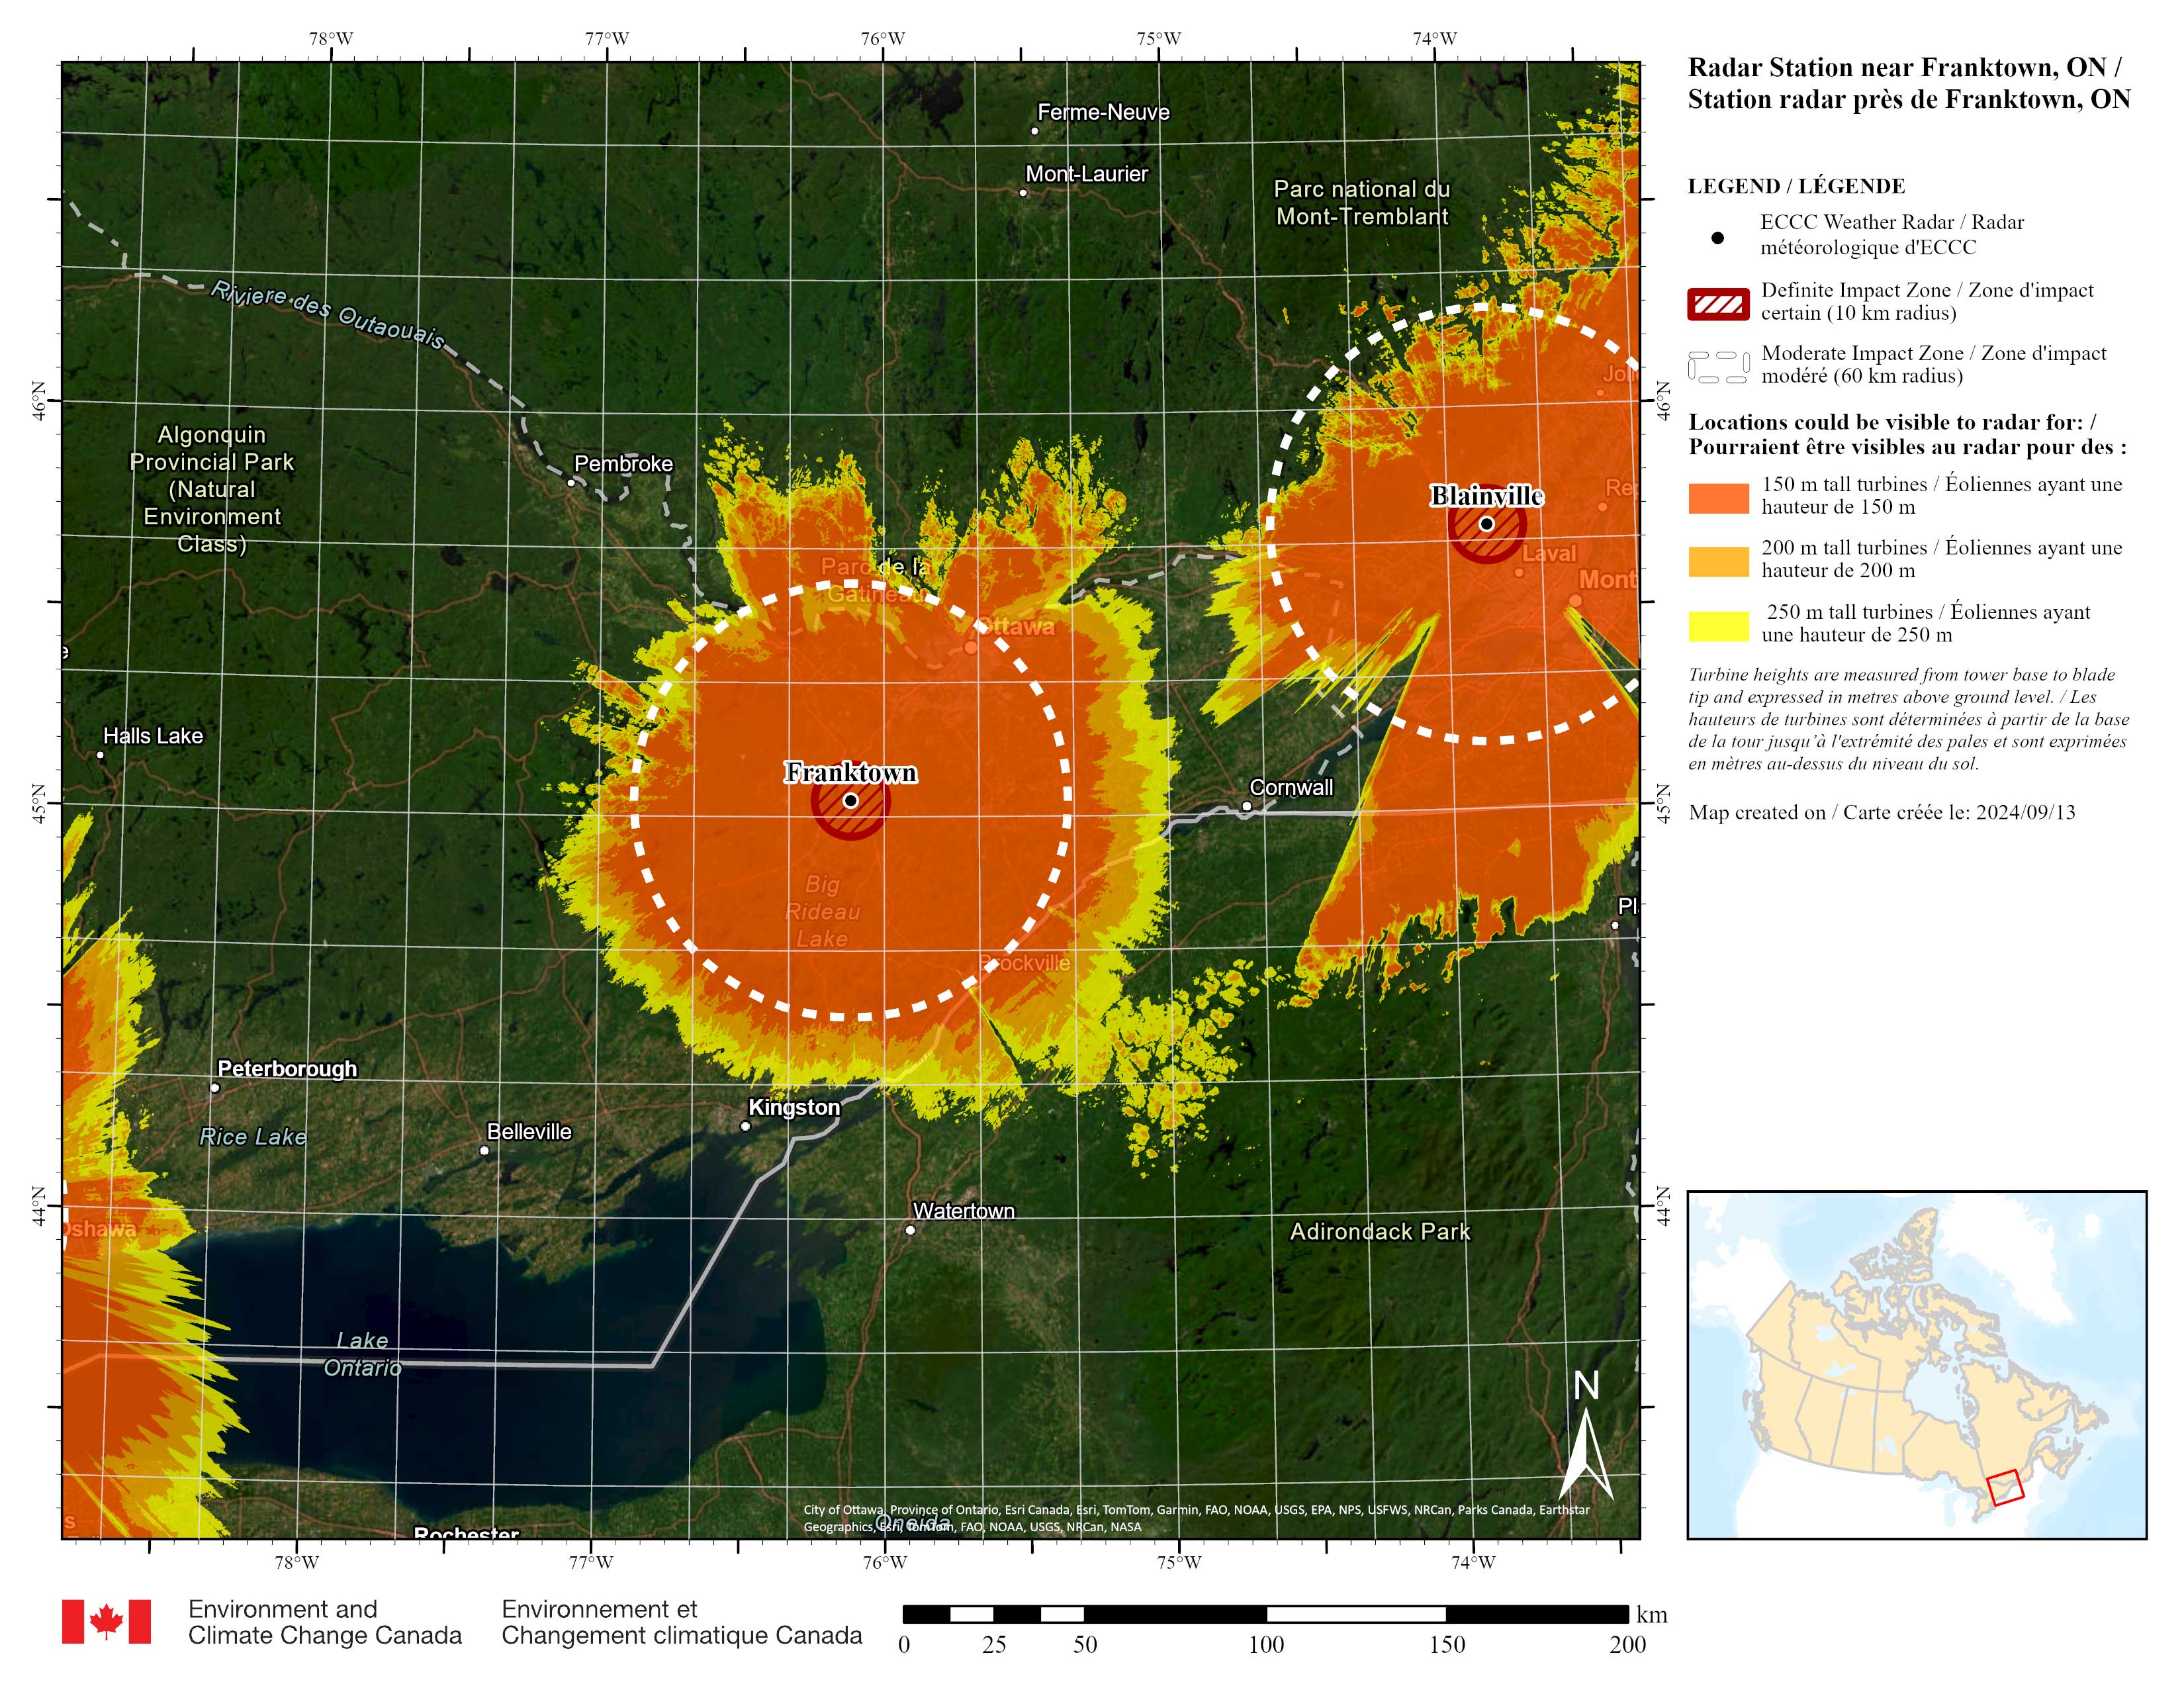
Long description
Map is centered on the radar station near Franktown, Ontario. Legend: The black dot indicates where the weather radar is located. Dark orange areas indicate locations where 150 metre (m) tall turbines are likely to be visible to the radars. Light orange areas indicate locations where 200 m tall turbines are likely to be visible to the radars. Yellow areas indicate locations where 250 m tall turbines are likely to be visible to the radars. Turbine heights are measured from tower base to blade tip and expressed in metres above ground level. Hatch-filled red circles around each radar represent a 10 kilometre (km) radius “definite impact zone”, where significant impacts to the radar are more likely to occur and therefore turbines should not be built within this zone. Dashed circles around each radar represent a 10-60 km radius “moderate impact zone”, where moderate-to-significant impacts to the radar are more likely to occur if turbines are built within this zone.
-
King City radar visibility map
Ontario

Long description
Map is centered on the radar station near King City, Ontario. Legend: The black dot indicates where the weather radar is located. Dark orange areas indicate locations where 150 metre (m) tall turbines are likely to be visible to the radars. Light orange areas indicate locations where 200 m tall turbines are likely to be visible to the radars. Yellow areas indicate locations where 250 m tall turbines are likely to be visible to the radars. Turbine heights are measured from tower base to blade tip and expressed in metres above ground level. Hatch-filled red circles around each radar represent a 10 kilometre (km) radius “definite impact zone”, where significant impacts to the radar are more likely to occur and therefore turbines should not be built within this zone. Dashed circles around each radar represent a 10-60 km radius “moderate impact zone”, where moderate-to-significant impacts to the radar are more likely to occur if turbines are built within this zone.
-
Montreal River Harbour radar visibility map
Ontario

Long description
Map is centered on the radar station near Montreal River Harbour, Ontario. Legend: The black dot indicates where the weather radar is located. Dark orange areas indicate locations where 150 metre (m) tall turbines are likely to be visible to the radars. Light orange areas indicate locations where 200 m tall turbines are likely to be visible to the radars. Yellow areas indicate locations where 250 m tall turbines are likely to be visible to the radars. Turbine heights are measured from tower base to blade tip and expressed in metres above ground level. Hatch-filled red circles around each radar represent a 10 kilometre (km) radius “definite impact zone”, where significant impacts to the radar are more likely to occur and therefore turbines should not be built within this zone. Dashed circles around each radar represent a 10-60 km radius “moderate impact zone”, where moderate-to-significant impacts to the radar are more likely to occur if turbines are built within this zone.
-
Shuniah radar visibility map
Ontario

Long description
Map is centered on the radar station near Shuniah, Ontario. Legend: The black dot indicates where the weather radar is located. Dark orange areas indicate locations where 150 metre (m) tall turbines are likely to be visible to the radars. Light orange areas indicate locations where 200 m tall turbines are likely to be visible to the radars. Yellow areas indicate locations where 250 m tall turbines are likely to be visible to the radars. Turbine heights are measured from tower base to blade tip and expressed in metres above ground level. Hatch-filled red circles around each radar represent a 10 kilometre (km) radius “definite impact zone”, where significant impacts to the radar are more likely to occur and therefore turbines should not be built within this zone. Dashed circles around each radar represent a 10-60 km radius “moderate impact zone”, where moderate-to-significant impacts to the radar are more likely to occur if turbines are built within this zone.
-
Smooth Rock Falls radar visibility map
Ontario

Long description
Map is centered on the radar station near Smooth Rock Falls, Ontario. Legend: The black dot indicates where the weather radar is located. Dark orange areas indicate locations where 150 metre (m) tall turbines are likely to be visible to the radars. Light orange areas indicate locations where 200 m tall turbines are likely to be visible to the radars. Yellow areas indicate locations where 250 m tall turbines are likely to be visible to the radars. Turbine heights are measured from tower base to blade tip and expressed in metres above ground level. Hatch-filled red circles around each radar represent a 10 kilometre (km) radius “definite impact zone”, where significant impacts to the radar are more likely to occur and therefore turbines should not be built within this zone. Dashed circles around each radar represent a 10-60 km radius “moderate impact zone”, where moderate-to-significant impacts to the radar are more likely to occur if turbines are built within this zone.
-
Blainville radar visibility map
Quebec

Long description
Map is centered on the radar station near Blainville, Québec. Legend: The black dot indicates where the weather radar is located. Dark orange areas indicate locations where 150 metre (m) tall turbines are likely to be visible to the radars. Light orange areas indicate locations where 200 m tall turbines are likely to be visible to the radars. Yellow areas indicate locations where 250 m tall turbines are likely to be visible to the radars. Turbine heights are measured from tower base to blade tip and expressed in metres above ground level. Hatch-filled red circles around each radar represent a 10 kilometre (km) radius “definite impact zone”, where significant impacts to the radar are more likely to occur and therefore turbines should not be built within this zone. Dashed circles around each radar represent a 10-60 km radius “moderate impact zone”, where moderate-to-significant impacts to the radar are more likely to occur if turbines are built within this zone.
-
Landrienne radar visibility map
Quebec

Long description
Map is centered on the radar station near Landrienne, Québec. Legend: The black dot indicates where the weather radar is located. Dark orange areas indicate locations where 150 metre (m) tall turbines are likely to be visible to the radars. Light orange areas indicate locations where 200 m tall turbines are likely to be visible to the radars. Yellow areas indicate locations where 250 m tall turbines are likely to be visible to the radars. Turbine heights are measured from tower base to blade tip and expressed in metres above ground level. Hatch-filled red circles around each radar represent a 10 kilometre (km) radius “definite impact zone”, where significant impacts to the radar are more likely to occur and therefore turbines should not be built within this zone. Dashed circles around each radar represent a 10-60 km radius “moderate impact zone”, where moderate-to-significant impacts to the radar are more likely to occur if turbines are built within this zone.
-
Mt. Apica radar visibility map
Quebec

Long description
Map is centered on the radar station near Mt. Apica, Québec. Legend: The black dot indicates where the weather radar is located. Dark orange areas indicate locations where 150 metre (m) tall turbines are likely to be visible to the radars. Light orange areas indicate locations where 200 m tall turbines are likely to be visible to the radars. Yellow areas indicate locations where 250 m tall turbines are likely to be visible to the radars. Turbine heights are measured from tower base to blade tip and expressed in metres above ground level. Hatch-filled red circles around each radar represent a 10 kilometre (km) radius “definite impact zone”, where significant impacts to the radar are more likely to occur and therefore turbines should not be built within this zone. Dashed circles around each radar represent a 10-60 km radius “moderate impact zone”, where moderate-to-significant impacts to the radar are more likely to occur if turbines are built within this zone.
-
Ste-Françoise radar visibility map
Quebec
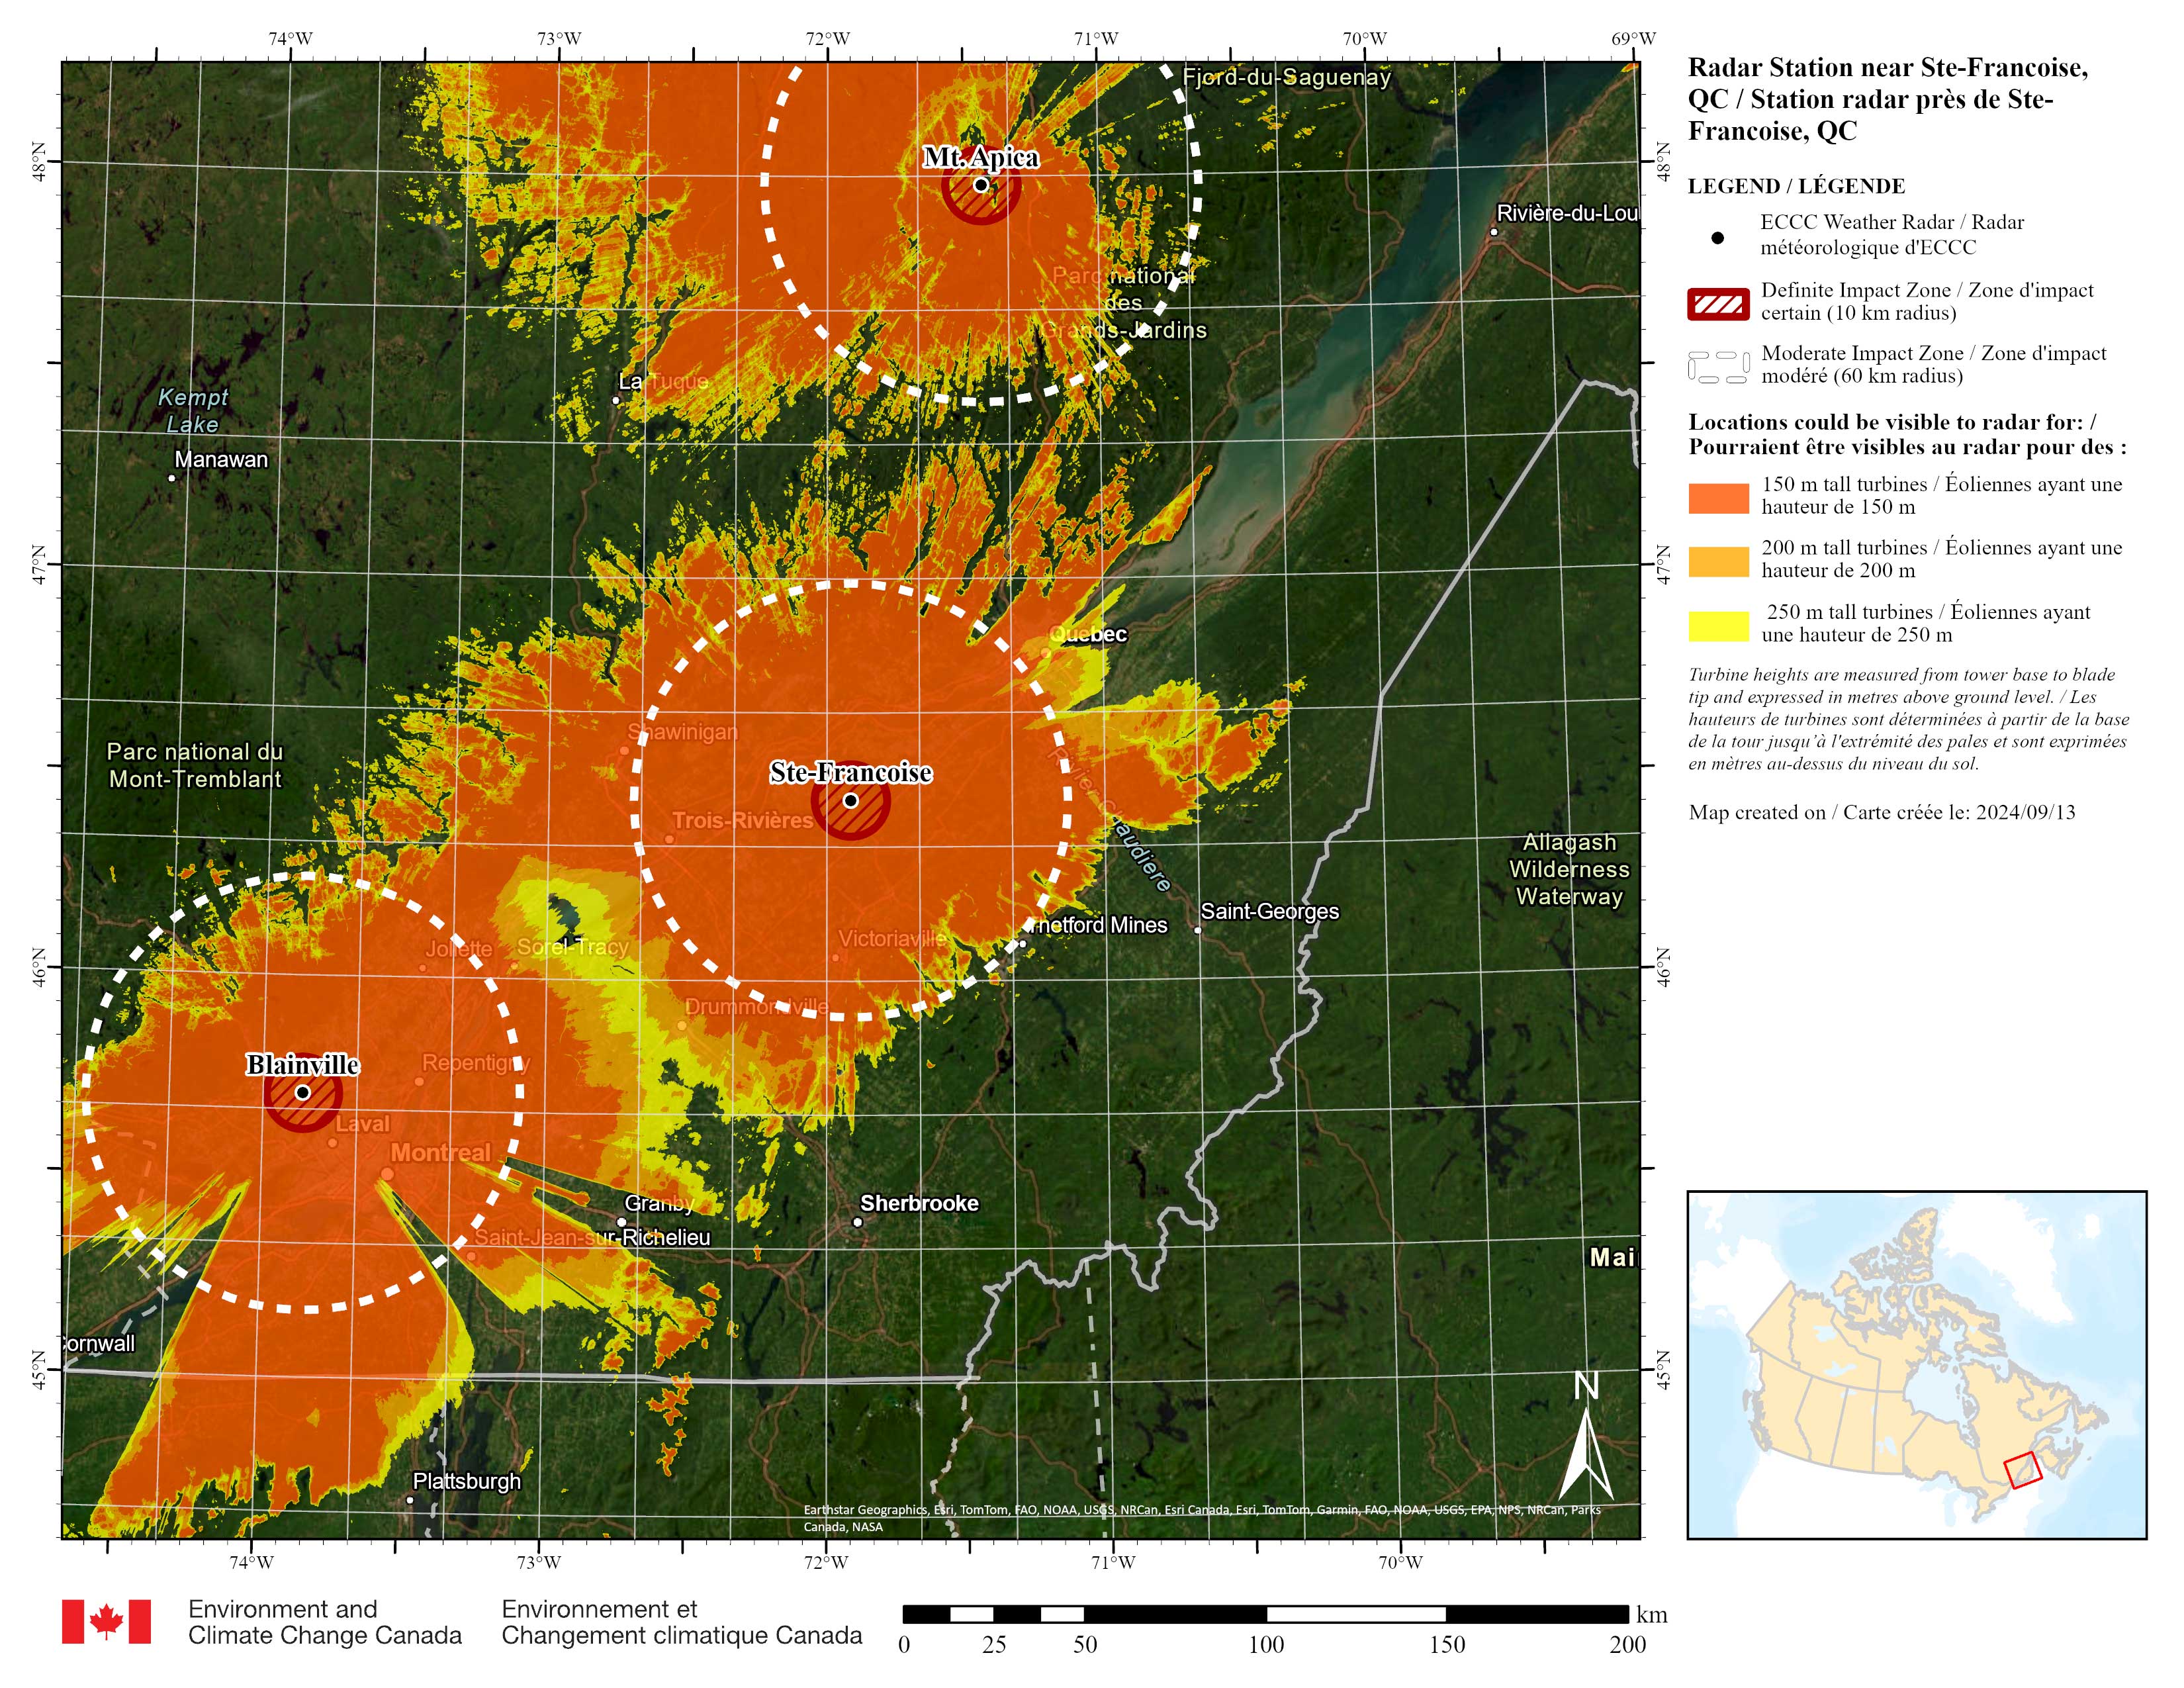
Long description
Map is centered on the radar station near Ste-Françoise, Québec. Legend: The black dot indicates where the weather radar is located. Dark orange areas indicate locations where 150 metre (m) tall turbines are likely to be visible to the radars. Light orange areas indicate locations where 200 m tall turbines are likely to be visible to the radars. Yellow areas indicate locations where 250 m tall turbines are likely to be visible to the radars. Turbine heights are measured from tower base to blade tip and expressed in metres above ground level. Hatch-filled red circles around each radar represent a 10 kilometre (km) radius “definite impact zone”, where significant impacts to the radar are more likely to occur and therefore turbines should not be built within this zone. Dashed circles around each radar represent a 10-60 km radius “moderate impact zone”, where moderate-to-significant impacts to the radar are more likely to occur if turbines are built within this zone.
-
Val d'Irène radar visibility map
Quebec

Long description
Map is centered on the radar station near Val d'Irène, Québec. Legend: The black dot indicates where the weather radar is located. Dark orange areas indicate locations where 150 metre (m) tall turbines are likely to be visible to the radars. Light orange areas indicate locations where 200 m tall turbines are likely to be visible to the radars. Yellow areas indicate locations where 250 m tall turbines are likely to be visible to the radars. Turbine heights are measured from tower base to blade tip and expressed in metres above ground level. Hatch-filled red circles around each radar represent a 10 kilometre (km) radius “definite impact zone”, where significant impacts to the radar are more likely to occur and therefore turbines should not be built within this zone. Dashed circles around each radar represent a 10-60 km radius “moderate impact zone”, where moderate-to-significant impacts to the radar are more likely to occur if turbines are built within this zone.
-
Chipman radar visibility map
New Brunswick
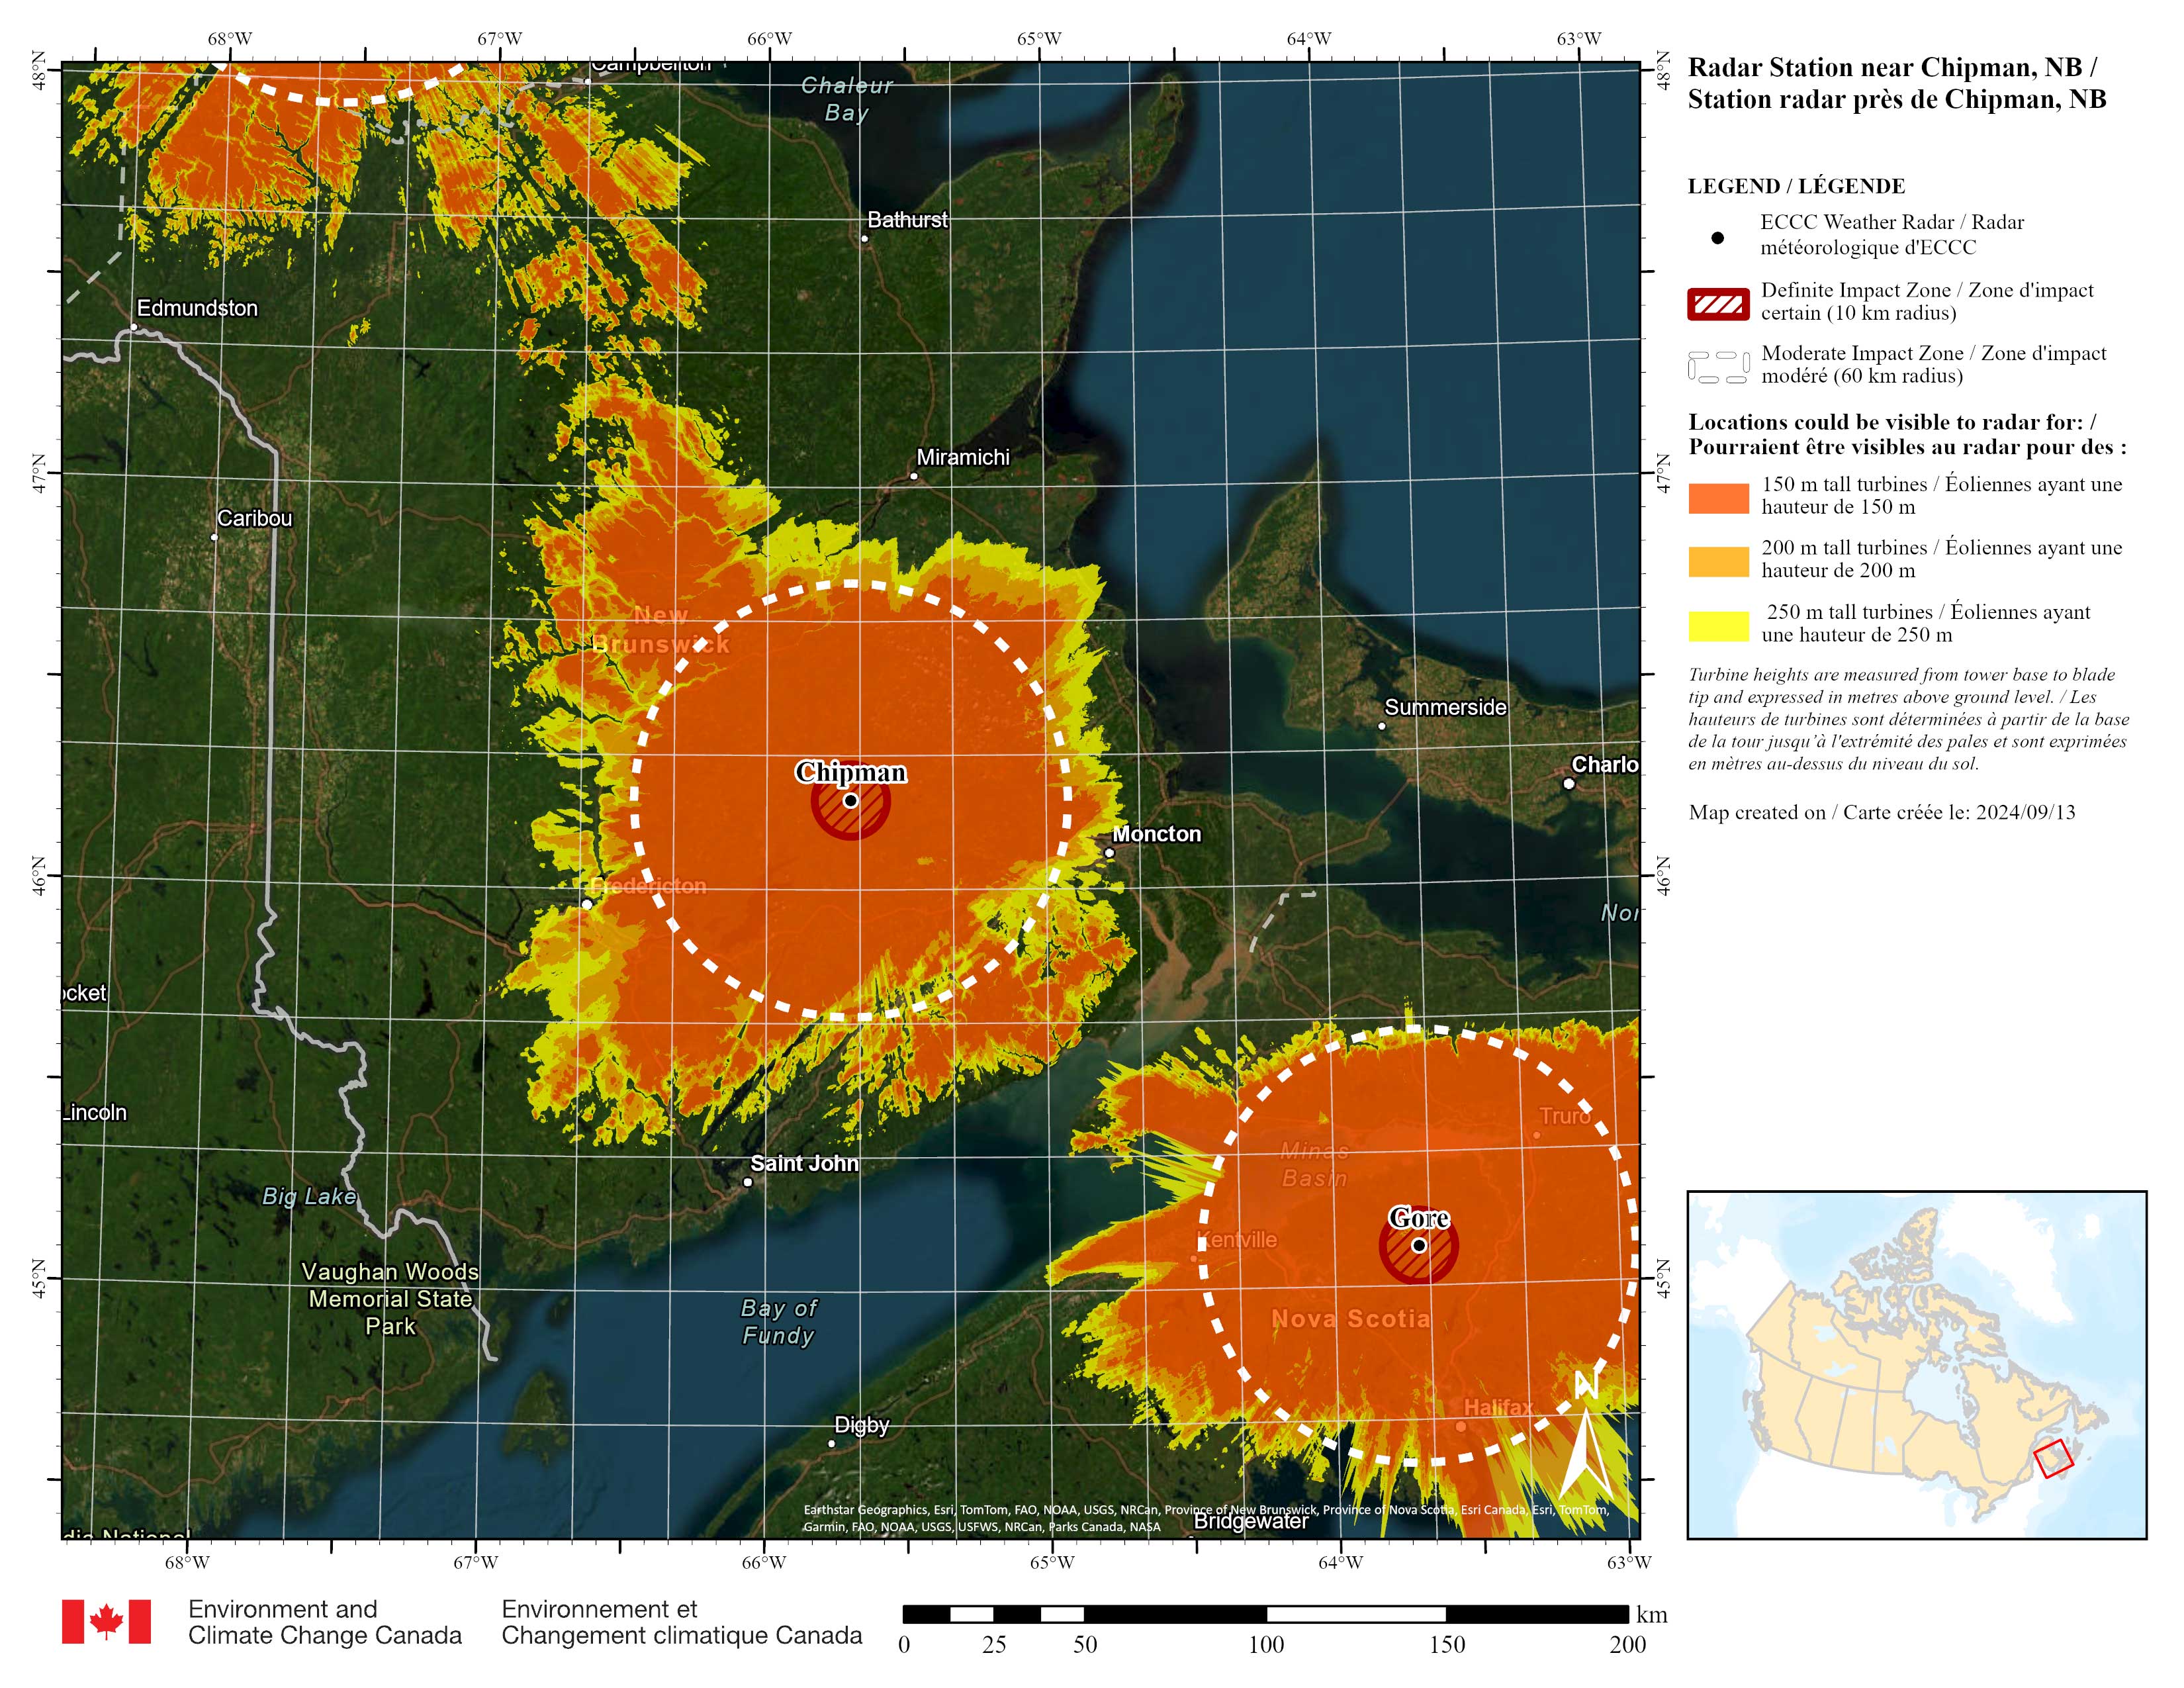
Long description
Map is centered on the radar station near Chipman, New Brunswick. Legend: The black dot indicates where the weather radar is located. Dark orange areas indicate locations where 150 metre (m) tall turbines are likely to be visible to the radars. Light orange areas indicate locations where 200 m tall turbines are likely to be visible to the radars. Yellow areas indicate locations where 250 m tall turbines are likely to be visible to the radars. Turbine heights are measured from tower base to blade tip and expressed in metres above ground level. Hatch-filled red circles around each radar represent a 10 kilometre (km) radius “definite impact zone”, where significant impacts to the radar are more likely to occur and therefore turbines should not be built within this zone. Dashed circles around each radar represent a 10-60 km radius “moderate impact zone”, where moderate-to-significant impacts to the radar are more likely to occur if turbines are built within this zone.
-
Gore radar visibility map
Nova Scotia

Long description
Map is centered on the radar station near Gore, Nova Scotia. Legend: The black dot indicates where the weather radar is located. Dark orange areas indicate locations where 150 metre (m) tall turbines are likely to be visible to the radars. Light orange areas indicate locations where 200 m tall turbines are likely to be visible to the radars. Yellow areas indicate locations where 250 m tall turbines are likely to be visible to the radars. Turbine heights are measured from tower base to blade tip and expressed in metres above ground level. Hatch-filled red circles around each radar represent a 10 kilometre (km) radius “definite impact zone”, where significant impacts to the radar are more likely to occur and therefore turbines should not be built within this zone. Dashed circles around each radar represent a 10-60 km radius “moderate impact zone”, where moderate-to-significant impacts to the radar are more likely to occur if turbines are built within this zone.
-
Marion Bridge radar visibility map
Nova Scotia

Long description
Map is centered on the radar station near Marion Bridge, Nova Scotia. Legend: The black dot indicates where the weather radar is located. Dark orange areas indicate locations where 150 metre (m) tall turbines are likely to be visible to the radars. Light orange areas indicate locations where 200 m tall turbines are likely to be visible to the radars. Yellow areas indicate locations where 250 m tall turbines are likely to be visible to the radars. Turbine heights are measured from tower base to blade tip and expressed in metres above ground level. Hatch-filled red circles around each radar represent a 10 kilometre (km) radius “definite impact zone”, where significant impacts to the radar are more likely to occur and therefore turbines should not be built within this zone. Dashed circles around each radar represent a 10-60 km radius “moderate impact zone”, where moderate-to-significant impacts to the radar are more likely to occur if turbines are built within this zone.
-
Marble Mountain radar visibility map
Newfoundland

Long description
Map is centered on the radar station near Marble Mountain, Newfoundland and Labrador. Legend: The black dot indicates where the weather radar is located. Dark orange areas indicate locations where 150 metre (m) tall turbines are likely to be visible to the radars. Light orange areas indicate locations where 200 m tall turbines are likely to be visible to the radars. Yellow areas indicate locations where 250 m tall turbines are likely to be visible to the radars. Turbine heights are measured from tower base to blade tip and expressed in metres above ground level. Hatch-filled red circles around each radar represent a 10 kilometre (km) radius “definite impact zone”, where significant impacts to the radar are more likely to occur and therefore turbines should not be built within this zone. Dashed circles around each radar represent a 10-60 km radius “moderate impact zone”, where moderate-to-significant impacts to the radar are more likely to occur if turbines are built within this zone.
-
Holyrood radar visibility map
Newfoundland
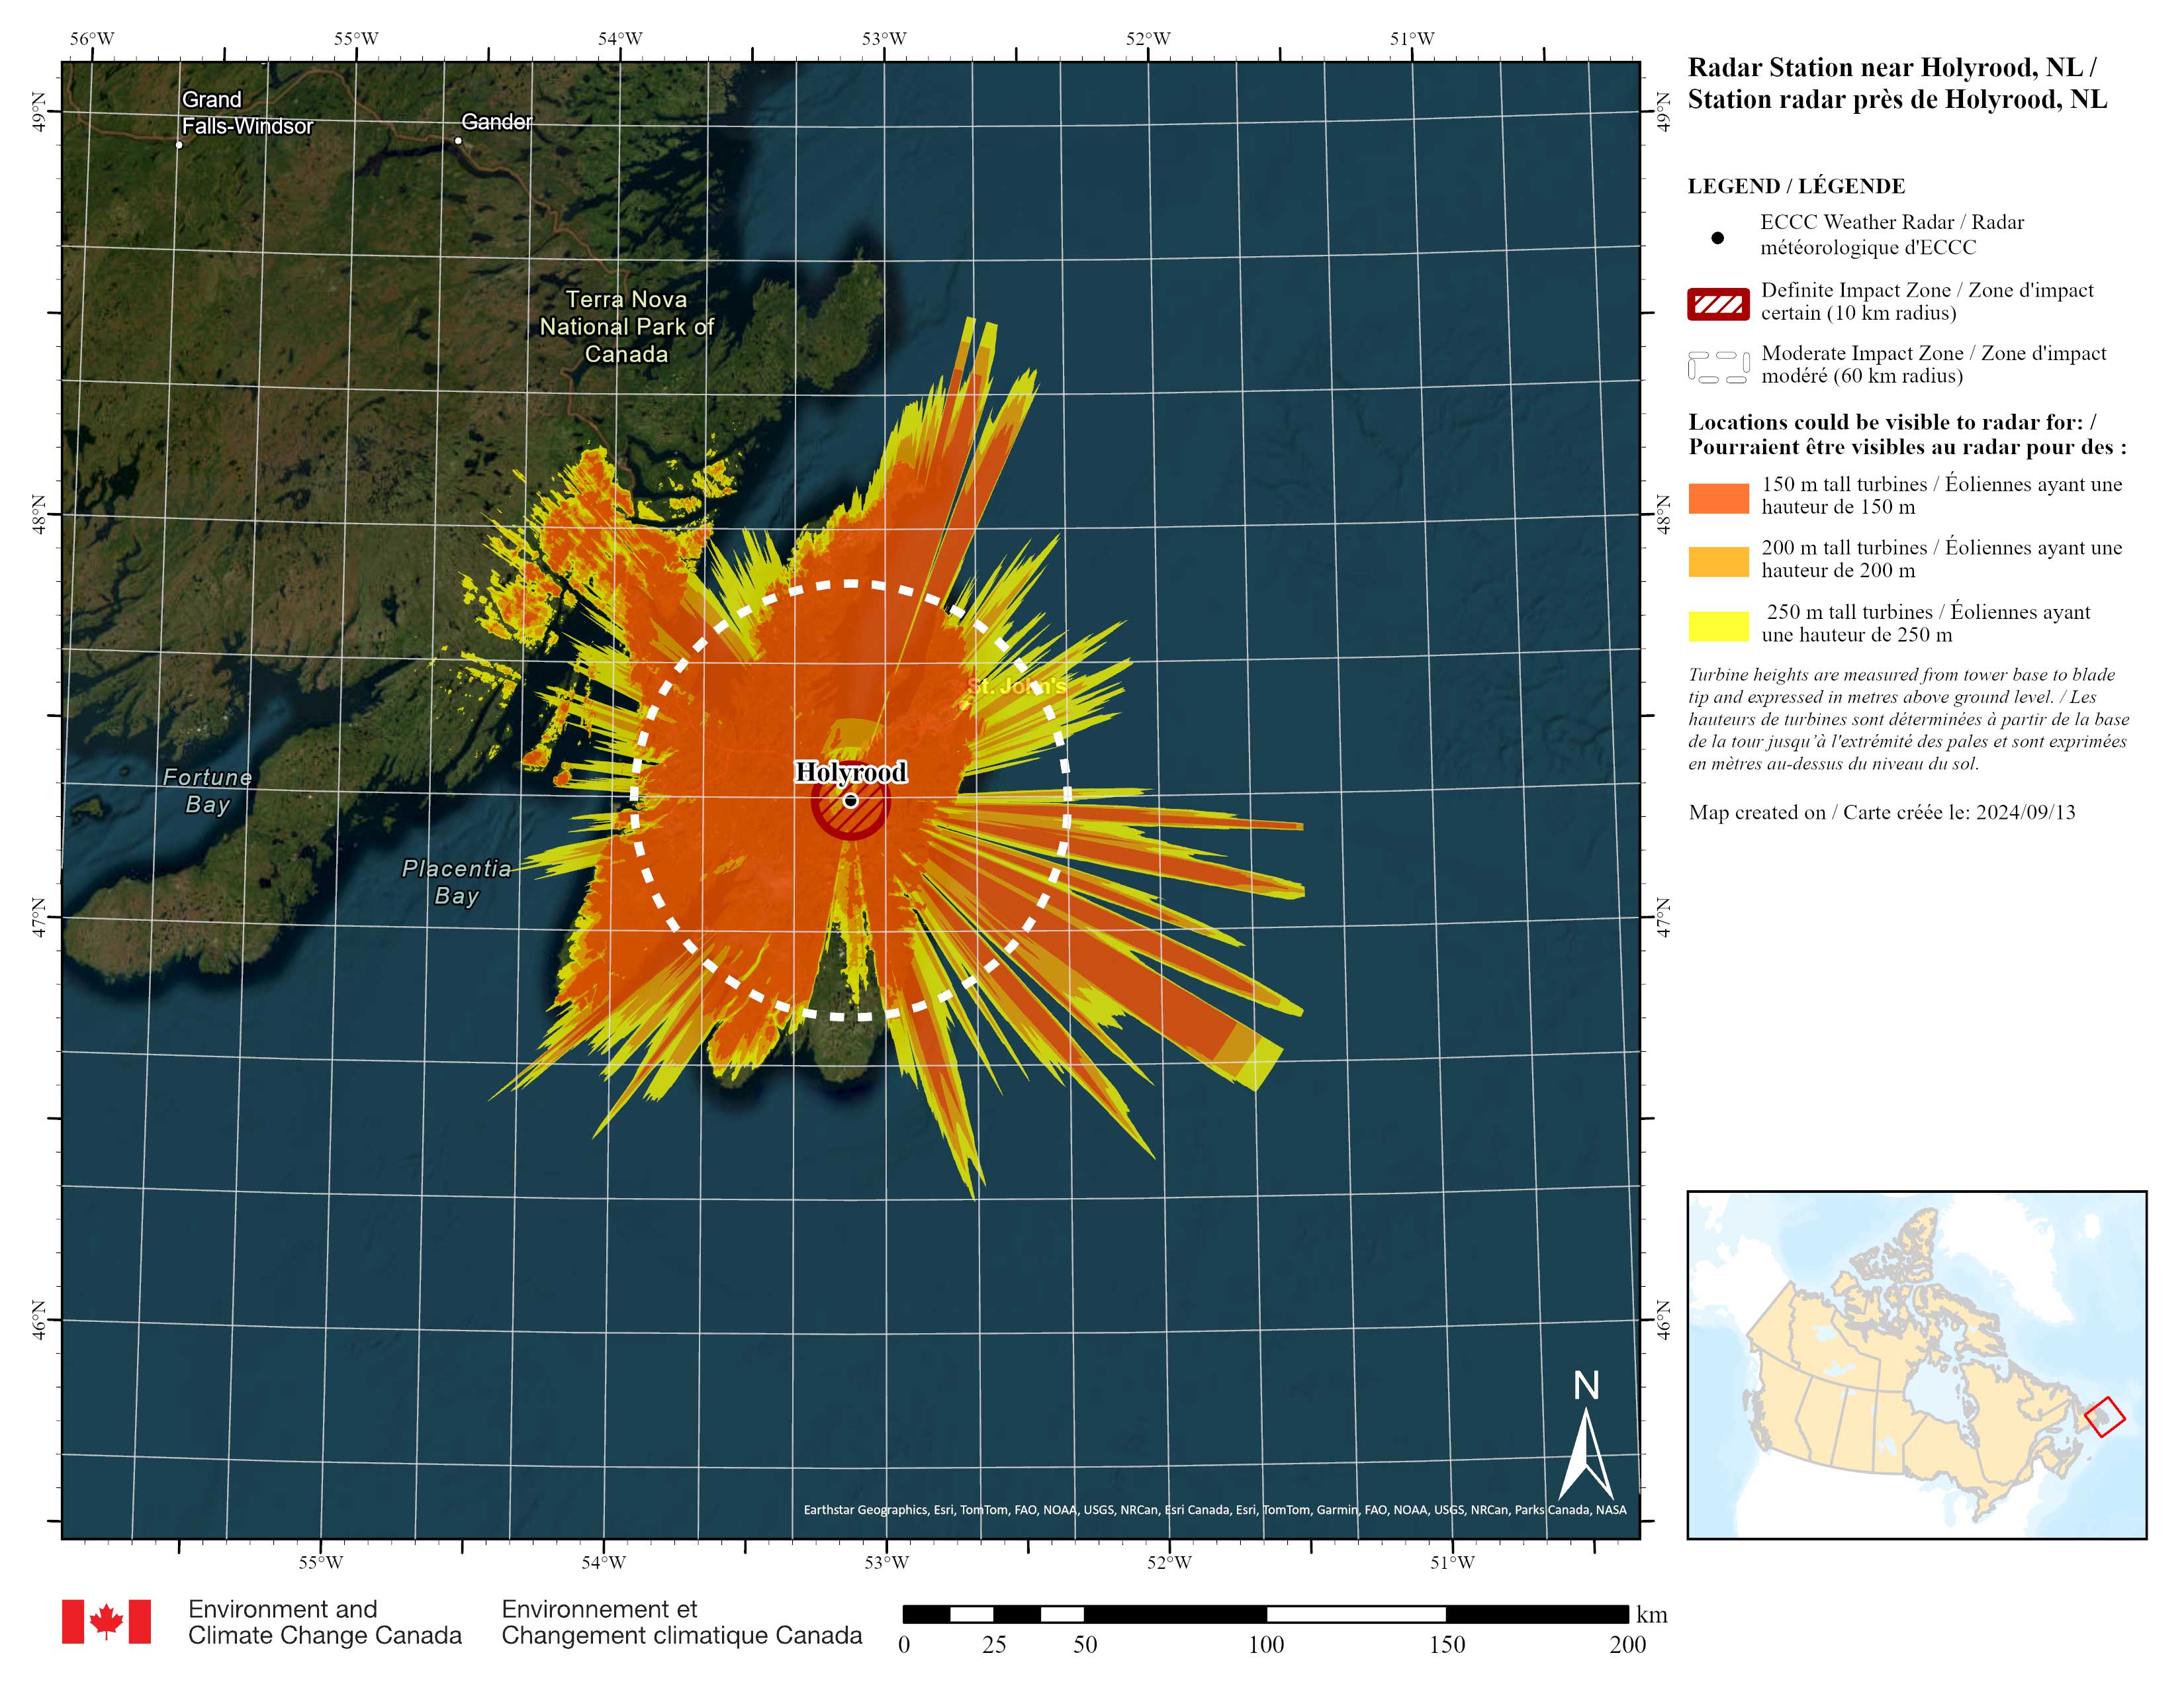
Long description
Map is centered on the radar station near Holyrood, Newfoundland and Labrador. Legend: The black dot indicates where the weather radar is located. Dark orange areas indicate locations where 150 metre (m) tall turbines are likely to be visible to the radars. Light orange areas indicate locations where 200 m tall turbines are likely to be visible to the radars. Yellow areas indicate locations where 250 m tall turbines are likely to be visible to the radars. Turbine heights are measured from tower base to blade tip and expressed in metres above ground level. Hatch-filled red circles around each radar represent a 10 kilometre (km) radius “definite impact zone”, where significant impacts to the radar are more likely to occur and therefore turbines should not be built within this zone. Dashed circles around each radar represent a 10-60 km radius “moderate impact zone”, where moderate-to-significant impacts to the radar are more likely to occur if turbines are built within this zone.
No item match this combination of filters.