
Canadian Protected Areas Status Report 2012 to 2015: chapter 5
Chapter 5: Federal, Provincial and Territorial Summaries
- Alberta
- British Columbia
- Manitoba
- New Brunswick
- Newfoundland and Labrador
- Northwest Territories
- Nova Scotia
- Nunavut
- Ontario
- Prince Edward Island
- Quebec
- Saskatchewan
- Yukon
- Environment and Climate Change Canada
- Fisheries and Oceans Canada
- Parks Canada Agency
This chapter presents an overview of protected areas according to the sixteen government protected areas organisations included in this report. At the national level and for each province and territory, a summary table provides information on terrestrial and marine protected areas (including marine portions of terrestrial protected areas) administered by each jurisdiction according to International Union for Conservation of Nature management categories. For each province and territory, a summary table provides information on the governance regime for all protected areas in the jurisdiction, whether they are governed by a provincial or territorial government, by a federal government agency or department, by a private or non-governmental organisation, by Indigenous Peoples or local communities or through shared governance. For each province, territory and federal protected area organisation, notable accomplishments made during this reporting period are highlighted. A map is also included for each province and territory showing all protected areas occurring in each as well as all protected areas at the national level for each federal organisation.
Alberta

In Alberta, at the end of 2015, terrestrial protected areas covered 83 141 km2or 12.6% of the provinceFootnote1. About one third of that area (27 422 km2) was protected by the province (Table 21). The remainder was made up of federal protected areas (Table 22).
| Biome | International Union for Conservation of Nature category | Number of protected areas | Area protected (km2) | Percent of total area protected by the province by biome |
|---|---|---|---|---|
| Terrestrial | Ia | 17 | 1 328 | 4.8% |
| Terrestrial | Ib | 28 | 20 874 | 76.1% |
| Terrestrial | II | 181 | 4 105 | 15.0% |
| Terrestrial | III | 14 | 77 | 0.3% |
| Terrestrial | IV | 14 | 1 039 | 3.8% |
| Marine | N/A | N/A | N/A | N/A |
| Governance type | Number of protected areas | Area protected (km2) | Percent of total area protected in the province of Alberta |
|---|---|---|---|
| Federal government | 11 | 54 632 | 66.6% |
| Provincial / territorial government | 254 | 27 422 | 33.4% |
| Shared governance | 0 | 0 | 0.0% |
| Private governance | 0 | 0 | 0.0% |
| Governance by Indigenous Peoples and local communities | 0 | 0 | 0.0% |
Most significant accomplishments by Alberta between 2012-2015:
A commitment was made to establish and add a further 13 784 km2 to Alberta's protected areas network. This will establish or enlarge 30 parks and protected areas through the Land Use Framework's Regional Planning Process in the Lower Athabasca Regional Plan and South Saskatchewan Regional Plan. These sites are reported to the Conservation Areas Reporting and Tracking System as “interim” until such a time that they are legally established.
The Alberta Government announced and committed to enhance protection of the Castle area in southwestern Alberta beyond the commitments made under the South Saskatchewan Regional Plan. This is a renowned area that is critical for biodiversity, headwaters, and species at risk in the Crown of the Continent.
Subsequent to a private land donation, Antelope Hill Provincial Park was established in the threatened and highly underrepresented northern fescue grasslands of Alberta.
Top five priorities for protected areas planning and management by Alberta over the next three to five years:
- Establishing new protected areas
- Planning the protected areas network
- Legislative/regulatory amendments or development
- Enhancing management in existing protected areas
- Collaboration with Indigenous governments or communities
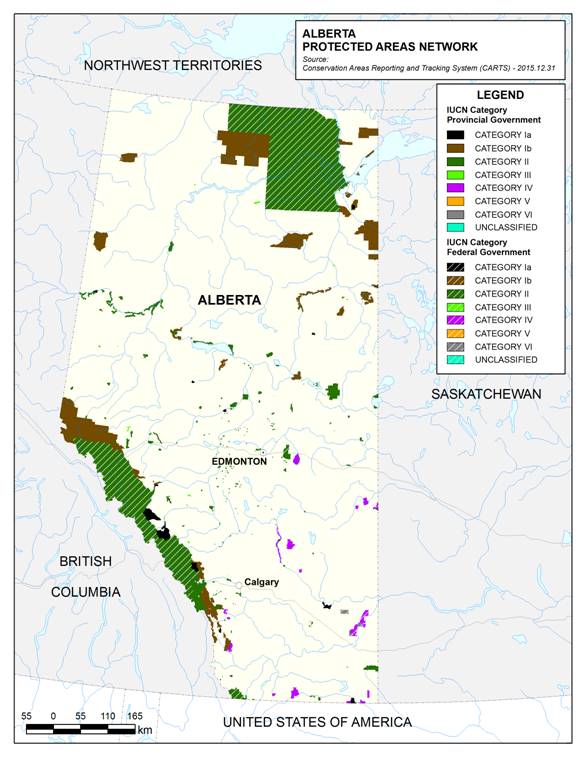
Long description for Map 4
The map depicts the Alberta protected areas network. The entire province of Alberta as well as small surrounding portions of British Columbia, Northwest Territories, Saskatchewan and the United States of America are shown. Two cities, Edmonton and Calgary, are also shown on the map. The protected areas shown on the map are categorised as either provincial or federal and then further subdivided into eight International Union for the Conservation of Nature categories. These include: category Ia, category Ib, category II, category III, category IV, category V, category VI and unclassified. Source:Conservation Areas Reporting and Tracking System (CARTS) - 2015.12.31. The scale on the map is in tens of kilometers.
British Columbia

In British Columbia, at the end of 2015, terrestrial protected areas covered 144 813 km2or 15.3% of the provinceFootnote 2. Nearly all of that area (138 075 km2) was protected by the province (Table 23). The remainder was made up of federal protected areas (Table 24). Marine protected areas covered 8 353 km2. The Province of British Columbia administered 4 648 km2 and the remainder was administered by the federal government.
| Biome | International Union for Conservation of Nature category | Number of protected areas | Area protected (km2) | Percent of total area protected the province by biome |
|---|---|---|---|---|
| Terrestrial | Ia | 147 | 1 067 | 0.8% |
| Terrestrial | Ib | 44 | 58 627 | 42.5% |
| Terrestrial | II | 728 | 75 316 | 54.5% |
| Terrestrial | III | 106 | 501 | 0.4% |
| Terrestrial | IV | 28 | 2 287 | 1.7% |
| Terrestrial | VI | 2 | 277 | 0.2% |
| Marine | Ia | 22 | 515 | 11.1% |
| Marine | Ib | 8 | 140 | 3.0% |
| Marine | II | 141 | 3 648 | 78.5% |
| Marine | III | 13 | 42 | 0.9% |
| Marine | IV | 8 | 304 | 6.5% |
| Governance type | Number of protected areas | Area protected (km2) | Percent of total area protected in the province of British Columbia |
|---|---|---|---|
| Federal government | 14 | 9 881 | 6.5% |
| Provincial / territorial government | 1 057 | 142 723 | 93.5% |
| Shared governance | 0 | 0 | 0.0% |
| Private governance | 0 | 0 | 0.0% |
| Governance by Indigenous Peoples and local communities | 0 | 0 | 0.0% |
Most significant accomplishments by British Columbia, 2012-2015:
- The protected areas network in British Columbia was expanded by 2 798 km2 through land use planning processes and land acquisitions; adding lands for conservation and recreation. This includes some very large new protected areas such as Ne’ah’ Conservancy which is 2 333 km2. This also includes marine foreshore additions of 1 535 km2 to nine Haida Gwaii conservancies and 227 km2 to four conservancies on the Central Coast.
- Two new important policy documents were developed to assist in the management of protected areas in British Columbia:
- The Strategic Management Planning Policy for Ecological Reserves, Parks, Conservancies, Protected Areas and Recreation Areas (July 2013). This document outlines the key strategic level components of the British Columbia management planning program and creates a policy requirement to prepare (and keep current) a management plan for every protected area in the BC Parks’ system.
- The BC Parks Conservation Policy, first released in September 1997, was updated and implemented in September 2014. This document provides the current policy statements that direct the day-to-day and long-term actions under which BC Parks manages natural and cultural values within British Columbia’s system of protected areas.
- BC Parks initiated a Long-term Ecological Monitoring Program within the protected areas system. At the end of 2015, there were 68 sites established with an additional 30 expected in the next few years. These sites are distributed throughout the protected areas system in five ecosystem types: alpine, forest, wetland, grassland and intertidal.
Top five priorities for protected areas planning and management by British Columbia over the next three to five years:
- Enhancing management in existing protected areas
- Increasing visitation
- Evaluating the protected areas programs
- Collaboration with Indigenous governments or communities
- Integrating the protected areas network into broader landscapes or seascapes
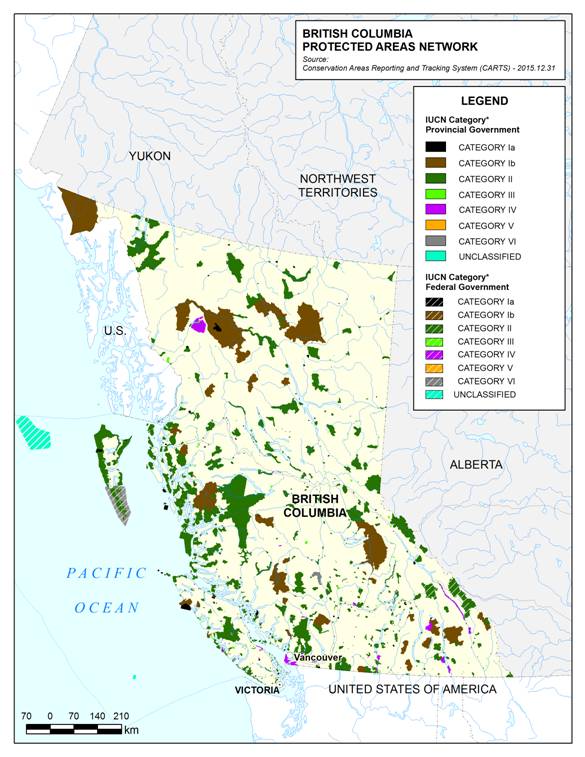
Long description for Map 5
The map depicts the British Columbia protected areas network. The entire province of British Columbia, as well as small surrounding portions of Yukon, Northwest Territories, Alberta, the United States of America and the Pacific Ocean are shown. Two cities, Vancouver and Victoria, are also shown on the map. The protected areas shown on the map are categorised as either provincial or federal and then further subdivided into eight International Union for the Conservation of Nature categories. These include: category Ia, category Ib, category II, category III, category IV, category V, category VI and unclassified. Source:Conservation Areas Reporting and Tracking System (CARTS) - 2015.12.31. The scale on the map is in tens of kilometers.
Manitoba

In Manitoba, at the end of 2015, terrestrial protected areas covered 71 153 km2 or 10.9% of the provinceFootnote3. Over three quarters of that area (57 293 km2) was protected by the province or through a shared governance regime (Table 25). The remainder was made up of federal protected areas and private conservation areas (Table 26). Marine protected areas covered 896 km2.The province of Manitoba administered 80 km2 and the remainder was administered by the federal government.
| Biome | International Union for Conservation of Nature category | Number of protected areas | Area protected (km2) | Percent of total protected area under provincial or shared governance by biome |
|---|---|---|---|---|
| Terrestrial | Ia | 29 | 457 | 0.8% |
| Terrestrial | Ib | 9 | 29 679 | 51.8% |
| Terrestrial | II | 27 | 25 568 | 44.7% |
| Terrestrial | III | 29 | 576 | 1.0% |
| Terrestrial | IV | 37 | 962 | 1.7% |
| Terrestrial | V | 6 | 12 | <0.1% |
| Marine | II | 1 | 82 | 100.0% |
| Governance type | Number of protected areas | Area protected (km2) | Percent of total area protected in the province of Manitoba |
|---|---|---|---|
| Federal government | 4z | 14 443 | 20.2% |
| Provincial / territorial government | 123 | 44 238 | 61.5% |
| Shared governance | 4 | 13 097 | 18.2% |
| Private governance | 184 | 102 | 0.1% |
| Governance by Indigenous Peoples and local communities | 0 | 0 | 0.0% |
z Two of these federal protected areas are National Wildlife Areas administered by Environment and Climate Change Canada (International Union for Conservation of Nature category IV). Manitoba does not currently recognize these two sites as part of its protected areas network.
Most significant accomplishments by Manitoba between 2012-2015:
- Places to Keep: Manitoba’s Protected Areas Strategy was released in November, 2015. This consultation document seeks the public’s input on the goal to increase the protected areas in Manitoba from the current 11% of the province to 17% of the province by 2020.
- Manitoba created a new park classification and a new land use category under The Provincial Parks Act (October 2014) as tools to provide recognition of the Indigenous value of the areas.
- The Indigenous Traditional Use park classification allows for the preservation of lands that have been traditionally used by Indigenous Peoples and that are significant to Indigenous Peoples because of their natural features or cultural importance. Chitek Lake Anishinaabe Provincial Park was the first park in Manitoba to be designated with the new park classification.
- The Indigenous Heritage Land Use Category can be used to designate lands within a provincial park to protect a unique or representative site containing a resource of cultural, spiritual or heritage significance to Indigenous Peoples.
- The 1 137 km2 Red Deer Wildlife Management Area was designated in November, 2015. This new Wildlife Management Area protects 900 km2 of relatively pristine wetland landscape, including globally rare inland salt flats supporting rare plants, marine invertebrates, and salt-loving bacteria.
Top five priorities for protected areas planning and management by Manitoba over the next three to five years:
- Establishing new protected areas
- Meeting protected areas target
- Collaboration with Indigenous governments, Peoples or communities
- Collaboration with the private sector
- Focusing on areas of particular importance for biodiversity
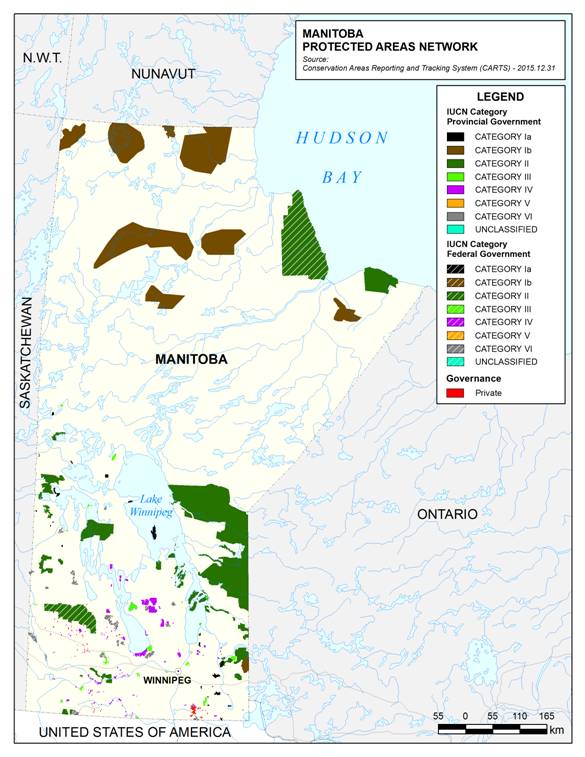
Long description for Map 6
The map depicts the Manitoba protected areas network. The entire province of Manitoba, as well as small portions of Saskatchewan, Northwest Territories, Nunavut, Ontario, the United States of America and Hudson Bay are shown. The city of Winnipeg and Lake Winnipeg are also marked. The protected areas shown on the map are categorised as either provincial, federal or private, and then further subdivided into eight International Union for the Conservation of Nature categories. These include: category Ia, category Ib, category II, category III, category IV, category V, category VI and unclassified. Source: Conservation Areas Reporting and Tracking System (CARTS) - 2015.12.31. The scale on the map is in tens of kilometers.
New Brunswick

In New Brunswick, at the end of 2015, terrestrial protected areas covered 3 378 km2 or 4.6% of the provinceFootnote5. The vast majority this area (2 903 km2) was protected by the province (Table 27). The remainder was made up of federal protected areas and private conservation areas (Table 28). Marine protected areas covered 65 km2. The province of New Brunswick administered approximately 1 km2 and the remainder was administered by the federal government and one private conservation area.
| Biome | International Union for Conservation of Nature category | Number of protected areas | Area protected (km2) | Percent of total area protected by the province by biome |
|---|---|---|---|---|
| Terrestrial | Ia | 6 | 11 | 0.4% |
| Terrestrial | Ib | 84 | 209 | 7.2% |
| Terrestrial | II | 122 | 2683 | 92.4% |
| Marine | Ib | 4 | 0.8 | 56.4% |
| Marine | II | 7 | 0.2 | 43.6% |
| Governance type | Number of protected areas | Area protected (km2) | Percent of total area protected in the province of New Brunswick |
|---|---|---|---|
| Federal government | 9 | 525 | 15.2% |
| Provincial / territorial government | 206 | 2 905 | 84.2% |
| Shared governance | 0 | 0 | 0.0% |
| Private governance | 6 | 19 | 0.5% |
| Governance by Indigenous Peoples and local communities | 0 | 0 | 0.0% |
Most significant accomplishments by New Brunswick, 2012-2015:
- The addition of 1 145 km2 of Crown land was designated as Protected Natural Area in 2014. This was accomplished by increasing the size of 22 sites and by designating 142 new sites.
- An additional 10.5 km2 of private land was also designated as Protected Natural Area in 2014. This was added by increasing the size of one site and designating five new sites.
- The Parks Act was revised in 2014. It now includes a requirement for resource management plans for provincial parks and it provides the authority to create an advisory committee including First Nations members.
Top five priorities for protected areas planning and management by New Brunswick over the next three to five years:
- Developing or updating management plans
- Identifying threats to ecological health or integrity of protected areas
- Furthering education and outreach
- Collaborating with non-governmental conservation organizations
- Improving monitoring and management of infrastructure
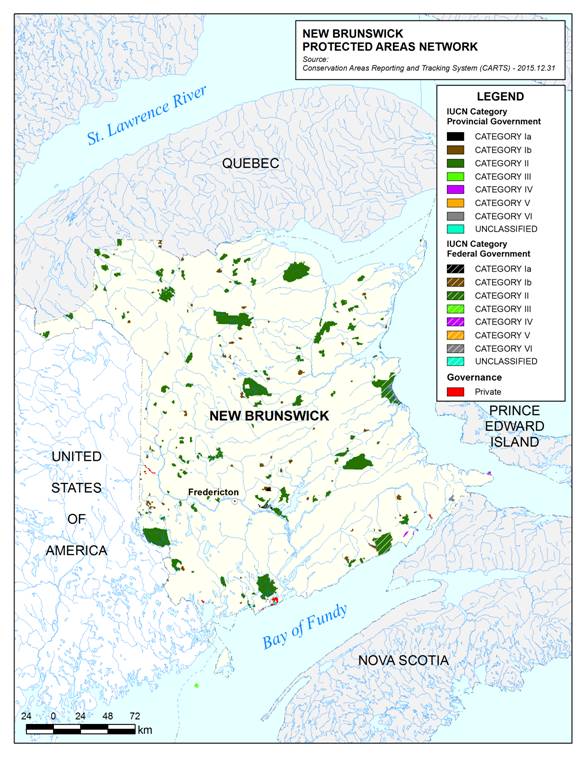
Long description for Map 7
The map depicts the New Brunswick protected areas network. The entire province of New Brunswick as well as small portions of Quebec, Prince Edward Island, Nova Scotia, the United States of America, the St. Lawrence River and the Bay of Fundy are shown. The city of Fredricton is also marked. The protected areas shown on the map are categorised as either provincial, federal or Private. The provincial and federal protected areas are further subdivided into eight International Union for the Conservation of Nature categories. These include: category Ia, category Ib, category II, category III, category IV, category V, category VI and unclassified. Source: Conservation Areas Reporting and Tracking System (CARTS) - 2015.12.31. The scale on the map is in tens of kilometers.
Newfoundland and Labrador

In Newfoundland and Labrador, at the end of 2015, terrestrial protected areas covered 29 420 km2 or 7.3% of the provinceFootnote6. Nearly one quarter of this area (6 630 km2) was protected by the province (Table 29). The remainder was made up of federal protected areas (Table 30). Marine protected areas covered 233 km2. The province of Newfoundland and Labrador administered 156 km2 and the remainder was administered by the federal government.
| Biome | International Union for Conservation of Nature category | Number of protected areas | Area protected (km2) | Percent of total protected area under provincial administration by biome |
|---|---|---|---|---|
| Terrestrial | Ia | 3 | 7 | 0.1% |
| Terrestrial | Ib | 2 | 3 965 | 59.8% |
| Terrestrial | II | 40 | 1 230 | 18.6% |
| Terrestrial | III | 6 | 3 | <0.1% |
| Terrestrial | VI | 6 | 1 424 | 21.5% |
| Marine | VI | 7 | 156 | 100.0% |
| Governance type | Number of protected areas | Area protected (km2) | Percent of total area protected in the province of Newfoundland and Labrador |
|---|---|---|---|
| Federal government | 9 | 22 681 | 77.0% |
| Provincial / territorial government | 57 | 6 785 | 23.0% |
| Shared governance | 0 | 0 | 0.0% |
| Private governance | 0 | 0 | 0.0% |
| Governance by Indigenous Peoples and local communities | 0 | 0 | 0.0% |
Most significant accomplishments by Newfoundland and Labrador, 2012-2015:
- A new national park reserve was established in collaboration with Parks Canada in the Mealy Mountains area of Labrador in 2015. The park reserve protects roughly 10 700 km2, which is the largest national park in eastern Canada. Establishment was a multi-year joint effort undertaking by Parks Canada and the Government of Newfoundland and Labrador to refine, define and mark the boundary and develop an approach for addressing existing uses by Indigenous groups and local Labrador residents.
- Two ecological reserves were established under the Wilderness and Ecological Reserves Act: Sandy Cove Ecological Reserve (botanical reserve) in 2013 and Lawn Bay Ecological Reserve (seabird reserve) in 2015. Sandy Cove Ecological Reserve protects an endangered plant species, Long’s Braya (Braya longii), endemic to the limestone barrens on the Great Northern Peninsula of Newfoundland. The Reserve is globally significant because it contains 95% of the world’s population of Long’s Braya occurring on undisturbed habitat. Lawn Bay Ecological Reserve, off the Burin Peninsula along the southern coast of Newfoundland, contains the only known breeding colony of Manx Shearwater (Puffinus puffinus) in North America. The islands in the Reserve also support a significant population of Leach’s Storm-Petrel (Oceanodroma leucorhoa) and smaller numbers of other breeding seabirds.
- Through a partnership with a local community group from Portugal Cove South, on the Avalon Peninsula of Newfoundland and Labrador, the provincial Department of Environment and Conservation submitted a nomination to the United Nations Educational, Scientific and Cultural Organization World Heritage Committee to inscribe Mistaken Point Ecological Reserve as a World Heritage Site. The process of developing the nomination created a strong management framework for the property with a jointly developed management plan, new management structure, long-term monitoring protocols and strong community support.
Top five priorities for protected areas planning and management by Newfoundland and Labrador over the next three to five years:
- Identifying priority areas for protection
- Establishing new protected areas
- Meeting protected areas targets
- Enhancing management in existing protected areas
- Furthering education and outreach
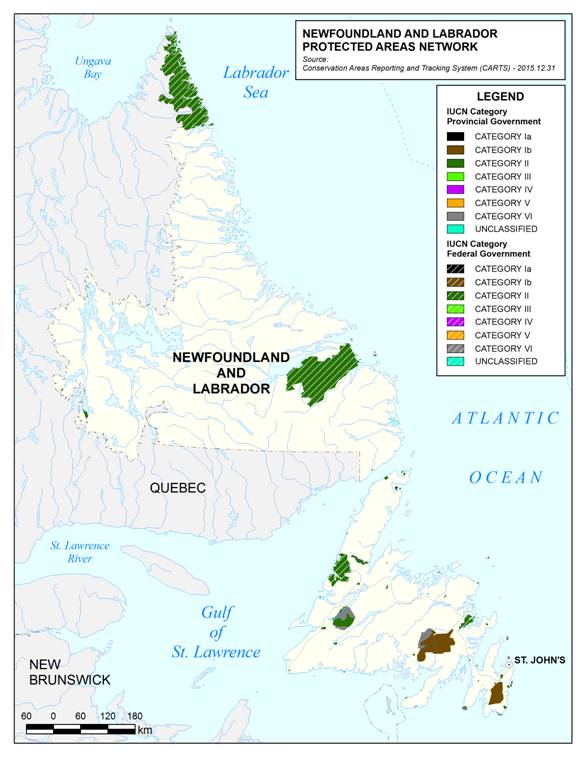
Long description for Map 8
The map depicts the Newfoundland and Labrador protected areas network. The entire province of Newfoundland and Labrador as well as a portion of Quebec, New Brunswick, Ungava Bay, Labrador Sea, St. Lawrence River, Gulf of St. Lawrence and the Atlantic Ocean are shown. The city of St. John's is also marked. The protected areas shown on the map are categorised as either provincial or federal and are further subdivided into eight International Union for the Conservation of Nature categories. These include: category Ia, category Ib, category II, category III, category IV, category V, category VI and unclassified. Source: Conservation Areas Reporting and Tracking System (CARTS) - 2015.12.31. The scale on the map is in tens of kilometers.
Northwest Territories

In Northwest Territories, at the end of 2015, terrestrial protected areas covered 125 646 km2 or 9.3% of the territoryFootnote7. Nearly one fifth of this area (22 917 km2) was protected by the territory or through a shared governance regime (Table 31). The remainder was made up of federal protected areas and one protected area under Indigenous governance (Table 32). Marine protected areas covered 2 960 km2, administered by the federal government.
| Biome | International Union for Conservation of Nature category | Number of protected areas | Area protected (km2) | Percent of total protected area under territorial or shared governance by biome |
|---|---|---|---|---|
| Terrestrial | Ib | 4 | 22 917 | 100.0% |
| Marine | N/A | N/A | N/A | N/A |
| Governance type | Number of protected areas | Area protected (km2) | Percent of total area protected in the territory of Northwest Territories |
|---|---|---|---|
| Federal government | 12 | 103 692 | 81.3% |
| Provincial / territorial government | 1 | 21 270 | 16.7% |
| Shared governance | 2 | 1 648 | 1.3% |
| Private governance | 0 | 0 | 0.0% |
| Governance by Indigenous Peoples and local communities | 1 | 977 | 0.8% |
Most significant accomplishments by Northwest Territories, 2012-2015:
- The Tlicho Land Use Plan was released in 2013, creating the newest protected area in the Northwest Territories, Wehexlaxodıale; a land use exclusion zone.
- The Land Use and Sustainability Framework was released in 2014. This framework is a guiding document for the government of the Northwest Territories on taking over the management of land, water, and resources in the Northwest Territories public interest from the federal government post-devolution (April 1, 2014).
Top five priorities for protected areas planning and management by Northwest Territories over the next three to five years:
- Establishing new protected areas
- Planning the protected areas network
- Legislative/regulatory amendments or development
- Collaboration with Indigenous governments or communities
- Determining conservation network planning priorities for the next five years
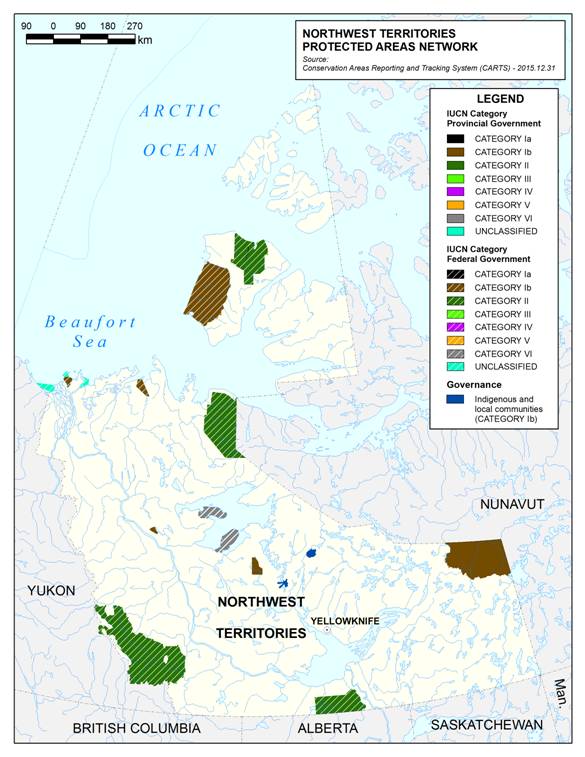
Long description for Map 9
The map depicts the Northwest Territories protected areas network. The entire province of Northwest Territories as well as a portion of Yukon, British Columbia, Alberta, Saskatchewan, Manitoba, Nunavut, the Beaufort Sea, and the Arctic Ocean are shown. The city of Yellowknife is also marked. The protected areas shown on the map are categorised as either Indigenous and local communities, federal or territorial The territorial and federal protected areas are further subdivided into eight International Union for the Conservation of Nature categories. These include: category Ia, category Ib, category II, category III, category IV, category V, category VI and unclassified. Source: Conservation Areas Reporting and Tracking System (CARTS) - 2015.12.31. The scale on the map is in tens of kilometers.
Nova Scotia

In Nova Scotia, at the end of 2015, terrestrial protected areas covered 5 366 km2 or 9.7%Footnote8 of the provinceFootnote9. About three quarters of this area (3 963 km2) was protected by the province or through a shared governance regime (Table 33). The remainder was made up of federal protected areas (Table 34). Marine protected areas covered 22 km2, administered by the federal government.
| Biome | International Union for Conservation of Nature category | Number of protected areas | Area protected (km2) | Percent of total protected area under provincial or shared governance by biome |
|---|---|---|---|---|
| Terrestrial | Ia | 40 | 206 | 5.2% |
| Terrestrial | Ib | 34 | 3 263 | 82.3% |
| Terrestrial | II | 2 | 269 | 6.8% |
| Terrestrial | III | 8 | 72 | 1.8% |
| Terrestrial | IV | 35 | 154 | 3.9% |
| Marine | N/A | N/A | N/A | N/A |
| Governance type | Number of protected areas | Area protected (km2) | Percent of total area protected in the province of Nova Scotia |
|---|---|---|---|
| Federal government | 16 | 1 453 | 26.8% |
| Provincial / territorial government | 115 | 3 916 | 72.3% |
| Shared governance | 5 | 47 | 0.9% |
| Private governance | 0 | 0 | 0.0% |
| Governance by Indigenous Peoples and local communities | 0 | 0 | 0.0% |
Most significant accomplishments by Nova Scotia, 2012-2015:
- "Our Parks and Protected Areas - A Plan for Nova Scotia" was released in August 2013, capping a planning process that began in 2005.By the end of 2015, 9.7%8 of Nova Scotia’s landmass was protected, with an additional 2.4% designated by Order in Council and protected on an interim basis until final survey plans are prepared. A commitment to achieve 13% protection was re-stated in December 2015 by way of mandate letters from the Premier to the Ministers of Environment and Natural Resources
Top five priorities for protected areas planning and management by Nova Scotia over the next three to five years:
- Meeting protected areas targets
- Legislative/regulatory amendments or development
- Identifying threats to ecological health or integrity of protected areas
- Furthering education and outreach
- Developing a Protected Areas Management Planning Framework
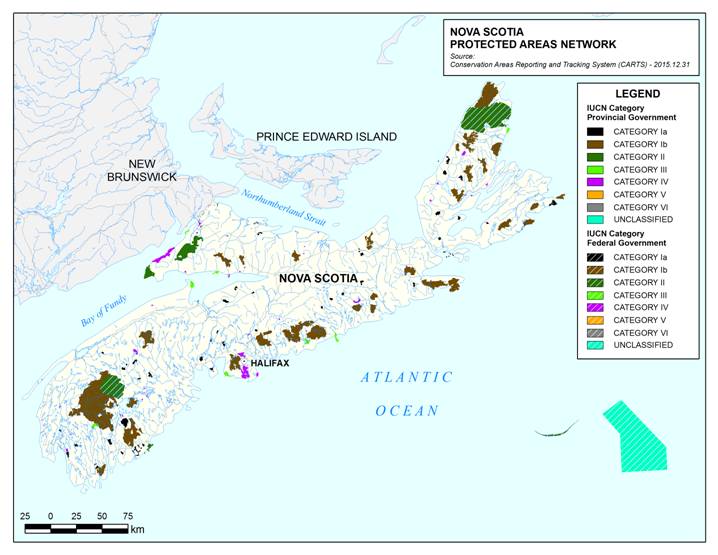
Long description for Map 10
The map depicts the Nova Scotia protected areas network. The entire province of Nova Scotia as well as a portion of New Brunswick, Prince Edward Island, Bay of Fundy, Northumberland Strait, and the Atlantic Ocean are shown. The city of Halifax is also marked. The protected areas shown on the map are categorised as either provincial or federal and are further subdivided into eight International Union for the Conservation of Nature categories. These include: category Ia, category Ib, category II, category III, category IV, category V, category VI and unclassified. Source: Conservation Areas Reporting and Tracking System (CARTS) - 2015.12.31. The scale on the map is in tens of kilometers.
Nunavut

In Nunavut, at the end of 2015, terrestrial protected areas covered 211 996 km2 km2 or 10.1% of the territoryFootnote10. A small proportion of this area (1 590 km2) was protected by the territory or through a shared governance regime (Table 35). The remainder was made up of federal protected areas (Table 36). Marine protected areas covered 24 655 km2, administered by the federal government.
| Biome | International Union for Conservation of Nature category | Number of protected areas | Area protected (km2) | Percent of total protected area under territorial or shared administration by biome |
|---|---|---|---|---|
| Terrestrial | II | 1 | 1 462 | 92.0% |
| Terrestrial | V | 7 | 128 | 8.1% |
| Marine | N/A | N/A | N/A | N/A |
| Governance type | Number of protected areas | Area protected (km2) | Percent of total area protected in the territory of Nunavut |
|---|---|---|---|
| Federal government | 20 | 242 927 | 99.3% |
| Provincial / territorial government | 7 | 128 | 0.1% |
| Shared governance | 1 | 1 462 | 0.6% |
| Private governance | 0 | 0 | 0.0% |
| Governance by Indigenous Peoples and local communities | 0 | 0 | 0.0% |
Most significant accomplishments by Nunavut, 2012-2015:
- New regulations under the Nunavut Wildlife Act were developed.
- A draft of the Nunavut Land Use Plan was developed by the Nunavut Planning Commission in consultation with the Government of Canada, Government of Nunavut, Inuit associations, regulatory bodies, communities, etc.
- The following draft documents were developed:
- Park program for Nunavut Parks
- Master and Management Planning Frameworks
- Cultural Landscape Resource Inventory Framework
Top five priorities for protected areas planning and management by Nunavut over the next three to five years:
- Legislative/regulatory amendments or development
- Developing or updating management plans
- Enhancing management in existing protected areas
- Collaboration with Indigenous governments or communities
- Fully establishing parks that are currently awaiting legislative protection due to land transfer
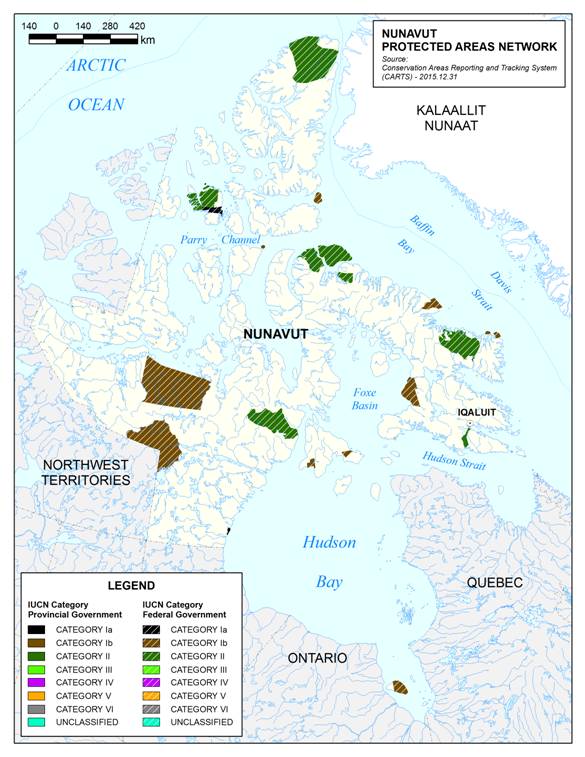
Long description for Map 11
The map depicts the Nunavut protected areas network. The entire territory of Nunavut as well as a portion of Northewest Territories, Ontario, Quebec, Hudson Bay, Foxe Basin, Hudson Strait, Davis Strait, Baffin Bay, Parry Channel, the Arctic Ocean and Kalaallit Nunaat (Greenland) are shown. The city of Iqaluit is also marked. The protected areas shown on the map are categorised as federal or territorial and are further subdivided into eight International Union for the Conservation of Nature categories. These include: category Ia, category Ib, category II, category III, category IV, category V, category VI and unclassified. Source: Conservation Areas Reporting and Tracking System (CARTS) - 2015.12.31. The scale on the map is in tens of kilometers.
Ontario

In Ontario, at the end of 2015, terrestrial protected areas covered 119 476 km2 or 11.1% of the provinceFootnote11. The vast majority of this area (106 699 km2) was protected by the province or through a shared governance regime (Table 37). The remainder was made up of federal protected areas (Table 38). Marine protected areas covered 66 km2, administered by the federal government.
| Biome | International Union for Conservation of Nature category | Number of protected areas | Area protected (km2) | Percent of total protected area under provincial or shared governance by biome |
|---|---|---|---|---|
| Terrestrial | Ia | 113 | 1 210 | 1.1% |
| Terrestrial | Ib | 8 | 48 405 | 45.4% |
| Terrestrial | II | 505 | 44 729 | 41.9% |
| Terrestrial | III | 17 | 76 | 0.1% |
| Terrestrial | IV | 5 | 3 495 | 3.3% |
| Terrestrial | Unclassified | 4 | 8 785 | 8.2% |
| Marine | N/A | N/A | N/A | N/A |
| Governance type | Number of protected areas | Area protected (km2) | Percent of total area protected in the province of Ontario |
|---|---|---|---|
| Federal government | 41 | 13 523 | 11.2% |
| Provincial / territorial government | 647 | 103 204 | 85.8% |
| Shared governance | 5 | 3 495 | 2.9% |
| Private governance | 0 | 0 | 0.0% |
| Governance by Indigenous Peoples and local communities | 0 | 0 | 0.0% |
Most significant accomplishments by Ontario, 2012-2015:
- Completed the Ontario's Protected Areas Planning Manual and Guidelines in 2015.
- Established five new provincial parks (2014)
- Participated in the Algonquin land claim process, including the development of a chapter in the land claim on Parks and Protected Areas.
Top five priorities for protected areas planning and management by Ontario over the next three to five years:
- Establishing new protected areas
- Legislative/regulatory amendments or development
- Developing or updating management plans
- Enhancing management in existing protected areas
- Collaboration with Indigenous governments or communities
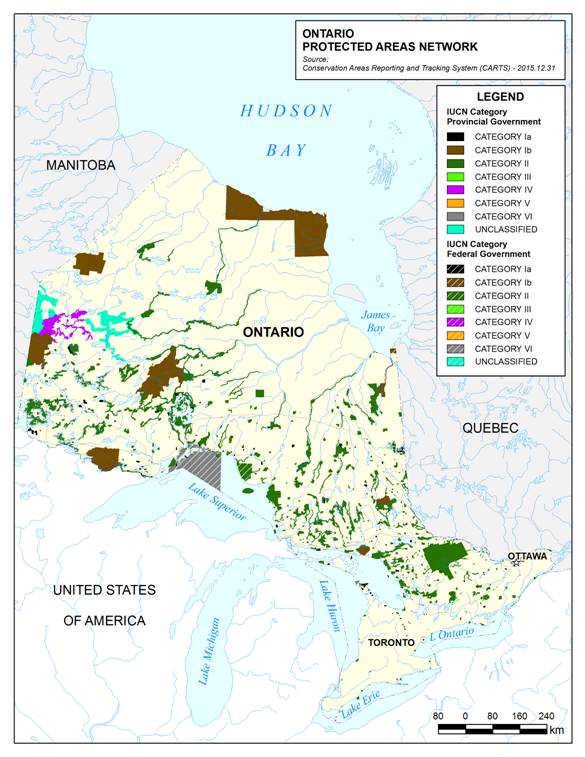
Long description for Map 12
The map depicts the Ontario protected areas network. The entire province of Ontario as well as a portion of Manitoba, Quebec, Hudson Bay, James Bay, lake Superior, Lake Michigan, Lake Huron, Lake Erie, Lake Ontario and the United States of America are shown. The cities of Toronto and Ottawa are also marked. The protected areas shown on the map are categorised as either provincial or federal and are further subdivided into eight International Union for the Conservation of Nature categories. These include: category Ia, category Ib, category II, category III, category IV, category V, category VI and unclassified. Source: Conservation Areas Reporting and Tracking System (CARTS) - 2015.12.31. The scale on the map is in tens of kilometers.
Prince Edward Island

In Prince Edward Island, at the end of 2015, terrestrial protected areas covered 175 km2 or 3.1% of the provinceFootnote12. The vast majority of that area (124 km2) was protected by the province or through a shared governance regime (Table 39). The remainder was made up of federal protected areas and private conservation areas (Table 40). Marine protected areas covered 21 km2. The province of Prince Edward Island administered 11 km2 through provincial or shared governance with the remainder administered by federal government or under private governance.
| Biome | International Union for Conservation of Nature category | Number of protected areas | Area protected (km2) | Percent of total protected area under provincial or shared governance by biome |
|---|---|---|---|---|
| Terrestrial | II | 7 | 8 | 5.7% |
| Terrestrial | III | 58 | 34 | 31.2% |
| Terrestrial | IV | 59 | 81 | 62.4% |
| Terrestrial | V | 3 | <1 | 0.7% |
| Marine | Ib | 1 | 1 | 10.5% |
| Marine | II | 2 | <1 | 1.3% |
| Marine | III | 18 | 2 | 28.0% |
| Marine | IV | 22 | 7 | 60.2% |
| Governance type | Number of protected areas | Area protected (km2) | Percent of total area protected in the province of Prince Edward Island |
|---|---|---|---|
| Federal government | 2 | 36 | 19.4% |
| Provincial / territorial government | 84 | 114 | 60.9% |
| Shared governance | 6 | 17 | 9.1% |
| Private governance | 58 | 20 | 10.7% |
| Governance by Indigenous Peoples and local communities | 0 | 0 | 0.0% |
Most significant accomplishments by Prince Edward Island, 2012-2015:
- An additional 9.72 km2 were added to the Prince Edward Island Protected Areas Network; 61% of which is privately owned. As approximately 90% of the land on Prince Edward Island is privately owned, the protection of private lands is a key element in increasing the network. Partners like Island Nature Trust and Nature Conservancy of Canada, aid in this process by acquiring and protecting lands as well as by facilitating designations with private landowners.
Top five priorities for protected areas planning and management over the next three to five years:
- Expand the protected areas network in a targeted way
- Developing or updating management plans
- Reporting on protected areas, with an increased focus on monitoring
- Collaboration with non-governmental conservation organizations
- Collaboration with the private sector
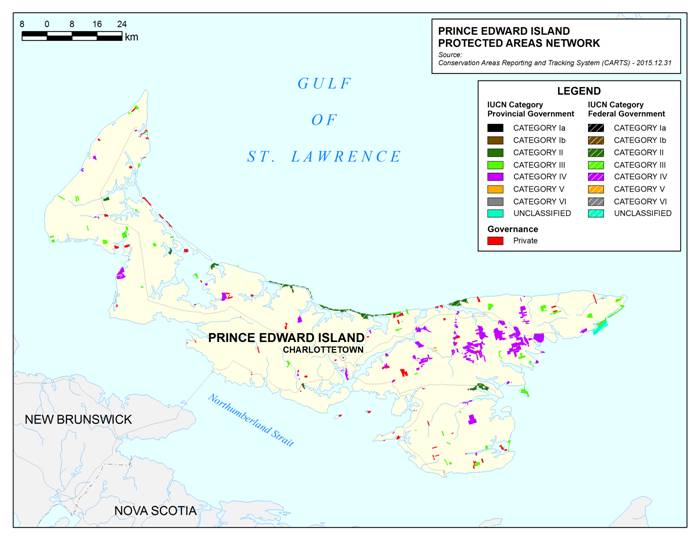
Long description for Map 13
The map depicts the Prince Edward Island protected areas network. The entire province of Prince Edward Island as well as a portion of New Brunswick, Nova Scotia, Northumberland Strait and the Gulf of St. Lawrence are shown. The city of Charlottetown is also marked. The protected areas shown on the map are categorised as either provincial, federal or private. The provincial and federal protected areas are further subdivided into eight International Union for the Conservation of Nature categories. These include: category Ia, category Ib, category II, category III, category IV, category V, category VI and unclassified. Source: Conservation Areas Reporting and Tracking System (CARTS) - 2015.12.31. The scale on the map is in kilometers.
Quebec

In Quebec, at the end of 2015, terrestrial protected areasFootnote13 covered 147 392 km2, about 9.75% of the provinceFootnote14. Nearly all of this area (145 910 km2) was protected by the province or through a shared governance regime (Table 41). The remainder was made up of federal protected areas (Table 42). Marine protected area covered 5 663 km2. The province of Quebec administered 5 331 km2 through provincial or shared governance and the remainder was administered by the federal government.
| Biome | International Union for Conservation of Nature category | Number of protected areas | Area protected (km2) | Percent of total protected area under provincial or shared governance by biome |
|---|---|---|---|---|
| Terrestrial | Ia | 115 | 1 624 | 1.1% |
| Terrestrial | II | 132 | 136 943 | 93.8% |
| Terrestrial | III | 208 | 375 | 0.2% |
| Terrestrial | IV | 2 878 | 6 764 | 4.6% |
| Terrestrial | V | 1 | <1 | <0.1% |
| Terrestrial | VI | 353 | 117 | 0.2% |
| Terrestrial | Unclassified | 122 | 87 | 0.1% |
| Marine | II | 15 | 2 933 | 55.0% |
| Marine | III | 4 | 5 | 0.1% |
| Marine | IV | 486 | 2 390 | 44.8% |
| Marine | VI | 1 | 6 | 0.1% |
| Marine | Unclassified | 1 | <1 | <0.1% |
| Governance type | Number of protected areas | Area protected (km2) | Percent of total area protected in the province of Quebec |
|---|---|---|---|
| Federal government | 39 | 1 813 | 1.2% |
| Provincial / territorial government | 3 953 | 149 797 | 97.9% |
| Shared governance | 206 | 1 445 | 0.9% |
| Private governance | 0 | 0 | 0.0% |
| Governance by Indigenous Peoples and local communities | 0 | 0 | 0.0% |
Most significant accomplishments by Quebec, 2012-2015:
- The provincial national parks network expanded with the creation of two new parks (Opémican and Tursujuq), and the initiation of a regulatory process for increasing the size of eight others located in the south of the province.
- With the objective of increasing the proportion of protected areas covering its territory from 8% to 12%, numerous consultations were held across various regions of the province in order to ensure that the provincial targets will be strongly supported by local stakeholders for the provincial targets, which include the development of the biodiversity and aquatic reserves network on public lands.
- One hundred and fifteen natural reserves were recognized, totalling approximately 98 km2. It is also worth noting that 38 ecological gifts were completed, valued at $18 40 1 703 and covering 30 km2.
Top five priorities for protected areas planning and management by Quebec over the next three to five years:
- Establishing new protected areas
- Network planning
- Meeting protected areas targets
- Legislative/regulatory amendments or development
- Developing or updating management plans
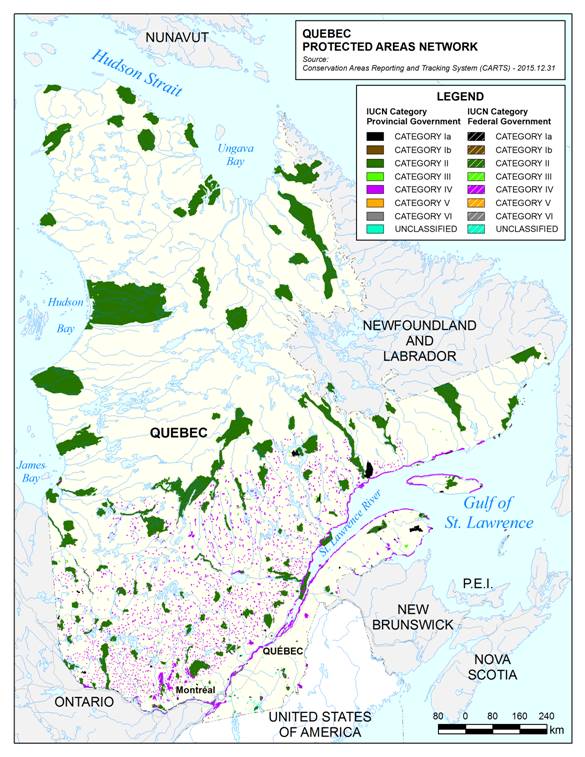
Long description for Map 14
The map depicts the Quebec protected areas network. The entire province of Quebec as well as a portion of Nunavut, Newfoundland and Labrador, Ontario, New Brunswick, Prince Edward Island, Nova Scotia, the Hudson Strait, Ungava Bay, Hudson Bay, James Bay, St. Lawrence River, the Gulf of St. Lawrence and the United States of America are shown. The cities of Montreal and Quebec are also marked. The protected areas shown on the map are categorised as either provincial or federal and are further subdivided into eight International Union for the Conservation of Nature categories. These include: category Ia, category Ib, category II, category III, category IV, category V, category VI and unclassified. Source: Conservation Areas Reporting and Tracking System (CARTS) - 2015.12.31. The scale on the map is in tens of kilometers.
Saskatchewan

In Saskatchewan, at the end of 2015, terrestrial protected areas covered 55 468 km2 or 8.5% of the provinceFootnote 36. Over three quarters of this area (44 441 km2) was protected by the province or through a shared governance regime (Table 43). The remainder was made up of federal protected areas (Table 44).
Approximately 7 400 km2 of community pastures in Saskatchewan, previously protected by Agriculture and Agri-Food Canada under the Prairie Farm Rehabilitation Administration program, is reported as protected area but is categorized as “In transition” between federal and provincial governments with respect to governance. The area is included in the amount of area protected in Saskatchewan, but is not reported as area under either federal or provincial administration.
| Biome | International Union for Conservation of Nature category | Number of protected areas | Area protected (km2) | Percent of total protected area under provincial or shared governance by biome |
|---|---|---|---|---|
| Terrestrial | Ia | 5 | 1 599 | 3.6% |
| Terrestrial | Ib | 38 | 13 308 | 30.0% |
| Terrestrial | II | 11 | 6 749 | 15.2% |
| Terrestrial | III | 33 | 104 | 0.2% |
| Terrestrial | IV | 54 | 4 282 | 9.6% |
| Terrestrial | V | 123 | 672 | 1.5% |
| Terrestrial | VI | 54 | 17 727 | 39.9% |
| Marine | N/A | N/A | N/A | N/A |
| Governance type | Number of protected areas | Area protected (km2) | Percent of total area protected in the province of Saskatchewan |
|---|---|---|---|
| Federal government | 22 | 5 378 | 9.4% |
| Provincial / territorial government | 317 | 42 066 | 73.8% |
| Shared governance | 1 | 2 375 | 4.2% |
| Private governance | 0 | 0 | 0.0% |
| Governance by Indigenous Peoples and local communities | 0 | 0 | 0.0% |
| In Transition (Community Pasture) | 63 | 7 160 | 12.6% |
Most significant accomplishments by Saskatchewan, 2012-2015:
- Pink Lake Representative Area Ecological Reserve and Great Blue Heron Provincial Park were established and formally designated (2013). Both of these designations were the result of many years of cooperative planning, consultation and work with First Nations and Metis communities, stakeholders and interest groups. These additions are valuable contributions to the Representative Areas Network.
- The Southern Conservation Land Management Strategy was developed, approved and implemented. The legislative changes allow for the sale of lower ecological valued lands designated under The Wildlife Habitat Protection Act, the protection of additional higher ecological valued lands under that Act, and the creation of a new Crown conservation easement that is registered on suitable lands as a condition of sale. The implementation of the Strategy is ongoing as lands of lower ecological value are sold to lessees and lands of higher ecological value are added to the list of protected lands.
- Working cooperatively with First Nations and Metis communities and interest groups in the development, planning and participation in land use planning and advisory groups that meet regularly to address issues that impact protected areas and park lands. In some examples key to this cooperation is identification of cultural sites within existing and proposed parks and protected areas which have significance to Indigenous Peoples. Future efforts may lead to innovative approaches to establish and/or manage protected areas with greater involvement of First Nations and Metis communities.
Top five priorities for protected areas planning and management by Saskatchewan over the next three to five years:
- Network planning
- Legislative/regulatory amendments or development
- Enhancing management in existing protected areas
- Improving ecological monitoring in protected areas
- Collaboration with Indigenous governments or communities
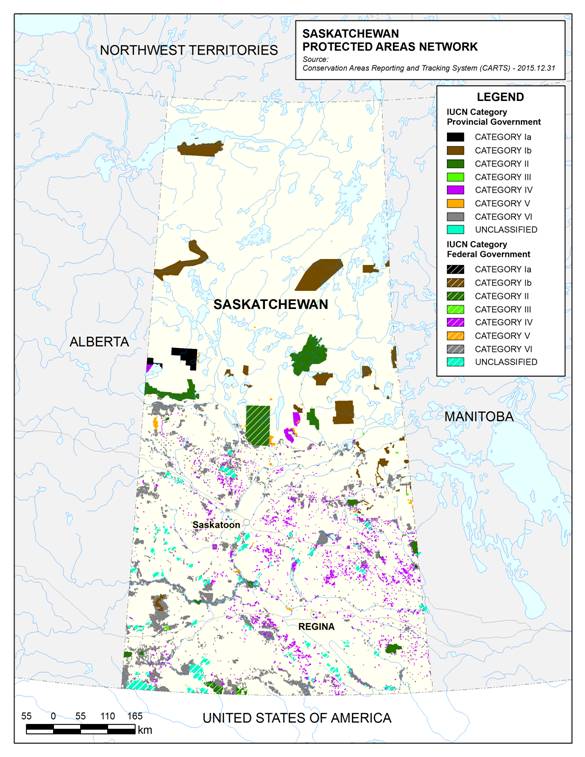
Long description for Map 15
The map depicts the Saskatchewan protected areas network. The entire province of Saskatchewan as well as a portion Northwest Territories, Alberta, Manitoba and the United States of America are shown. The cities of Saskatoon and Regina are also marked. The protected areas shown on the map are categorised as either provincial or federal and are further subdivided into eight International Union for the Conservation of Nature categories. These include: category Ia, category Ib, category II, category III, category IV, category V, category VI and unclassified. Source: Conservation Areas Reporting and Tracking System (CARTS) - 2015.12.31. The scale on the map is in tens of kilometers.
Yukon

In Yukon, at the end of 2015, terrestrial protected areas covered 57 358 km2 or 11.9% of the territoryFootnote16. Over one third of this area (21 162 km2) was protected by the territory or through a shared governance regime (Table 45). The remainder was made up of federal protected areas (Table 46). Marine protected areas covered 79 km2, administered by the federal government.
| Biome | International Union for Conservation of Nature category | Number of protected areas | Area protected (km2) | Percent of total protected area under territorial or shared governance by biome |
|---|---|---|---|---|
| Terrestrial | Ib | 1 | 5 355 | 25.3% |
| Terrestrial | II | 4 | 8 229 | 38.9% |
| Terrestrial | III | 2 | 185 | 0.9% |
| Terrestrial | IV | 10 | 7 360 | 34.8% |
| Terrestrial | VI | 1 | 33 | 0.2% |
| Marine | N/A | N/A | N/A | N/A |
| Governance type | Number of protected areas | Area protected (km2) | Percent of total area protected in the territory of Yukon |
|---|---|---|---|
| Federal government | 4 | 36 211 | 63.1% |
| Provincial / territorial government | 1 | 16 | <0.1% |
| Shared governance | 17 | 21 147 | 36.9% |
| Private governance | 0 | 0 | 0.0% |
| Governance by Indigenous Peoples and local communities | 0 | 0 | 0.0% |
Most significant accomplishments by Yukon, 2012-2015:
- Yukon and Vuntut Gwitchin First Nation worked collaboratively toward the establishment of two new protected areas identified through land use planning: Dàadzàii Vàn Territorial Park and Whitefish Wetlands Habitat Protection Area.
- Yukon, Carcross Tagish First Nation, Champagne and Aishihik First Nation, and Kwanlin Dün First Nation collaborated to develop a recommended management plan for Kusawa Territorial Park.
- Management planning was moved forward for several protected areas:
- Yukon, Kluane First Nation, and White River First Nation worked together to continue the development of a management plan for Asi Keyi Territorial Park.
- Yukon and Vuntut Gwitchin First Nation worked together on management plans for Dàadzàii Vàn Territorial Park and Whitefish Wetlands Habitat Protection Area.
Top five priorities for protected areas planning and management by Yukon over the next three to five years:
- Identifying priority areas for protection
- Developing or updating management plans
- Improving ecological monitoring in protected areas
- Reporting on protected areas
- Collaboration with Indigenous governments or communities
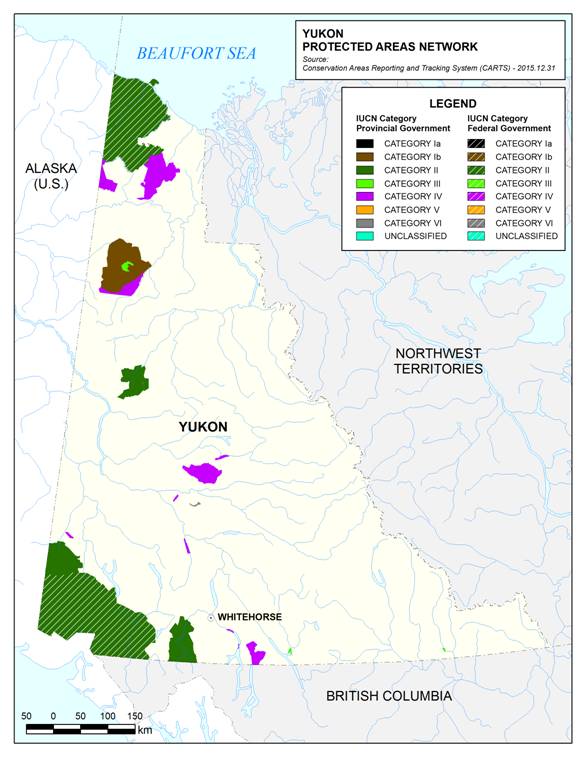
Long description for Map 16
The map depicts the Yukon protected areas network. The entire territory of Yukon as well as a portion British Columbia, Northwest Territories, Beaufort Sea and Alaska are shown. The city of Whitehorse is also marked. The protected areas shown on the map are categorised as either provincial or federal and are further subdivided into eight International Union for the Conservation of Nature categories. These include: category Ia, category Ib, category II, category III, category IV, category V, category VI and unclassified. Source: Conservation Areas Reporting and Tracking System (CARTS) - 2015.12.31. The scale on the map is in tens of kilometers.
Environment and Climate Change Canada

Environment and Climate Change Canada protected 104 834 km2, or 1.1% of Canada’s terrestrial area by the end of 2015Footnote17. This federal department also administered 19 600 km2 of marine protected areas, covering 0.34% of Canada’s marine area (Table 47).
| Biome | International Union for Conservation of Nature category | Number of protected areas | Area protected (km2) | Percent of total protected area administered by Environment and Climate Change Canada by biome |
|---|---|---|---|---|
| Terrestrial | Ia | 37 | 2 910 | 2.8% |
| Terrestrial | Ib | 17 | 89 290 | 85.1% |
| Terrestrial | II | 6 | 11 127 | 10.6% |
| Terrestrial | III | 19 | 141 | 0.1% |
| Terrestrial | IV | 33 | 1 273 | 1.2% |
| Terrestrial | V | 2 | 21 | <0.1% |
| Terrestrial | VI | 7 | 109 | 0.1% |
| Marine | Ia | 23 | 763 | 3.9% |
| Marine | Ib | 15 | 16 939 | 86.4% |
| Marine | II | 2 | 1 777 | 9.1% |
| Marine | III | 9 | 35 | 0.2% |
| Marine | IV | 5 | 79 | 0.4% |
| Marine | VI | 1 | 5 | <0.1% |
Most significant accomplishments by Environment and Climate Chance Canada, 2012-2015:
- Environment and Climate Change Canada launched an initiative to Connect Canadians to Nature in ten of its National Wildlife Areas. Infrastructure improvements are being made, public programming is being expanded and promotion of these sites is being undertaken all with the goal of making Canadians aware of the opportunities that exist for them to enjoy nature and view wildlife in their National Wildlife Areas. The Connecting Canadians to Nature initiative has been launched in Alaksen and Vaseux-Bighorn National Wildlife Areas in British Columbia, Last Mountain Lake National Wildlife Area in Saskatchewan, Big Creek and Prince Edward Point National Wildlife Areas in Ontario, Cap Tourmente and Lake Saint-François National Wildlife Areas in Quebec, and Chignecto, Cape Jourimain, and Shepody National Wildlife Areas in the Atlantic provinces.
- After three years of negotiations with Nunavut Tunngavik Inc. and three regional Inuit associations Environment and Climate Change Canada reached an agreement-in-principle on the terms of a renewed Inuit Impact and Benefit Agreement for Environment and Climate Change Canada‘s conservation areas in the Nunavut Settlement Area. One of the important aspects of this Agreement is the co-management of eight Migratory Bird Sanctuaries and five National Wildlife Areas. These conservation areas are co-managed with local Inuit communities.
Top five priorities for protected areas planning and management by Environment and Climate Chance Canada over the next three to five years:
- Establishing new protected areas
- Legislative/regulatory amendments or development
- Enhancing management in existing protected areas
- Improving ecological monitoring in protected areas
- Furthering education and outreach
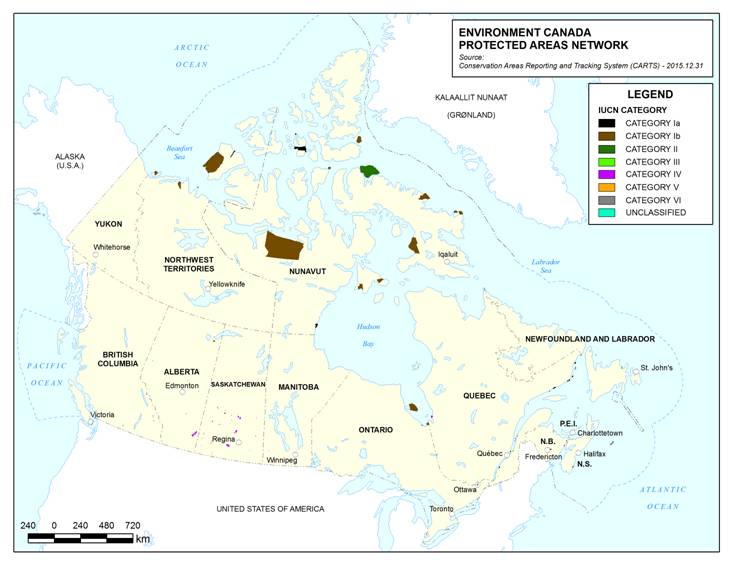
Long description for Map 17
The map shows the Environment and Climate Change Canada protected areas network. Canada is shown in its entirety; both terrestrial and marine areas. The map also shows a portion of the United States of America (including Alaska), Kalaallit Nunaat, the Beaufort Sea, Hudson Bay, Labrador Sea as well as the Arctic, Pacific and Atlantic Oceans. Capital cities across Canada are labelled including Victoria, Whitehorse, Yellowknife, Edmonton, Regina, Winnipeg, Iqaluit, Toronto, Ottawa, Quebec, Fredricton, Charlottetown, Halifax and St. John's. The federal protected areas shown on this map are subdivided by International Union for the Conservation of Nature categories. These include: category Ia, category Ib, category II, category III, category IV, category V, category VI and unclassified. Source: Conservation Areas Reporting and Tracking System (CARTS) - 2015.12.31. The scale on the map is in hundreds of kilometers.
Fisheries and Oceans Canada

Fisheries and Oceans Canada protected 10 392 km2, or 0.18% of Canada’s marine area, by the end of 2015 (Table 48).
| Biome | International Union for Conservation of Nature category | Number of protected areas | Area protected (km2) | Percent of total protected area administered by Fisheries and Oceans Canada by biome |
|---|---|---|---|---|
| Terrestrial | N/A | N/A | N/A | N/A |
| Marine | Unclassified | 8 | 10 392 | 100.0% |
Most significant accomplishments by Fisheries and Oceans Canada, 2012-2015:
- In 2014, Fisheries and Oceans Canada and Environment and Climate Change Canada secured $37 million in funding over five years to strengthen marine and coastal conservation. This funding will allow Fisheries and Oceans Canada to:
- establish four new marine protected areas and identify three additional areas as candidates for protection;
- advance the development of a national network of federal and provincial marine protected areas, which Fisheries and Oceans Canada is leading and coordinating in collaboration with its partners;
- develop the necessary management and monitoring frameworks to implement this marine protected area work; and work with Canadians to manage these new marine protected areas. After 2019, Fisheries and Oceans Canada will also receive ongoing funding of $3.893 million per year, which will support the effective management of Fisheries and Oceans Canada’s marine protected areas.
- A Corals and Sponges Conservation Strategy for Eastern Canada has been developed collaboratively by the five eastern regions. The Strategy covers the coral and sponge species, communities and habitats in the Atlantic and Arctic Oceans of Eastern Canada. A similar strategy for Pacific Region was published in 2010. With both strategies released, all of Canada’s oceans will now have conservation, management and research objectives for corals and sponges.
- Hecate Strait and Queen Charlotte Sound Glass Sponge Reefs Marine Protected Areas regulations went to Canada Gazette I for a 30 day public comment period in June 2015. This is the second last step in the regulatory process, prior to designation of the marine protected area. Once designated, this marine protected area will protect a spectacular concentration of fragile and unique glass sponges estimated to be over 9,000 years old. Not only will marine protected area status help preserve this unique feature, it will provide continued protection of important habitat for many other marine species.
Top five priorities for protected areas planning and management by Fisheries and Oceans Canada over the next three to five years:
- Establishing new protected areas
- Network development
- Meeting protected areas targets
- Enhancing management in existing protected areas
- Improving ecological monitoring in protected areas
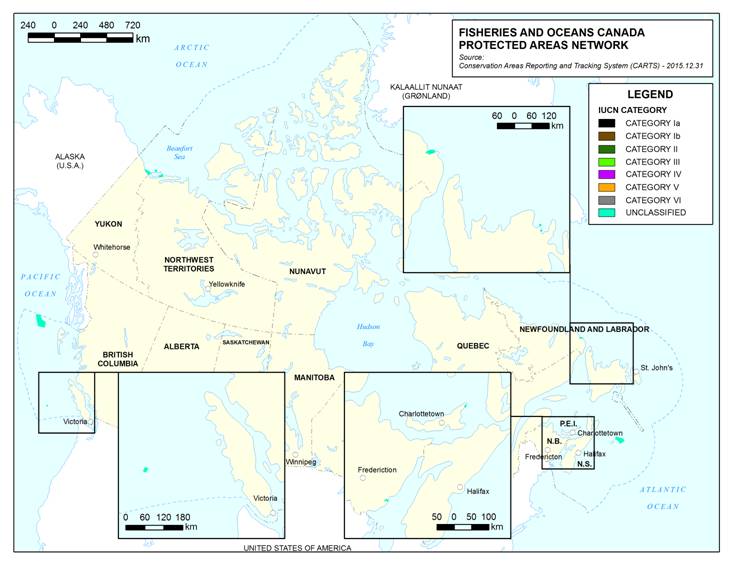
Long description for Map 18
The map shows the Fisheries and Oceans Canada protected areas network. Canada is shown in its entirety; both terrestrial and marine areas. The map also shows a portion of the United States of America (including Alaska), Kalaallit Nunaat, the Beaufort Sea, Hudson Bay, Labrador Sea as well as the Arctic, Pacific and Atlantic Oceans. Capital cities across Canada are labelled including Victoria, Whitehorse, Yellowknife, Edmonton, Regina, Winnipeg, Iqaluit, Toronto, Ottawa, Quebec, Fredricton, Charlottetown, Halifax and St. John's. The federal protected areas shown on this map are subdivided by International Union for the Conservation of Nature categories. These include: category Ia, category Ib, category II, category III, category IV, category V, category VI and unclassified. Source: Conservation Areas Reporting and Tracking System (CARTS) - 2015.12.31. The scale on the map is in hundreds of kilometers.
Parks Canada Agency

Parks Canada protected 339 740 km2, or 3.4% of Canada’s terrestrial area by the end of 2015Footnote18 (Table 49). This federal agency also administered 12 720 km2 of marine protected areas, or 0.22% of Canada’s marine area, including Saguenay-St.Lawrence Marine Park, which is administered under shared governance with Quebec (Table 50).
| Biome | International Union for Conservation of Nature category | Number of protected areas | Area protected (km2) | Percent of total protected area administered by Parks Canada Agency by biome |
|---|---|---|---|---|
| Terrestrial | II | 46 | 319 738 | 95.1% |
| Terrestrial | V | 1 | 19 | 0.0% |
| Terrestrial | VI | 4 | 16 585 | 4.9% |
| Marine | II | 10 | 9 182 | 71.3% |
| Marine | VI | 4 | 3 699 | 28.7% |
| Governance type | Number of protected areas | Area protected (km2) | Percent of total jurisdictional area protected |
|---|---|---|---|
| Governance by government (Federal) | 52 | 347 976 | 99.6% |
| Shared Governance | 1 | 1 246 | 0.36% |
Most significant accomplishments by Parks Canada, 2012-2015:
- Parks Canada expanded its system of protected areas through the establishment of three new National Parks (Nááts’ihch’oh, Qausuittuq, Mealy Mountains), and the Rouge National Urban Park. Together, these additions protect more than 26 500 km2 of land in the Northwest Territories, Nunavut, Labrador, and Ontario. Parks Canada also increased the legislative protection to Ukkusiksalik National Park and Lake Superior National Marine Conservation Area . Furthermore, Parks Canada made progress in building the National Marine Conservation Areas system, both in developing marine area management capacity and through working toward several National Marine Conservation Area proposals.
- In 2015, Parks Canada released “Promising Pathways: Strengthening Engagement And Relationships With Aboriginal Peoples In Parks Canada Heritage Places” This guide helps support and strengthen engagement and relationship building with Indigenous Peoples and encourages the development of positive and respectful relationships. The stories from the field and lessons from the field presented in the document give examples on how to improve and expand Indigenous Peoples engagement activities and relationship building. One of the objectives of this document is to provide a more consistent approach for Indigenous Peoples engagement and relationship building across the spectrum of Parks Canada heritage places in order to establish strong, sustainable and respectful relationships with the more than 300 Indigenous communities and partners.
- Through the work of staff, partners, and volunteers, Parks Canada improved ecological integrity in 20 National Parks between 2012 and 2015, primarily through significant ecosystem restoration efforts.
- Parks Canada Agency also contributed to the recovery of several species at risk by identifying and protecting critical habitat found on Parks Canada Agency lands and waters.
Top five priorities for protected areas planning and management by Parks Canada over the next three to five years:
- Establishing new protected areas
- Enhancing management in existing protected areas
- Increasing visitation
- Improving visitor experience
- Furthering education and outreach
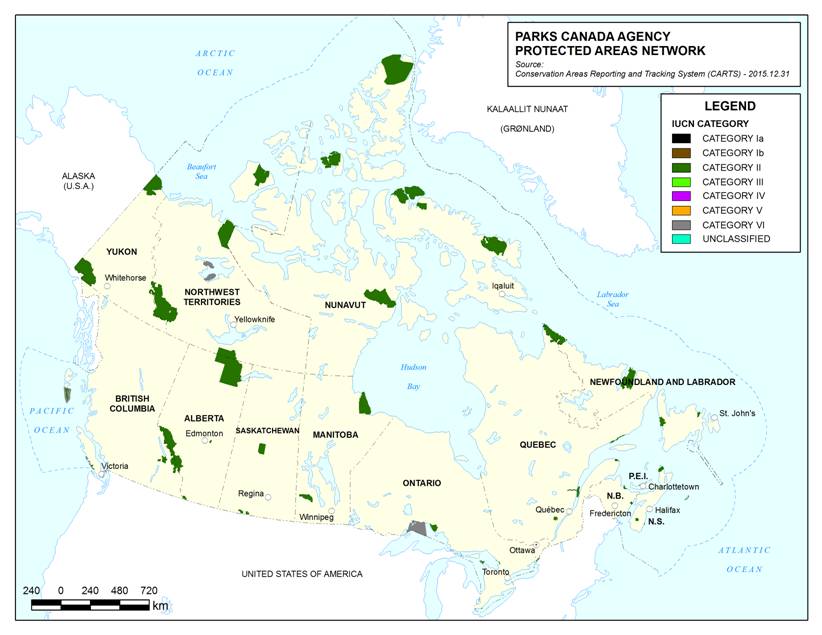
Long description for Map 19
The map shows the Parks Canada Agency protected areas system. Canada is shown in its entirety; both terrestrial and marine areas. The map also shows a portion of the United States of America (including Alaska), Kalaallit Nunaat, the Beaufort Sea, Hudson Bay, Labrador Sea as well as the Arctic, Pacific and Atlantic Oceans. Capital cities across Canada are labelled including Victoria, Whitehorse, Yellowknife, Edmonton, Regina, Winnipeg, Iqaluit, Toronto, Ottawa, Quebec, Fredricton, Charlottetown, Halifax and St. John's. The federal protected areas shown on this map are subdivided by International Union for the Conservation of Nature categories. These include: category Ia, category Ib, category II, category III, category IV, category V, category VI and unclassified. Source: Conservation Areas Reporting and Tracking System (CARTS) - 2015.12.31. The scale on the map is in hundreds of kilometers.