
Boron in Drinking Water: Guideline Technical Document for Public Consultation
Download the alternative format
(PDF format, 1.07 MB, 51 pages)
Organization: Health Canada
Date published: 2020-01-10
Consultation period ends
March 13, 2020
Table of Contents
- Purpose of consultation
- Proposed guideline
- Executive summary
- 1.0 Exposure Considerations
- 2.0 Health Considerations
- 3.0 Derivation of the health based value (HBV)
- 4.0 Analytical and Treatment Considerations
- 4.1 Analytical methods to detect boron
- 4.2 Treatment considerations
- 4.3 Distribution system considerations
- 5.0 Monitoring
- 6.0 International Considerations
- 7.0 Rationale for Maximum Acceptable Concentration (MAC)
- 8.0 References
- Appendix A: List of acronyms
- Appendix B: Provincial and territorial anticipated impacts
- Appendix C: Canadian water quality data
Purpose of consultation
This guideline technical document evaluated the available information on boron with the intent of updating the guideline value(s) for boron in drinking water. The purpose of this consultation is to solicit comments on the proposed guideline value, on the approach used for its development and on the potential economic costs of implementing it.
The existing guideline technical document on boron, last updated in 1991, recommended a maximum acceptable concentration (MAC) of 5 mg/L (5000 µg/L) based on testicular atrophy in a 2-year dog study by Weir and Fisher (1972), taking into consideration limitations in treatment technology.
This document proposes a maximum acceptable concentration (MAC) of 2 mg/L (2000 µg/L) for boron in drinking water, also based on testicular effects in a 2-year dog study by Weir and Fisher (1972), and taking into consideration treatment achievability. The document was reviewed by external experts and subsequently revised. We now seek comments from the public. This document is available for a 60-day public consultation period.
Please send comments (with rationale, where required) to Health Canada via email at: HC.water-eau.SC@canada.ca.
If this is not feasible, comments may be sent by mail to:
Water and Air Quality Bureau, Health Canada,
269 Laurier Avenue West, A.L. 4903D,
Ottawa, Ontario K1A 0K9.
All comments must be received before March 13, 2020. Comments received as part of this consultation will be shared with Federal-Provincial-Territorial Committee on Drinking Water (CDW) members, along with the name and affiliation of their author. Authors who do not want their name and affiliation shared with CDW members should provide a statement to this effect along with their comments.
It should be noted that this guideline technical document will be revised following the evaluation of comments received, and a drinking water guideline will be established, if required. This document should be considered as a draft for comment only.
Proposed guideline
A maximum acceptable concentration (MAC) of 2 mg/L (2000 μg/L) is proposed for total boron in drinking water based on treatment achievability.
Executive summary
This guideline technical document was prepared in collaboration with the Federal-Provincial-Territorial Committee on Drinking Water and assesses all available information on boron.
Exposure
Boron enters the environment from both natural sources such as weathering of rocks and soils and seawater spray, as well as human activities such as fossil fuel combustion and municipal and industrial wastewater discharge. Boron is also found in pesticides, cosmetics, pharmaceuticals and natural health products and is found in many consumer products such as swimming pool and spa products and cleaning products. In water, boron exists primarily as boric acid and borate.
The main source for Canadians’ exposure to boron is through food, although consumer products can also contribute significantly to exposure. Exposure through drinking water can contribute up to 16% of total dietary boron exposure. In most Canadian drinking water supplies boron is below 0.1 mg/L. Higher concentrations of boron (1 – 5 mg/L) can be found in certain areas of Canada, particularly in groundwater supplies in areas with naturally occurring boron. Intake of boron from drinking water through skin contact or inhalation during showering or bathing is expected to be negligible.
Health effects
Boron is not an essential element, but some studies indicate it may be beneficial to human health. Studies in humans have found possible associations between boron and effects to reproduction and development. However, these studies have a number of design limitations and cannot be used for risk assessment. Studies in animals have consistently observed adverse effects to the male reproductive system following ingestion of high levels of boron, which supports effects seen in human studies. Testicular effects observed in dogs were the most sensitive endpoint and are used to establish the proposed health-based value (HBV) of 0.1 mg/L. The HBV is derived using a conservative approach, intended to be protective against potential reproductive effects.
Treatment and analytical considerations
The guideline development process considers the ability to both measure (quantify) and remove (treat) a contaminant in drinking water. There several methods that are available for the analysis of total boron in drinking water at concentrations well below the proposed HBV, therefore, measurement is not a limitation in the establishment of a MAC. Measurement should be for total boron which includes both the dissolved and particulate forms of boron in a water sample.
Treatment technologies are available to remove boron from drinking water supplies. However, data from municipal-scale treatment plants indicate that a treated water concentration of 0.1 mg/L is not achievable for most systems. Assessment of the data indicates that a treated water concentration of less than 2 mg/L is achievable using a variety of treatment technologies with common design and operating conditions. This provides drinking water treatment providers flexibility in the selection of a treatment technology to achieve the proposed MAC including systems with higher boron concentrations (≥ 5 mg/L) in their source water. A concentration of 2 mg/L in treated water is also achievable for small drinking water systems using less complex technologies (single-pass reverse osmosis system) that may be more practical where resources are limited.
Although residential-scale treatment technologies that are effective for the removal of boron are limited, reverse osmosis and distillation treatment units are expected to be capable of removing boron to 2 mg/L or less in treated water.
Since treatment technology achievability is a limiting factor in establishing a guideline for boron in drinking water, Health Canada and the Federal-Provincial-Territorial Committee on Drinking Water will continue to monitor new developments in treatment technologies to revise and update the guideline and the guideline technical document as required.
Distribution system
Since boron adsorbs onto aluminum and iron oxides in the environment, it is possible that boron may also accumulate within distribution systems where these types of deposits are present. Where boron is present in source water, utilities should determine if boron needs to be included in their distribution system management plan.
Application of the guideline
Note: Specific guidance related to the implementation of drinking water guidelines should be obtained from the appropriate drinking water authority in the affected jurisdiction.
The HBV is derived using a conservative approach, intended to be protective against potential reproductive effects. Efforts should be made to reduce boron in drinking water to levels lower than 2 mg/L where possible. Lower concentrations can be achieved by some drinking water treatment systems depending on the source water quality, the type of treatment technology in place and the operational conditions of the treatment plant.
An exceedance of the proposed MAC should be investigated. For exceedances in source water where there is no treatment in place, additional monitoring to confirm the exceedance should be conducted. If it is confirmed that source water boron concentrations are above the proposed MAC then an investigation to determine the most appropriate way to reduce exposure to boron should be conducted. This may include use of an alternate water supply or installation of treatment. Where treatment is already in place and an exceedance occurs, an investigation should be conducted to verify treatment and determine if adjustments are needed to lower the treated water concentration below the proposed MAC.
International considerations
Drinking water quality guidelines, standards and/or guidance established by foreign governments or international agencies may vary due to the science available at the time of assessment, as well as the utilization of different policies and approaches, such as the choice of key study, and the use of different consumption rates, body weights and allocation factors. Other international organizations have set drinking water guidelines and guidance values pertaining to the concentration of boron in drinking water. The World Health Organization (WHO), Australia’s National Health and Medical Research Council and the European Union have established health-based regulatory limits for boron in drinking water of 2.4, 4 and 1 mg/L, respectively.
The United States Environmental Protection Agency (U.S. EPA) does not have a regulatory limit for boron in drinking water, but has set a lifetime health advisory at 5 mg/L.
1.0 Exposure Considerations
1.1 Sources, uses and identity
Boron (Chemical Abstracts Service Registry No. 7440-42-8) originates from both natural and anthropogenic sources. It enters the environment naturally through weathering of boron-containing rocks and soils, seawater spray, volcanoes and geothermal ducts (Coughlin, 1996). Anthropogenic sources of boron include fossil fuel combustion, biomass burning, pesticide application, farming practices (e.g., irrigation), waste water from sewage treatment plants and industrial manufacturing and other human activities (e.g., incineration) (CCME, 2009). The majority of anthropogenic boron that enters drinking water sources originates from detergents and fertilizers (Parks and Edwards, 2005). However, anthropogenic inputs of boron to natural environments are considered smaller than inputs from natural processes (U.S EPA, 2008)
Of the more than 200 minerals containing boron, only four (borax, kernite, colemite and ulexite) are commercially important and make up more than 90% of the borates used industrially worldwide (ATSDR, 2010). Borates and boric acids are used in the manufacturing of glass, soaps, detergents, flame retardants and as neutron absorbers for nuclear installations. Boric acid, borates and perborates are used in mild antiseptics, pharmaceuticals and natural health products, boron neutron capture therapy, antioxidants for soldering, and agricultural fertilizers (HC, 2007; CCME, 2009). Borates are used in adhesives and sealants, paints and coatings, personal care products, lubricants and greases, and food packaging (ECCC and HC, 2016). Boric acid and its salts are used as insecticides and fungicides (PMRA, 2012) and are conditionally permitted in cosmetic products at concentrations of less than 5% (HC, 2018). Although boric acid occurs naturally in foods, and particularly plant-based foods (ATSDR, 2010), it cannot be imported, used or sold as a food ingredient in Canada (CFIA, 2013).
Boron has a molecular weight of 10.81g/mol and does not exist in its elemental form in nature. In water, boron primarily exists in equilibrium as undissociated boric acid (H3BO4; CAS no. 10043-35-3) and other borates (e.g., B(OH)4-) (CCME, 2009). Boric acid has a molecular weight of 61.83 g/mol, is highly soluble (49 g/L), has negligible vapour pressure and a log Kow of 0.175 (ECOTOC, 1995; ECCC and HC, 2016). The chemical and toxicological properties of boric acid and other borates (e.g., borax) are anticipated to be similar on a molar boron equivalent basis when dissolved in water or biological fluids (WHO, 2009).
1.2 Environmental fate
Most environmentally relevant boron minerals are highly soluble in water (ATSDR, 2010) with their solubility increasing with temperature (Coughlin, 1996). Therefore, if present in water, boron compounds are not easily removed from solution by natural mechanisms (Butterwick et al., 1988). Their distribution in the environment depends on geology, rainfall, evaporation rates, and aquifer type (Coughlin, 1996). At acidic pH, boron exists in solution mainly as undissociated boric acid, whereas at alkaline pH (i.e., above the pKa of 9.2), it is mainly present as borate ions; both forms are highly soluble and stable, and further degradation is not expected to occur (CCME, 2009). In calcium enriched hard waters, the speciation of boron might be affected by the formation of ion pairs between calcium and B(OH)4- (Butterwick et al., 1989). The only significant mechanism expected to influence the fate of boron in water is adsorption-desorption reactions with soil and sediment (CCME, 2009), the extent of which depends on the pH of the water, concentration of boron in solution and the chemical composition of the soil (CCME, 2009; ATSDR, 2010). The greatest adsorption is observed in water with a pH in the range of 7.5 to 9.0 (ATSDR, 2010). Further pH increases lower the adsorption of boron (Goldberg and Su, 2007) as the species of boron and the charges on the adsorbing surfaces become less favourable (U.S EPA, 2008). In soil, primary boron adsorbing surfaces include aluminum and iron oxides, clay minerals, calcium carbonate and organic matter (Goldberg and Su, 2007) with amorphous aluminum oxide likely the most important (ATSDR, 2010). Typical forms of boron have low volatility, and are expected to be emitted to air as particulate matter (ECCC and HC, 2016); however, monitoring studies have also detected boric acid in the gaseous phase (e.g., Anderson et al., 1994; Cheng et al., 2009). Airborne boron is anticipated to be deposited by wet (rain and snow) and dry deposition (Anderson et al. 1994; Fogg and Duce 1985; Kot 2009; Zhao and Liu 2010).
1.3 Exposure
The average total daily boron intake from environmental media and food for the general Canadian population ranges from 3 to 92 μg/kg bw per day, depending on the age group, with an estimated 3 to 16% of total dietary intake attributable to drinking water (ECCC and HC, 2016). Food is the main source of boron exposure, with fruits and vegetables contributing 40 - 60% of dietary intake (ECCC and HC, 2016). Consumer products can also contribute significantly to total daily intake, with an upper bound exposure estimate of 2819 μg/kg bw per event for direct ingestion of modelling clay by children (ECCC and HC, 2016). Soil, air and dust are likely negligible sources of boron exposure (WHO, 2009; ECCC and HC, 2016). The large range in total daily intake results from the variability of boron in foods, drinking water, and consumer products and their use patterns, and from emissions into the environment from nature weathering and human activities (Becking and Chen, 1998; ECCC and HC, 2016).
Most of the world’s boron is located in the oceans with an average concentration of 4.5 mg/L in seawater (CCME, 2009) while levels in Canadian coastal waters range from 3.7 to 4.3 mg/L (Moss and Nagpal, 2003). The amount of boron in fresh water varies with the geochemical nature of the drainage area, proximity to marine coastal regions, and inputs from industrial/municipal effluents (Butterwick et al., 1989). The concentration of boron in surface water (rivers and streams) can vary seasonally with higher concentrations observed in winter and spring and lower concentrations in summer and fall (Hall Jr. et al., 2004). While boron is present in both surface and groundwater, the average concentrations in groundwater tend to be higher than in surface water (Frey et al. 2004).
Water monitoring data are available from the provinces and territories and the National Drinking Water Survey (Table 1), as well as from select river basins from ECCC (Appendix C). Total boron is detected in all water types across Canada; however, mean concentrations vary between provinces and territories with higher concentrations found in Manitoba, Saskatchewan and Ontario. Median, mean and 90th percentile concentrations are below 1 mg/L for raw, treated and distributed water for both surface and groundwater. Overall Canadian data (calculated as the weighted mean of the data from provinces and territories) show that the mean concentrations of boron across Canada in all types of municipal water supplies (i.e., distributed and treated water, from ground and surface water), are below 0.1 mg/L.
| Jurisdiction (MDL mg/L) |
Water Type (Municipal: ground/surface – raw, treated, distributedFootnote a and Non-Municipal: ground/not specifiedFootnote b) |
# Detects/ samples |
Values above MDL (mg/L) | |||
|---|---|---|---|---|---|---|
| Median | Mean | 90th percentile | Max | |||
| AlbertaFootnote 1 (0.002 - 0.05) |
Municipal: | |||||
| Surface – raw | 68/68 | 0.01 | 0.01 | 0.01 | 0.02 | |
| Surface – treated | 83/83 | 0.01 | 0.02 | 0.03 | 0.36 | |
| Non-municipal: not specified | 72/72 | 0.19 | 0.22 | 0.44 | 1.3 | |
| ManitobaFootnote 2 (0.01 - 0.1) |
Municipal: | |||||
| Ground & surface – raw | 889/1161 | 0.09 | 0.24 | 0.6 | 6.40 | |
| Ground & surface – treated | 845/1147 | 0.08 | 0.23 | 0.54 | 5.70 | |
| Non-municipal: ground | 52/52 | 0.22 | 0.38 | 0.91 | 1.58 | |
| New BrunswickFootnote 3 (0.005 - 0.1) |
Municipal: | |||||
| Ground – raw | 889/1253 | 0.02 | 0.05 | 0.11 | 0.93 | |
| Ground – treated | 50/64 | 0.02 | 0.03 | 0.04 | 0.21 | |
| Ground – distribution | 442/607 | 0.02 | 0.04 | 0.11 | 0.46 | |
| Surface – raw | 58/103 | 0.01 | 0.02 | 0.12 | 0.14 | |
| Surface – treated | 45/40 | 0.01 | 0.03 | 0.11 | 0.19 | |
| Surface – distribution | 193/222 | 0.01 | 0.03 | 0.12 | 1.40 | |
| NewfoundlandFootnote 4 (N/A) |
Municipal: | |||||
| Ground – raw | 935/1257 | 0.02 | 0.04 | 0.08 | 0.61 | |
| Ground – distribution | 1894/2363 | 0.02 | 0.04 | 0.08 | 0.76 | |
| Surface – raw | 413/1861 | 0.01 | 0.01 | 0.02 | 0.02 | |
| Surface – distribution | 956/4546 | 0.01 | 0.01 | 0.02 | 0.15 | |
| OntarioFootnote 5 (0.001 – 0.05) |
Municipal: | |||||
| Ground - treated | 1435/2722 | 0.03 | 0.12 | 0.24 | 4.97 | |
| Surface - treated | 1062/2672 | 0.02 | 0.04 | 0.05 | 2.05 | |
| QuebecFootnote 6 (0.02 - 0.1) |
Municipal: | |||||
| Ground – treated | 2934/4691 | 0.04 | 0.07 | 0.16 | 0.74 | |
| Surface – treated | 738/1314 | 0.02 | 0.04 | 0.09 | 0.44 | |
| Ground & surface – distribution | 109/172 | 0.05 | 0.07 | 0.11 | 2.00 | |
| SaskatchewanFootnote 7 (0.001 - 0.01) |
Municipal: | |||||
| Ground – raw | 60/60 | 0.24 | 0.25 | 0.51 | 0.75 | |
| Surface - raw | 6/6 | 0.04 | 0.05 | 0.06 | 0.07 | |
| Ground & surface – treated | 55/57 | 0.03 | 0.03 | 0.64 | 1.50 | |
| Ground & surface - distribution | 1414/1445 | 0.14 | 0.26 | 0.54 | 5.50 | |
| YukonFootnote 8 (0.04 - 0.1) |
Municipal: | |||||
| Ground – raw | 16/30 | 0.02 | 0.12 | 0.45 | 0.55 | |
| CanadaFootnote c | Municipal: | |||||
| Ground – treated | 0,086 | |||||
| Ground – distribution | 0,040 | |||||
| Surface –treated | 0,039 | |||||
| Surface – distribution | 0,013 | |||||
| NDWSFootnote 9 (0,01) |
Municipal: | |||||
| Raw | 61/130 | 0.03 | 0.16 | 0.29 | 2.70 | |
| Treated | 65/130 | 0.02 | 0.15 | 0.24 | 2.7 | |
| Distribution | 145/390 | 0.03 | 0.17 | 0.17 | 2.80 | |
MDL = Method Detection Limit; NDWS = National Drinking Water Survey (2009-2010)
|
||||||
Additional analysis of the higher concentrations presented in Table 1 and information from published literature indicates that elevated boron concentrations (> 1 mg/L) occur in groundwater from certain aquifers in Ontario, Manitoba, Saskatchewan and Alberta. In most cases boron concentrations in these sources are below 5 mg/L; however, concentrations as high as 8 to 9 mg/L have been reported (Lemay, 2002; Desbarats, 2009; Government of Manitoba, 2010; Hamilton, 2015).
2.0 Health Considerations
2.1 Kinetics
Absorption: Gastrointestinal absorption of boron compounds is similar in humans and experimental animals (rats, rabbit), and ranged from 64-98% (Jansen et al., 1984; Schou et al., 1984; Vanderpool et al., 1994; Hunt et al., 1997; Dourson et al., 1998). Inorganic borates readily hydrolyze to boric acid in the gut (IOM, 2001; Pahl et al., 2001) and uptake is almost exclusively (>98%) as undissociated boric acid, which is likely absorbed by passive, non-mediated diffusion (IOM, 2001; Pahl et al., 2001). Dermal exposure studies demonstrate that boron absorption through intact skin ranges from 0.5 to 10% (ECCC and HC, 2016), but can be absorbed through damaged skin especially when dissolved in an aqueous vehicle (Draize and Kelley, 1959; Friis-Hansen et al., 1982; Stuttgen et al., 1982; Murray, 1998; See et al., 2010). Boron can also be absorbed across pulmonary tissues following inhalation exposure in humans and rats (Culver et al., 1994; Wilding et al., 1959).
Distribution: Distribution of boron is similar in humans and experimental animals (rats, rabbits), with boron being evenly distributed via passive diffusion throughout body fluids and soft tissues (liver, kidney, muscle, colon, brain, testis, epididymis, seminal vesicles, prostate and adrenals), reaching a steady state within 3 to 4 days (Ku et al., 1991; Treinen and Chapin 1991; Moseman, 1994; Murray, 1998; Bakirdere et al., 2010). In both animals and humans, boron does not accumulate above plasma levels in soft tissues, including the testes, but does accumulate in bone (2-3 times higher than in soft tissues) (Forbes et al., 1954; Forbes and Mitchell, 1957; Ku et al., 1991; Culver et al., 1994; Moseman, 1994; Chapin et al., 1998; Murray, 1998). Average blood boron concentrations of 0.034 μg/ml from Alberta biomonitoring studies have been found to adequately represent levels in the Canadian population and are also representative of exposures in children and adults (Alberta Health and Wellness 2008; Government of Alberta 2010; ECCC and HC, 2016). Maximum blood boron values (0.195 μg/ml) are found in Germany and are considered to represent the upper bound concentration in Canadians (Heitland and Köster 2006; ECCC and HC, 2016). Accumulation in bone is dose-dependent but reversible once exposure is stopped (Moseman, 1994; Chapin et al., 1997). Boron can cross the placenta in humans and has been measured in placental blood and umbilical cord blood (Grella et al., 1976 as cited in ECHA, 2010; Huel et al., 2004; Caglar et al., 2014). Furthermore, maternal blood and serum boron levels have been found to be significantly correlated to umbilical blood boron concentrations in humans (Caglar et al., 2012, 2014).
Blood-boron levels resulting from a given boron intake level differ between species, and humans appear to have higher blood-boron levels for a given intake level compared to animals (dogs, rats) (Culver et al, 1994).
Metabolism: There is no evidence that boron compounds are metabolized. Indeed, boric acid is presumed not to be metabolised in the body as a large amount of energy (523 kJ/Mol) would be required to break the boron-oxygen bond (Murray 1998).
Excretion: The overall extent of boric acid elimination is similar between humans and rodents. In humans, approximately 90% of orally administered boron given as boric acid is excreted unchanged in the urine (Kent and McCance, 1941; Jansen et al., 1984; Schou et al., 1984; Hunt et al 1997; Naghii and Samman, 1997; Murray, 1998; Samman et al., 1998; Sutherland, 1998). In rats, 95% and 4% of the administered dose was recovered from urine and feces, respectively, within 24 hours of exposure (Vanderpool et al., 1994).
Since boric acid is not metabolized, renal clearance is expected to govern its rate of excretion, and rats have been shown to have a faster clearance rate compared to humans. The glomerular filtration rate (GFR) in rats (163 ml/hour/kg or 2.72 ml/min./kg) is approximately 4 times higher than in humans (41 ml/hour/kg or 0.68 ml/min./kg) when compared on a body weight basis (Dourson et al., 1998; Murray, 1998; Hasegawa et al., 2013). Differences in GFR likely explain the differences in blood boron levels between rats and humans.
Renal clearance rates also increase during pregnancy in both humans and rats (Dourson et al., 1998), although the increases observed are not necessarily statistically significant in individual studies (Pahl et al., 2001; Vaziri et al., 2001). When pooling results across several studies, Dourson et al., (1998) found that mean blood boron clearance was 2.4 times higher in pregnant rats (397 ml/kg/hour) than non-pregnant rats (163 ml/kg/hour). Overall, renal clearance increases in pregnancy by 50% in humans, and 21% in rats (Cheung & Lafayette, 2013; Hasegawa et al., 2013).
Physiologically based pharmacokinetic modeling: No models applicable to the current risk assessment were identified.
2.2 Health effects
The database for the oral toxicity of boron is well characterized (e.g., carcinogenicity, reproduction, development, effects in bone, kidney, liver, nervous system) in both animals and humans (see ATSDR (2010) and U.S. EPA (2008) for a detailed review) and clearly identifies reproduction and development as the most sensitive targets for boron toxicity in animals (U.S. EPA, 2008; WHO, 2009; ATSDR, 2010; EFSA, 2013). The most recent comprehensive review on boron is by EFSA and covers the literature up to 2012. The present assessment considers the previous data, as well as material published after this period (i.e., from 2012 to 2018). Health Canada has also previously reviewed the toxicity of boric acid, its salts and its precursors under the Canadian Environmental Protection Act (ECCC and HC, 2016), the Pest Control Products Act (PMRA, 2012, 2016), and the Natural Health Products Regulations (Health Canada, 2007).
Beneficial effects: A number of studies indicate that boron may be beneficial to human health; however, essentiality has not been demonstrated. Boron has been used to treat inflammation, arthritis and menstrual pain and kidney stones (Scorei et al., 2011; Naghii et al., 2011; Naghii, 2013; Naghii, 2014) and may be protective against certain cancers, bone loss and liver damage (Cui et al., 2004; Barranco et al., 2007; Mahabir et al., 2008; ATSDR, 2010; Hakki et al., 2013; Balabanli and Balaban, 2015; Toker et al., 2016). Some studies also suggest a beneficial role of boron on male reproduction (Korkmaz et al., 2011; Cortés et al., 2017). Beneficial effects on sperm parameters have been seen in men consuming drinking water containing 3.0 to 7.0 mg/L levels of boron; however negative effects were observed at higher and lower doses, suggestive of a U-shaped dose response curve (Cortés et al., 2017).
Acute toxicity: The literature contains numerous reports of poisoning following acute ingestion or exposure of broken skin to boric acid or its salts. The acute lethal oral dose of boric acid ranges from 15-280 g (3-49 g B) in adults, 1-3 g (0.2-0.5 g B) in newborns, 5-6 g (0.9-1 g B) in infants and 15-20 g (3-4 g B) in children (Ishii et al, 1993; Corradi et al., 2010; Rani and Meena, 2013). Symptoms of acute exposure vary and include dermal effects such as erythema and desquamation of the skin, nausea, diarrhea, abdominal pain, headaches, shivering, seizures, lethargy, altered mental state, coma, and kidney effects (Culver and Hubbard, 1996). While information from poisoning cases is useful in identifying toxic effects and symptoms, it is of limited use in establishing dose-response relationships (Culver and Hubbard, 1996).
Carcinogenicity & Genotoxicity: Boron and its compounds have not been classified by IARC or the NTP with regards to carcinogenicity. The U.S. EPA has determined that the available data for boron and its compounds are inadequate for an assessment of human carcinogenic potential (U.S. EPA, 2008). No epidemiological studies were available from the literature linking boron intake to the development of cancer in humans. In vitro and animal studies found no evidence of genotoxicity (Haworth et al., 1983; Benson et al., 1984; NTP, 1987; Arslan et al., 2008; U.S. EPA 2008) or carcinogenicity (in mice fed boric acid up to 550 mg /kg bw per day (136 mg B/kg bw per day) for 2 years) (Dieter, 1994; NTP, 1987).
2.2.1 Developmental and Reproductive Effects
As reproduction and development are the most sensitive targets for boron toxicity (U.S. EPA, 2008; WHO, 2009; ATSDR, 2010; EFSA, 2013), the description of the health effects of boron focuses on these effects. Developmental and reproductive effects of boron exposure are described below, with a focus on studies which were considered as candidates for the key study for risk assessment. Studies considered relevant for assessing developmental and reproductive toxicity of boron are summarized in Table 2. These include oral exposure studies in experimental animals that evaluated effects of prenatal boron exposure and repeated dose studies that evaluated reproductive effects.
Developmental effects in humans: Epidemiological evidence for developmental effects is sparse and inconclusive, although some reproductive studies in humans have observed effects such as an increased frequency of spontaneous abortion, and delayed pregnancy (see Section 2.2.2). One cohort study demonstrated a possible relationship between boron exposure and birth length and weight (Igra et al., 2016). This study followed 180 mothers who were exposed to varying amounts of boron through their drinking water, and found that infant birth weight and length were decreased in infants born to mothers with serum boron concentrations > 80 μg/L, although serum boron levels were only weakly correlated with boron concentration in drinking water (Igra et al., 2016). Conversely, a cross-sectional study of 30 pregnant women in Turkey failed to show a relationship between birth weight and either maternal blood or umbilical blood boron levels (Caglar et al., 2014). A more recent cohort study also failed to demonstrate an effect on birth outcomes (i.e., spontaneous abortion, miscarriage, infant and neonatal death, preterm birth, congenital abnormalities, sex ratio and birth weight) in infants born to mothers with blood boron concentrations > 0.15 μg/L, although in this study, boron levels in drinking water were found to be significantly correlated with blood boron levels (Duydu et al., 2018a). These developmental epidemiology studies all have notable deficiencies, however, including small sample sizes, failure to account for potential confounding effects of co-exposure to other drinking water contaminants, and in Calgar et al. (2014), exclusion of infants with congenital abnormalities.
Developmental effects in experimental animals: In experimental animals, developmental effects (e.g., decreased fetal body weight, skeletal and cardiovascular malformations) were reported at non-maternally toxic doses (Table 2). The lowest observed adverse effect level (LOAEL) identified in the literature was 13.3 mg B/kg bw per day and the lowest no adverse effect level (NOAEL) was 9.6 mg B/kg bw per day, both associated with decreased body weight and skeletal malformations in rats from mothers exposed to boron in their diet (Price et al., 1996). The effects observed in rats are also supported by studies in mice and rabbits (Heindel et al., 1992, 1994). The Price et al. (1996) is described below as it was considered as a candidate for the key study for risk assessment.
In the Price et al. (1996) study, the developmental toxicity of boric acid was evaluated in rats in two phases: phase I evaluated effects of prenatal exposure, while phase II included a post-natal follow-up portion to evaluate potential reversibility of effects. In phase I, boric acid was given in the diet at 0, 0.025, 0.05, 0.075, 0.100 or 0.200% (0, 3.3, 6.3, 9.6, 13.3, or 25 mg B/kg bw per day) to time-mated Sprague-Dawley rats (60/dose) from GD 0-20. In phase II, the rats received 0, 3.2, 6.3, 9.8, 12.9, 25.3 mg B/kg bw per day from GD 0-20, and were followed until PND21. In both phases of the study, no treatment-related effects were observed in maternal animals; however, developmental effects (both pre- and post-natal) were observed, indicating sensitivity of offspring to boron exposure.
In phase I (prenatal study), fetal body weights were significantly reduced in the 13.3 and 25 mg B/kg bw per day groups at GD20. At GD20, there was a dose-related increase in the incidence of skeletal malformations (short rib XIII) in fetus in the same dose groups. A dose-dependent increase in the incidence of wavy ribs was also observed at GD20. Based on the decrease in fetal body weight and increased incidence of skeletal malformations, a developmental NOAEL of 9.6 mg B/kg bw per day can be established.
In phase II (postnatal study), exposure to boric acid was stopped at birth and dams were allowed to rear the offspring until PND21. Reductions in offspring body weight were not observed at PND21, nor was an increase in the incidence of wavy ribs. An increase in the incidence of skeletal malformation (short rib XIII) was seen only in pups in 25.3 mg B/kg bw per day group. This study suggests that effects may be reversible following cessation of exposure to boric acid. A developmental NOAEL of 12.9 mg B/kg bw per day can be identified from this phase of the study.
Reproductive effects in humans: Although a reproductive toxicant in the animal literature, evidence of reproductive effects in humans is not as conclusive. Recent reviews by Bonde (2013) and Pizent et al. (2012) found no epidemiological evidence that boric acid impaired male fertility as measured by sperm concentration, motility, morphology, or DNA integrity even at high occupational exposure levels. Nevertheless, some studies in boron workers have reported a range of reproductive health outcomes including spontaneous abortions, delayed pregnancy and altered male:female (M:F) sex ratios.
Notable human reproductive studies are summarized below; however, the study limitations prevent their use in a quantitative risk assessment. Limitations in the epidemiological studies include: absence of a clear point of departure (POD) needed for dose-response analysis, lack of individual exposure data, small sample sizes, poor disease ascertainment and failure to control for confounders. Nevertheless, the results of these studies can be used qualitatively to support the choice of the key endpoint used for quantitative assessment in animals.
In a series of studies conducted on Turkish men occupationally exposed to boron (4.46 - 106.8 mg B/day; primarily via exposure to boron-contaminated drinking water), no effects were seen on sperm parameters (sperm morphology, sperm motility, sperm concentration) or reproductive hormones (FSH, LH, total testosterone, PSA) when compared to control individuals (exposed to 4.68 mg B/day), although boron was shown to accumulate in semen in a dose-dependent manner (Duydu et al., 2011, 2012, 2015, 2016, 2018b; Basaran et al., 2012). Earlier Turkish studies also show that fertility rates were not affected by boron exposure (0.04 - 29 mg/L in drinking water), and while effects were observed on M:F sex ratios, they were not statistically significant (Sayli et al., 1998a, 1998b). A follow-up survey of some study participants also showed no differences in the frequency of infant deaths, stillbirths, spontaneous abortion or congenital malformations (Tüccar et al., 1998). In contrast, a similar survey showed a higher prevalence of spontaneous abortion and delayed pregnancy in the wives of boron workers compared to those of control workers (Liu et al., 2005). An observational study of male boron workers in California also found altered M:F sex ratios; however, these failed to reach significance (Whorton et al., 1994a, 1994b). The toxicological significance of altered sex ratios is unclear, but may be indicative of an adverse effect on fertility.
Several epidemiological studies have also been conducted on occupationally exposed men in China (e.g., Chang et al., 2006; Robbins et al., 2008, 2010; reviewed by Scialli et al., 2010). In these studies, exposure to boron (up to 51.1 mg B/day) did not significantly affect sperm parameters, fertility or sperm DNA integrity measures (e.g., aneuploidy, DNA strand breakage and apoptosis), and although effects on sperm X:Y ratios and sex ratio in offspring were observed, they were not statistically significant. The Chang et al. (2006) study also showed a delay in pregnancy (defined as the inability to conceive a child within one year of desiring a child) in the wives of boron workers compared to controls (although this effect was not statistically significant); however, no effect was observed on the number of multiple births or spontaneous abortions.
Blood boron concentrations measured in the men followed in the Turkish studies were much lower than those anticipated to elicit reproductive and developmental effects in experimental animals. Blood boron levels in the most highly exposed workers were 1100 ng B/g (Duydu et al., 2018b), while the blood level associated with reproductive toxicity in animals is calculated as 2020 ng/g (corresponding to a NOAEL of 17.5 mg B/kg bw per day) (Duydu et al., 2012, 2016; Bolt et al., 2012).
Reproductive effects in experimental animals:In experimental animals, the male reproductive tract is a consistent target for boron toxicity as indicated by testicular, sperm and fertility effects observed in dogs and rodents at concentrations ranging from 23.7 to 94.2 mg B/kg bw per day (Table 2). The lowest NOAEL identified in the literature was 3.9 mg B/kg bw per day, observed for decreased testis:bw ratio, testicular atrophy and degeneration of spermatogenic epithelium in dogs after 90 days (Weir and Fisher, 1972). The lowest LOAEL of 23.7 mg/kg bw per day was observed for decreased testes weight and impaired spermatogenesis in rats after 70 days (Seal and Weath, 1980).
In the Weir and Fisher (1972) study, the effects of 90-day and 2-year exposure to boric acid and borax were evaluated in both rats and dogs. This study is described below as it is considered the most appropriate reproductive study for consideration as the key study for risk assessment.
In the 90-day rat study, Sprague-Dawley rats (10/sex/dose/substance) were administered borax or boric acid in the diet at concentrations of 52.5, 175, 525, 1750 or 5250 ppm (calculated as 0, 2.6, 8.8, 26.3, 87.5 and 262.5 mg B/kg bw per day in U.S. EPA, 2008) for 90 days (Weir and Fisher, 1972). The highest dose caused 100% mortality. Complete atrophy of testes was seen in male rats in the 87.5 mg B/kg bw per day dose group, and partial atrophy was reported in four males in 26.3 mg B/kg bw per day dose group. Effects observed at these two doses included rapid respiration, inflamed eyes, swollen paws and desquamated (peeling) skin on paws and tail. No clinical signs of toxicity were seen below the dose of 26.3 mg B/kg bw per day. Based on systemic toxicity, the NOAEL of 8.8 mg B/kg bw per day can be identified from this 90-day study.
In the 2-year rat study, Sprague-Dawley rats (35/sex/dose/substance in treated groups; 70 unexposed controls/sex) were exposed to 0, 117, 350, or 1170 ppm of boron as borax or boric acid daily in the diet for 2 years (Weir and Fisher, 1972). Boron equivalent doses were estimated as 0, 5.9, 17.5, or 58.5 mg B/kg bw per day for both sexes (U.S. EPA, 2008). Five rats/sex/dose were sacrificed at 6 and 12 months and all surviving animals were sacrificed after 2 years. No treatment-related effects were observed in rats receiving 5.9 or 17.5 mg B/kg bw per day. Signs of toxicity observed in rats in the 58.5 mg B/kg bw per day dose group included swelling and desquamation of the paws, scaly tails, inflammation of the eyelids, and bloody discharge from the eyes. Moreover, in the high dose group, the scrotum appeared shrunken in male rats, and both males and females showed decreased food consumption and suppressed growth. A significant (p<0.05) decrease (80-84%) was reported in testes weight and the testes:body weight ratio as early as 6 months in the 58.5 mg B/kg bw per day group which remained significantly below that of controls at 12 and 24 months. Brain and thyroid:body weight ratios were significantly (p<0.05) increased in the 58.5 mg B/kg bw per day animals but no microscopic changes were observed in these organs. Severe testicular atrophy was observed in all high-dose males at 6, 12 and 24 months. The seminiferous epithelium was atrophied and the tubular size in the testes also decreased in male rats. Based on systemic and testicular effects, a NOAEL of 17.5 mg B/kg bw per day can be identified from the 2-year rat study.
Weir and Fisher (1972) also evaluated the effects of repeated dose boric acid and borax exposure in young dogs. It should be noted, however, that in their assessment, Health Canada’s Pest Management Regulatory Agency (PMRA) identified several discrepancies in the published dog studies compared to the original study data (also coordinated or supervised by Weir) (PMRA, 2012, 2016). Where possible, and as was previously done in the PMRA assessment, this assessment relies on the original study data.
In the 90-day study, young beagle dogs (5/sex/dose/substance) were given borax or boric acid in diet for 90 days at concentration of 17.5, 175 and 1750 ppm (doses calculated as 0, 0.33, 3.9 and 30.4 in males and 0, 0.24, 2.5 and 21.8 mg B/kg bw per day in females in U.S. EPA, 2008). No clinical signs of toxicity were observed and all dogs appeared normal for 90 days (except 1 high dose male which died on day 68 from complications of diarrhea and severe congestion of the kidneys and intestinal mucosa). A decrease in testis: body weight ratio was seen in two mid-dose (3.9 mg B/kg bw per day) dogs and testicular atrophy was noted in all males in the highest dose group (30.4 mg B/kg bw per day). Exposure to 30.4 mg B/kg bw per day also caused breakdown of red blood cells and effects on the thyroid gland in both sexes. Based on reproductive toxicity in males and systemic toxicity in males and females, NOAELs of 3.9 and 2.5 mg B/kg bw per day can be identified for males and females, respectively. In their assessment of boron, the PMRA combined the results of the 90-day boric acid and borax studies to calculate a benchmark dose and lower confidence limit (BMDL) of 2.90 mg/kg bw per day, based on testicular effects (PMRA, 2012, 2016).
In the two-year study, young beagle dogs (4/sex/dose) were exposed to borax or boric acid in the diet at doses of 0, 58, 117, and 350 ppm boron (calculated as 0, 1.4, 2.9, and 8.8 mg B/kg bw per day by U.S. EPA, 2008) for 104 weeks. A 52-week interim sacrifice and a 13-week recovery period were allowed for some dogs after cessation of exposure. One control male dog was sacrificed at week 52, two dogs were sacrificed after 104 weeks and one dog was sacrificed after 104 weeks of treatment followed by a subsequent 13 weeks of the recovery period. Testicular atrophy was observed in one control dog sacrificed after the 104 week exposure + 13 week recovery period, and in one dog in the high dose group sacrificed after 104 weeks of exposure. A NOAEL of 8.8 mg B/kg bw per day can be derived from this study.
An additional test group of dogs (n = 4/sex/dose/substance) were given borax or boric acid in the diet at 0 and 1170 ppm (0 and 29.2 mg B/kg bw per day) for 38 weeks. Interim sacrifice of two dogs at 26 weeks revealed testicular atrophy and spermatogenic arrest. After 38 weeks of exposure, one dog showed a decrease in spermatogenesis and the other had testicular atrophy. Following a 25 day recovery period, testicular degeneration was not as severe as those found in the control dogs. Based on observed testicular atrophy and spermatogenic arrest observed in this 38-week study, a LOAEL of 29.2 mg B/kg bw per day is identified.
| Species, Sex (Number) | Exposure | POD (mg B/kg bw per day) |
Critical effect(s) | Key Strength and/or Weakness | Ref. | |
|---|---|---|---|---|---|---|
| Duration | Compound; DosesFootnote a (mg B/kg bw per day) |
|||||
| Developmental Studies | ||||||
| Mice, CD-1, F (29/group) |
GD 0-17 | Boric acid (diet); 0, 43.4, 79, 175 | Maternal NOAEL = 43.4 | Maternal effects: increased kidney weight, increased incidence of renal tubular dilation | Well conducted study; limited evaluation of maternal toxicity | Heindel et al., 1992, 1994 |
| Developmental NOAEL = 43.4 | Fetal effects: decreased body weight, increased frequency of fetal resorptions and fetal malformations (most commonly short rib XIII) | |||||
| Rats, Sprague-Dawley, F (29/group) | (i) GD 0-20 (ii) GD 6-15 |
Boric acid (diet); (i) 0, 13.6, 28.5, 57.7, and (ii) 0, 94.2 | Maternal NOAEL = 13.6 | Maternal effects: increased liver and kidney weights | Well conducted study; limited evaluation of maternal toxicity | |
| Developmental LOAEL = 13.6 | Fetal effects: decreased body weight, increased fetal resorptions and malformations (most commonly observed as enlargement of brain ventricles and short rib XIII) | |||||
| Rabbits, New Zealand, F (20-23/ group) | GD 6-19 | Boric acid (gavage); 0, 10.9, 21.9, 43.7 | Maternal NOAEL = 21.9 | Maternal effects: decreased body weight, increased kidney weight | Well conducted study; limited evaluation of maternal toxicity | |
| Developmental NOAEL = 21.9 | Fetal effects: increased frequency of fetal resorptions, increased frequency of litters with no live fetuses, fetal malformations (primarily cardiovascular) | Heindel et al., 1994 | ||||
| Rats, Sprague Dawley, F (60/group) | (i) GD 0-20 (ii)GD 0-20, follow-up until PND21 |
Boric acid (diet); (i) 0, 3.3, 6.3, 9.6, 13.3, and (ii) 0, 3.2, 6.3, 9.8, 12.9, 25.3 | Maternal NOAEL > 25.3 | Maternal effects: None ) | Well conducted study; limited evaluation of maternal toxicity | Price et al., 1996 |
| Developmental NOAEL = 9.6 | Fetal effects: Decreased body weight (only in rats exposed on GD 0 - 20), skeletal malformations (primarily short rib XIII) | |||||
| Repeated Dose Studies with Reproductive Endpoints | ||||||
| Dogs, beagle M&F (5/group) | 90 days | Boric acid, borax (diet); M: 0, 0.33; 3.9, 30.4; F: 0, 0.24, 2.5 and 21.8 | NOAEL(M) = 3.9 | Reproductive effects: Decreased testis:bw ratio, testicular atrophy, degeneration of spermatogenic epithelium | Use of young dogs; control dogs shared in boric acid and borax treatment groups | Study no. 1237735 and 1249382 (as cited in PRMA, 2012) |
| NOAEL(F) = 2.5 | Systemic effects: Decreased thyroid weight, histopathological changes in thyroid gland (e.g., presence of solid epithelial nests, minute follicles), increased brain:bw ratio, elevated breakdown of red blood cells | |||||
| Dogs, beagle M&F (4/group) | (i) 2 years (ii) 38 weeks |
Boric acid, borax (diet): (i) 0, 1.4, 2.9, and 8.8 (ii) 0, 29.2 | NOAEL(2yr) = 8.8 | Reproductive effects: 2 year study: histopathological changes in thyroid. 38 wk study: testicular atrophy and degeneration (reversible after 25wk recovery period in 1 dog), decreased spermatogenesis | Use of young dogs; control dogs shared in boric acid and borax treatment groups | Study no. 1249414, 1249387 (2-year studies), and 1249410 1249383 (38-week studies) (as cited in PMRA, 2012) |
| LOAEL(38wk) = 29.2 | Systemic effects: None | |||||
| Repeated Dose Studies with Reproductive Endpoints | ||||||
| Rat, Sprague Dawley M&F (10/group) | 90 days | Boric acid, borax (diet): 0, 2.6, 8.8, 26.3, 87.5, 262.5 | NOAEL = 8.8 | Reproductive effects: Testicular atrophy Systemic effects: Mortality, rapid respiration, inflamed eyes, swollen paws, desquamated skin on paws and tail | Well conducted study | Weir and Fisher, 1972 |
| Rat, Sprague Dawley M&F (35/group) | 2 years | Boric acid, borax (diet): 0, 5.9, 17.5, 58.5 | NOAEL = 17.5 | Reproductive effects: Increased testes weight, testicular atrophy, atrophy of seminiferous epithelium Systemic effects: Swelling and desquamation of paws, scaly tails, inflamed eyes, bloody discharge from eyes, decreased food consumption, suppressed growth rates, reduction in body weight gain, increased brain and thyroid:body weight ratios | Well conducted study | |
| Mice, B6C3F1, M&F (10/group) | 90 days | Boric acid (diet); M: 0, 34, 70, 141, 281, 563; F: 0, 47, 97, 194, 388, 776 | LOAEL = 34 | Reproductive effects: testicular degeneration, atrophy of seminiferous tubules Systemic effects: mortality, extramedullary hematopoiesis | High doses | Dieter, 1994 |
| Mice, B6C3F1, M&F (10/group) | 2 years | Boric acid (diet); 0, 48, 96 | LOAEL = 48 | Reproductive effects: testicular atrophy interstitial, cell hyperplasia Systemic effects: mortality (males only), reduced body weight gain, increased splenic lymphoid depletion | Only two doses tested | |
| Rats, Evans, M (15/group) | 70 days | Borax (drinking water); 0, 23.7, 44.7 | LOAEL = 23.7 | Reproductive effects: Decreased testes weight, impaired spermatogenesis Systemic effects: Decreased body weight | Drinking water exposure | Seal and Weeth, 1980 |
|
||||||
2.3 Mode of action
Although numerous studies have attempted to elucidate the mode of action of boron toxicity, no single mechanism has been agreed upon in the literature. The mechanism implicated in boron’s reproductive effects is proposed to be related to a delay in spermiation followed by testicular atrophy at higher doses. Studies conducted in rats suggest that boron affects the sertoli cell by impairing energy production which eventually results in delayed spermiation and disruption of spermatogenesis (Fail et al., 1998). The mechanism implicated in boron’s developmental effects may be related to inhibition of mitotis by boric acid (Fail et al., 1998) and/or inhibition of histone deacetylase (Di Renzo et al., 2007). It has also been proposed that boron binds to and is a reversible inhibitor of cyclic ADP ribose, which can lead to a decrease in intracellular calcium release that is necessary for many processes including insulin release, bone formation and brain function (Nielsen, 2014).
The literature to date provides no indication of a difference between the mode of action in animals as compared to humans. A full analysis of the mode of action of boron toxicity was not conducted as it is not critical to the selection of a POD or to the derivation of a HBV for boron.
2.4 Selected key study
Two key studies were considered in the risk assessment for boron: a reproductive study (testicular effects) in dogs and rats by Weir and Fisher (1972) and a developmental study (reduced fetal body weights and skeletal malformations) in rats by Price et al. (1996).
The male reproductive tract is a target of boron toxicity in animals as indicated by testicular, sperm and fertility effects observed in dogs and rodents, with dogs being the most sensitive species. Of all the chronic animal studies in the literature showing male reproductive effects, the lowest POD observed was from the 90-day dog study by Weir and Fisher (1972). Based on the combined results of the 90-day boric and boric acid studies, a BMDL of 2.90 mg/kg bw per day was previously derived by the PMRA (PMRA, 2012, 2016). Selection of the Weir and Fisher (1972) 90-day dog study is consistent with other Canadian assessments of boron, conducted under the Canadian Environmental Protection Act (ECCC and HC, 2016) and the Pest Control Products Act (PMRA, 2012, 2016). While this study did have some limitations (e.g., control animals were shared in the boric acid and borax studies, and there may be difference in responses between young and adult dogs), it does still provide strong evidence for male reproductive effects. Moreover, while the epidemiological literature on boron is insufficient for deriving a POD for risk assessment (see section 2.2.2), they are considered insufficient to confirm the absence of effects in humans (ECCC and HC, 2016), and effects observed in boron workers qualitatively support the selection of animal reproductive toxicity studies for risk assessment.
The Price et al (1996) developmental rat study was also considered as a candidate for selection of the key study. This study provided a developmental NOAEL of 9.6 mg/kg bw per day, based on decreased fetal body weight, an effect that was observed in the absence of maternal toxicity, indicating the potential for sensitivity of offspring to boron exposure. While this rat study was generally well conducted, the exposure was limited to a 20-day in utero exposure, the study had limited evaluations of fetal and maternal toxicity, and reduced fetal body weights appeared to be reversible following birth (at PND 21).
Selection of the Weir & Fisher (1972) 90-day dog study, which has a lower POD, is considered more conservative, and is still considered to be adequately protective of developmental effects that may occur.
3.0 Derivation of the health based value (HBV)
Reproductive and developmental effects are the most sensitive effects, and most frequently and consistently observed across a variety of animal species following boron exposure. The critical effect considered most appropriate for deriving a POD is the reduction in testicular weight observed in a repeated dose study in dogs, which are considered to be the most sensitive species (Weir & Fisher, 1972).
To derive a HBV for boron, the BMDL of 2.90 mg/kg bw per day was employed (PMRA, 2012, 2016; ECCC and HC, 2016). This BMDL is based on testicular effects, and was the lowest BMDL calculated using four models for continuous data. BMD modelling was used over the NOAEL/LOAEL approach because it offers better dose-response characterization by including all experimental data to determine PODs independently of pre-established dose levels.
A total uncertainty factor of 300 was considered appropriate for assessment of boron in drinking water. This is comprised of uncertainty factors of 10 for interspecies variability, 10 for intraspecies variability and 3 for database uncertainties.
A default 10-fold interspecies uncertainty factor was employed because little to no data on the toxicokinetics of boron in dogs exists which would allow refinement of this uncertainty factor.
A default 10-fold intraspecies uncertainty factor was employed to account for variability within the human population (e.g., difference in clearance during pregnancy, which may not necessarily protect the fetus from developmental effects of boron exposure, and individual difference in boron toxicokinetics.
The 3-fold database uncertainty factor was selected to account for the quality of the database, and the fact that histological changes in the testes likely occur at lower dose levels than those associated with decreases in testicular weight (Fail et al., 1998; Ku et al., 1993; PMRA, 2012, 2016).
Using the BMDL of 2.90 mg B/kg bw per day, the tolerable daily intake (TDI) for boron is calculated as follows:

Equation 1 - Text Equivalent
The tolerable daily intake (TDI) of boron is 0.01 mg/kg body weight per day. This is calculated by dividing the BMDL of 2.90 mg/kg body weight per day by the uncertainty factor of 300.
where:
- 2.90 mg/kg bw per day is the BMDL, calculated based on decreased testicular weight observed in the dog study of Weir & Fisher (1972) (PMRA, 2012, 2016); and,
- 300 is the total uncertainty factor, which accounts for interspecies variation (×10), intraspecies variation (×10), and database deficiencies (×3).
Using this TDI, the HBV for boron in drinking water is calculated as follows:
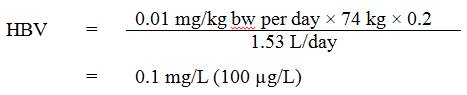
Equation 2 - Text Equivalent
The health based value (HBV) for boron in drinking water is 0.1 mg/L. This is calculated by multiplying the TDI for boron of 0.01 mg/kg body weight per day by the average adult body weight of 74 kg, then by 0.2, the allocation factor denoting the contribution of drinking water to the tolerable daily intake, and dividing the resulting product by 1.53 L/day, the drinking water intake rate for an adult.
where:
- 0.01 mg/kg bw per day is the TDI derived above;
- 74 kg is the average body weight for an adult (Health Canada, in preparation);
0.2 is the allocation factor for drinking water. Based on Canadian drinking water intake estimates of 3 to 16% (see Section 1.3), the floor value of 20% for drinking water is appropriate (Krishnan and Carrier, 2013). - 1.53 L/day is the drinking water intake rate for an adult (Health Canada, in preparation). A multi-route exposure assessment (Krishnan and Carrier, 2008) found that dermal and inhalation exposures through showering or bathing represent negligible routes of exposure to boron.
4.0 Analytical and Treatment Considerations
4.1 Analytical methods to detect boron
4.1.1 Standardized methods
Standardized methods available for the analysis of total boron in drinking water and their respective method detection limits (MDL) are summarized in Table 3. MDLs are dependent on the sample matrix, instrumentation, and selected operating conditions and will vary between individual laboratories. Analysis of boron should be carried out as directed by the responsible drinking water authority. Drinking water utilities should discuss sampling requirements with the accredited laboratory conducting the analysis to ensure that quality control procedures are met and that minimum reporting levels (MRLs) are low enough to ensure accurate monitoring at concentrations below the maximum acceptable concentration (MAC).
| Method (Reference) |
Methodology | MDL (µg/L) | Interferences/Comments |
|---|---|---|---|
| U.S EPA Methods | |||
| EPA 200.5 Rev. 4.2 (U.S. EPA, 2003) |
Axially viewed inductively coupled plasma- atomic emission spectrometry (AVICP-AES) (wavelength 249.68 nm) | 0.3 | Matrix interferences: Ca, Mg and Na > 125 mg/L and Si >250 mg/L |
| EPA 200.7 Rev. 4.4 (U.S. EPA, 1994) |
Inductively coupled plasma -atomic emission spectrometry (ICP-AES) (wavelength 249.68 nm) | 3.0 | Matrix interferences: TDS >0.2% weight per volume (w/v) |
| APHA Standard Methods | |||
| SM 3120B (APHA, 2017) |
Inductively coupled plasma - atomic emission spectrometry (ICP- AES) (wavelength 249.77 nm) | 5.0 | Matrix interference: TDS >1500 mg/L |
| SM 3125 (APHA, 2017) |
Inductively coupled plasma - mass spectrometry (ICP-MS) | N/A | ICP-MS method can be applied successfully for boron determination even though it is not specifically listed as an analyte in the method (as cited in SM 4500B A). |
| SM 4500-B.B (APHA, 2017) |
Colorimetric method using curcumin reagent and spectrophotometer (540 nm) | 0.2Footnote a | Applicable for boron concentrations in a range from 0.1 to 1.0 mg/L. Interference: Na > 20 mg/L and hardness >100 mg/L as CaCO3 |
| SM 4500-B.C (APHA, 2017) |
Colorimetric method using carmine reagent and spectrophotometer (585 nm) | 2Footnote a | Applicable for boron concentrations in a range from 1.0 to 10 mg/L. Less sensitivity and requires the use of concentrated sulphuric acid. |
|
|||
4.1.2 Online and portable colorimetric field kits
Commercial online and portable test kits are available for quantifying dissolved boron in source and drinking water and are generally based on colorimetric azomethine-H and carmine methods (ISO, 1990; APHA, 2017). The commercial online analyzers are capable of continuously measuring boron concentrations in the range of 0–500 µg/L with higher concentrations (up to 50 mg/L) requiring dilution. Portable test kits can be used to obtain a rapid measurement of boron concentrations in drinking water. In general, available commercial test kits using the azomethine-H method are capable of measuring boron concentrations in the range of 0.05 - 2.5 mg/L; while the carmine method is applicable for concentrations in the range of 0.2 - 14 mg/L. To accurately measure boron using these units, utilities should develop a quality assurance and quality control (QA/QC) program such as those outlined in SM 3020 (APHA et al., 2017). Periodic verification of results using an accredited laboratory is recommended.
4.1.3 Sample preservation and preparation
Total boron includes both the dissolved and particulate (suspended) fractions of boron in a water sample and is analyzed using methods for total recoverable boron. Analysis of total boron is needed for comparison to the MAC.
Sample processing considerations for analysis of boron in drinking water (i.e., sample preservation, storage, digestion, etc.) can be found in the references listed in Table 3. Accurate quantification of dissolved, particulate and total metals in samples is dependent on the proper sample preservation and processing steps. SM 3030B and SM 3030D provide guidance on filtration, preservation (acidification) and digestion procedures for the determination of dissolved or particulate metals (APHA et al., 2017). In order to determine dissolved boron concentrations, samples should be filtered at the time of collection (not at the laboratory) and the filtrate should be acidified to pH < 2 with concentrated nitric acid.
4.2 Treatment considerations
Published data on boron removal in water are primarily from seawater desalination and geothermal water treatment plants (Kabay et al., 2015). These data show that drinking water treatment technologies that are effective for boron removal are reverse osmosis (RO) and ion exchange (IX) using boron-selective resins and combinations of these processes (Kabay et al., 2010; Hilal et al., 2011; Farhat et al., 2013; Guler et al., 2015). Information on the removal efficiencies of boron and the operational conditions of treatment plants are reported below as they provide an indication of the effectiveness of treatment technologies for boron removal (see Tables 4-5).
As discussed in section 1.3, in the areas of Canada where boron is found in groundwater, concentrations are generally below 5 mg/L with maximum concentrations reaching 7 to 8 mg/L. Since this water quality will be significantly different than seawater, adjustments to the typical operation of the desalination plants reported below may be needed. The selection of an appropriate treatment process for a specific water supply will depend on many factors, including the raw water source and its characteristics, the operational conditions of the selected treatment method and the utility’s treatment goals. Pilot testing is recommended to ensure the source water can be successfully treated.
4.2.1 Boron chemistry
The species of boron present in water entering a treatment plant is an important factor in determining the effectiveness of treatment as smaller, neutral species are generally more difficult to remove than larger, charged species. The two main species of boron present in natural waters are boric acid (B(OH)3) and borate (B(OH)4-). The distribution of these species is controlled predominantly by pH with ionic strength and temperature also having a minor effect (Hilal et al., 2011; Kochkodan et al., 2015). In fresh water (temperature = 25oC) at pH below 9.2 the major species is boric acid and at higher pH borate is the major species (Kabay et al., 2010; Hilal et al., 2011; Kochkodan et al., 2015).
4.2.2 Municipal-scale
Boron is not removed by drinking water treatment technologies commonly used for surface and groundwater sources such as chemically assisted filtration and/or chlorination (Parks and Edwards, 2005; Tagliabue et al., 2014). Therefore, alternative treatment processes, such as those discussed below, are needed for boron removal.
4.2.2.1 Reverse Osmosis (RO)
Reverse osmosis (RO) is the most widely used process for boron removal (Guler et al., 2015; Kabay et al., 2018a). When boron is present as borate (B(OH)4-) in source water, it is effectively rejected (> 95% removal) using standard RO membranes by diffusion and charge repulsion by negatively charged membranes (Bodzek et al., 2015; Guler et al., 2015). However, when boron is predominantly in the form of boric acid (pH < 9.2) rejection is lower (40-70%) because it is a smaller, neutral species (Magara et al., 1996; Hilal et al., 2011; Farhat et al., 2013; Bodzek, 2015; Guler et al., 2015; Kabay et al., 2015). Since most source waters have a pH lower than 9.2, design and process modifications are needed to standard RO systems in order to achieve low treated water boron concentrations.
The most common approaches for boron removal using RO are single and multi-pass RO, RO with increased pH, and the use of high boron rejection membranes or a combination of these processes (Redondo et al., 2003; Hilal et al., 2011). The key parameters that affect boron removal using RO include feed water quality (pH, temperature, total dissolved solids), properties of the membrane and system design and operation (average permeate flux, recovery, and operating pressure) (Redondo et al., 2003; Guler et al., 2011; Tomaszewska and Bodzek, 2013; Viatcheslav et al., 2015). Boron removal data from pilot and full-scale treatment plants is reported in Table 4.
Single-pass RO is the simplest system to design and operate for boron removal. Full-scale treatment plants using single-pass seawater reverse osmosis (SWRO) have been shown to decrease boron concentrations of up to 5 mg/L to approximately 0.9 to 1.8 mg/L in treated water (65–85% rejection), depending on the membrane type and recovery ratio of the system (Kabay et al., 2010; Viatcheslav et al., 2015). Data presented in Table 4 indicate the operational conditions used by treatment plants to achieve treated water concentrations below 2 mg/L. Several authors have noted that low boron concentrations (< 0.5 mg/L) are rarely reached for single-pass reverse osmosis seawater desalination plants equipped with standard commercially available RO membranes (Hilal et al., 2011; Guler et al., 2015; Kabay et al., 2015; Kabay et al., 2018a).
An important consideration for water utilities is selection of an appropriate membrane, in particular for single-pass RO systems because boron rejection (removal) varies considerably depending on the properties of the membranes used in the system. Under standard laboratory test conditions brackish water RO (BWRO) membrane boron rejection ranges from 40 to 80% and standard SWRO membrane boron rejection ranges from 82 to 92% (Redondo et al., 2003; Gorenflo et al., 2007; Kabay et al., 2010; Tu et al., 2010). In comparison, high boron rejection membranes can achieve removals from 93 to 96%; however these membranes usually have higher feed pressure requirements (Guler et al., 2015; Viatcheslav et al., 2015).
| Influent (mg/L) |
Effluent (mg/L) |
Rejection (%) |
Process Description | Operating Conditions | Reference |
|---|---|---|---|---|---|
| Single pass RO | |||||
| 2.55 | 0.21 | 91% | Single pass SWRO treatment of seawater (full-scale) | P: 39.3 bar T: 12.8 oC Recovery: 50% Permeate flow rate : 155 m3/h pH: 7.3 |
Busch et al. (2003 |
| 4.0 | 1.17 | 70.5 % | Single pass SWRO treatment of seawater (full-scale). | P: 801 psi T: N/A Recovery: 50% Permeate flow rate : 17.2 gpm pH: 6.69 – 8.03 |
Kim et al. (2009) |
| 5.6 | 0.52 | 91.5% (average) | Single pass SWRO treatment of seawater (full-scale). | P: 63.5 bar T: 22oC Recovery: 36% Permeate flow rate: 1200 m3/h pH: 7.0 |
Busch et al. (2003) |
| 5 | 0.5- 2.0 | 60 - 90% | Single pass SWRO with standard membranes (full-scale). | P: 6.5-7.5 MPa T: 18 -26oC Recovery : 37 – 47 % Permeate flow rate: 7200 m3/d pH: 8 |
Ruiz-Garcia et al. (2019) |
| 0.25 -0.75 | 85-95% | Single pass SWRO with high boron rejection membranes (full-scale). | |||
| 2.53 | 1.0 | 56 % (average) | Single pass BWRO treatment of geothermal water (pilot-scale). | P: 1.1 MPa T: 30oC Recovery: 75-78 % Permeate flow rate: 1 m3/h pH: 5 |
Tomaszewska and Bodzek (2013) |
| Two pass or two stage RO | |||||
| 6.83-9.45 | 0.16 -0.44 | 96.83 % (average) |
Two pass low pressure BWRO treatment of geothermal water (pilot-scale). | P: 1.0 MPa T: 30oC Recovery: 75% Permeate flow rate: 1 m3/h pH: 1st pass acidified to pH 5 (to prevent scaling), 2nd pass pH increased to 10-11 |
Tomaszewska and Bodzek (2013) |
| 5.0 | 0.65-0.95 | 83 - 87 % | Two stage SWRO treatment of seawater. 1st stage using high pressure SWRO boron rejection membranes. 2nd stage lower pressure SWRO membranes (full-scale). | P: N/A T: 14 - 27oC Recovery: 50% Permeate flow rate: 515 m3/h pH: stage 1 feed pH 8.0 increased to 8.6 during summer (27oC); 0.9 to 1.3 mg/L anti-scalant added |
Franks et al. (2013) |
| 4.98-5.21 | 0.79 -0.86 | 90 % (normalized rejection over two stages) |
Two stage high recovery RO plant using SWRO membranes (full-scale). | P: 59 -66 bar T: 22oC Recovery : 55% Permeate flow rate: 295 m3/h pH: feed acidified to 7.0 – 7.3 |
Redondo et al. (2003) |
| Multi-stage (i.e., 3+) RO | |||||
| 4 - 5 | < 0.3 | 92-94% (across all stages) |
Multi-stage cascade SWRO treatment of seawater. Part of 1st stage RO permeate treated in 2nd stage with high pH, low recovery. Concentrate from 2nd stage treated in 3rd and 4th stage to remove hardness and additional boron (full-scale). | P (normalized): 7.3-11 bar (2nd stage), 8.5-12 bar (3rd stage), 8.2-10.5 (4th stage) T: 19 – 32 oC Recovery (overall): > 95% Permeate flow rate: 330, 000 m 3 /d pH: 7- 8 (1st stage), 10 (2nd stage), 6.5 (3rd stage), > 10 (4th stage) |
Gorenflo et al. (2007) |
| p: feed pressure; T: temperature; N/A: not available; SWRO: seawater reverse osmosis: BWRO: brackish water reverse osmosis. | |||||
In cases where greater boron removal needs to be achieved, more complex RO systems (e.g., multi-pass RO system (with or without pH adjustment)) need to be installed (Tomaszewska and Bodzek, 2013; Viatcheslav et al., 2015). A variety of design configurations have been used and are reported in Hilal et al. (2011). The most common approach is to use a two pass RO system with an increase in pH prior to the second pass. Increasing pH to greater than 10 in the second pass feed water can increase boron rejection from 65% to between 90 and 99% depending on the type of membranes used in each pass (Gorenflo et al., 2007; Redondo et al., 2003; Koseglu et al., 2008; Tomaszewska and Bodzek, 2013; Freger et al., 2015; Viatcheslav et al., 2015). An important consideration for systems that are conducting pH adjustment is the potential for scaling of the membranes which is highly dependent on the source water quality (Koseoglu et al., 2008).
Other water quality parameters that influence the removal of boron and other dissolved parameters using RO include temperature and total dissolved solids (TDS) concentration. Boron removal decreases as temperature increases and process adjustments may be needed to maintain treated water boron concentrations below the desired level. Conversely, as TDS increases boron removal increases as the dissociation ratio shifts to a lower pH which results in greater rejection of boron (Guler et al., 2011).
4.2.2.2 Ion exchange (IX)
Ion exchange (IX) is an effective treatment technology for the removal of boron. In general, removal of boron using a traditional strong base anion exchange resin is not efficient due to the presence of other anions such as bicarbonate, sulphate and chloride that compete for exchange sites with borate. In addition, strong base anion exchange is not effective unless the pH is above 9.2 (so that boron is present as borate ions) which is rarely applied for this process. As a result, boron selective resins (BSRs) have been developed (Kabay et al., 2010; Hilal et al., 2011; Wang et al., 2014; Yoshizuka and Nishihama, 2015; Kabay et al., 2018b). The most common BSRs are chelating ion exchange resins synthesized by using macroporous crosslinked polystyrenic matrices that are functionalized with an N-methyl-D-glucamine (NMDG) group. The NMDG group forms a covalent attachment with boron which then forms an internal complex in the resin. This is also referred to as an adsorption process as it does not follow standard ion exchange processes. The formation of these complexes does not require boric acid dissociation; therefore, treatment can be effective over a wide pH range (Bodzek, 2015). A number of boron selective chelating resins are available commercially with theoretical boron capacities ranging from 0.6 to 1.2 eq/L. Details on the types and performance of various resins are discussed in greater detail by Hilal et al. (2011), Wang et al. (2014), and Kabay et al. (2018b)
The removal of boron by BSRs depends on several design/process parameters (type of resin, flow rate, height/depth ratio of resin) and water quality characteristics (influent boron concentration, temperature, pH). In theory low treated water boron concentrations can be achieved using ion exchange in particular if resin regeneration is frequent; however, this is often not operationally practical. Data reported in Table 5 provide an indication of the operational conditions that were used in several treatment plants to achieve removal efficiencies between 93-98 % and treated water concentrations below 0.50 mg/L (Kabay et al., 2004; Jacob et al., 2007; Santander et al., 2013). The major limitation of IX using BSRs is regeneration and neutralization of the saturated resin as it requires a large volume of chemicals (acid and bases) that must be carefully handled. This is problematic in terms of not only the training required to operate these types of systems but also the high cost of regeneration chemicals (Wolska and Bryjak, 2013; Bodzek, 2015; Guan et al., 2016). To reduce costs, system design often includes treating only a portion of the water for boron removal followed by blending with other water within the treatment plant.
| Source Water | Influent (mg/L) |
Effluent (mg/L) |
Process Details | Breakthrough (BV) |
Reference |
|---|---|---|---|---|---|
| Desalinated RO permeate | 1.5 | 0.1 from IX | Full-scale: Treatment of 74% of RO permeate using IX followed by blending with 26 % of untreated permeate. Resin: macroporous poly(styrene-co- DVB) with NMDG functional group Resin diameter: 300-1200 µm, Flow rate: 30 BV/h |
750 – 800 | Jacob (2007) |
| 0.47 blended treated water concentration | |||||
| Geothermal water | 18 - 20 | < DL | Small pilot-scale column study Resin: macroporous macroporous poly(styrene-co- DVB)with NMDG functional group, diameter 300-1200 µm, Flow rate: 15 BV/h |
80 – 100 | Kabay et al. (2004) |
| Geothermal water | 10.2 | 0.3 mg/L (defined as breakthrough concentration) | Fixed bed column study Resin: cellulose based fiber containing NMDG functional group diameter 100 µm. Resin diameter: 100 µm Flow rate: 15 – 30 BV/h Column: diameter = 0.7 cm, 0.5 mL of fiber |
225 (flow rate: 15 BV/h) | Recepoglu et al. (2018) |
| Geothermal water | 10.5-10.9 | 0.5 mg/L (defined as breakthrough concentration) | Fixed bed column study Resin: novel resin poly(N-(4-vinylbenzyl)-(N-methyl-D-glucamine), particle size 0.180-0.250 mm. Flow: 15 BV/h Column: diameter = 0.7 cm, 0.5 mL of resin |
234 | Santander et al. (2013) |
| DL:detection limit; BV: bed volume; NMDG: N-methyl-D-glucamine. | |||||
The effect of process parameters on boron removal using BRSs is summarized by Hilal et al. (2011), Bodzek et al. (2014), Yoshizuka and Nishihama (2015) and Ipek et al. (2016). The breakthrough point of a column is a critical parameter indicating the effectiveness of boron removal as it is directly connected to resin capacity. Studies have demonstrated that breakthrough column capacity decreases with increased flow rate due to decreased contact time between boron in solution and the resin (Kabay et al., 2008a; Yan et al., 2008). An increase in the height to diameter ratio can improve the breakthrough capacity as it increases the contact time and it enhances the liquid distribution in the column (Yan et al., 2008).
4.2.3 Residential-scale
In cases where boron removal is desired at the household level, for example, when a household obtains its drinking water from a private well, a residential drinking water treatment unit may be an option for decreasing boron concentrations in drinking water. Before a treatment unit is installed, the water should be tested to determine the general water chemistry and boron concentration in the source water. Periodic testing by an accredited laboratory should be conducted on both the water entering the treatment unit and the treated water, to verify that the treatment unit is effective. Units can lose removal capacity through use and time and need to be maintained and/or replaced. Consumers should verify the expected longevity of the components in the treatment unit according to the manufacturer’s recommendations and service it when required.
Health Canada does not recommend specific brands of drinking water treatment units, but it strongly recommends that consumers use units that have been certified by an accredited certification body as meeting the appropriate NSF International Standard/American National Standard (NSF/ANSI) for drinking water treatment units. These standards ensure the material safety and performance of products that come into contact with drinking water. Certification organizations provide assurance that a product conforms to applicable standards and must be accredited by the Standards Council of Canada (SCC). Accredited organizations in Canada (SCC, 2019) include:
- CSA Group (www.csagroup.org);
- NSF International (www.nsf.org);
- Water Quality Association (www.wqa.org);
- UL LLC (www.ul.com);
- Bureau de Normalisation du Québec (www.bnq.qc.ca); and
- International Association of Plumbing and Mechanical Officials (www.iapmo.org).
An up-to-date list of accredited certification organizations can be obtained from the SCC (www.scc.ca).
The drinking water treatment units that are expected to be effective for boron removal at the residential-scale include (NGWA, 2018):
- reverse osmosis (RO); and
- distillation
The effectiveness of RO units for boron removal is dependent on the membrane (filter) type and pH of the water and anticipated removals range from 50 to 90% (based on municipal-scale data). Therefore, an RO system will need to be carefully selected in order to achieve treated water concentrations below the proposed MAC. In addition, it may be necessary to pre-treat the water to reduce fouling and extend the service life of the reverse osmosis membrane. Although there is a lack of data regarding the use of distillation for removal of boron from drinking water, it is expected to adequately remove boron, because it is effective for the reduction of other inorganic contaminants. However, this process requires a high electrical energy input. Consumers may want to consult a water treatment professional for advice on available treatment systems, as well as installation and maintenance costs, based on their specific water quality
Water that has been treated using reverse osmosis and distillation may be corrosive to internal plumbing components. Therefore, these devices should be installed only at the point-of-use (POU). Also, as large quantities of influent water are needed to obtain the required volume of treated water, these devices are generally not practical for point-of-entry installation.
Although ion exchange is an effective treatment technology for boron removal for municipal-scale systems, it requires the use of a specific type of resin that needs to be regenerated using a large volume of acid. Since this is a complex process that requires extreme care, this type of treatment is not practical at the residential-scale.
Currently, boron is not included in the performance requirements (e.g., reduction claims) of NSF/ANSI standards. However, use of a treatment unit that is certified to the standards for reverse osmosis or distillation will ensure that the material safety of the units has been tested. These standards are NSF/ANSI Standard 58 (Reverse Osmosis Drinking Water Treatment Systems) and NSF/ANSI Standard 62 Drinking Water Distillation Systems (NSF/ANSI, 2018a,b).
4.2.4 Summary of treatment achievability
Data from full and pilot-scale treatment plants indicate that when concentrations of boron are below 8 mg/L in source water, treated water concentrations of less than 2 mg/L are achievable using RO or IX treatment technologies with common design and operating conditions. Achieving a treated water concentration of 2 mg/L gives drinking water treatment providers flexibility in selecting the treatment technology that is best suited for their water quality, existing treatment processes, and available technical and financial resources. Larger municipal systems that have the ability to operate more complex treatment systems, such as multi-pass RO or combinations of treatment technologies, may be capable of achieving treated water concentrations of less than 0.5 mg/L (Hilal et al., 2011).
It is anticipated that elevated boron concentrations may impact some smaller groundwater systems in Canada. For small systems with limited resources, it is important that the treatment system not be overly complex to install and operate. Single-pass RO is the simplest treatment system for boron removal. Data indicate that achieving a treated water concentration of 2 mg/L or less is practical for this type of treatment technology (boron rejection between 65-85%).
Generally, it is recommended that residential-scale treatment devices be certified to meet the NSF International (NSF)/American National Standards Institute (ANSI) standards. Currently, boron is not included in these standards; however POU reverse osmosis treatment units are likely the most applicable at the residential-scale. RO units that are comprised of a single membrane element are expected to achieve greater removal (e.g., > 75%) than municipal-scale systems. Treated water concentrations below 2 mg/L could still be achieved even when maximum source water concentrations are as high as 8 mg/L.
4.3 Distribution system considerations
Although significant research has been conducted in recent years on the potential accumulation and release of contaminants in drinking water distribution systems (Friedman et al., 2010, 2016) no information was found in the literature regarding the presence of boron in distribution system scales. However, given that boron has been shown to adsorb onto aluminum and iron oxides in the environment (section 1.2), it is possible that boron may accumulate within distribution systems where these types of deposits are present.
5.0 Monitoring
All water utilities should implement a risk management approach such as the source-to-tap or water safety plan approach to ensure water safety (CCME, 2004; WHO, 2011, 2012). These approaches require a system assessment to: characterize the source water; describe the treatment barriers that prevent or reduce contamination; identify the conditions that can result in contamination; and implement control measures. Operational monitoring is then established and operational/management protocols are instituted (e.g., standard operating procedures, corrective actions and incident responses). Compliance monitoring is determined and other protocols to validate the water safety plan are implemented (e.g., record keeping, consumer satisfaction). Operator training is also required to ensure the effectiveness of the water safety plan at all times (Smeets et al., 2009).
5.1 Source water characterization
Source water characterization should be part of routine system assessments. Boron is not widely distributed in source water in Canada and tends to be present at elevated concentrations only in groundwater in certain areas. Therefore, utilities should consult the responsible authority to determine if boron may be present in groundwater in their area before establishing monitoring requirements. When boron is present in source water, the frequency of monitoring is linked to treatment and compliance monitoring as discussed below.
5.2 Treatment
Where treatment is required to remove boron, operational monitoring should be implemented to confirm whether the treatment process is functioning as required. The frequency of operational monitoring will depend on the treatment process.
5.3 Compliance monitoring
Compliance monitoring (i.e., paired samples of source and treated water to confirm the efficacy of treatment) should be conducted quarterly.
5.4 Distribution system
Given that no information is available on the potential for boron to accumulate and release in distributions systems, monitoring in the distribution system may not be needed. Utilities that have aluminum or iron oxide deposits may need to confirm that the accumulation and release of boron (along with other metals such as manganese, arsenic and uranium) is not occurring in the system.
5.5 Residential
Boron can be present in groundwater in certain areas in Canada, in particular in Saskatchewan, Manitoba and Ontario. Information on the geographical areas that may have elevated boron concentrations may be available from the appropriate province/territory. Since plants are sensitive to the concentration of boron in water, difficulty in growing some indoor and outdoor plants including browning around the edges of leaves may provide an indication that boron is present in well water. Water containing more than 1 mg/L of boron typically affects some plants and can be used as an indication that well water should be tested for boron. Periodic testing by an accredited laboratory should be conducted to determine if well water contains boron.
6.0 International Considerations
The WHO, U.S. EPA, Australia the European Commission have developed guidelines or advisory values for boron in drinking water (Table 6). WHO (2011), Australia (NHMRC, NRMCC, 2011) and the European Commission (1998) have set guidelines of 2.4, 4 and 1 mg/L, respectively, for boron in drinking water. The U.S. EPA does not have a maximum contaminant level for boron in drinking water but set a lifetime health advisory at 5 mg/L (U.S. EPA, 2008). All agencies values used decreased rat body weights as the critical effect. The differences in the values are attributable to differences in uncertainty factors, allocation factors, body weights and use of BMD modelling versus NOAEL approach.
| Agency | Year | Value (mg/L) | Basis (critical effect, POD & UF) |
|---|---|---|---|
| Regulatory values | |||
| WHOFootnote 1 | 2011 | 2.4 | Critical effect: decreased body weight in rat developmental studies (Heindel et al., 1992, 1994; Price et al 1996), BMD modelling from Allen et al (1996); BMD05 = 10.3 mg/kg bw per day TDI = 0.17 mg/kg bw per day UF = 60 (interspecies = 10; intraspecies = 6) |
| AustraliaFootnote 2 | 2011 | 4 | Critical effect (based on WHO (2004)): decreased body weight in rat developmental study (Price et al., 1996); NOAEL = 9.6 mg/kg bw per day TDI = 0.16 mg/kg bw per day UF = 60 (interspecies = 10; intraspecies = 6) |
| European CommissionFootnote 3 | 1998 | 1 | Information not available |
| Non-regulatory values | |||
| U.S. EPAFootnote 4 | 2008 | 5 (lifetime health advisory) | Critical effect: decreased body weight in rat developmental studies (Heindel et al., 1992, 1994; Price et al 1996), BMD modelling from Allen et al (1996); BMD05 = 10.3 mg/kg bw per day RfD = 0.2 mg/kg bw per day UF = 66 (interspecies = 10.5; intraspecies = 6.3) |
|
|||
7.0 Rationale for Maximum Acceptable Concentration (MAC)
Boron can be present in drinking water supplies through weathering of boron-containing rocks and soils, seawater spray and volcanoes as well as from anthropogenic sources such as wastewater from municipal sewage treatment and industrial processes, pesticide application and other human activities. In most Canadian drinking water supplies boron is below 0.1 mg/L. Higher concentrations of boron (1 – 8 mg/L) can be found in certain areas of Canada, particularly in groundwater supplies in areas with naturally occurring boron. The main source for Canadians’ exposure to boron is through food, although consumer products can also contribute significantly to exposure. Exposure through drinking water can contribute up to 16% of total dietary exposure.
Reproduction and development are considered to be the most sensitive health endpoints for boron toxicity. Studies in humans have found possible associations between boron and effects to reproduction and development; however, these have a number of design limitations and cannot be used for risk assessment. Studies in animals have consistently observed adverse effects to the male reproductive system following ingestion of high levels of boron, which supports effects seen in human studies. Testicular effects observed in dogs were the most sensitive endpoint and are used to establish the HBV of 0.1 mg/L.
The guideline development process considers the ability to measure a contaminant in drinking water. There several analytical methods available for the analysis of total boron in drinking water at concentrations below the HBV.
The guideline development process also considers whether the proposed MAC is practically achievable using current drinking water treatment technologies. For municipal-scale treatment plants, the two most effective and commonly used treatment technologies for boron removal are reverse osmosis and ion exchange using a boron selective resin. Data from treatment plants indicate that a treated water concentration at the HBV of 0.1 mg/L is not achievable for most systems. While ion exchange with a boron selective resin may be theoretically capable of removing boron from drinking water to below 0.1 mg/L, the operating conditions that would be required would be extremely challenging and are not considered to be practical. In general, when source concentrations are 8 mg/L or less, treated water concentrations of less than 2 mg/L are achievable using a variety of treatment technologies with common design and operating conditions.
A MAC of 2 mg/L is proposed for boron in drinking water, based on the following considerations:
- The HBV for boron in drinking water is 0.1 mg/L, derived using a conservative approach intended to protect against potential reproductive effects.
- A treated water concentration at the HBV of 0.1 mg/L is not achievable for most drinking water systems.
- A treated water concentration of 2 mg/L or less is achievable by municipal-scale treatment plants using reverse osmosis or ion exchange technologies with common design and operating conditions.
- The proposed MAC provides flexibility for small groundwater systems to install a single reverse osmosis system which is the simplest treatment technology for boron removal.
- Currently, boron is not included in NSF/ANSI standards for residential treatment units; however reverse osmosis and distillation treatment units are expected to be capable of removing boron to 2 mg/L or less in treated water.
- The proposed MAC of 2 mg/L is considered to be protective of all other health effects, including potential developmental effects observed at higher doses than those for reproductive effects.
In considering treatment achievability and the health risks associated with exposure from boron in drinking water, Health Canada, in collaboration with the Federal-Provincial-Territorial Committee on Drinking Water propose a MAC of 2 mg/L. This proposed MAC generally aligns with established limits in other jurisdictions. As this value exceeds the HBV, efforts should be made to reduce boron in drinking water to levels lower than 2 mg/L where possible. Lower concentrations can be achieved by some drinking water treatment systems depending on the source water quality, the type of treatment technology in place and the operational conditions of the treatment plant.
As part of its ongoing guideline review process, Health Canada will continue to monitor new research in this area and recommend any change to the guideline that is deemed necessary.
8.0 References
- Alberta Environment and Sustainable Resource Development. (2013). Personal communication with Donald Reid, Operations Division
- Alberta Health and Wellness. (2008). The Alberta Biomonitoring Program: Chemical Biomonitoring in Serum of Pregnant Women in Alberta. Edmonton (AB): Alberta Health and Wellness. Available at: http://www.health.alberta.ca/documents/Chemical-Biomonitoring-2008.pdf
- Allen, B.C., Strong, P.L., Price, C.J., Hubbard, S.A. and Daston, G.P. (1996). Benchmark dose analysis of developmental toxicity in rats exposed to boric acid. Fundam. Appl. Toxicol., 32(2): 194-204.
- Anderson, D.L., Kitto, M.E., McCarthy, L. and Zoller, W.H. (1994). Sources and atmospheric distribution of particulate and gas-phase boron. Atmospheric environment. Atmos. Environ., 28(8): 1401-1410.
- APHA, AWWA and WEF (2017). Standard methods for the examination of water and wastewater. 23rd Edition. American Public Health Association, American Water Works Association and Water Environment Federation, Washington, DC.
- Arslan M., Topaktas M. and Rencuzogullari E. (2008). The effects of boric acid on sister chromatid exchanges and chromosome aberrations in cultured human lymphocytes. Cytotechnology, 56(2): 91-96.
- ATSDR (2010). Toxicological Profile for Boron. Available at: https://www.atsdr.cdc.gov/toxprofiles/tp.asp?id=453&tid=80
- Bakirdere, S., Örenay, S. and Korkmaz, M. (2010). Effect of boron on human health. The Open Mineral Processing Journal, 3: 54-59.
- Balabanli B. and Balaban T. (2015). Investigation into the effects of boron on liver tissue protein carbonyl, MDA, and glutathione levels in endotoxemia. Biol. Trace Elem. Res., 167(2): 259-263.
- Barranco, W.T., Hudak, P.F. and Eckhert, C.D. (2007). Evaluation of ecological and in vitro effects of boron on prostate cancer risk (united states). Cancer causes and control. Cancer Causes Control, 18(1): 71-77.
- Basaran, N., Duydu, Y. and Bolt, H.M. (2012). Reproductive toxicity in boron exposed workers in bandirma, turkey. J. Trace Elem. Med. Biol., 26(2-3): 165-7.
- Becking, G.C. and Chen, B.H. (1998). International programme on chemical safety (IPCS) environmental health criteria on boron human health risk assessment. Biol. Trace Elem. Res., 66(1-3): 439-52.
- Benson, W.H., Birge, W.J. and Dorough, H.W. (1984). Absence of mutagenic activity of sodium borate (borax) and boric acid in the salmonella preincubation test. Environ. Toxicol. Chem., 3(2): 209-214.
- Bick, A. and Oren, G. (2015). Seawater reverse osmosis permeate: comparative evaluation of boron removal technologies. In: Boron separation processes. N. Kabay, M. Bryjak, and N. Hilal (eds.). Elsevier, Amsterdam, Netherlands. pp. 325–338.
- Bodzek, M. (2015). The removal of boron from the aquatic environment: state of the art. Desalination and water treatment. 57(3): 1107-1131.
- Bolt, H.M., Basaran, N. and Duydu, Y. (2012). Human environmental and occupational exposures to boric acid: Reconciliation with experimental reproductive toxicity data. J. Toxicol. Environ. Health A, 75(8-10): 508-14.
- Bonde J.P.E. (2013). Occupational causes of male infertility. Curr. Opin. Endocrinol. Diabetes Obes., 20(3): 234-239.
- Busch, M., Mickols, W.E., Jons, S., and Redondo, J. (2003). Boron removal in seawater desalination. Proceedings of International Desalination Association (IDA) World Congress, Bahrain.
- Butterwick, L., de Oude, N. and Raymond, K. (1989). Safety assessment of boron in aquatic and terrestrial environments. Ecotoxicol. Environ. Saf., 17(3): 339-371.
- Caglar, G.S., Cakal, G.O., Yuce, E. and Pabuccu, R. (2012). Evaluation of serum boron levels and lipid profile in pregnancies with or without gestational diabetes. J. Perinat. Med., 40(2): 137-40.
- Caglar G.S., Cakal G.O. and Kiseli M. (2014). Umbilical cord boron levels in term gestations. Trace Elem. Electrolytes, 32(1): 37-41.
- CCME (2009). Scientific Criteria Document for the Development of the Canadian Water Quality Guidelines for Boron. Canadian Council of Ministers of the Environment, Winnipeg, Manitoba.
- CFIA (2013). Information bulletin: Borax (boric acid) sold or represented as food. Available at: http://www.inspection.gc.ca/food/retail-food/information-bulletins/boric-acid/eng/1357708906915/1357709473329.
- Chang, B.L., Robbins, W.A., Wei, F., Xun, L., Wu, G., Li, N. and Elashoff, D.A. (2006). Boron workers in china: Exploring work and lifestyle factors related to boron exposure. Aaohn j., 54(10): 435-43.
- Chapin R.E., Ku W.W., Kenney M.A., McCoy H., Gladen B., Wine R.N., Wilson R. and Elwell M.R. (1997). The effects of dietary boron on bone strength in rats. Fundam. Appl. Toxicol., 35(2): 205-215.
- Chapin, R.E, Ku, W.W., Kenney, M.A. and McCoy, H. (1998). The effects of dietary boric acid on bone strength in rats. Biol. Trace Elem. Res., 66(1-3): 395-399.
- Cheung, K.L. and Lafayette, R.A. (2013). Renal physiology of pregnancy. Advances in chronic kidney disease. Adv. Chron. Kidney Dis., 20(3): 209-214.
- Corradi, F., Brusasco, C., Palermo, S. and Belvederi, G. (2010). A case report of massive acute boric acid poisoning. Eur. J. Emerg. Med., 17(1): 48-51.
- Cortés, S., Espinoza-Navarro, O. and Ferreccio, C. (2017). High exposure to boron in drinking water and sperm parameters in chilean young people. International journal of morphology. Int. J. Morphol., 35(1): 99-104.
- Coughlin J.R. (1996). Inorganic borates: Chemistry, human exposure, and health and regulatory guidelines. J. Trace Elem. Exp. Med., 9(4): 137-151.
- Cui, Y., Winton, M.I., Zhang, Z., Rainey, C., Marshall, J., De Kernion, J.,B. and Eckhert, C.D. (2004). Dietary boron intake and prostate cancer risk. Oncol. Rep., 11(4): 887-92.
- Culver B.D. and Hubbard S.A. (1996). Inorganic boron health effects in humans: An aid to risk assessment and clinical judgment. J. Trace Elem. Exp. Med., 9(4): 175-184.
- Culver, B.D., Shen, P.T., Taylor, T.H., Lee-Feldstein, A., Anton-Culver, H. and Strong, P.L. (1994). The relationship of blood- and urine-boron to boron exposure in borax-workers and usefulness of urine-boron as an exposure marker. Environ. Health Perspect., 102 Suppl 7: 133-7.
- Desbarats, A.J. (2009). On elevated fluoride and boron concentrations in groundwaters associated with the lake st. martin impact structure, manitoba. Applied Geochemistry, 24: 915-927.
- Di Renzo, F., Cappelletti, G., Broccia, M.L., Giavini, E. and Menegola, E. (2007). Boric acid inhibits embryonic histone deacetylases: A suggested mechanism to explain boric acid-related teratogenicity. Toxicol. Appl. Pharmacol., 220(2): 178-185.
- Dieter M.P. (1994). Toxicity and carcinogenicity studies of boric acid in male and female B6C3F1 mice. Environ. Health Perspect., 102: 93-97.
- Dourson, M., Maier, A., Meek, B., Renwick, A., Ohanian, E. and Poirier, K. (1998). Boron tolerable intake: Re-evaluation of toxicokinetics for data-derived uncertainty factors. Biol. Trace Elem. Res., 66(1-3): 453-63.
- Draize, J.H. and Kelley, E.A. (1959). The urinary excretion of boric acid preparations following oral administration and topical applications to intact and damaged skin of rabbits. Toxicol. Appl. Pharmacol., 1(3): 267-276.
- Duydu, Y., Basaran, N., Üstündag, A., Aydin, S., Ündeger, Ü., Ataman, O., Aydos, K., Düker, Y., Ickstadt, K., Waltrup, B., Golka, K. and Bolt, H. (2011). Reproductive toxicity parameters and biological monitoring in occupationally and environmentally boron-exposed persons in bandirma, turkey. Arch. Toxicol., 85(6): 589-600.
- Duydu, Y., Basaran, N. and Bolt, H.M. (2012). Exposure assessment of boron in bandirma boric acid production plant. Journal of Trace Elements in Medicine and Biology, 26(2-3): 161-164.
- Duydu Y., Basaran N. and Hermann B.M. (2015). Human health risk assessment of boric acid and sodium borates. Toxicol. Lett., 238(2): S102-S103.
- Duydu, Y., Basaran, N., Üstündag, A., Aydin, S., Ündeger, Ü., Ataman, O.Y., Aydos, K., Düker, Y., Ickstadt, K., Waltrup, B.S., Golka, K. and Bolt, H.M. (2016). Is boric acid toxic to reproduction in humans? Assessment of the animal reproductive toxicity data and epidemiological study results. Curr. Drug Deliv., 13(3): 324-329.
- Duydu, Y., Basaran, N., Üstündag, A., Aydin, S., Yalçin, C.Ö., Anlar, H.G., Bacanli, M., Aydos, K., Atabekoglu, C.S., Golka, K., Ickstadt, K., Schwerdtle, T., Werner, M., Meyer, S. and Bolt, H.M. (2018a). Birth weights of newborns and pregnancy outcomes of environmentally boron-exposed females in turkey. Arch. Toxicol., 92(8): 2475-2485.
- Duydu, Y., Basaran, N., Aydin, S., Üstündag, A., Yalçin, C.Ö., Anlar, H.G., Bacanli, M., Aydos, K., Atabekoglu, C.S., Golka, K., Ickstadt, K., Schwerdtle, T., Werner, M., Meyer, S. and Bolt, H.M. (2018b). Evaluation of FSH, LH, testosterone levels and semen parameters in male boron workers under extreme exposure conditions. Arch. Toxicol., 92:3051–3059.
- ECOTOC (1995). Reproductive and General Toxicology of some Inorganic Borates and Risk Assessment in Human Beings. Technical Report No. 63. Brussels.
- EFSA (2013). Scientific opinion on the re-evaluation of boric acid (E 284) and sodium tetraborate (borax) (E 285) as food additives. European Food Safety Association. EFSA Journal, 11(10): 3407.
- Environment and Climate Change Canada and Health Canada (2016). Draft Screening Assessment: Boric Acid, its Salts and its Precursors. Ottawa.
- European Commission. (1998). Council Directive 98/83/EC of 3 November 1998 on the quality of water intended for human consumption. Official Journal of the European Communities.
- Fail, P.A., Chapin, R.E., Price, C.J. and Heindel, J.J. (1998). General, reproductive, developmental, and endocrine toxicity of boronated compounds. Reproductive Toxicology, 12(1): 1-18.
- Farhat, A., Ahmad, F., Hilal, N., and Arafat. H.A. (2013). Boron removal in new generation reverse osmosis (RO) membranes using two-pass RO without pH adjustment. Desalination, 310: 50-59.
- Fogg, T.R. and Duce, R.A. (1985). Boron in the troposphere: Distribution and fluxes. Journal of Geophysical Research, 90(D2): 3781-3796.
- Forbes, A.M. and Mitchell, H.H. (1957). Accumulation of dietary boron and strontium in young and adult albino rats. A. M. A. Arch Ind Health, 16: 489-492.
- Forbes, R.M., Cooper, A.R. and Mitchell, H.H. (1954). On the occurrence of beryllium, boron, cobalt, and mercury in human tissues. J Biol Chem, 209: 857-865.
- Franks, R., Neculau, M., Garrote, R., Bartels, C., Egea R.J., Carrion, M/L., Torralba Saura, A.J., and Ruiz Prieto, M. (2013). Analyzing three years of SWRO plant operation at elevated feed pH to save energy and improve boron rejection. Proceedings of International Desalination Association (IDA) World Congress, Tianjin, China.
- Frey, M., Seidel, C., Edwards, M., Parks, J. and McNeell, L (2004). Occurrence survey of boron and hexavalent chromium. American Water Works Association Research Foundation, Denver, CO (Report No. 91044F)
- Friedman, M.J., Hill, A.S., Reiber, S.H., Valentine, R.L., Larsen, G., Young, A., Korshin, G.V. and Peng, C-Y. (2010). Assessment of inorganics accumulation in drinking water system scales and sediments. Water Research Foundation and United States Environmental Protection Agency, Denver, Colorado.
- Friedman, M.J., Hil, A., Booth, S., Hallett, M., McNeill, L., McLean, J., Stevens, D., Sorensen, D., Hammer, T., Kent, W., De Haan, M., MacArthur, K. and Mitchell, K. (2016). Metals accumulation and release within the distribution system: evaluation and mitigation. Water Research Foundation and United States Environmental Protection Agency, Denver, Colorado.
- Friis-Hansen, B., Aggerbeck, B. and Aas Jansen, J. (1982). Unaffected blood boron levels in newborn infants treated with a boric acid ointment. Food and chemical toxicology. Food Chem. Toxicol., 20(4): 451-454.
- Goldberg, S. and Su, C. (2007). New advances in boron soil chemistry (in advances in plant and animal boron nutrition). Anonymous Wuhan, China. pp. 313-330.
- Gorenflo, A., Brusilovsky, M., Faigon, M., and Liberman, B. (2007). High pH operation in seawater reverse osmosis permeate: first results from the world’s largest SWRO plant in Ashkelon. Desalination, 203:82-90.
- Government of Alberta. (2010). Alberta Biomonitoring Program. Chemicals in Serum of Children in Southern Alberta 2004-2006. Influence of Age Comparison to Pregnant Women. Available at: http://www.health.alberta.ca/documents/Chemical-Biomonitoring-2010.pdf
- Government of Manitoba (2010). Map of Trace Elements in Groundwater: Boron in Groundwater. Groundwater Management Section, Water Science and Management Branch, Sustainable Development.
- Grella, P., Tambuscio, B. and Suma, V. (1976). Boric acid and poisoning during pregnancy: Description of one case [cited in ECHA, 2010]. Acta Anaesthesiol Italica, 27: 745-748.
- Guan, Z., Lv, J., Bai, P., and Guo, X. (2016). Boron removal from aqueous solutions by adsorption – a review. Desal., 383: 29-37.
- Guler, E., Kabay, N., Yuksel, M., Yigit, N.O., Kitis, M. and Bryjak, M. (2011). Integrated solution for boron removal from seawater using RO process and sorption-membrane filtration hybrid method. J. Membr. Sci. 375; 249 -257.
- Guler, E., Kaya, C., Kabay, N., and Arda, M. (2015). Boron removal from seawater: state-of-the-art review. Desalination, 356: 85-93.
- Hakki, S.S., Dundar, N., Kayis, S.A., Hakki, E.E., Hamurcu, M., Kerimoglu, U., Baspinar, N., Basoglu, A. and Nielsen, F.H. (2013). Boron enhances strength and alters mineral composition of bone in rabbits fed a high energy diet. J. Trace Elem. Med. Biol., 27(2): 148-153.
- Hall Jr., L.W., Killen, W.D., Anderson, R.D. and Perry, E. (2004). Analysis of historical salinity and boron surface water monitoring data from the san joaquin river watershed: 1985-2002. Environ. Monit. Assess., 95(1-3): 125-151.
- Hamilton, S.M. (2015). Ambient Groundwater Geochemistry Data for Southern Ontario, 2007–2014. Ontario Geological Survey, Miscellaneous Release—Data 283–Revised. Queen’s Printer for Ontario. Available at: Www.Geologyontario.Mndm.Gov.on.ca/mndmfiles/pub/data/imaging/MRD283-REV//MRD283-REV.Pdf.
- Hasegawa, R., Hirata-Koizumi, M., Dourson, M.L., Parker, A., Ono, A. and Hirose, A. (2013). Safety assessment of boron by application of new uncertainty factors and their subdivision. Regulatory Toxicology and Pharmacology, 65(1): 108-114.
- Haworth, S., Lawlor, T., Mortelmans, K., Speck, W. and Zeiger, E. (1983). Salmonella mutagenicity test results for 250 chemicals. Environ Mutagen, 5 Suppl 1: 1-142.
- Health Canada (in preparation). Canadian exposure factors used in human health risk assessments. Health Canada, Ottawa, Ontario.
- Health Canada. (2007). Boron as a medicinal ingredient in oral natural health products.
- Health Canada (2017). Personal communication with Anca-Maria Tugulea, Environmental and Health Sciences Research Bureau.
- Health Canada (2018). Cosmetic ingredient hotlist. Available at: https://www.canada.ca/en/health-canada/services/consumer-product-safety/cosmetics/cosmetic-ingredient-hotlist-prohibited-restricted-ingredients/hotlist.html
- Heindel, J.J., Price, C.J., Field, E.A., Marr, M.C., Myers, C.B., Morrissey, R.E. and Schwetz, B.A. (1992). Developmental toxicity of boric acid in mice and rats. Fundam. Appl. Toxicol., 18(2): 266-77.
- Heindel, J.J., Price, C.J. and Schwetz, B.A. (1994). The developmental toxicity of boric acid in mice, rats, and rabbits. Environ. Health Perspect., 102 Suppl 7: 107-12.
- Heitland P. and Köster, HD. (2006). Biomonitoring of 37 trace elements in blood samples from inhabitants of northern Germany by ICP–MS. . J. Trace Elem. Med. Biol., 20: 253-262.
- Hilal, N., Kim, G.J., and Somerfield, C. (2011). Boron removal from saline water: a comprehensive review. Desal., 273:23-35.
- Huel, G., Yazbeck, C., Burnel, D., Missy, P. and Kloppmann, W. (2004). Environmental boron exposure and activity of d-aminolevulinic acid dehydratase (ALA-D) in a newborn population. Toxicological sciences. Toxicol. Sci., 80(2): 304-309.
- Hunt, C.D., Herbei, J.L. and Nielsen, F.H. (1997). Metabolic responses of postmenopausal women to supplemental dietary boron and aluminum during usual and low magnesium intake: Boron, calcium, and magnesium absorption and retention and blood mineral concentrations. Am. J. Clin. Nutr., 65(3): 803-813.
- Igra, A.M., Harari, F., Lu, Y., Casimiro, E. and Vahter, M. (2016). Boron exposure through drinking water during pregnancy and birth size. Environ. Int., 95: 54-60.
- IOM (2001). Dietary Reference Intakes for Vitamin A, Vitamin K, Arsenic, Boron, Chromium, Copper, Iodine, Iron, Manganese, Molybdenum, Nickel Silicon, Vanadium and Zinc. National Academy Press, Washington, DC.
- Ipek, I., Guler, E., Kabay, N., Yuksel, M. (2016). Removal of boron from water by ion exchange and hybrid processes. In: Ion Exchange and Solvent Extraction-A Series of Advances, Volume 22. A.Sengupta (ed.). CRC Press, Florida, USA. pp. 33-63.
- Ishii, Y., Fujizuka, N., Takahashi, T., Shimizu, K., Tuchida, A., Yano, S., Naruse, T. and Chishiro, T. (1993). A fatal case of acute boric acid poisoning. J. Toxicol. Clin. Toxicol., 31(2): 345-52.
- ISO, (1990). International Standard ISO 9390 Water quality-Determination of borate-spectrophotometric method using azomethine-H. First edition 1990-09-01.
- Jacob (2007). Seawater desalination: boron removal by ion exchange technology. Desal., 205: 47-52.
- Jansen, J.A., Schou, J.S. and Aggerbeck, B. (1984). Gastro-intestinal absorption and in vitro release of boric acid from water-emulsifying ointments. Food Chem. Toxicol., 22(1): 49-53.
- Kabay, N., Yilmaz, I., Yamac, S., Yuksel, M., Yukel, U., Yildirim N., Aydogu, O., Iwanaga, T. and Hirowatari, K. (2004). Removal and recovery of boron from geothermal wastewater by selective ion-exchange resins- II. Field tests. Desal., 167: 427-438.
- Kabay, N., Sarp, S., Yuksel, M., Kitis, M., Koseoglu, H., Arar, O., Bryjak, M., and Semiat, R. (2008a). Removal of boron from SWRO permeate by boron selective ion exchange resins containing N-methyl glucamine groups. Desal., 227: 233-240.
- Kabay, N., Guler, E., and Bryjak, M. (2010). Boron in seawater and methods for its separation – a review. Desal., 261: 212-217.
- Kabay, N., Bryjak, M., Hilal, N. (2015). Boron Separation Processes, Elsevier, Amsterdam, Netherlands (ISBN: 978-0-444-63454-2).
- Kabay, N., Sozel, P.Y., Yavuz, E., Yuksel, M., Yuksel, U. (2018a). Treatment of geothermal waters for industrial and agricultural purposes. In Geothermal Water Management. J.Bundschuh and B.Tomaszewska (eds.), CRC, London, UK, pp. 113-133.
- Kabay, N., Ipek, I.Y., Yilmaz, P.K., Samatya, S., Bryjak, M., Yoshizuka, K., Tuncel, S.A., Yuksel, U., Yuksel, M. (2018b). Removal of boron and arsenic from geothermal water by ion exchange. In Geothermal Water Management. J.Bundschuh and B.Tomaszewska (eds.), CRC, London, UK, pp. 135-155.
- Kent, N.L. and McCance, R.A. (1994). The absorption and excretion of "minor" elements by man. I. silver, gold, boron and vanadium. J Biochem, 35: 837.
- Kim, J., Wilf, M., Park, J-S., and Brown, J. (2009). Boron rejection by reverse osmosis membranes: national reconnaissance and mechanism study. U.S Department of Interior, Bureau of Reclamation, Denver, CO.
- Kochkodan, V., Bin Darwish, N. and Hilal, N. (2015). The chemistry of boron in water. In: Boron separation processes. N. Kabay, M. Bryjak, and N. Hilal (eds.). Elsevier, Amsterdam, Netherlands. pp. 35–63.
- Korkmaz, M., Yenigun, M., Bakirdere, S., Ataman, O.Y., Keskin, S., Muezzinoglu, T. and Lekili, M. (2011). Effects of chronic boron exposure on semen profile. Biol. Trace Elem. Res., 143(2): 738-50.
- Koseoglu, H., Kabay, N., Yuksel, M., and Kitis, M. (2008). The removal of boron from model solutions and seawater using reverse osmosis membranes. Desal., 223: 126-133.
- Kot, F.S. (2009). Boron sources, speciation and its potential impact on health. Reviews in environmental science and biotechnology. Rev. Environ. Sci. Biotechnol., 8(1): 3-28.
- Krishnan, K. and Carrier, R. (2013). The use of exposure source allocation factor in the risk assessment of drinking-water contaminants. J. Toxicol. Environ. Health B Crit. Rev., 16(1): 39-51.
- Ku, W.W., Chapin, R.E., Moseman, R.F., Brink, R.E., Pierce, K.D. and Adams, K.Y. (1991). Tissue disposition of boron in male fischer rats. Toxicol. Appl. Pharmacol., 111(1): 145-151.
- Ku, W.W., Chapin, R.E., Wine, R.N. and Gladen, B.C. (1993) Testicular toxicity of boric acid (BA): Relationship of dose to lesion development and recovery in the F344 rat. Repro. Tox. 7: 305-319.
- Lemay, T.G. (2002). Geochemical and Isotope Data for Formation Water from Selected Wells, Cretaceous to Quaternary Succession, Athabasca Oil Sands (in Situ) Area, Alberta. Alberta Geological Survey, Alberta Energy and Utilities Board.
- Liu P, Wang C, Hu J, Xun L, Robbins WA, Wu G, Wei F. (2005). Preliminary study on pregnancy outcome of spouses of boron workers. Chin J Public Health, 21(5): 567-8 [in Chinese].
- Magara,Y., Aizawa, T., Kunikane,S., Itoh, S., Kohki, M., Kawasaki, M., and Takeuti, H. (1996). The behaviour of inorganic constituents and disinfection by products by reverse osmosis water desalination processes. Wat. Sci. Tech., 34(9): 141-148.
- Mahabir, S., Spitz, M.R., Barrera, S.L., Dong, Y.Q., Eastham, C. and Forman, M.R. (2008). Dietary boron and hormone replacement therapy as risk factors for lung cancer in women. Am. J. Epidemiol., 167(9): 1070-80.
- Manitoba Conservation and Water Stewardship (2013). Personal communication with Kim Philip, Office of Drinking Water.
- Ministère du Développement durable, de l’Environnement et de la Faune et des Parcs du Québec (2013). Personal Communication with Caroline Robert, Direction De l'Eau Potable Et Des Eaux Souterraines.
- Moseman, R.F. (1994). Chemical disposition of boron in animals and humans. Environ. Health Perspect., 102 Suppl 7: 113-7.
- Moss, S.A. and Nagpal, N.K. (2003). Ambient Water Quality Guildelines for Boron. Water Protection Section; Ministry of Water, Land and Air Protection, British Columbia.
- Murray, F. (1998). A comparative review of the pharmacokinetics of boric acid in rodents and humans. Biol. Trace Elem. Res., 66(1-3): 331-341.
- Naghii M.R., Mofid M., Asgari A.R., Hedayati M. and Daneshpour M.-S. (2011). Comparative effects of daily and weekly boron supplementation on plasma steroid hormones and proinflammatory cytokines. J. Trace Elem. Med. Biol., 25(1): 54-58.
- Naghii M.R. and S. Samman. (1997) The effect of boron supplementation on its urinary excretion ad selection cardiovascular risk factors in healthy male subjects. Biol. Trace Elem. Res., 5(3): 273-286.
- Naghii, M.R. (2013). Significant pain alleviation, cease of hematuria, and renal stone removal after extracorporeal shock wave lithotripsy with adjuvant boron therapy - case report. Endocrine regulations. Endocr. Regul., 47(2): 101-104.
- Naghii M.R. (2014). Boron and antioxidants complex: A new concept for the treatment of kidney stones without rigorous pain. Endocr. Regul., 48(3): 120-125.
- New Brunswick Department of Health (2013). Personal communication with Kevin Gould, Healthy Environment Branch.
- Newfoundland and Labrador Department of Environment and Conservation (2013). Personal communication with Haseen Khan, Water Resources Management Division.
- NGWA (2018). Reducing problematic concentrations of boron in residential water well systems. Draft for Public Review. National Groundwater Association, Westerville, OH.
- NHMRC and NRMCC (2011) Australian Drinking Water Guidelines Paper 6 National Water Quality Management Strategy. National Health and Medical Research Council, National Resource Management Ministerial Council, Commonwealth of Australia, Canberra. Version 3.5 Updated August 2018.
- Nielsen F.H. (2014). Update on human health effects of boron. J. Trace Elem. Med. Biol., 28(4): 383-387.
- Nir, O. and Lahav, O. (2015). Single SWRO pass boron removal at high pH: prospects and challenges. In: Boron separation processes. N. Kabay, M. Bryjak, and N. Hilal (eds.). Elsevier, Amsterdam, Netherlands. pp. 297-323.
- NSF/ANSI (2018a). Standard 58: Reverse osmosis drinking water treatment systems. NSF International/American National Standards Institute. NSF International, Ann Arbor, Michigan.
- NSF/ANSI (2018b). Standard 62: Drinking water distillation systems. NSF International/American National Standards Institute. NSF International, Ann Arbor, Michigan.
- NTP (1997). NTP Technical Report on the Toxicology and Carcinogenesis Studies of Boric Acid (CAS no. 1004-35-3) in B6C3F1 Mice. National Toxicology Program. Research Triangle Park, NC.
- Ontario Ministry of the Environment (2013). Selected Water Quality Results for Treated and Distribution Water from the Drinking Water Surveillance Program in Ontario Treatment Plants (2013-2017).
- Pahl, M.V., Culver, B.D., Strong, P.L., Murray, F.J. and Vaziri, N.D. (2001). The effect of pregnancy on renal clearance of boron in humans: A study based on normal dietary intake of boron. Toxicol. Sci., 60(2): 252-256.
- Parks, J.L and Edwards, M. (2005). Boron in the environment. Crit. Reviews Env. Sci. Tech., 35:2; 81-114.
- Pizent A., Tariba B. and Zivkovic T. (2012). Reproductive toxicity of metals in men. Arh. Hig. Rada. Toksikol., 63: 35-46.
- PMRA (2012). Proposed Re-Evaluation Decision: Boric Acid and its Salts (Boron).
- PMRA (2016). Re-Evaluation Decision: Boric Acid and its Salts (Boron).
- Price, C.J., Strong, P.L., Marr, M.C., Myers, C.B. and Murray, F.J. (1996). Developmental toxicity NOAEL and postnatal recovery in rats fed boric acid during gestation. Fundam. Appl. Toxicol., 32(2): 179-93.
- Rani, M. and Meena, M.C. (2013). Multiple organ damage due to boric acid toxicity. Asia Pac J Med Tox, 2(4): 157-159.
- Recepoglu, Y.K., Kabay, N., Ipek, Y.I., Arda, M., Yukel, M., Yoshisuka, K., and Nishihama, S. (2018). Packed bed column dynamic study for boron removal from geothermal brine by a chelating fiber and breakthrough curve analysis by using mathematical models. Desal., 437: 1-6.
- Redondo, J., Busch, M., and De Witte, J-P. (2003). Boron removal from seawater using FILMTECTM high rejection SWRO membranes. Desal., 156: 229-238.
- Robbins, W.A., Wei, F., Elashoff, D.A., Wu, G., Xun, L. and Jia, J. (2008). Y:X sperm ratio in boron-exposed men. J. Androl., 29(1): 115-21.
- Robbins, W.A., Xun, L., Jia, J., Kennedy, N., Elashoff, D.A. and Ping, L. (2010). Chronic boron exposure and human semen parameters. Reprod. Toxicol., 29(2): 184-90.
- Ruiz-Garcia, A., Leon, F.A., and Ramos-Martin, A. (2019). Different boron rejection behaviour in two RO membranes installed at same full-scale SWRO desalination plant. Desal., 449: 131-138.
- Santander, P., Rivas, B.L., Urbano, B.F., Yilmaz Ipek, I., Ozkula, G., Arda, M., Yuksel, M., Bryjak, M., Kozlecki, T., and Kabay, N. 92013). Removal of boron from geothermal water by a novel boron selective resin. Desal., 310: 102-108.
- Samman, S., Naghii M.R., Lyons Wall., P.M. and Verus, A.P. (1998). The nutritional and metabolic effects of boron in human and animals. Biol. Trace Elem. Res., 66(1-3): 227-235.
- Saskatchewan Water Security Agency (2012). Personal communication with Sam Ferris, Environmental & Municipal Management Services Division.
- Sayli, B.S. (1998). An assessment of fertility in boron-exposed turkish subpopulations: 2. evidence that boron has no effect on human reproduction. Biol. Trace Elem. Res., 66(1-3): 409-22.
- Sayli, B.S., Tuccar, E. and Elhan, A.H. (1998). An assessment of fertility in boron-exposed turkish subpopulations. Reprod. Toxicol., 12(3): 297-304.
- SCC (2019). Directory of Accredited Product, Process and Service Certification Bodies. Standards Council of Canada, Ottawa, Ontario. Available at: www.scc.ca/en/accreditation/product-process-and-service-certification/directory-of-accredited-clients
- Schou, J.S., Jansen, J.A. and Aggerbeck, B. (1984). Human pharmacokinetics and safety of boric acid. Arch. Toxicol., 55(SUPPL. 7): 232-235.
- Scialli, A.R., Bonde, J.P., Brüske-Hohlfeld, I., Culver, B.D., Li, Y. and Sullivan, F.M. (2010). An overview of male reproductive studies of boron with an emphasis on studies of highly exposed chinese workers. Reproductive Toxicology, 29(1): 10-24.
- Scorei, R., Mitrut, P., Petrisor, I. and Scorei, I. (2011). A double-blind, placebo-controlled pilot study to evaluate the effect of calcium fructoborate on systemic inflammation and dyslipidemia markers for middle-aged people with primary osteoarthritis. Biol. Trace Elem. Res., 144(1-3): 253-63.
- Seal, B.S. and Weeth, H.J. (1980). Effect of boron in drinking water on the male laboratory rat. Bulletin of environmental contamination and toxicology. Bull. Environ. Contam. Toxicol., 25(5): 782-789.
- See, A.S., Salleh, A.B., Bakar, F.A., Yusof, N.A., Abdulamir, A.S. and Heng, L.Y. (2010). Risk and health effect of boric acid. American journal of applied sciences. Am. J. Appl. Sci., 7(5): 620-627.
- Stuttgen, G., Siebel, T. and Aggerbeck, B. (1982). Absorption of boric acid through human skin depending on the type of vehicle. Arch Dermatol Res, 272(1-2): 21-29.
- Sutherland, B., Strong, P. and King, J.C. (1998). Determining human dietary requirements of boron. Biol. Trace Elem. Res., 66(1-3): 193-204.
- Tagliabue, M., Reverberia, A.P., and Bagatin, R. (2014). Boron removal from water: needs, challenges and perspectives. Journal of cleaner production, 77:56-64.
- Toker, H., Ozdemir, H., Balci Yuce, H. and Goze, F. (2016). The effect of boron on alveolar bone loss in osteoporotic rats. Journal of dental sciences. J. Dent. Sci., 11(3): 331-337.
- Tomaszewka, B. and Bodzek, M. (2013). Desalination of geothermal water using a hybrid UF-RO process. Part 1: Boron removal in pilot-scale tests. Desal., 319: 99-106
- Treinen, K.A. and Chapin, R.E. (1991). Development of testicular lesions in F344 rats after treatment with boric acid.Toxicol. Appl. Pharmacol., 107(2): 325-35.
- Tu, K.L., Nghiem, L.D., and Chivas, A.R. (2010). Boron removal by reverse osmosis membranes in seawater desalination applications. Separation and Purification Technology, 75:87-101.
- Tüccar, E., Elhan, A.H., Yavuz, Y. and Sayli, B.S. (1998). Comparison of infertility rates in communities from boron-rich and boron-poor territories. Biol. Trace Elem. Res., 66(1-3): 401-7.
- U.S. EPA (1994). Method 200.7 revision 4.4. Determination of metals and trace elements in water and wastes by inductively coupled plasma-atomic emission spectrometry. Environmental Monitoring Systems Laboratories. Office of Research and Development, Cincinnati, Ohio.
- U.S. EPA (2003). Method 200.5 revision 4.2. Determination of trace elements in drinking water by axially viewed inductively coupled plasma - atomic emission spectrometry. National Exposure Research Laboratory. Office of Research and Development, EPA 600-R-06-115, Cincinnati, OhioAPHA, 2017
- U.S. EPA (2008). Health Effects Support Document for Boron. EPA document number EPA-822-R-08-002.
- Vanderpool, R.A., Hoff, D. and Johnson, P.E. (1994). Use of inductively coupled plasma-mass spectrometry in boron-10 stable isotope experiments with plants, rats, and humans. Environ. Health Perspect., 102(SUPPL. 7): 13-20.
- Vaziri, N.D., Oveisi, F., Culver, B.D., Pahl, M.V., Andersen, M.E., Strong, P.L. and Murray, F.J. (2001). The effect of pregnancy on renal clearance of boron in rats given boric acid orally. Toxicol. Sci., 60(2): 257-63.
- Viatcheslav, F., Shemer, H., Sagiv, A., and Semiat, R. (2015). Boron removal using membranes. In: Boron separation processes. N. Kabay, M. Bryjak, and N. Hilal (eds.). Elsevier, Amsterdam, Netherlands. pp. 199-217.
- Wang, B., Guo, X., and Bai, P. (2014). Removal technology for boron dissolved in aqueous solutions – a review. Colloids and Surfaces A: Physiochem. Eng. Aspects, 444: 338-344.
- Weir Jr., R.J. and Fisher, R.S. (1972). Toxicologic studies on borax and boric acid. Toxicology and applied pharmacology. Toxicol. Appl. Pharmacol., 23(3): 351-364.
- WHO. (2009) Boron in drinking water. Background document for development of WHO Guidelines for Drinking-water Quality. Geneva.
- Whorton MD, Haas J, Trent L. (1994a). Reproductive effects of inorganic borates on male employees: birth rate assessment. Environ. Health Perspect., 102(Suppl 7): 129-131.
- Whorton MD, Haas JL, Trent L, Wong O. 1(994b). Reproductive effects of sodium borates on male employees: birth rate assessment. Occup. Environ. Med., 51: 761–767.
- Wilding, J.L., Smith, W.J., Yevich, P., Sicks, M.E., Ryan, S.G. and Punte, C.L. (1959). The toxicity of boron oxide. Am Ind Hyg Assoc J, 20: 284-289.
- Wolska, J. and Bryjak, M. (2013). Methods for boron removal from aqueous solutions – a review. Desal., 310: 18-24.
- Yan, C.Y., Yi, W.T., Ma, P.H., Deng, X.C. and Li, F.Q. (2008). Removal of boron from refined brine by using selective ion exchange resin. J. Hazard. Mater., 154: 564-571.
- Yoshizuka, K. and Nishihama, S. (2015). Separation and Recovery of boron from various resources using chelate adsorbents. In: Boron separation processes. N. Kabay, M. Bryjak, and N. Hilal (eds.). Elsevier, Amsterdam, Netherlands. pp. 131-146.
- Yukon Health and Social Services (2013). Personal communication with Pat Brooks, Drinking Water Program Coordinator.
- Zhao, Z. and Liu, C. (2010). Anthropogenic inputs of boron into urban atmosphere: Evidence from boron isotopes of precipitations in guiyang
Appendix A: List of acronyms
- ADP
- Adenosine diphosphate
- ATSDR
- Agency for Toxic Substances and Disease Registry
- AVICP-AES
- Axially viewed inductively coupled plasma- atomic emission spectrometry
- B
- Boron
- BMD
- Benchmark dose
- BMDL
- Benchmark dose (lower 95% confidence limit of the BMD)
- BWRO
- Brackish water reverse osmosis
- Cal EPA
- California Environmental Protection Agency
- CCME
- Canadian Council of Ministers of the Environment
- CFIA
- Canadian Food Inspection Agency
- CSAF
- Chemical specific adjustment factor
- DNA
- Deoxyribonucleic acid
- ECCC
- Environment and Climate Change Canada
- ECHA
- European Chemicals Agency
- ECOTOC
- European Centre for Ecotoxicology and Toxicology of Chemicals
- EFSA
- European Food Safety Authorityl
- FSH
- Follicle stimulating hormone
- GD
- Gestational day
- GFR
- Glomerular filtration rate
- HBV
- Health based value
- HC
- Health Canada
- HRL
- Health reference level
- IARC
- International Agency for Research on Cancer
- ICP-AES
- Inductively coupled plasma -atomic emission spectrometry
- ICP-MS
- Inductively coupled plasma - mass spectrometry
- IOM
- Institute of Medicine
- Kow
- octanol/water partition coefficient
- LH
- Luteinizing hormone
- LOAEL
- Lowest observed adverse effect level
- MAC
- Maximum acceptable concentration
- MCL
- Maximum contaminant level
- MDL
- Method detection limit
- MRL
- Minimum reporting level
- NDWS
- National drinking water survey
- NHMRC
- National Health and Medical Research Council (Australia)
- NOAEL
- No observed adverse effect level
- NTP
- National Toxicology Program
- PMRA
- Pest Management Regulatory Agency
- POD
- Point of departure
- PND
- Post-natal day
- PSA
- Prostate specific antigen
- RfD
- Reference dose
- SWRO
- Seawater reverse osmosis
- TD
- Toxicodynamic
- TDI
- Tolerable daily intake
- TDS
- Total dissolved solids
- TK
- Toxicokinetic
- UF
- Uncertainty factor
- U.S. EPA
- United States Environmental Protection Agency
- WHO
- World Health Organization
- w/v
- Weight per volume
- w/w
- Weight per weight
Appendix B: Provincial and territorial anticipated impacts
Please note that this information is not available in both official languages because the source of the information is not subject to the Official Languages Act.
Alberta
Based on the Alberta Environmental Public Health Information Network (AEPHIN) data set, it would appear that there is only 1 exceedance (1 out of 1791 samples; <0.01%) near the town of Taber.
This lower MAC value is not expected to impact Alberta’s Domestic Well Water Quality (DWWQ) program based on the 2001-2015 dataset. The 2016-2018 AEPHIN data set is not yet available, so it is possible there could be more exceedances but likely at a very low percentage (<1%). For non-municipal drinking water systems, Alberta Health has started as of 2019 a program to collect information on the ground water chemistry from these small systems (anticipated to become available in 2020 to provide more information on boron in source water).
There may an impact on management of contaminated sites in Alberta, which would impact the remediation requirements of boron for such sites in the province Chapters 7 and 12 in a 2016 publication from Alberta on soil remediation guidelines for boron called “Soil Remediation Guidelines for Boron: Environmental and Human Health” would both likely impacted by a new MAC for boron.
British Columbia
No information submitted.
Manitoba
The data set provided in connection with the boron guideline review process indicates that a limited number of water systems in Manitoba, including seven very small (serving less than 500 people) and another two systems (serving less than 1,000 people) exceed the proposed 2 mg/L maximum acceptable concentration (MAC) for boron in drinking water. Large and mid-sized public water systems serving the overwhelming majority of Manitoba’s population had boron concentrations below the method detection limit (0.01 mg/L).
New Brunswick
The lowering of the MAC for Boron from 5 mg/L to 2 mg/L is not expected to have a significant impact to regulated drinking water systems in New Brunswick.
Newfoundland and Labrador
The Province of Newfoundland and Labrador is responsible for extensive monitoring for inorganic parameters including boron in the province. Boron monitoring is conducted semi-annually for all surface public water supplies, annually for groundwater public water supplies, and quarterly for populations larger than 5,000.
Of the 300 surface water sources in the province, 261 (87%) are protected under the Water Resources Act. Of the 179 groundwater sources in the province, 61 (34%) are protected under the Water Resources Act. This provides for an extensive source water protection program that reduces the risk of contamination for drinking water sources.
There are no drinking water systems in the province that have boron concentrations that exceed the proposed guidelines. There is no immediate cost to the implementation of this guideline.
Northwest Territories
No information submitted.
Nova Scotia
Health Canada is proposing to reduce the maximum acceptable concentration (MAC) for total boron in drinking water from 5 mg/L to 2 mg/L.
Approximately 58% of Nova Scotians obtain their domestic water from a public system, whereas 42% rely on a private water supply. Public systems include municipal and registered facilities. Nova Scotia Environment (NSE) requires public drinking water supplies to comply with the MAC for parameters listed in the Guidelines for Canadian Drinking Water Quality. Raw and treated water samples of boron collected between 2005 and 2017 were reviewed for 36 municipal surface water supplies and 37 groundwater supplies. For the surface water supplies, 10 of the 36 available raw water samples had detectable boron concentrations. Both the mean and median of the detectable concentrations was 0.006 mg/L and the maximum concentration was 0.009 mg/L. Fifteen of the 35 available treated water samples from municipal surface water supplies had detectable boron concentrations with a mean of 0.007 mg/L, median of 0.006 mg/L and maximum concentration of 0.014 mg/L. For the groundwater supplies, 16 of the 36 raw water samples had detectable boron concentrations. The mean of the detectable concentrations was 0.033 mg/L, the median was 0.019 mg/L and the maximum concentration was 0.152 mg/L. Of the 37 treated groundwater samples, 18 had detectable boron concentrations, and the mean of the detectable concentrations was 0.032 mg/L, the median was 0.021 mg/L and the maximum concentration was 0.130 mg/L. Based on these data, no raw or treated water samples collected from municipal systems exceed the proposed MAC of 2 mg/L.
Of the approximately 1700 registered drinking water supplies, boron data was available for 436 facilities. Based on available data, no registered systems will exceed the proposed MAC.
While NSE does not regulate water quality at private water supplies, 2447 samples collected between 1970 and 2019 representing ambient groundwater chemistry were reviewed. Of the 2447 samples, 1579 had detectable boron concentrations. The mean and median of the detectable concentrations was 0.093 mg/L, and 0.025 mg/L, respectively, and the maximum concentration was 3.73 mg/L. Based on these data approximately 0.2% of private water supplies would exceed the proposed MAC, which represents less than 500 of the province’s private wells.
Recommended treatment for boron at a residential level includes point of use reverse osmosis with an approximate capital cost of $500 to $1000 plus additional costs for pre-treatment, on-going sampling and maintenance.
Based on the evaluation of available water quality data for boron, the proposed MAC will have a negligible impact for Nova Scotia.
Nunavut
No addition to add.
Ontario
The proposed Canadian Drinking Water Quality Guideline of 2 mg/L for Boron will have an economic impact at a few smaller groundwater-based drinking water systems in Ontario. Ontario supports the consultation of the revised boron guideline noting that it is conservative.
Prince Edward Island
Observed boron concentrations in PEI drinking water are orders of magnitude below the proposed guideline, thus no impact on drinking water supplies is expected.
Quebec
Au Québec, d’avril 2013 à mars 2018, 12 846 analyses du bore ont été réalisées dans le cadre du Règlement sur la qualité de l’eau potable, dans un total de 2782 réseaux de distribution. Tous les réseaux assujettis au Règlement doivent réaliser annuellement le contrôle du bore dans l’eau qu’ils distribuent.
Sur la période d’avril 2013 à mars 2018, aucune des analyses réalisées n’a présenté un résultat supérieur à la norme actuelle de 5 mg/L. La concentration maximale mesurée a atteint 1,8 mg/L, tandis que la médiane des résultats détectés était de 0,002 mg/L. Ainsi, aucun de ces résultats d’analyse de bore n’a dépassé la recommandation canadienne proposée de 2 mg/L durant cette période.
Sur la base de ces résultats, les impacts attendus d'une éventuelle réduction de la norme de bore dans la réglementation québécoise en fonction de la révision de la recommandation proposée seraient faibles.
Saskatchewan
The Water Security Agency (WSA) has reviewed the proposed guideline technical document for boron in drinking water and agrees with the proposed MAC of 2 mg/L for boron in drinking water. A review of the provincial water quality database showed that 1386 treated water samples have been submitted for boron analysis over the 2009 to 2019 time period from the WSA regulated water treatment systems. Analysis of these results showed that boron levels for > 99% of these treated water samples are well below the proposed MAC of 2 mg/L. Only 9 out of 1386 samples exceeded the proposed MAC and that the mean boron value of the 1386 samples is 0.21 mg/L. It may be expected that Saskatchewan residents may be exposed to very low levels of boron in drinking water in addition to their exposure to boron through their diet.
In terms of drinking water treatment, literature shows that higher pressure membrane systems such as Reverse Osmosis (RO) and Ion-exchange systems containing selective boron exchange resins can effectively remove boron from drinking water. Water treatment plants (WTPs) in Saskatchewan regulated by the WSA continue to adopt Best Available Technologies including the use of membrane systems for treating and supplying drinking water to consumers. Based on available water quality data and the current/evolving water treatment processes in use in the province, WSA believes that the new MAC for boron if eventually adopted as a drinking water standard in the province may not pose a significant compliance challenge. Cost estimation for treatment plant upgrades, if any for the affected WSA regulated communities is not developed at this time. Before formal adoption of any drinking water standard for boron in Saskatchewan, the WSA will conduct further studies to determine the occurrence and level of exposure to boron by examining various water sources and treatment technologies in the province.
Yukon
It is not anticipated that the Guideline Technical Document for Boron will have a significant impact on Yukon large public drinking water systems at this point in time.
Appendix C: Canadian water quality data
| Region | River basin | Number of samples |
Number of detectsFootnote a |
Median (mg/L) |
Mean (mg/L) |
90th percentile (mg/L) |
Maximum (mg/L) |
|---|---|---|---|---|---|---|---|
| East | Maritime Coast | 574 | 80 | 0.012 | 0.014 | 0.020 | 0.058 |
| Newfoundland and Labrador | 1,005 | 972 | 0.003 | 0.004 | 0.008 | 0.014 | |
| North Shore-Gaspé | 37 | 34 | 0.001 | 0.001 | 0.002 | 0.002 | |
| Saint John | 89 | 0 | |||||
| Central | Winnipeg | 44 | 44 | 0.007 | 0.010 | 0.008 | 0.124 |
| Prairie | Assiniboine | 743 | 742 | 0.120 | 0.014 | 0.240 | 2.08 |
| Churchill | 245 | 245 | 0.030 | 0.030 | 0.060 | 0.130 | |
| Lower Saskatchewan-Nelson | 328 | 328 | 0.042 | 0.051 | 0.087 | 0.261 | |
| Missouri | 94 | 94 | 0.034 | 0.044 | 0.080 | 0.132 | |
| North Saskatchewan | 417 | 416 | 0.017 | 0.080 | 0.244 | 0.417 | |
| South Saskatchewan | 644 | 633 | 0.006 | 0.014 | 0.029 | 0.082 | |
| Pacific | Columbia | 3,540 | 3,273 | 0.002 | 0.003 | 0.007 | 0.018 |
| Fraser | 3,194 | 3,124 | 0.004 | 0.008 | 0.025 | 0.060 | |
| Okanagan-Similkameen | 906 | 902 | 0.006 | 0.007 | 0.012 | 0.016 | |
| Pacific Coastal | 2,421 | 2,338 | 0.008 | 0.009 | 0.018 | 0.043 | |
| Peace-Athabasca | 320 | 314 | 0.003 | 0.004 | 0.007 | 0.059 | |
| Arctic | Arctic Coast | 133 | 112 | 0.003 | 0.004 | 0.006 | 0.056 |
| Keewatin | 34 | 34 | 0.003 | 0.002 | 0.004 | 0.004 | |
| Lower MacKenzie | 839 | 817 | 0.008 | 0.009 | 0.015 | 0.057 | |
| Yukon | 596 | 586 | 0.002 | 0.003 | 0.005 | 0.013 | |
Source: Environment and Climate Change Canada, 2017
|
|||||||