
Guidelines for Canadian drinking water quality: Iron
Download the alternative format
(PDF format, 1.0 MB, 78 pages)
Organization: Health Canada
Published: 2023
Iron
Guideline Technical Document
for Public Consultation
Consultation period ends
November 28, 2023
Purpose of consultation
This guideline technical document evaluated the available information on iron with the intent of updating the guideline value for iron in drinking water. The purpose of this consultation is to solicit comments on the proposed guidelines, on the approach used for its development, and on the potential impacts of implementing them. The existing guideline technical document on iron in drinking water, developed in 1978, recommended an aesthetic objective (AO) of ≤ 0.3 mg/L (300 µg/L). A health-based guideline was not established at that time, as there was no consistent, convincing evidence that iron in drinking water could cause adverse health effects in humans. The review of the literature confirms there is still no need for a health-based guideline. This document proposes an of AO ≤ 0.1 mg/L (100 µg/L) for total iron in drinking water based on aesthetic and treatment considerations. The document was reviewed by external experts and subsequently revised.
This document is available for a 60-day public consultation period. Please send comments (with rationale, where required) to Health Canada via email at water-eau@hc-sc.gc.ca.
If email is not feasible, comments may be sent by postal mail to this address:
Water and Air Quality Bureau
Health Canada
269 Laurier Ave West, A.L. 4903D
Ottawa ON K1A 0K9
All comments must be received before November 28, 2023. Comments received as part of this consultation will be shared with members of the Federal-Provincial-Territorial Committee on Drinking Water (CDW), along with the name and affiliation of their author. Authors who do not want their name and affiliation shared with CDW members should provide a statement to this effect along with their comments.
It should be noted that this guideline technical document may be revised following the evaluation of comments received, and a drinking water guideline will be established, if required. This document should be considered as a draft for comment only.
Proposed guideline
An aesthetic objective (AO) of ≤ 0.1 mg/L (100 µg/L) is proposed for total iron in drinking water.
Executive summary
This guideline technical document was prepared in collaboration with the Federal-Provincial-Territorial Committee on Drinking Water and assesses all available information on iron.
Exposure
Iron is a ubiquitous metal that enters the environment from both natural sources and human activities. It occurs mostly in the form of organic and inorganic compounds and, to a lesser extent, in its metallic form. Iron is used mainly for steel production and industrial, commercial and consumer product applications, such as water mains, batteries, pesticides, fertilizers, cosmetics, food additives and multivitamin supplements.
Canadians are exposed to iron mainly through food, and to a lesser extent via drinking water, principally because of corrosion in the distribution system. Exposure through drinking water contributes less than 10% of the total daily iron intake. In most Canadian sources of water, the median iron concentration is below 1 mg/L. Higher concentrations are typically found in groundwater. The iron content in treated water entering the distribution system is generally very low. Elevated iron concentrations are likely to result in an off-flavor (bitter or metallic taste) and discoloured water.
Health effects
Iron is an essential element for humans. However, oral exposure to very high levels may cause adverse health effects, with gastrointestinal distress being the most sensitive endpoint. The overall weight of scientific evidence indicates that iron is neither a reproductive toxicant nor a developmental toxicant nor a carcinogen.
Aesthetic considerations
Concerns about iron in drinking water are often related to consumer complaints regarding discoloured water. The proposed AO of ≤ 0.1 mg/L (100 µg/L) is intended to minimize the occurrence of discoloured water due to the presence of iron oxides and to improve consumer confidence in drinking water quality. It is important to note that when both iron and manganese (Mn) are present, the removal of iron generally improves the removal of Mn and thus will reduce the health risk associated with this metal.
Analytical and treatment considerations
The development of a drinking water guideline takes into consideration the ability to measure the contaminant and to remove it from drinking water supplies. Several analytical methods are available for measuring iron in water at concentrations well below the proposed AO. Total iron, which includes both the dissolved and particulate forms of iron in a water sample, should be measured.
At the municipal level, treatment technologies that are available to effectively decrease iron concentrations in drinking water include aeration, chemical oxidation followed by filtration, coagulation, adsorption, membrane filtration, and coagulation followed by ultrafiltration. The performance of these technologies depends on factors such as iron species, pH, coagulant type, coagulant dose and type of adsorbent. Using appropriate process controls, these technologies can achieve treated water concentrations well below the proposed AO. Most well-operated and optimized treatment plants can achieve iron concentrations of 0.1 mg/L or less in the treated water. The proposed AO of ≤ 0.1 mg/L would minimize the occurrence of discoloured water and taste complaints, aid in the removal of co-occurring Mn, ensure that a disinfectant residual is maintained and improve consumer confidence in drinking water quality. Prior to full-scale implementation, bench- and/or pilot-scale studies should be conducted using source water to ensure sufficient iron removal and to optimize performance.
In cases where iron removal is desired at a small-system or household level, for example, a private well, a residential drinking water treatment unit may be an option. Although there are no treatment units currently certified for the removal of iron from drinking water, technologies that are expected to be effective include ion exchange, oxidizing filters and reverse osmosis. When using a residential drinking water treatment unit, it is important to take samples of water entering and leaving the treatment unit and send them to an accredited laboratory for analysis, to ensure that adequate iron removal is achieved. Routine operation and maintenance of treatment units, including replacement of filter components, should be conducted according to manufacturer specifications.
Distribution system
It is recommended that water utilities develop a distribution system management plan to minimize the release of iron and the potential for co-occurring contaminants in the system. This includes minimizing the iron concentration entering the distribution system and distribution system maintenance (main cleaning). It is particularly important to maintain stable chemical and biological water quality conditions throughout the system and minimize physical and hydraulic disturbances that can release iron corrosion by-products.
Application of the guidelines
Note that specific guidance on implementing drinking water guidelines should be obtained from the appropriate drinking water authority.
All water utilities should implement a risk management approach, such as the source-to-tap or water safety plan approach, to ensure water safety. These approaches require a system assessment to characterize the source water; describe the treatment barriers that prevent or reduce contamination; identify the conditions that can result in contamination; and implement control measures. Operational monitoring is then established and operational and management protocols, such as standard operating procedures, corrective actions and incident responses, are instituted. Other protocols to validate the water safety plan, such as record keeping and consumer satisfaction, are also implemented. Operator training is also required to always ensure the effectiveness of the water safety plan.
Considering that iron levels can vary significantly in source water, within treatment plants, and especially in distribution systems, monitoring programs should be system-specific to enable utilities to have a good understanding of iron levels from source to tap. Monitoring programs should be designed based on risk factors that contribute to the likelihood of finding elevated iron levels in the drinking water system. These factors may include historical infrastructure (for example, presence of unlined cast iron mains), lack of treatment, limited distribution system maintenance and variable source and distribution system water chemistry. The sampling locations, frequency and type of samples that should be collected will differ depending on the desired goal (such as identifying sources of iron, minimizing accumulation and removal of co-occurring Mn) and site-specific considerations. Suggested monitoring details for different points in a drinking water system are provided in section 5.2.
Total iron in drinking water should be monitored at the tap when discolouration (coloured water) events occur. Discolouration events may be accompanied by the release of accumulated contaminants, including arsenic (As), lead (Pb), Mn and radiological contaminants. Iron oxides can adsorb and accumulate these contaminants and release them into the bulk water and plumbing systems. Therefore, discoloured water events should not be considered only an aesthetic issue; they should trigger sampling for iron and other metals and possibly distribution system maintenance.
Table of Contents
- Proposed guideline
- Executive summary
- 1.0 Exposure Considerations
- 2.0 Health Considerations
- 3.0 Derivation of a Health-Based Value (HBV)
- 4.0 Analytical and Treatment Considerations
- 5.0 Management Strategies
- 6.0 International considerations
- 7.0 Rationale
- 8.0 References
- Appendix A: List of abbreviations
- Appendix B Canadian water quality data.
- Appendix C: Summary of iron removal for residential scale technologies
1.0 Exposure Considerations
1.1 Substance identity
Iron (Fe) is an essential metal that is highly reactive and abundant in the Earth's crust. Divalent (Fe(II) or ferrous) and trivalent (Fe(III) or ferric) iron are the most common species of iron, and the most biologically and toxicologically relevant species (PubChem, 2004; Ponka et al., 2015; U.S. GS, 2017; ECCC, 2019). Table 1 presents select physicochemical properties of iron.
| Property | Value | Interpretation |
|---|---|---|
| CAS RN | 7439-89-6 | Not applicable |
| Molecular weight (g/mol) | 55.84 | Not applicable |
| Water solubility (mol/L) | 11.2Footnote * | Insoluble in water at room temperature, neutral and basic pH |
| Vapour pressure (Pa) | 1 at 1 455°C | Solid, non-volatile at room temperature |
| Octanol-water partition coefficient (Kow) | -0.77Footnote * | Insoluble in fat-like solvents |
Source: PubChem (2004), unless specified otherwise.
Footnotes
- Footnote *
-
From the online U.S. CompTox Chemicals Database.
Iron occurs in water in nonheme form, whereas in food it is present as both heme and nonheme iron (see section 1.3). Drinking water levels and dietary recommendations for iron are expressed in terms of total iron, that is, Fe(II) and Fe(III). Ferrous iron is highly water soluble and the most bioavailable species. In the sections below, "total iron" is used when referring to the sum of all the major oxidation states of nonheme iron (that is, Fe(II), Fe(III)). The term "iron" (Fe) is used when referring to either Fe(II) or Fe(III), and iron cycles between these two oxidative states. In all other cases, the iron species is specified.
1.2 Uses, sources and environmental fate
Uses: Iron is still mined in Canada with most of the ore production in Quebec and Newfoundland and Labrador. In 2018, Canada was the eighth largest world producer of iron ore with a total production of 52.4 million tonnes (Mt), exports totalling around 48 Mt and imports estimated at 10.1 Mt (ECCC, 2019; NRC, 2019). Globally, up to 98% of mined iron ore is used to make steel. The rest is used in many non-steel applications, for example, as a construction material in cast-iron water pipes and galvanized (steel) iron pipes in plumbing systems, an active ingredient in pesticides or a nutrient in fertilizers (WHO, 2003; PubChem, 2004; Ponka et al., 2015; Health Canada, 2017, 2018; ECCC, 2019; NRC, 2019).
Sources: Iron may enter the environment from both natural and anthropogenic sources. Except for some rare deposits in Canada, such as the Labrador Trough in northern Labrador and northeastern Quebec, iron is usually found in soils, rocks and sediments as compounds in which the oxide minerals (for example, hematite) are predominant (WHO, 2003; PubChem, 2004; NHMRC and NRMMC, 2011; Ponka et al., 2015; U.S. GS, 2017; ECCC, 2019). Iron is released to the environment from these natural sources through volcanic activity, weathering and leaching. Agricultural activities (for example, use of pesticides and fertilizers) may also contribute to iron levels in soil. Iron in air is mainly due to emissions from industrial activities such as mining, smelting and combustion of fossil fuels, including coal and coke. Finally, in natural waters, iron may be present at natural background levels due to geological processes (for example, soil percolation, runoff) and, to a lesser extent, human activities, including mine drainage water, acid mine effluents and agricultural runoff (WHO, 2017; ECCC, 2019). However, iron-based materials such as cast iron, ductile iron, galvanized iron, and steel are the principal sources of iron in drinking water distribution systems. Iron may be released directly from iron-based materials or indirectly as iron corrosion by-products, or tubercles, which form during the corrosion process (Civardi and Tompeck, 2015). It may also be present in drinking water because of its use for water treatment (for example, iron-based coagulants) (WHO, 2017).
Environmental fate: In the air, iron compounds are transported as windblown particulate matter (that is, dust or volcanic ash) that end up on land and water by wet and dry deposition. Although iron is unlikely to volatilize from soil and water owing to its physicochemical properties, it can be removed from soil and sediments via adsorption to sludge.
In the environment, iron is subject to a series of redox reactions, also known as iron cycling, in which zero-valent iron (Fe0) is oxidized to Fe(II) and Fe(III), which in turn cycles between these two oxidative states. This usually results in the formation of mixed ferrous/ferric compounds including hydroxides and oxides. However, the fate and prevalence of each oxidation state will depend on a number of physicochemical factors, including redox potential, temperature, presence of organic and inorganic sequestering agents (such as dissolved organic carbon and organic matter), exposure to sunlight and presence of iron-metabolizing microorganisms (Peeters et al., 2016; ECCC, 2019).
In anaerobic environments such as groundwater, sediment pore water and acidic streams, ferrous iron is the predominant species. Although stable at neutral to alkaline pH, hydroxylated ferrous iron complexes (for example, Fe(II)-minerals) are soluble under acidic conditions where they readily dissolve to release ferrous ions (Fe2+). Therefore, while iron levels may increase in the absence of complexing ligands, they will decrease in their presence, favouring the formation of black mineral slimes (Peeters et al., 2016). When rivers and streams are impounded, iron levels increase. The amount of iron dissolved in the surface water depends on the characteristics of the soil and the amount of plant life present. Decomposition of organic matter (algae, leaves and other plant materials) in the lower sections of a reservoir may lead to anaerobic conditions (that is, near-zero dissolved oxygen [DO]), which promote the conversion of iron (and manganese [Mn]) compounds in those zones to soluble compounds (Civardi and Tompeck, 2015).
In aerobic environments, such as the upper layers of soils and aerated surface water, Fe(III)is usually the predominant species. Nonetheless, iron levels tend to be low in oxygenated waters. Although iron can exist as the ion (Fe3+) under strongly acidic conditions (for example, pH < 3), it will precipitate out mainly in the form of sparingly soluble organic and inorganic Fe(III)-complexes (for example, with organic acids) under neutral to alkaline pH (Peeters et al., 2016; ECCC, 2019). Thus, dissolved iron is generally found in (aerated) aquatic environments in the form of insoluble suspensions of ferric hydroxide (Fe(OH)n) particles, which can settle out as rust-colored deposits (for example, in tanks and pipes) and silts (for example, in waterways) or form yellow-brown deposits on bottom sediments and in many streams draining coal mining regions (WHO, 2003; Ponka et al., 2015; WHO, 2017). Dissolved iron may also occasionally be found as ferric oxide (Fe2O3), which precipitates to form red waters. This results in turbidity and decreased light penetration (ECCC, 2019).
Finally, iron can also promote the growth of iron bacteria within the distribution system or waterworks, resulting in the deposition of slimy coatings on piping (WHO, 2017).
1.3 Exposure
The main sources of iron exposure for the Canadian general population are food and, to a lesser extent, drinking water (IOM, 2001; Health Canada, 2009; Health Canada, 2010; Health Canada, 2017). Although rare, exposure to iron in the air may occur near industries (for example, foundries), with intakes of approximately 25 µg/day reported for urban areas (WHO, 2003).
In Canada, the mean total intake of iron ranges from 14.3 to 18.3 mg per day, mostly from food. Exposure through drinking water constitutes less than 10% of the average total daily intake. Drinking water containing a mean iron level of 1 mg/L would contribute only about 1.5 mg to daily intake as the potential for inhalation and dermal exposure through drinking water is negligible.
Drinking water: The provinces and territories provided water monitoring data (municipal and non-municipal supplies). Where indicated, data were separated into groundwater and surface water sources. When the source type could not be discerned, it was classified as ground and/or surface water. Samples were divided into raw, treated and distribution water. When not indicated or not possible to determine, samples were classified as RTD (raw/treated/distributed). Total iron concentrations were also obtained from the National Drinking Water Survey (Health Canada, 2017). The exposure data provided reflect the different method detection limits (MDL) used by accredited laboratories within and among the different jurisdictions, as well as their respective monitoring programs. As a result, the statistical analysis of the data provides only a limited picture of exposure.
Table 2. Occurrence of total iron in Canadian drinking water
| Jurisdiction (DL mg/L) | Municipal/ Non-municipal | Water type | # Detects/ samples | % Detects | Concentration (mg/L) | ||
|---|---|---|---|---|---|---|---|
| Median | Mean | 90th percentile | |||||
| British ColumbiaFootnote 1 (0.01–0.1) [2010–2020] | Municipal | Ground – raw | 166/197 | 84.3 | 0.10 | 0.72 | 1.63 |
| Ground – treated | 3/5 | 60.0 | 0.16 | 0.62 | NC | ||
| Ground – distribution | 83/83 | 100 | 0.10 | 0.25 | 0.43 | ||
| Ground – RTD | 406/500 | 81.2 | 0.05 | 0.35 | 0.85 | ||
| Surface – raw | 45/49 | 91.8 | 0.06 | 0.10 | 0.21 | ||
| Surface – treated | 9/10 | 90.0 | 0.02 | 0.04 | 0.13 | ||
| Surface –distribution | 18/18 | 100 | 0.10 | 0.20 | 0.83 | ||
| Surface – RTD | 150/173 | 86.7 | 0.05 | 0.19 | 0.39 | ||
| Ground and/or Surface – raw | 22/30 | 73.3 | 0.12 | 0.50 | 2.0 | ||
| Ground and/or Surface – treated | 2/5 | 40.0 | < DL | 0.12 | NC | ||
| Ground and/or Surface – distribution | 7/7 | 100 | 0.10 | 0.15 | NC | ||
| Ground and/or Surface – RTD | 169/240 | 70.4 | 0.03 | 0.35 | 0.54 | ||
| ManitobaFootnote 2 (0.01–0.1) [2010–2020] | Semi-Public | Ground – raw | 176/207 | 85.0 | 0.43 | 0.95 | 2.54 |
| Ground – treated | 141/214 | 65.9 | 0.05 | 0.31 | 0.81 | ||
| Ground – distribution | 10/14 | 71.4 | 0.06 | 0.28 | 1.4 | ||
| Ground – not disinfected | 338/427 | 79.2 | 0.16 | 0.60 | 1.65 | ||
| Surface – raw | 44/49 | 89.8 | 0.17 | 0.41 | 0.80 | ||
| Surface – treated | 34/50 | 68.0 | 0.05 | 0.13 | 0.32 | ||
| Surface-distribution | 6/10 | 60.0 | 0.02 | 0.17 | 1.06 | ||
| GUDI – raw | 37/44 | 84.1 | 0.14 | 1.18 | 1.29 | ||
| GUDI – treated | 32/55 | 58.2 | 0.02 | 0.09 | 0.26 | ||
| GUDI – distribution | 2/2 | 100 | 0.07 | 0.07 | NC | ||
| GUDI – not disinfected | 38/46 | 82.6 | 0.09 | 0.45 | 1.47 | ||
| Municipal | Ground – raw | 676/778 | 86.9 | 0.44 | 0.91 | 2.44 | |
| Ground – treated | 486/745 | 65.2 | 0.07 | 0.35 | 1.06 | ||
| Ground – distribution | 162/224 | 72.3 | 0.05 | 0.40 | 1.11 | ||
| Ground – not disinfected | 4/4 | 100 | 0.33 | 0.40 | NC | ||
| Surface – raw | 546/622 | 87.8 | 0.19 | 0.44 | 0.87 | ||
| Surface – treated | 290/613 | 47.3 | < DL | 0.12 | 0.32 | ||
| Surface – distribution | 128/178 | 71.9 | 0.03 | 0.13 | 0.29 | ||
| GUDI – raw | 119/166 | 71.7 | 0.21 | 0.53 | 1.48 | ||
| GUDI – treated | 72/166 | 43.3 | < DL | 0.15 | 0.47 | ||
| GUDI – distribution | 21/51 | 41.2 | < DL | 0.21 | 0.52 | ||
| GUDI – not disinfected | 6/6 | 100 | 0.15 | 0.31 | NC | ||
| New BrunswickFootnote 3 (0.001–0.02) [2010–2020] | Semi-public | Ground – raw | 157/201 | 78.1 | 0.75 | 0.56 | 1.1 |
| Ground – treated | 247/742 | 33.3 | < DL | 0.04 | 0.05 | ||
| Ground – distribution | 128/250 | 51.2 | 0.01 | 0.05 | 0.15 | ||
| Ground – RTD | 191/420 | 45.5 | < DL | 0.23 | 0.17 | ||
| Municipal | Ground – raw | 1 327/2 178 | 60.9 | 0.02 | 0.13 | 0.34 | |
| Ground – treated | 4/31 | 12.9 | < DL | 0.01 | 0.02 | ||
| Ground – distribution | 324/821 | 39.5 | < DL | 0.03 | 0.05 | ||
| Surface – raw | 163/191 | 85.3 | 0.06 | 0.07 | 0.14 | ||
| Surface – distribution | 236/297 | 79.5 | 0.03 | 0.07 | 0.14 | ||
| Ground and Surface – raw | 125/155 | 80.7 | 0.14 | 0.40 | 1.17 | ||
| Ground and Surface – treated | 3/4 | 75.0 | 0.01 | 0.01 | NC | ||
| Ground and Surface – distribution | 782/942 | 83.0 | 0.04 | 0.08 | 0.17 | ||
| NewfoundlandFootnote 4 (0.03 and 0.05) [2013–2020] | Municipal | Ground – raw | 106/295 | 35.9 | < DL | 0.22 | 0.44 |
| Ground – distribution | 483/2 001 | 24.1 | < DL | 0.07 | 0.11 | ||
| Surface – raw | 839/1 004 | 83.6 | 0.10 | 0.17 | 0.42 | ||
| Surface – distribution | 3 767/5 109 | 73.7 | 0.08 | 0.16 | 0.36 | ||
| Nova ScotiaFootnote 5 (0.05) [2000–2020] | Semi – Public | Ground – raw | 59/155 | 38.1 | < DL | 0.46 | 0.87 |
| Ground – treated | 138/331 | 41.7 | < DL | 0.31 | 0.53 | ||
| Ground – RTD | 399/726 | 55.0 | 0.04 | 0.43 | 0.84 | ||
| Surface – raw | 13/19 | 68.4 | 0.05 | 0.08 | 0.20 | ||
| Surface – treated | 5/9 | 55.6 | 0.03 | 0.13 | NC | ||
| Municipal | Ground – raw | 141/300 | 47 | < DL | 0.21 | 0.43 | |
| Ground – treated | 56/243 | 23.0 | < DL | 0.07 | 0.13 | ||
| Ground – RTD | 6/18 | 33.3 | < DL | 0.18 | 0.87 | ||
| Surface – raw | 139/178 | 78.1 | 0.16 | 0.24 | 0.47 | ||
| Surface – treated | 206/565 | 36.5 | < DL | 0.07 | 0.14 | ||
| Surface – distribution | 3/25 | 12.0 | < DL | 0.04 | 0.11 | ||
| Ground – raw | 74/91 | 91.3 | 0.33 | 1.08 | 2.6 | ||
| OntarioFootnote 6 (0.0005–0.1) [2018–2020] | Non-municipal | Ground – treated | 89/142 | 62.7 | 0.09 | 0.27 | 0.64 |
| Ground – distribution | 45/73 | 61.6 | 0.03 | 0.20 | 0.79 | ||
| Surface – raw | 4/10 | 40.0 | < DL | 0.03 | 0.16 | ||
| Surface – distribution | 4/5 | 80.0 | 0.01 | 0.02 | NC | ||
| Ground and Surface – distribution | 3/14 | 21.4 | < DL | 0.06 | 0.12 | ||
| Ground – raw | 3 324/4 238 | 78.4 | 0.13 | 0.41 | 0.95 | ||
| Municipal | Ground – treated | 1 826/2 292 | 79.7 | 0.05 | 0.17 | 0.49 | |
| Ground – distribution | 1 682/2 326 | 72.3 | 0.05 | 0.08 | 0.20 | ||
| Surface – raw | 941/1 098 | 85.7 | 0.09 | 0.23 | 0.34 | ||
| Surface – treated | 730/1 461 | 50.0 | 0.01 | 0.03 | 0.08 | ||
| Surface – distribution | 2 439/4 101 | 59.5 | 0.03 | 0.05 | 0.10 | ||
| Ground and Surface – treated | 30/52 | 57.7 | 0.01 | 0.03 | 0.03 | ||
| Ground and Surface – distribution | 657/931 | 70.6 | 0.02 | 0.06 | 0.11 | ||
| Ground – RTD | 1 769/ 24 331 | 7.3 | < DL | 0.03 | < DL | ||
| Prince Edward IslandFootnote 7Footnote a (0.002) [2019–2022] | Non-municipal and Municipal | Ground – raw | 2 121/ 15 119 | 14.0 | 0.003 | 0.048 | 0.003 |
| SaskatchewanFootnote 8 (0.0005–0.1) [2010–2020] | Municipal | Surface – raw | 3 784/3 937 | 96.1 | 0.02 | 0.31 | 0.54 |
| Ground and/or Surface – treated | 84/92 | 91.3 | 0.01 | 0.29 | 0.27 | ||
| Ground and/or Surface – distribution | 2 059/2 396 | 85.9 | 0.02 | 0.37 | 1.03 | ||
| Ground – treated | 2 375/3 316 | 71.6 | 0.05 | 0.20 | 0.59 | ||
| CanadaFootnote b | Municipal | Ground – distribution | 2 734/5 455 | 50.1 | 0.03 | 0.08 | 0.18 |
| Surface – treated | 1 235/2 649 | 46.6 | < DL | 0.06 | 0.15 | ||
| Surface – distribution | 6 591/9728 | 67.8 | 0.06 | 0.11 | 0.24 | ||
DL – Detection Limit; < DL – below detection limit (for median with < 50% detects; for 90th percentile with <10% detects and mean with 0% detects); NC -not calculated due to insufficient sample size; RTD – Raw, treated or distributed water (Not specified); GUDI – groundwater under the direct influence of surface water.
For analytical purposes, values below DL were assigned half of DL.
- Footnote a
-
All values analyzed were for dissolved iron.
- Footnote b
-
Canadian values were calculated as the weighted mean of Fe concentrations from the above provinces/territories (P/T) [Sum of (P/T No. of samples) × (P/T mean Fe concentration)]/Total no. of samples.
- Footnote 1
-
British Columbia Ministry of Health (2021).
- Footnote 2
-
Manitoba Sustainable Development (2021).
- Footnote 3
-
New Brunswick Department of Environment and Local Government (2019).
- Footnote 4
-
Newfoundland and Labrador Department of Municipal Affairs and Environment (2019).
- Footnote 5
-
Nova Scotia Environment (2019).
- Footnote 6
-
Ontario Ministry of the Environment, Conservation and Parks (2019).
- Footnote 7
-
PEI Department of Communities, Land and Environment (2019).
- Footnote 8
-
Saskatchewan Water Security Agency (2019).
| Water Type | Summer (mg/L) | Winter (mg/L) | ||||||||
|---|---|---|---|---|---|---|---|---|---|---|
| Detects/Samples | % Detect | Median | Mean | 90th | Detect/ Samples | % Detect | Median | Mean | 90th | |
| Well – raw | 4/17 | 23.5 | < RDL | 0.20 | 0.70 | 0/9 | 0 | < RDL | <RDL | < RDL |
| Well – treated | 1/16 | 6.3 | < RDL | 0.07 | <RDL | 0/9 | 0 | < RDL | <RDL | < RDL |
| Well – distribution | 6/51 | 11.8 | < RDL | 0.08 | 0.15 | 4/27 | 14.8 | < RDL | 0.09 | 0.24 |
| Lake – raw | 5/16 | 31.3 | < RDL | 0.19 | 0.81 | 1/11 | 9.1 | < RDL | 0.10 | < RDL |
| Lake – treated | 1/16 | 6.3 | < RDL | 0.05 | < RDL | 1/11 | 9.1 | < RDL | 0.06 | < RDL |
| Lake – distribution | 6/51 | 11.8 | < RDL | 0.07 | 0.15 | 2/16 | 12.5 | < RDL | 0.07 | 0.10 |
| River – raw | 16/28 | 57.1 | 0.13 | 0.58 | 1.61 | 5/19 | 26.3 | < RDL | 0.37 | 0.73 |
| River – treated | 2/22 | 9.1 | < RDL | 0.07 | < RDL | 0/11 | 0 | < RDL | <RDL | < RDL |
| River – distribution | 8/77 | 10.4 | 0.05 | 0.07 | 0.10 | 1/30 | 3.3 | < RDL | 0.05 | < RDL |
RDL – Reporting Detection Limit; < RDL – below reporting detection limit (for median with < 50% detects; for 90th percentile with < 10% detects and mean with 0% detects).
RDL= 0.1 mg/L. For analytical purposes, values below RDL were assigned half of RDL.
Food: Iron is naturally present in a variety of food of plant or animal origin. It may also be added to certain foods and infant formula for fortification and may be available as (or in) dietary supplements and prescription medicines. In general, while supplements may increase the median daily intake of iron by approximately 1 mg for both men and women, food can increase the daily intake by 1 mg/day for women and by 5 mg/day for men (IOM, 2001).
The most up-to-date data on dietary iron exposure of Canadians are from the Canadian Community Health Survey (CCHS) on nutrition, which provides estimates of usual intakes for iron from food using data collected at the national, regional, and provincial levels from Canadians aged one year and older, by 16 dietary reference intake age-sex groups, using 24-hour dietary recalls, in 2004 and 2015 (CCHS–Nutrition). The 2004 and 2015 CCHS– Nutrition data excluded supplements as well as pregnant and breastfeeding individuals since they are subject to a different set of nutritional recommendations. According to the CCHS–Nutrition data, in 2004 Canadians' dietary intake of iron (mean ± standard error [SE]) ranged from 9.6 ± 0.2 to 18.8 ± 0.4 mg/day with males having the highest intakes. In 2015, the highest intake values were still obtained for males, with a small reduction in dietary intakes (mean ± SE: 8.3 ± 0.2 to 16.3 ± 0.4 mg/day). Intakes ranged from 12.3 ± 0.2 to 16.3 ± 0.4 mg/day for males 9 to 71 years old, and from 9.9 ± 0.2 to 12 ± 0.2 mg/day for females in the same age category. Dietary intakes were 8.3 ± 0.2 mg/day for children of both sexes from 1 to 3 years old, and 11.4 ± 0.2 mg/day for those from 4 to 8 years old. Similar levels (that is, 10–20 mg/day) were reported in the literature for a typical Western mixed diet (Geisser and Burckhardt, 2011; Fonseca-Nunes et al., 2014).
Foods commonly consumed in Canada were analyzed for iron levels and the estimated concentrations were reported in the Canadian Nutrient File (CNF) database used for the 2015 CCHS–Nutrition (2015 CNF). According to the 2015 CNF database, iron levels range from low (that is, < 1 to ≤ 5 mg/kg) for fats and oils, many fruits, non-green vegetables, coffee, tea, uncontaminated municipal water, dairy products, to medium (that is, > 5 to ≤ 10 mg/kg) for meat (for example, red meat, poultry, pork), eggs (yolks), fish, green vegetables, grains, seeds, nuts, beans, and so on, to high (that is, > 10 to 123.6 mg/kg) for foods such as liver and offal, game meat, seaweed, spices, bread, breakfast cereals, grain products, and other fortified foods. The 2015 CNF database did not explicitly report iron levels in infant formula or human milk. However, average iron levels of 0.35 to 6 mg/L for infant formula and 0.2 to 0.5 mg/L for human milk have been reported elsewhere (IOM, 2001; Quinn, 2014; EFSA, 2015; Hare et al., 2018).
Iron generally occurs in foods in two main forms, both of which contain the mineral in the ferric state: heme (organic) and nonheme (inorganic) iron. Nonheme iron is the most prevalent form found in foods of plant or animal origin, fortified foods and supplements, with about 60% of iron in foods of animal origin being nonheme iron (Collard, 2009; Health Canada, 2009; Fonseca-Nunes et al., 2014; Anderson and Frazer, 2017). Nonheme iron is the main source of the nutrient for infants (Collard, 2009). Heme iron is mostly found in foods of animal origin and its contribution to total daily iron intake is estimated to be between 4% and 6% (IOM, 2001; Collings et al., 2013; Ashmore et al., 2016; Chang et al., 2019).
Other exposure pathways: Canadians may be exposed to iron through soil and ambient air. Iron is found in soil at varying levels and mostly in the form of oxy or hydroxyl complexes. However, due to its physicochemical properties and anticipated use pattern, soil is not expected to be a significant source of exposure for the general population in Canada (Health Canada, 2017).
Data on iron levels in Canadian ambient air were not found in the literature search. However, iron is a non-volatile metal and airborne levels of iron are expected to be negligible in non-occupational settings. Levels ranging from 50 to 90 ng/m3 in remote areas and as high as 1.3 µg/m3 in urban sites have been reported. Higher levels may be found near industrial settings, such as foundries. Levels 10 times higher than the mentioned urban levels were reported in the vicinity of iron- and steel-producing plants (WHO, 2003; Ponka et al., 2015).
Biomonitoring: Serum ferritin, an acute phase reactant, is considered a valid measure for body stores of total iron (van der A et al., 2006; Cooper et al., 2012; Fonseca-Nunes et al., 2014; Ginzburg and Vinchi, 2019). A serum ferritin concentration below 12 µg/L is associated with totally depleted body iron stores, whereas levels above 200 µg/L (in women) and 300 µg/L (in men) may indicate (biochemical) iron overload. A serum ferritin level greater than or equal to 30 µg/L and less than 200 µg/L is usually associated with adequate iron status (that is, level of iron stores) (IOM, 2001; EFSA, 2004; EFSA, 2015; Ashmore et al., 2016).
Serum ferritin concentrations have been measured in Canadian Health Measures Survey (CHMS) cycles 2 through 6 (Statistics Canada, 2019). Data from those surveys indicate that more than 95% of Canadians from 3 to 79 years old had adequate serum ferritin levels (suggesting high iron stores) and that males had higher levels than females. Serum ferritin concentrations (as central tendency measures) reported for Canadians of both sexes from 6 to 19 years old were as follows: 42, 36, 33, 31 and 33 µg/L in 2011, 2013, 2015, 2017 and 2019, respectively. Higher levels were reported (as central tendency measures) for both Canadian men and women 20 to 79 years old (96, 80, 75, 76 and 77 µg/L in 2011, 2013, 2015, 2017 and 2019, respectively (Statistics Canada, 2021).
2.0 Health Considerations
2.1 Essentiality
Iron is a trace element that is required for the biosynthesis of various heme-containing proteins (for example, hemoglobin, myoglobin) and enzymes (for example, cytochromes, catalases, peroxidases, ribonucleotide reductases) as well as a number of other iron-binding proteins and prosthetic groups (for example, iron-sulphur clusters) which are essential at every stage of life for the biological processes of many living organisms, including humans. These processes include erythropoiesis; oxygen transport and storage; mitochondrial processes; DNA synthesis and repair; neurotransmitter and myelin synthesis; host defense; cell replication, metabolism (for example, glucose homeostasis) and growth (IOM, 2001; WHO, 2003; EFSA, 2004; Health Canada, 2009; Beguin et al., 2014; Ashmore et al., 2016; Czerwonka and Tokarz, 2017; Muckenthaler et al., 2017).
In healthy individuals, the optimal functioning of these processes depends on iron homeostasis. The latter is regulated by the hepatic hormone hepcidin, a type II acute-phase reactant, and maintained through tight regulation of iron (intestinal) uptake, distribution, storage, metabolism and release (for example, release of recycled iron from macrophages) (Andrews and Schmidt, 2007; Collard, 2009; Beguin et al., 2014; Kew, 2014; Schrier, 2015; Anderson and Frazer, 2017).
Homeostatic mechanisms are not fully operational in infants aged 6 months or less. However, initial iron stores established during pregnancy are generally sufficient to support the needs of healthy term neonates (born from a normal pregnancy) during the first 6 months of life. No study to date has found an increase in serious iron-induced health risks in breast-fed infants, even when they were given significant oral iron supplementation. This is thought to be attributable to lactoferrin, an iron-chelating glycoprotein found abundantly in human breast milk (Collard, 2009; Health Canada, 2009; Health Canada, 2009; Lipinski et al., 2013).
To keep iron levels within optimal physiologic ranges and avoid the adverse health consequences of both iron deficiency and iron overload in otherwise healthy Canadians, health authorities have established life stage and gender-specific dietary reference intakes (IOM, 2001; Health Canada, 2010). Recommended dietary allowances (RDA) between 7 and 27 mg/day have been set to meet the iron requirements of nearly all healthy Canadians. Intakes at the low end (that is, RDA 7–9 mg/day) are recommended for children up to age 13, male adults and nursing women over 19 years old, and post-menopausal women over 51 years old. Intakes in the mid-range (that is, RDA 10–18 mg/day) are recommended for children (4–8 years old), teenagers (14–18 years old), nursing women under 18 years old, and non-pregnant women of reproductive age (menstruating women 19–50 years old). Pregnant women aged 18 years and over have the highest dietary allowance of iron (27 mg/day). The iron requirement for vegetarians is about 1.8 times higher than for people that eat meat. Finally, tolerable upper intake levels have been established as follows: 40 mg/day for infants, children and teenagers up to 13 years of age; and 45 mg/day for teenagers 14 years and older and adults, including pregnant and nursing women (IOM, 2001; Health Canada, 2010).
2.2 Toxicokinetics
The pharmacokinetics of iron differ between humans and other animal species (IOM, 2001; WHO, 2003; ECHA, 2020). In humans, nonheme iron exhibits oral non-linear pharmacokinetics with maximum serum concentrations that depend on iron compounds and administered doses, and apparent serum half-lives varying between 4 and 6 hours (Tenenbein, 1998; Whittaker et al., 2002; Geisser and Burckhardt, 2011; Bateman et al., 2018; ECHA, 2020). Body iron is highly conserved with a small amount being absorbed daily to offset very small basal losses estimated at around 0.05% of body iron content (approximately 1–2 mg/day) for non-menstruating adults (IOM, 2001; WHO, 2003; EFSA, 2004; EFSA, 2015; Schrier, 2015; Czerwonka and Tokarz, 2017; Weiss et al., 2018; Zhang et al., 2019). Average additional losses of about 15 to 70 mg per month through menstruation are estimated for premenopausal adults (WHO, 2003; EFSA, 2004).
Absorption: In humans, nonheme iron is mainly absorbed in the duodenum. In intestinal cells, it is absorbed as ferrous iron at the apical membrane and Fe(III) at the basolateral membrane (Andrews and Schmidt, 2007; Dunn et al., 2007; Collard, 2009; Anderson and Frazer, 2017; Czerwonka and Tokarz, 2017). The divalent metal transporter-1, expressed on the apical membrane, and the ferroportin carrier, on the basolateral membrane, transport iron across the enterocyte. Hepcidin inhibits both intestinal carriers (Tenenbein, 1998; Geisser and Burckhardt, 2011; Kew, 2014; Ginzburg and Vinchi, 2019). Nonheme iron bioavailability is estimated to be 2% to 20% for typical North American diets. While absorption rates are expected to be lower for vegetarians and infants aged 7 to 12 months, they increase during pregnancy (IOM, 2001; Domellof, 2007; Collings et al., 2013; Fonseca-Nunes et al., 2014; Schrier, 2015; Ashmore et al., 2016; Czerwonka and Tokarz, 2017; Rodriguez-Ramiro et al., 2019). In healthy individuals, many dietary and host-related (for example, luminal) factors can modulate the absorption of nonheme iron. These include enhancers, such as ascorbic acid, citric acid and meat, and inhibitors, such as polyphenols, phytates, tannins, and calcium, which also affect heme iron, zinc and copper (Collings et al., 2013; Fonseca-Nunes et al., 2014; Schrier, 2015; Anderson and Frazer, 2017; Czerwonka and Tokarz, 2017; Rodriguez-Ramiro et al., 2019).
Distribution: Free iron is almost always sequestered in a non-toxic form through binding to proteins throughout the body (Geisser and Burckhardt, 2011; Anderson and Frazer, 2017). Within the enterocytes, nonheme iron can be stored as ferritin to meet the body's needs. Once in circulation, Fe(III), the circulating form of iron, is bound to the plasma transport protein transferrin and distributed to different organs for direct utilization or storage, depending on needs (Geisser and Burckhardt, 2011). Plasma transferrin has a normal saturation rate of approximately 30% in healthy humans, which leaves enough buffering capacity against circulating non-transferrin-bound iron. Labile transferrin-bound iron is the main source of free iron (which is highly reactive and toxic at high doses) accumulation in organs (mainly the liver and heart) and is associated with an iron overload when plasma transferrin saturation exceeds 60% (Geisser and Burckhardt, 2011; Ashmore et al., 2016; Anderson and Frazer, 2017; Muckenthaler et al., 2017; Ginzburg and Vinchi, 2019).
In healthy adults, total body iron typically ranges from 40 to 70 mg/kg body weight (bw), with men having higher levels than women. Body iron is primarily (60%–80%) distributed to erythroid marrow, followed by ferritin stores mainly in the liver, then in the reticuloendothelial system such as the spleen, the gastrointestinal (GI) tract, muscles, hemosiderin and a variety of enzymes (IOM, 2001; Health Canada, 2009; Geisser and Burckhardt, 2011; Collings et al., 2013; Kew, 2014; Schrier, 2015; Anderson and Frazer, 2017; Czerwonka and Tokarz, 2017; Zhang et al., 2019).
Metabolism: In the GI tract, ingested Fe(III) is reduced to ferrous iron by the ferrireductase duodenal cytochrome B on the apical membranes of enterocytes for uptake. Upon leaving the gut, the newly translocated ferrous iron is re-oxidized to ferric iron by hephaestin, a membrane-bound ferroxidase, for absorption. Within cells, in addition to being stored, iron participates in several metabolic processes. For example, the major pool of iron is directed to mitochondria where it is involved in the biogenesis of ion-sulphur clusters and heme (Andrews and Schmidt, 2007; Dunn et al., 2007; Collard, 2009; Anderson and Frazer, 2017; Muckenthaler et al., 2017).
Elimination: There is no clear and specific excretion mechanism for iron in humans (Tenenbein, 1998; Domellof, 2007; Kew, 2014; Ashmore et al., 2016; Ginzburg and Vinchi, 2019). Small losses (1–2 mg/day) of the nutrient occur through desquamated cells in feces, urine, sweat and skin, with losses from the three last media being negligible. Additional losses occur during menstrual bleeding (WHO, 2003; EFSA, 2004; Geisser and Burckhardt, 2011; Kew, 2014; Ashmore et al., 2016; Zhang et al., 2019). In addition to enterocyte sloughing, intestinal secretions may also contribute to iron loss in feces (IOM, 2001; WHO, 2003; Andrews and Schmidt, 2007; Anderson and Frazer, 2017; Weiss et al., 2018). There is some indication that GI tract iron losses are higher in toddlers (0.022 mg/kg bw per day) than in adolescents and adults (0.014 mg/kg bw per day) (Domellof, 2007).
Physiologically based pharmacokinetic modelling: No data available.
2.3 Health effects
Systemic iron overload, usually defined in humans as an increase in total body iron that leads to levels exceeding 5 g (Kew, 2014), may result in iron accumulation in body organs (specifically the liver, heart and endocrine organs) with the potential to cause detrimental health outcomes. It can occur because of environmental factors, genetics or a combination thereof. It is usually associated with the well-documented health outcomes of iron metabolism disorders, including primary (or inherited) and secondary (or acquired) iron overload syndromes (Agrawal et al. 2017; Ginzburg and Vinchi, 2019; Zhang et al., 2019). Most of these inherited (for example, hereditary hemochromatosis - HH) and acquired syndromes (for example, African dietary iron overload or Bantu siderosis; β-thalassemia) are uncommon to rare. The prevalence rate for HH ranges from about 0.25% to 0.5% (EFSA, 2004; Anderson and Frazer, 2017). Hereditary hemochromatosis is also commonly associated with liver cirrhosis (sometimes accompanied by hepatocellular carcinoma and severe fibrosis), cardiomyopathy, diabetes mellitus and other endocrinopathies (Beguin et al., 2014; Ashmore et al., 2016). Hereditary hemochromatosis patients may also have an increased risk of extrahepatic cancer, including breast and colorectal cancer (Torti and Torti, 2013).
Iron overload from oral iron exposure is rare in iron-replete healthy individuals, due to homeostasis (EFSA, 2015; Weiss et al., 2018). However, some data suggest that oral exposure to excess nonheme iron may result in a range of local and systemic adverse effects. It has also been associated with interference with the absorption or metabolism of other nutrients and infections. Thus, the focus in the following sections is on the adverse health effects of exposure to excess oral nonheme iron.
2.4 Health effects in humans
Human data indicate that overexposure to oral nonheme iron may induce toxicity to many organs with the GI tract being the most sensitive. Adverse effects on growth, cognitive and motor development, and infections in iron-replete infants and young children have also been suggested (Iannotti et al., 2006; Domellof, 2007; Lönnerdal, 2017).
2.4.1 Acute exposure
Acute toxicity from oral exposure to nonheme iron is rare in humans and, when it occurs, the effects are usually worse when iron is taken alone. Cases of poisoning have been reported after accidental or suicidal ingestion of medicinal iron or adult iron supplements (and iron-containing multivitamins), especially by children under 6 years of age (Pestaner et al. 1999; IOM, 2001; EFSA, 2004; U.S. EPA, 2006; Chang and Rangan, 2011; Bateman et al., 2018). Several cases of iron pill-induced gastritis have also been reported from complications related to therapeutic doses of iron tablets/pills, especially in elderly patients (Hashash et al., 2013; Liabeuf et al., 2014; Morais et al. 2017; Sunkara et al., 2017; Onorati et al., 2020).
The clinical course of poisoning is usually described in five stages: GI toxicity, relative stability, circulatory shock and acidosis, hepatotoxicity, and GI scarring (Tenenbein, 1998; Whittaker et al., 2002; EFSA, 2004; Chang and Rangan, 2011; EFSA 2015; Bateman et al., 2018).
Toxicity is usually not observed at oral doses equal to or less than 20 mg of Fe/kg bw. While oral doses as low as 20 to 60 mg Fe/kg bw are potentially toxic, lethal doses are generally considered to be in the range of 200 to 300 mg Fe/kg bw (IOM, 2001; Whittaker et al., 2002; Makrides et al., 2003; WHO, 2003; EFSA, 2004; U.S. EPA, 2006; Bateman et al., 2018). Among the supplements most studied, carbonyl iron and ferrous sulphate are the most toxic, followed by ferrous gluconate and ferrous fumarate (Radtke et al., 2004; Geisser and Burckhardt, 2011; Cancelo-Hidalgo et al. 2013; Anderson and Frazer, 2017).
2.4.2 Short-term exposure
Short-term overexposure to oral nonheme iron may cause GI distress (for example, abdominal pain, constipation, nausea, vomiting, and diarrhea) and may, to a lesser extent, interfere with the absorption of other nutrients, notably zinc (Makrides et al., 2003; EFSA, 2004; Tolkien et al., 2015; Low et al., 2016). Nonheme iron oral toxicity has mostly been investigated through short-term clinical studies of 2 weeks on average. Subjects in those studies, usually healthy or iron-deficient, were usually given medicinal or supplemental iron as iron salts (mostly ferrous sulphate) or carbonyl iron, in either tablet, capsule or liquid formulation (Tolkien et al., 2015; Low et al., 2016).
Of the few studies carried out in healthy individuals, the Tolkien et al. (2015) study provides the most comprehensive analysis of the health outcomes in the general population of ingestion of nonheme iron. This Cochrane systematic review and meta-analysis of 20 placebo and randomized controlled trials (RCT), in which 3 168 non-pregnant adults, men and women were orally randomized to 20 to 222 of mg Fe/day (iron was provided as ferrous sulphate) for 1 to 26 weeks, found a significantly increased risk of GI side effects (odds ratio [OR], 2.32; 95% CI, 1.74–3.08; p < 0.0001) (Tolkien et al., 2015). The most reported GI symptoms included nausea, constipation and diarrhea. Nineteen out of 20 of the studies included in the review were double-blind RCTs with (generally) healthy non-anemic participants. The review found that the association between dose and GI side effects was not significant (p = 0.17) (Tolkien et al., 2015).
The results from this review are supported by the findings from another Cochrane systematic review and meta-analysis, which involved 33 RCTs and quasi-RCTs in non-pregnant women of reproductive age (Low et al., 2016). They are also supported by findings from other prospective studies showing GI side effects at similar doses in healthy individuals (see IOM, 2001), iron deficiency patients (Ulvik et al., 2013) or healthy blood donors (Radtke et al., 2004; Bialkowski et al., 2015). In a double-blind placebo-controlled randomized parallel study in which healthy men and women blood donors consumed 60 mg Fe/day as supplemental nonheme iron for one month, there was a significant increase in the frequency of constipation (p < 0.05) and total incidence of GI side effects (p < 0.01) (Frykman et al., 1994). In that study, a lowest-observed-adverse-effect level (LOAEL) of 60 mg Fe/day was identified based on GI distress.
Similarly, four other RCTs (Radtke et al., 2004; Ulvik et al., 2013; Pereira et al., 2014; Bialkowski et al., 2015) found that the ingestion of ≥ 40 mg nonheme Fe/day for a short period resulted in GI side effects that were mostly mild.
All of these findings are consistent with the conclusions from previous assessments that GI side effects from oral exposure to nonheme iron are commonly observed at iron levels above 50 to 60 mg of Fe/day, particularly if the iron is taken alone (EFSA, 2015).
Overall, there is evidence of a causal relationship between short-term high intake of oral nonheme iron and adverse GI effects, and these effects are generally observed at doses exceeding 20 mg of Fe/day, that is, starting at 30 to 40 mg of Fe/day. The risk of GI adverse effects is higher when iron is taken orally as compared to intravenously (Makrides et al., 2003; EFSA, 2004; EFSA, 2015; Markova et al., 2015; Tolkien et al., 2015; Low et al., 2016). It has been reported that iron supplementation at levels below 30 mg Fe/day is not expected to affect serum zinc concentrations (Makrides et al., 2003). A LOAEL of 60 mg of Fe/day, based on (transient) gastrointestinal side effects in humans, was determined for risk assessment (Frykman et al., 1994).
2.4.3 Chronic exposure
The adverse health outcomes from chronic exposure to oral iron have been studied mainly in individuals with iron metabolism disorders. However, it is argued that chronic overexposure may be toxic for iron-replete, apparently healthy individuals. As such, the association between iron and chronic toxicity including hepatotoxicity, cardiovascular toxicity, hormonal toxicity, neurotoxicity and cancer has gained considerable attention in recent research.
Hepatotoxicity: The evidence to date, which is based mainly on expert consensus, does not support an association between chronic overexposure to nonheme iron and liver toxicity in iron-replete healthy individuals. According to the available data, chronic exposure to nonheme iron rarely results in liver damage in such individuals (EFSA, 2004; Chang and Rangan, 2011; Kew, 2014; Bloomer and Brown, 2019).
Cardiovascular toxicity (coronary heart diseases): Consistent with the conclusions from previous assessments (IOM, 2001; EFSA, 2004), the current evidence does not support an association between nonheme iron and cardiovascular toxicity in iron-replete healthy individuals although this type of iron might be a risk factor for coronary heart disease (CHD). However, the epidemiological data on the relationship between CHD risk and various variables related to iron intake and status have been inconsistent. Positive associations were found between CHD and measures of iron exposure in some studies (Salonen et al., 1992; Salonen et al., 1998; de Valk and Marx, 1999; van der A et al., 2005; Alissa et al., 2007; Hunnicutt et al., 2014), while others reported either negative associations (van der A et al., 2006; Mørkedal et al., 2011; Hunnicutt et al., 2014; Das De et al., 2015; Gill et al., 2017) or no association (Danesh and Appleby, 1999; van der A et al., 2005; Kaluza et al., 2014; Reyes et al., 2020).
Type 2 diabetes mellitus: The current evidence does not support an association between nonheme iron and type 2 diabetes in iron-replete healthy individuals. Significantly positive associations were reported between this health outcome and ferritin in systematic reviews and meta-analyses of prospective (Bao et al., 2012; Kunutsor et al., 2013) and observational (Zhao et al., 2012; Orban et al., 2014; Kataria et al., 2018) studies. Positive associations were also found between type 2 diabetes and iron body stores in large prospective nested case-control studies (Salonen et al., 1998; Jiang et al., 2004b). However, these findings were not supported by other prospective studies, which found no significant association with more closely related exposure variables such as dietary total iron, nonheme iron, and supplemental iron intakes (Jiang et al., 2004a; Bao et al., 2012; Kataria et al., 2018).
Neurotoxicity: There is no convincing evidence of the neurotoxicity of excess oral nonheme iron in apparently healthy individuals. However, the evidence from mechanistic studies and some magnetic resonance imaging (MRI) findings (for example, iron accumulation in the substantia nigra of patients with pantothenate kinase-associated neurodegeneration, Parkinson's disease and Alzheimer's disease) is still inconclusive. MRI can easily detect brain iron accumulation in some cases of neurodegeneration with brain iron accumulation despite the absence of a clear etiological relationship to the disease, which calls into question the role of excess iron as the primary cause of these multifactorial diseases (Hayflick and Hogarth, 2011; Chen et al., 2019). Overall, the evidence for iron chronic neurotoxicity in humans, which comes mainly from a few studies in infants and children, has been inconsistent (Agrawal et al., 2017). While no association was found between iron and cognitive development in infants fed iron-fortified milk formula (Iglesias et al., 2018), positive associations were reported for child neurodevelopment (including mental, psychomotor and behavioural aspects) and behaviour later in life, along with worse neuropsychological (that is, cognitive and visual-motor) scores (Lozoff et al., 2012; Iglesias et al., 2018; Gahagan et al., 2019).
Cancer: Despite the evidence of iron carcinogenicity based on mechanistic data (Chan et al., 2005; Torti and Torti, 2013; Fonseca-Nunes et al., 2014; Manz et al., 2016) and data on HH and African dietary overload patients (Fonseca-Nunes et al., 2014; Kew, 2014; Chua et al., 2016), the association between oral nonheme iron and human cancer is still inconclusive. Consistent with the conclusions from earlier assessments (EFSA, 2004; IOM 2001), the epidemiological evidence is still equivocal and does not support a causal relationship between oral nonheme iron and cancer in the general population (Chan et al., 2005; Shyu et al., 2013; Fonseca-Nunes et al., 2014; Chua et al., 2016).
Mixed results have been reported for an association between dietary iron, supplemental iron and iron biomarkers and either colorectal, breast, gastric or esophageal cancer (Tseng et al., 1997; Fonseca-Nunes et al., 2014; Ashmore et al., 2016). No association was found between higher levels of dietary, supplemental or total iron intake and several biomarkers of iron status and either colorectal (Chan et al., 2005), gastric (Cook et al., 2012), breast (Kabat et al., 2007; Kabat et al., 2010; Chang et al., 2019) or endometrial (Kabat et al., 2008) cancer or all cancer sites combined (Hercberg et al., 2005).
A reduced risk has been reported between (i) intake of dietary iron or iron supplements and cancer of the upper digestive tract (EFSA, 2004; Dawsey et al., 2014); (ii) intake of iron supplements and oesophageal cancer; or (iii) biomarkers of iron stores (mostly serum ferritin) and cancer in general (Fonseca-Nunes et al., 2014).
Finally, some studies have pointed to positive associations between dietary and supplemental iron and iron biomarkers and either colorectal (EFSA, 2004; Bastide et al., 2011; Meng et al., 2019), gastric (Dawsey et al., 2014) or breast (Moore et al., 2009; Chua et al., 2016; Diallo et al., 2016; Chang et al., 2019) cancer or cancer in general (Beguin et al., 2014; Chua et al., 2016).
2.5 Health effects in experimental animals
Studies have shown that the acute oral toxicity of oral nonheme iron ranges from low to moderate, and that this iron is not a reproductive or developmental toxicant or a carcinogen.
2.5.1 Acute toxicity
Studies have shown that nonheme iron has a low to moderate acute oral toxicity, with ferrous salts generally being more toxic than ferric salts. Toxicity varies with animal species and gender, as well as with iron formulation, compound or complex. Carbonyl Fe is the least toxic and ferrous sulphate among the most toxic. Also, males are less sensitive than females (Kawabata et al., 1989; Whittaker et al., 2002; WHO, 2003; Wan et al., 2015; Zhu et al., 2016). Depending on the compound, oral median lethal dose (LD50) values of 246 to 600 mg Fe/kg bw per day have been reported in mice (Sato et al., 1992; WHO, 2003; EC HA, 2020) and values of 220 to > 2 000 mg Fe/kg bw per day, in rats (Sato et al., 1992; Whittaker et al., 2002; WHO, 2003; Wan et al., 2015; Zhu et al., 2016; ECHA, 2020). Also depending on the compound, acute oral exposure to iron may cause adverse effects with varying degrees of severity in the GI tract, liver, and potentially the kidney and spleen (Whittaker et al., 2002; Fang et al., 2018). GI tract effects are usually reversible upon the cessation of exposure (Wan et al., 2015).
2.5.2 Subchronic toxicity
Subchronic exposure to nonheme iron has consistently resulted in damage to several organs, including the liver, spleen, kidneys and GI tract, and has been demonstrated in several experimental animal models. Systemic toxicity is generally dose related and observed following iron overload at very high doses (Appel et al., 2001; Dongiovanni et al., 2013; Toyoda et al., 2014; Wan et al., 2015; Zhu et al., 2016; Fang et al., 2018) (Table 2). Hepatotoxicity is the most reported adverse outcome (Bacon et al., 1985; Kawabata et al., 1989; Myers et al., 1991; Toyoda et al., 2014; Zhu et al., 2016; Ding et al., 2021).
Table 4. Selected data on the repeated dose subchronic toxicity of oral iron
| NOAEL/ (mg Fe/ kg per day) | Species, sex, number | Exposure duration | Compound and dose(s) | Critical effect(s) | Ref. |
|---|---|---|---|---|---|
| NOAEL > 196 mg/kg/d | Male Wistar rat (10/group) | 90 days | 100, 200 mg/kg as carbonyl iron. Gavage. | No toxicologically relevant effect. | Zhu et al. (2016) |
| NOAEL = 95 (males); 117.4 (females) | F344 rats, Males and females (10/sex) | 90 days | Ferric chloride hexahydrate: 80, 154, 277, 550, 1231 mg/kg/d in males / 88, 176, 314, 571, 1034 mg/kg/d in females. Drinking water. | Reduced body weight gain. | Sato et al. (1992) |
| NOAEL = 55 (males); 110.1 (females) | Rat (125 males/ 250 Females) | Males: 0–42 days Females: 0–4 days post-partum | Anhydrous iron (di)chloride: 125 (male), 250 (female), 500 mg/kg/d (500 ~ 220.5 mg Fe/kg/d) Gavage. Conducted following OECD TG 422 and GLP. | Males: changes in organ weight. Females: changes in organ weight and histologic findings. | Beom (2004) Footnote * |
| NOAEL = 20.1 | Rat (OECD 422) | See OECD 422 | FeSO4.7H2O: 1, 30, 100, 300, 1 000 mg/kg/d. (1 000 ~ 200 mg Fe/kg/d) Gavage. Conducted following OECD TG 422 and GLP. | Males: extramedullary hematopoiesis of the spleen. Females: increased levels of inorganic phosphate | Furuhashi (2002) Footnote * |
| NOAEL = 8 mg/kg bw | Male Sprague Dawley Rat (10/grp): 100–105 g each. | 30 days | Solution of FeSO4: 0, 8, 16, 24 mg Fe in vehicle (1 mL of 0.01 mol/L HCl). Gavage | Reduced body weight. Liver and intestinal damage. | Fang et al. (2018) |
| NOAEL = 137.5 mg/kg bw | Male and Female F344 rats | 13 weeks | Ferric citrate: 0, 143.9, 595.9, 2 834.7 mg Fe/kg bw/d in males / 0, 147.7, 601.4, 2 845.6 mg Fe/kg bw/d in females. | Significant reduction of body weight in both sexes at the highest dose. | Toyoda et al. (2014) |
| NOAEL > 77.9 mg/kg/d | Sprague Dawley Rat (10/sex/group) | 28 days (GLP study) | Ferrous N-carbamylglycinate: 0, 150, 300, 600 mg/kg bw/d Diet | No effect | Wan et al. (2015) |
| NOAEL > 11.5 mg/kg/d | Rat, males, 40/group | 61 days | Iron sulphate: 2.84, 5.69, 11.54 mg/kg/d Sodium iron EDTA: 2.81, 5.67, 11.19 mg/kg/d Diet | No toxicologically significant effects. | Appel et al. (2001) |
EDTA – Ethylenediaminetetraacetic acid; GLP – Good Laboratory Practice; GLP – Good Laboratory Practice; NOAEL – no-observed-adverse- effect level; OECD TG 422 – Organisation for Economic Cooperation and Development Test Guideline 422 - Combined Repeated Dose Toxicity Study with the Reproduction/Developmental Toxicity Screening Test.
- Footnote *
-
As reported in ECHA (2020) report.
2.5.3 Chronic toxicity
Based on the limited data available, hepatotoxicity is the main adverse outcome from chronic exposure to oral nonheme iron, although it typically occurs following iron overload and at very high doses (Plummer et al., 1997; Tjalkens et al., 1998; Stål et al., 1999; Asare et al., 2006; Bloomer and Brown, 2019). Hepatotoxicity, as evidenced by increased serum levels of aminotransferases (Alanine Aminotransferase and Aspartate Aminotransferase) and hepatic markers of oxidative stress and preneoplastic nodules or liver foci, was observed after rats or mice were fed a diet high in iron compounds (Ramm et al., 1995; Tjalkens et al., 1998; Stål et al., 1999; Asare et al., 2006). The limited data also suggest that the severity of the effects depends on the dose of elemental iron (Sato et al., 1992; Inai et al., 1994; Plummer et al., 1997; Asare et al., 2006).
2.5.4 Carcinogenicity
There is no evidence of nonheme iron carcinogenicity by the oral route (Stål et al., 1997; ECHA, 2020). Lifetime oral administration of iron salts to mice and rats had no significant effect on tumour incidence or on the distribution of different types of tumours in either females or males (Sato et al., 1992; Inai et al., 1994; Stål et al., 1999; Asare et al., 2006).
2.5.5 Reproductive and developmental toxicity
There is no evidence that iron is toxic to reproduction and development. Data from experimental animal studies indicate that iron compounds are neither reprotoxic nor embryotoxic nor teratogenic (WHO, 2003; U.S. EPA, 2006; ECHA, 2020).
2.6 Iron and infection
Iron is essential for many intestinal pathogenic enterobacteria (for example, E. coli, Escherichia/Shigella, and Clostridium species) and oral exposure to excess nonheme iron may promote their growth, abundance and virulence (Yilmaz and Li, 2018). This may impair the GI tract microbiome and barrier functions (EFSA, 2004; Dostal et al., 2014; Gies et al., 2018; Brabin et al., 2019). In turn, this may increase the risk of GI tract (and respiratory) inflammation and infections as evidenced by data on iron-replete young children (Sazawal et al., 2006; Zimmermann et al., 2010; Soofi et al., 2013; Jaeggi et al., 2015; Paganini et al., 2017) and experimental animals (Constante et al., 2017; Fang et al., 2018; Hoffmann et al., 2021).
2.7 Genotoxicity
The currently available data indicate no evidence of genotoxicity for iron (WHO, 2003; U.S. EPA, 2006; NHMRC and NRMMC, 2011; Wan et al., 2015; ECHA, 2020). Many inorganic iron salts produced negative results in both in vivo (for example, ferric chloride, ferrous chloride, ferrous sulphate) and in vitro (for example, ferric chloride, ferric diphosphate, ferric orthophosphate, ferrous chloride, ferrous sulphate) genotoxicity tests (Stål et al., 1997; WHO, 2003; Toyoda et al., 2014; Wan et al., 2015; ECHA, 2020). For example, negative results were obtained for ferric chloride, ferrous chloride and ferrous sulphate in the in vivo mammalian chromosome aberration test. These salts all gave negative results in vitro in the bacterial gene mutation test, the mammalian gene mutation test, and the mammalian chromosomal aberration test (ECHA, 2020). In most genotoxicity tests, negative results were also obtained for iron carbonyl and numerous iron complexes including ferric citrate, ferrous lactate, ferrous gluconate, iron dextran, and ferrous N-carbamylglycinate (WHO, 2003; EFSA, 2004; Toyoda et al., 2014).
2.8 Mode of action
The mode of action by which excess oral nonheme iron induces gastrointestinal injury, a local effect, has yet to be fully characterized. To date, the most supported hypothesis for mode of action is direct and local injury (for example, simple irritation, erosions, or more severe inflammation) to the GI tract mucosa (EFSA, 2004; U.S. EPA, 2006; Onorati et al., 2020). Some studies have also mentioned changes to the composition or metabolism of the bowel microbiota, but these effects have not been fully explored to date (Tolkien et al., 2015; Qi et al., 2020).
Compelling evidence from observations of iron deposits in the GI tract in cases involving therapeutic iron ingestion or in patients with a history of oral iron supplementation supports the finding that nonheme iron ingestion induces and exacerbates erosive or corrosive mucosal injury (Sunkara et al., 2017). Erosions (often with non-bleeding ulcers), erythema and yellowish-brown discolouration of the GI tract mucosa are the main (macroscopic) features of oral nonheme ion related-GI tract injury. This is evidenced by GI tract endoscopy and esophagogastroscopy results from several cases of iron poisoning, including patients with iron pill-induced gastritis (Cimino-Mathews et al., 2010; Liabeuf et al., 2014; Morais et al., 2017; Sunkara et al., 2017; Onorati et al., 2020).
Histological findings from GI tract biopsies have confirmed crystalline iron deposits, sometimes heavy, usually brown-black, in the GI tract mucosa of patients with erosive gastritis and ulcers related to oral iron (for example, tablets, pills) (Haig and Driman, 2006; Cimino-Mathews et al., 2010; Sunkara et al., 2017; Ching et al., 2019; Onorati et al., 2020). Such iron deposits can be extracellular or intracellular and occur in macrophages, glandular epithelium and blood vessels (Morais et al., 2017; Onorati et al., 2020).
Two key events are identified for oral nonheme iron-induced corrosive mucosal injury: (i) formation of hydrated ferric oxide (a corrosive species, also known as rust) and reactive oxygen species (ROS), and (ii) direct damage to the GI tract mucosa (Tenenbein et al., 1998; IOM, 2001; Jiang et al., 2004b; Collard, 2009; Cimino-Mathews et al., 2010; Manz et al., 2016; Anderson et al., 2017; Sunkara et al., 2017; Fang et al., 2018; Bloomer and Brown, 2019; Chen et al., 2019; Ginzburg et al., 2019; Zhang et al., 2019; Onorati et al., 2020). Most evidence supporting these key events is based on expert consensus.
In cases of oral exposure to excess nonheme iron, most excess iron is left unabsorbed in the GI tract lumen and mucosa due to homeostasis. In the first key event (formation of hydrated ferric oxide), iron pro-oxidative properties and characteristics of the GI tract environment (for example, high level of cellular metabolic activity, pH) lead to any unabsorbed free iron participating to and catalyzing a series of reactions. These include the Haber Weiss reaction which will generate ROS (for example, hydroxyl radicals) and Fenton reactions, which will generate hydrated ferric oxide (Tenenbein, 1998; Qi et al., 2020). In vitro studies have shown a correlation between intracellular free iron and oxidative stress (EFSA, 2004). Reactive oxygen species have also been linked to mucosal alterations in gastric or intestinal injuries (Liabeuf et al., 2014).
The second key event results from the action of the newly formed chemically reactive species. When ROS production exceeds the capacity of the endogenous antioxidant systems, the reactive species start accumulating in the lumen or mucosal cells of the GI tract. Due to prolonged stasis there, they may directly injure the GI tract mucosa via corrosion (in the case of hydrated ferric oxide) or oxidative damage (in the case of ROS). This will lead to irritation (that is, erosive injury similar to chemical burns) and focal inflammation and ulceration, respectively (EFSA, 2004; Jiang et al., 2004b; Hashash et al., 2013; Liabeuf et al., 2014; Anderson and Frazer, 2017; Zhang et al., 2019; Onorati et al., 2020; Qi et al., 2020).
Overall, the resulting injury will depend on local concentrations of free iron in the GI tract and time of contact (IOM, 2001; EFSA, 2004; Hashash et al., 2013; Onorati et al., 2020).
2.9 Selected key study
The pharmacokinetics of iron differs between humans and other animal species. According to pharmacokinetic data for humans, infants and pregnant people are not more sensitive to iron than the general population. Even though older people might experience severe GI symptoms due to changes in dietary habits (among other factors), this is usually in the context of iron therapy supervised by their physicians. In a literature search, the lowest point of departure for GI toxicity was identified in a short-term clinical study (Frykman et al., 1994).
The selection of the placebo-controlled and double-blind study by Frykman et al. (1994) as the key study for the risk assessment of iron in drinking water is consistent with the approach used in other assessments (IOM, 2001). Despite some limitations (for example, short-term study) this study provides strong evidence for GI distress in iron-replete individuals. The population in this study includes healthy men and non-pregnant women, and the test chemical is relevant for drinking water applications. The findings from this study are supported by other clinical studies involving similar subjects (Radtke et al., 2004; Ulvik et al., 2013; Pereira et al., 2014; Bialkowski et al., 2015; Tolkien et al., 2015; Low et al., 2016).
In the study, 97 Swedish adult men and women who were regular blood donors were given either 60 mg total Fe/day (as nonheme iron only), 18 mg total Fe/day (as a mixture of nonheme and heme iron) or a placebo for one month to evaluate the side effects of these iron supplements. At the end of the supplementation period, the only major difference among the study participants was the significant difference observed in the side effects. The group of individuals who received nonheme iron alone presented with a significantly higher frequency of constipation (p < 0.05) and total incidence of all side effects (p < 0.01) than the other groups. A LOAEL of 60 mg total Fe/day (as nonheme iron only) was identified in this study for daily iron supplementation based on gastrointestinal distress (Frykman et al., 1994). To that LOAEL, the IOM (2001) added the estimated European mean daily intake of 11 mg total dietary iron, to estimate a LOAEL of 70 mg/day (rounded) for a total intake of iron and gastrointestinal effects. Considering the mild nature of the gastrointestinal effects observed the IOM (2001) applied an uncertainty factor of 1.5 to estimate a NOAEL of 45 mg/day for total intake of iron (rounded).
3.0 Derivation of a Health-Based Value (HBV)
A tolerable upper intake level (UL) of 45 mg/day for total intake of iron, based on gastrointestinal toxicity in humans, has been established for apparently healthy adults (IOM, 2001; Health Canada 2010). Using this UL, an HBV for total iron (both Fe(II) and Fe(III)) in drinking water is calculated as follows:
Where:
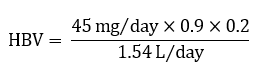
Figure 1 - Text description
The HBV is calculated by multiplying 45 milligrams per day by 0.9, then by 0.2. This product is then divided by 1.54 litres per day.
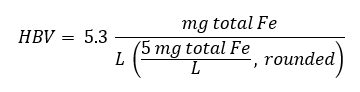
Figure 2 - Text description
The HBV is equal to 5.3 milligrams total iron per litre.
- 45 mg/day (for total intake of iron) is the UL (IOM, 2001; Health Canada, 2010).
- 0.9 is the percent contribution of nonheme to total iron intake.
- 0.2 is the default allocation factor value as outlined in Krishnan and Carrier (2013) although data suggest that the drinking water contribution could be less (see section 1.3).
- 1.53 L/day is the drinking water daily intake for a Canadian adult (Health Canada, 2021). Due to its physicochemical properties, exposure to iron from showering or bathing is not expected to be significant. As such, a multi-route exposure assessment, as outlined by Krishnan and Carrier (2008), was not performed.
4.0 Analytical and Treatment Considerations
4.1 Analytical methods to detect iron
4.1.1 Standardized methods
The standardized methods available for the analysis of total iron in drinking water and their respective MDLs are summarized in Table 5. MDLs are dependent on the sample matrix, instrumentation and selected operating conditions and will vary between individual laboratories. Analyses for iron should be carried out as directed by the responsible drinking water authority. Water utilities should confirm that the method reporting limits are low enough to ensure accurate quantitation at concentrations below the proposed AO.
| Method (Reference) | Methodology | MDL (µg/L) | Interferences/Comments |
|---|---|---|---|
| U.S. EPA Methods | |||
| EPA 200.5 Rev 4.2 (U.S. EPA 2003) | Axially viewed inductively coupled plasma atomic emission spectrometry (AVICP-AES) | 3.3 | Matrix interferences: calcium, magnesium and sodium > 125 mg/L and silica > 250 mg/L |
| EPA 200.7 Rev 4.4 (U.S. EPA 1994a) | Inductively coupled plasma-atomic emission spectrometry (ICP-AES) | 30 | Matrix interferences: total dissolved solids > 0.2% weight per volume(w/v) |
| EPA 200.9 Rev.2.2 (U.S. EPA 1994b) | Graphite furnace atomic absorption (GFAA) | NA | NA |
| APHA Standard Methods | |||
| SM 3111 B (APHA et al, 2017) | Direct Air-Acetylene Flame Method | 20 | NA |
| SM 3113 B (APHA et al,, 2017) | Electrothermal atomic absorption spectrometric method (AAS) | 1 | NA |
| SM 3120 B (APHA et al., 2017) | Inductively coupled plasma mass spectrometry (ICP-MS) | 30 | Matrix interference: total dissolved solids > 1 500 mg/L |
| 3500-Fe B (APHA et al., 2017) | Phenanthroline method | 10 | Interfering substances: strong oxidizing agents, that is, cyanide, nitrate, phosphate, chromium and zinc at concentrations 10 times greater than the iron concentration. |
APHA – American Public Health Association; ICP-MS – inductively coupled plasma mass spectrometry; MDL – method detection limit; NA – not available.
4.1.2 Sample preparation
Total iron includes both the dissolved and particulate (suspended) fractions of iron in a water sample and is analyzed using methods for total recoverable iron. Analysis of total iron is needed for comparison to the proposed AO.
Accurate quantification of dissolved, particulate and total iron in samples is dependent on the proper sample preservation and processing steps. It is very difficult to prevent the oxidation of Fe(II) during the transport of a water sample that contains Fe(II) from a field site to a laboratory for analysis because Fe(II) is not stable and changes to the Fe(III) form in solution in contact with air. For this reason, determination of ferrous iron should be done in the field at the time of sampling, and great care must be taken to minimize exposure of the sample to the atmosphere.
Standard method SM 3030B provides guidance on filtration and preservation (acidification) procedures for the determination of dissolved or particulate metals (APHA et al., 2017). Importantly, to determine dissolved iron concentrations, samples should be filtered and the filtrate acidified to pH < 2 at the time of collection (not at the laboratory). The delineation between dissolved and particulate fractions in a sample is dependent on the filter type and pore size. Therefore, water utilities that may have smaller particles or colloids present in the water should consider whether the standard filter size (0.4–0.45 µm pore-diameter membrane) is suitable. Information on methods for fractionating constituents in water into dissolved, colloidal and particulate fractions is available elsewhere (Brandhuber et al., 2013).
Currently, United States Environmental Protection Agency (U.S. EPA) methods 200.5, 200.7 and 200.9 and SM 3113B do not require hot acid digestion for total recoverable metals unless the turbidity of the sample is greater than 1.0 nephelometric turbidity unit (NTU) (U.S. EPA, 2003, 1994a, b; APHA et al., 2017). Verification that adequate recovery of metals has occurred in different sample matrices by comparing digested and undigested samples is recommended (APHA et al., 2017).
4.1.3 Online and portable colorimetric analyzers
Commercial online analyzers and portable test kits are available for quantifying dissolved and total iron in source and drinking water and are generally based on the colorimetric method. Online analyzers can be used to obtain a rapid or continuous (online units only) indication of changes in iron concentrations.
In general, commercial online methods are capable of measuring iron concentrations between 0.01 and 1.0 mg/L, with higher concentrations requiring dilution. Portable test kits can be used to obtain a rapid measurement of iron concentrations in drinking water. Available commercial test kits are capable of measuring iron concentrations in the range of 0.009 to 3.0 mg/L. To accurately measure iron using these units, water utilities should develop a quality assurance and quality control program such as those outlined in method SM 3020 (APHA al., 2017). In addition, periodic verification of results using an accredited laboratory is recommended. Water utilities should check with the responsible drinking water authority to determine whether results from analyzers are acceptable for compliance reporting.
4.2 Treatment considerations
A range of different physical, chemical and biological processes can be used to remove iron from drinking water sources. Treatment methods for iron removal often rely on a combination of processes, such as oxidation, adsorption and/or particle removal (clarification and/or particle filtration), to transform and remove both dissolved and particulate forms of iron.
To select the appropriate treatment system or to optimize an existing system, it is important to understand the form of iron (dissolved, colloidal or particulate) present in the source water (Postawa and Hayes, 2013). The treatment for these iron fractions varies, and knowing which forms of iron are present is critical in understanding the actual mechanisms of iron removal (Knocke et al., 1993; Carlson et al., 1997).
In addition to the iron present in the source water, chemical addition and treatment plant processes can contribute to the amount of iron that may need to be managed within the treatment plant. The main sources of iron from treatment plant operations include (1) the use of ferric-based coagulants, (2) resolubilization of particulate iron stored in sedimentation basins to Fe(II) because of anoxic conditions in the basin, and (3) the presence of iron in recycle streams from solids processing operations (Cornwell and Lee, 1993, 1994). Iron-based salts are often used as coagulants in water treatment processes. One of the sources of iron in drinking water consists of corrosion by-products (tubercles) from iron-based materials (for example, cast iron, galvanized steel) in distribution and plumbing systems (Sarin et al., 2003; Civardi and Tompeck, 2015). Depending on the water chemistry, hydraulic conditions and the effectiveness of physical treatment processes, iron residuals may be present in the finished water and contribute to the accumulation of iron in the distribution system (U.S. EPA, 2006; Friedman, 2010).
4.2.1 Aesthetic considerations
Ferric iron present at high levels is responsible for the objectionable reddish-brown colour of water. Colour and taste thresholds vary among individuals and depend on the species of iron present in the water.
Iron is present at various levels in natural waters. The iron content in treated water entering the distribution system is generally very low. Iron commonly enters into solution from old unlined cast iron distribution mains and other iron-based materials in the distribution system. At iron concentrations above 0.05 ppm, some colour may develop; staining of plumbing fixtures and laundry may occur; and precipitates may form at a rate directly proportional to the concentrations of iron in the water and oxidation/reduction conditions.
Metallic elements such as iron are known to cause flavours and colour that can lower consumer acceptance of a drinking water. Aqueous Fe(II) has a metallic to astringent taste, with a metallic odour dominating over the weak taste sensation. Several studies have examined the visual and taste thresholds of iron in drinking water (Dietrich, 2015; Sain and Dietrich, 2015). Many consumers can perceive a taste at a level below 0.17 mg Fe2+/L and some consumers can detect concentrations as low as 0.007 mg Fe2+/L (Dietrich, 2015). Colour from iron can be readily seen in a glass of water at a concentration of 0.3 mg Fe(III)/L but it is not readily detected visually at 0.03 mg Fe(III)/L (Dietrich, 2015; Sain and Dietrich, 2015).
A one-of-five (taste) test study with multi-nation panellists in the United States determined the taste thresholds of ferrous and cuprous ions in room temperature reagent water. This forced-choice test is considered a strong discriminative test. For ferrous ions, individual thresholds ranged from 0.003 to over 5 mg/L. The study authors noted that approximately 90% of the panellists were able to detect ferrous ions in water at or below 0.3 mg/L. Population taste thresholds were determined to be 0.031 mg/L and 0.05 mg/L for ferrous ion using logistic regression and geometric mean methods, respectively. However, no taste or flavour perception was observed for Fe(III) ion, even at 20 mg/L Fe3+. This study found that ferrous ions produced weak bitter and salty tastes as well as astringent mouthfeel, but Fe(III) ion produced none of these sensations (Ömür-Özbek and Dietrich, 2011).
Additionally, results from the same suggested that, at a concentration of 0.3 mg/L Fe, many consumers were able to detect an off-colour attributable to Fe(III). The authors found that 84% and 50% of subjects in this study were able to detect 0.18 mg/L and 0.06 mg/L of Fe(III), respectively. At a concentration of 0.03 mg/L, the percentage of the panellists that was able to detect iron in water (21%) was consistent with the chance of guessing the correct sample (1 in 5 or 20%) (Ömür-Özbek and Dietrich, 2011).
Staining of plumbing fixtures and laundry can occur when iron is present at concentrations of 0.05 mg/L and above. Particulate iron, commonly called rust, occurs in tap water because of corrosion of iron pipes and is a common source of consumer complaints (Dietrich, 2015). When the iron concentration is 0.3 mg/L, consumers may notice the flavour of ferrous iron and see rust and iron staining (Dietrich and Burlingame, 2015). This shows that a concentration of 0.3 mg/L is not low enough to minimize complaints about water colour and taste complaints or to improve consumer confidence in drinking water quality (Dietrich, 2015; Dietrich and Burlingame, 2015). For this reason, utilities should achieve the proposed AO of ≤ 0.1 mg/L for the design and operation of iron treatment technologies.
4.2.2 Iron chemistry
An understanding of the chemistry and microbiology of iron in drinking water systems is important when determining the most appropriate treatment system or assessing and optimizing existing systems for iron removal.
Iron (Fe) and Mn frequently occur together in drinking water supplies. However, there is a greater abundance of iron in minerals, and iron oxides are more readily reduced than Mn oxides. Therefore, iron is likely to be present at much greater concentrations than Mn (Kohl and Medlar, 2006). Iron typically exists in water in the ferrous and ferric oxidation states. The oxidation state of iron is controlled by the redox potential and pH of the water. Reduced Fe(II), a soluble free metal divalent cation, can be oxidized and precipitated to Fe(III) by raising the redox potential, the pH, or both. In general:
- at pH <5 both Fe oxidation states are highly soluble (not true for Mn)
- at pH 5-8, Fe tends to be more sensitive to changes in oxidation/reduction potential than Mn
- at high pH (> 8), both Fe and Mn tend to be insoluble
In anoxic conditions, such as in groundwater or in the hypolimnion of eutrophic reservoirs, iron can occur in a relatively soluble Fe(II) state. When Fe(II) is exposed to oxygen or a disinfectant or oxidant during water treatment and distribution, it is oxidized to the insoluble Fe(III) form, which precipitates and causes the release of iron from the distribution system.
Iron is frequently detected in surface water due to chelation. The most important chelating agents are organic material (Sharma et al., 2001; Postawa and Hayes, 2013). In the presence of organic matter such as humic and fulvic acids, iron readily complexes at a pH greater than 5.5 (Sommerfeld, 1999). Dissolved organic carbon (DOC) may form complexes with both Fe(II) and Fe(III) and impact the speciation and solubility of iron. The oxidation of Fe(II) is retarded by complexation with natural organic matter. Organic matter may form soluble complexes with Fe(III), increasing overall iron solubility under conditions relevant to drinking water (Knocke et al., 1990, 1992, 1993).
Although colloidal iron is not common, it can form because of the adsorption of DOC onto ferric hydroxide (Knocke et al., 1993; Carlson et al., 1997) and by sorption/coordination with the inorganic chemicals added for sequestration purposes, such as polyphosphates and silicates (Robinson and Reed, 1990). Ahmad et al. (2019) investigated the formation of iron and Mn solids during co-oxidation with oxygen, permanganate and hypochlorous acid (HOCl) in the presence of phosphate, silicate and calcium ions. Co-oxidation of iron and Mn by oxygen or HOCl produced suspensions that aggregated rapidly, whereas potassium permanganate (KMnO4) generated stable colloidal suspensions. This aggregation decreased in the presence of phosphate and silicate, but calcium counteracted the oxyanion effects. Detailed information on the ability of organic compounds to complex with iron can be found in other studies (Hem, 1960; Jobin and Ghosh, 1972; Theis and Singer, 1973).
4.3 Municipal-scale treatment
Characterization of the source water, including the concentration and form of iron present and the levels of other water parameters (for example, pH, alkalinity, organic carbon, Mn, and hardness), is a critical step. Factors such as the pre-treatment in use, waste sludge disposal, and ease of operation influence the selection of the treatment process. Pilot- and bench-scale testing is recommended to ensure that the source water can be successfully treated and to optimize operating conditions for iron removal. Iron and Mn frequently co-occur in drinking water supplies, and iron in water supplies can influence the treatment of Mn (Brandhuber et al., 2013).
When present in source water, dissolved Fe(II) is often the predominant species (for example, in anoxic groundwater or lakes). Dissolved Fe(II) iron can be removed or controlled by managing the raw water supply, chemical oxidation and physical particle separation (clarification and filtration), adsorption and oxidation, biological filtration and ion exchange.
The most widely used technology that is effective for decreasing iron concentrations in drinking water is based on directly oxidizing dissolved Fe(II) to form Fe(III) particles. The particles are then removed by a physical process, such as clarification and granular media filtration or low-pressure membrane filtration. Particulate or colloidal iron can effectively be removed by conventional coagulation followed by clarification and media filtration processes (Odell, 2010) or by low-pressure membrane filtration (microfiltration or ultrafiltration) (Civardi and Tompeck, 2015). These processes typically achieve iron concentrations below 0.05 mg/L in the treated water.
Another common treatment technique for iron removal is the use of Mn oxide (MnOx(s))-coated filter media that directly adsorb dissolved Fe(II). The adsorbed Fe(II) is oxidized at the surface using an oxidant such as free chlorine or KMnO4, which is often applied intermittently along with backwashing to remove oxidized iron particles. Continuous application of an oxidant upstream of the media filter is likely to oxidize the Fe(II) in solution to colloidal or particulate form prior to filtration, thus requiring effective particle filtration for iron removal. Depending on the pH and the DO content of the water, a combination of dissolved and particulate iron can be present before and after oxidant addition, so both adsorption/surface oxidation and particle filtration mechanisms may be occurring. Many of these technologies, in particular MnOx(s)-coated filter media, can be used to effectively remove iron from drinking water in small systems. MnOx(s)-coated filter media are also commonly used for the removal of Mn. Therefore, when iron co-occurs with Mn in source water, it can impact Mn oxidation and make Mn removal more challenging if iron is not removed initially. Iron is easier to oxidize than Mn at any pH. Therefore, the oxidant demand from iron must be satisfied before significant Mn oxidation can occur (Brandhuber et al., 2013). Utilities should conduct jar testing to assess which oxidants may be effective with their source water and treatment plant design prior to selecting an oxidant for iron removal.
The most effective type of treatment for iron removal will depend on the type and concentration of iron in the source water, the overall water chemistry, and other applicable water quality objectives. Utilities should monitor within treatment plants to ensure that unit processes are adequately removing iron.
Limits for iron in treated water were historically based on aesthetic considerations and treatment achievability. However, studies have shown that iron particulates cause discolouration of drinking water and are visible to consumers at concentrations as low as 0.05 mg/L. Additionally, consumers perceive tastes at concentrations as low as 0.017 mg/L (Dietrich, 2015; Dietrich and Burlingame, 2015; Sain and Dietrich, 2015). Many studies have found that treatment plants can achieve an iron concentration of less than 0.05 mg/L in treated water through optimized design and operation of new or existing treatment plants.
The implications of the accumulation and release of iron and co-occurring metals in distribution systems have also been well documented. For example, metals of health concern such as Pb and As can be adsorbed onto or incorporated into iron corrosion scales and may subsequently be released, exceeding their allowable concentrations at the tap (Lytle et al., 2004; Schock, 2005; Schock et al., 2008, 2014; Friedman et al., 2010; Brandhuber et al., 2015; Health Canada, 2019a,b). Elevated iron concentrations in tap water are typically associated with the accumulation and release of iron in the distribution system rather than with elevated levels of iron in the source or treated water (Brandhuber et al., 2015). Of particular health concern is the fact that iron corrosion by-products can deplete the disinfectant residual (Frateur et al., 1999).
Based on the information discussed above, it is recommended that treatment plants achieve a total iron concentration at or below the AO (that is, ≤ 0.1 mg/L) (Brandhuber and Tobiason, 2018). This is achievable in most well-operated and optimized treatment plants. Achieving this goal will minimize consumer complaints related to both discoloured water and tastes caused by the release of iron corrosion by-products. It will also minimize the accumulation of other metals, such as Pb, on the iron scales in the distribution system and their subsequent release in the distributed water. Another important aspect of iron removal relates to its ability to impact removal of co-occurring Mn. Since iron is the first metal to be oxidized, it will exert an oxidant demand before the oxidation of Mn occurs. For this reason, the concentration of oxidants used for oxidation of the divalent manganese ion Mn(II) will need to be increased to meet the Fe(II) oxidant demand. Fe(II) is readily oxidized by oxygen and free chlorine, but neither of these substances is particularly effective for Mn(II) oxidation. The use of oxygen and free chlorine should be considered for iron removal when there is also a need to address Mn in the source water.
4.3.1 Conventional coagulation
Conventional coagulation followed by filtration is the removal method of choice when the level of iron in the source water is greater than 5.0 mg/L, specifically in systems with high water flows. This process is commonly used for water sources in which iron is organically complexed (Devis, 1997). It is important to note that coagulation serves to destabilize particulate iron for subsequent aggregation and to directly precipitate and/or adsorb natural organic matter (NOM) with complexed iron.
Some studies have reported that alum coagulation at pH levels and doses that are optimized for DOC removal effectively removes organically complexed iron in water (Knocke et al., 1990, 1992, 1993; Devis, 1997). Knocke et al. (1990, 1992) reported that the molecular weight distribution (MWD) fractions of DOC affect the effectiveness of the process (see Table 6). Alum was found to effectively remove Fe(II) organically complexed with hydrophobic high-MWD fractions of DOC but the effectiveness decreased when DOC was predominantly hydrophilic. The authors concluded that addition of an oxidant followed by alum coagulation would enhance iron removal in the presence of low MWD fractions of DOC (oxidation of iron is discussed in section 4.3.2). Two full-scale plants using a conventional coagulation treatment and an oxidation step prior to filtration removed 94 to 96% of dissolved Fe(II), achieving an iron concentration of 0.03 mg/L in the treated water (see Table 6). A water treatment plant that reported a problem with a pungent odour and brown to black precipitate in its distributed water conducted jar tests using different doses of KMnO4 followed by conventional coagulation. The surface water had a high level of chemical oxygen demand between 12 and 30 mg/L, indicating that the water contained organic matter. The jar tests showed 95% removal of iron using pre-oxidation with KMnO4 followed by alum coagulation at a pH of 7.6 (Khadse et al., 2015).
| Iron species in source water | Process description | Iron species in treated water (mg/L) or % removal | References |
|---|---|---|---|
| Total iron 0.29–2.4 mg/L Dissolved Fe(II) up to 0.5 mg/L | Full-scale WTP (22 MGD): Surface water; coagulation, flocculation/sedimentation, chlorination prior to dual-media filtration. Raw water quality: DOC: 4.0–8.0 mg/L; pH 6.0 (for effective DOC removal); alum doses 20–80 mg/L. | Settled water: Average total iron: 0.17 Average dissolved iron: 0.07 Chlorination/filtration effluent: Average total iron: 0.04 Average dissolved iron: 0.03 |
Knocke et al. (1990) |
| Total iron 0.4–1.1 mg/L Dissolved Fe(II) 0.3–0.8 mg/L | Full-scale WTP (2 MGD): Surface water; pre-oxidation w/t KMnO4 (0.4–1.1 mg/L); coagulation, flocculation, sedimentation, dual-media filtration (no other operational parameters were provided). | Flocculation effluent: Average total iron: 0.5 Average dissolved iron: 0.3 Filter effluent: Average total iron: 0.04 Average dissolved iron: 0.03 |
|
| Dissolved iron up to 1.5 mg/L | Jar test: Surface water; KMnO4 dose 2.5 mg/L; alum 30 mg/L and lime 20 mg/L; sand filtration Raw water quality: chemical oxygen demand 9–20 mg/L; total alkalinity 108–216 mg/L as CaCO3; total hardness 80–192 mg/L as CaCO3, pH 7.0–8.2, Mn 0.23–1.7 mg/L. |
Treated water: 0.08 mg/L | Khadse et al. (2015) |
| Dissolved Fe(II) 2.0 mg/L | Lab tests data: a) Coagulation alone: alum doses 50 mg/L; use high MWD fraction of DOC 10 mg/L; pH 6.0–6.3. | a) Dissolved Fe(II): < 0.05 mg/L (in the presence of high MWD fraction of DOC). | Knocke et al. (1990); Knocke et al. (1992) |
| b) Coagulation alone: alum doses 50 mg/L; low MWD fraction of DOC 10 mg/L; pH 6.0–6.3. | b) Dissolved Fe(II): 0.6–0.7 mg/L (in the present of low MWD fraction of DOC). | ||
| c) Pre-oxidation: 2.5 mg/L KMnO4 applied for iron complexed with low MWD fraction of DOC; alum dose 40 mg/L. | c) Dissolved Fe(II): < 0.05 mg/L (in the presence of low MWD fraction of DOC). | ||
| Dissolved Fe(II) 8.0, 12.2 and 17.0 mg/L | Jar test: Surface water; coagulation at pH 6.5 with 40 mg/L alum; filtration; followed by oxidation with 2.5 mg/L KMnO4, pH 8.5; filtration 0.22 µm pore size filter paper. | Removal: > 99% for the 3 iron influent concentrations | Zogo et al. (2011) |
DOC – dissolved organic carbon; MGD – million gallons per day; MWD – molecular weight distribution; WTP – Water treatment plant.
4.3.2 Chemical oxidation and physical separation
When the predominant form of iron in the source water is dissolved Fe(II) iron, oxidation to convert Fe(II) to Fe(III) precipitates followed by particle separation is an effective treatment method. Oxidation can be achieved by oxygen transferred into water from air (aeration) and by the dosing of other oxidants such as chlorine, permanganate, ozone or chlorine dioxide. The effectiveness of the overall process depends largely on the ability of the oxidant(s) to completely oxidize Fe(II) to Fe(III) particles and on the ability of the subsequent physical separation processes to effectively remove the particulate iron. Effective oxidation depends on several factors, including pH, reaction time and the total oxidant demand in the water (for example, presence of nitrate, ammonia and organic compounds) (Knocke et al., 1990; Casale et al., 2002; Lenz et al. 2004; Brandhuber et al., 2013). Once dissolved Fe(II) has been oxidized to particulate iron, removal can be achieved using coagulation and flocculation, sedimentation or dissolved air flotation and granular media filtration. Low-pressure membrane filtration (ultra- and microfiltration) can also be used (Choo et al., 2005; Chen et al., 2011; Fakhfekh et al., 2017; Cheng et al., 2020).
Various oxidizing agents can be used to change the oxidation state of dissolved Fe(II) in the drinking water supply: O2(aq) (aeration), free chlorine, KMnO4, ozone (O3) and chlorine dioxide (ClO2). In laboratory tests, Knocke et al. (1990) reported instantaneous oxidation of dissolved Fe(II) iron by KMnO4, ClO2 or O3 in the pH range from 5.0 to 7.0 when no organic carbon was present. Similarly, free chlorine was found to produce rapid rates of oxidation for dissolved Fe(II) iron.
| Oxygen | Chlorine | MnO4- | ClO2 | O3 | |
|---|---|---|---|---|---|
| Oxidant mg/L/1 mg/L Fe(II) | 0.14 | 0.64 | 0.71 | 1.2 | 0.43 |
Adapted from: Tobiason and Brandhuber, 2018
Groundwater sources with elevated concentrations of Fe(II) often have high concentrations of other constituents, most notably dissolved Mn(II), DOC and As as well as ammonia and hydrogen sulphide (H2S). While there are many similarities between the treatment methods used for iron removal and the methods used for Mn removal, there are some important differences in iron and Mn chemistry that must be considered. Iron is typically oxidized much faster and by a wider range of oxidants than Mn. When both iron and Mn are present, iron is oxidized first, exerting an oxidant demand that must be satisfied before Mn oxidation can occur (Tobiason et al., 2016). Oxidant dosing intended for Mn(II) oxidation will need to be increased to account for Fe(II) present in the raw water. Since Fe(II) is readily oxidized by oxygen and free chlorine, and since neither of these substances is particularly effective for Mn(II) oxidation, it is appropriate to begin by using one of these oxidants, followed by a strong oxidant for Mn(II) oxidation. Oxidation of Mn(II) can be done either before or after removal of the iron precipitates by clarification or filtration. The sequence in which oxidants are added may be an important issue for design and operation (Knocke et al., 1991; Brandhuber et al., 2013).
The presence of H2S makes aeration a more desirable treatment alternative for iron removal. The presence of ammonia with iron adds complexity because the oxidant demand for ammonia must be satisfied before iron can be oxidized (Civardi and Tompeck, 2015). It is also noteworthy that As frequently co-occurs with iron. This can be advantageous as As is adsorbed effectively by iron oxides that form during the oxidation step.
DOC levels greater than 2.5 mg/L create a potential oxidation problem for dissolved Fe(II) iron due to the formation of Fe(II)/Fe(III)-DOC complexes (discussed in section 4.2.1) (Knocke et al., 1990, 1993; Sommerfeld, 1999). The type of organic matter and the corresponding MWD fraction influence the oxidation and subsequent removal of iron in water. Knocke et al. (1992) summarized the effectiveness of oxidation of dissolved Fe(II) iron by KMnO4, ClO2 and free chlorine in the presence of different MWD fractions of organic matter. A low rate of iron removal (< 25%) was observed in systems when the dissolved Fe(II) iron was complexed by high molecular weight humic acids. The complexes were very resistant to oxidation even at high doses of oxidants (up to 800% of the stoichiometric requirement for Fe(II) oxidation). More effective iron oxidation was noted in systems where the dissolved Fe(II) iron was complexed by low molecular weight fulvic acids (< 1 000 atomic mass unit) (Knocke et al., 1990).
Aeration:Aeration followed by rapid sand filtration is a commonly used treatment for the removal of iron from groundwater (Sharma et al., 2001). Oxygen from the atmosphere reacts with soluble Fe(II) in raw water to form insoluble ferric oxides, which agglomerate to large heavy flocs and are removed in filter beds (granular size 0.7–2.5 mm). Aeration also raises the pH by stripping CO2 from groundwater and may increase the iron oxidation rate (depending on the raw water pH) (Civardi and Tompeck, 2015).
Generally, the aeration/filtration process, using an aerator, a retention/sedimentation tank and filter beds, is applied to source water with iron concentrations > 5.0 mg/L (Wong, 1984). Sedimentation prior to filtration may also be needed at these high concentrations. This step helps to reduce the amount of solids removed by the filters and results in longer filter runs (Civardi and Tompeck, 2015). Depending on the alkalinity of the raw water and the degree of aeration required, several different aeration devices can be used. Pressure aerators are the device of choice when alkalinity is greater than 250 mg/L as calcium carbonate (CaCO3), while spraying nozzles, a cascade aerator and/or a packed tower aerator are used when alkalinity is below 250 mg/L as CaCO3. After aeration, the water is filtered through pressure or open-gravity filters (silica sand, anthracite, manganese green sand). Generally, filtration of groundwater takes place at a filtration rate from 7 to 12 m/h (Postawa and Hayes, 2013). This floc formation mechanism is limited in that colloidal iron and organic molecules that can form a complex with the iron can pass through the filter. Furthermore, floc formation reduces the run time of the filters and produces a sludge, which then requires disposal.
An increase in temperature, pH, alkalinity and detention time will accelerate the rate of Fe(II) oxidation by oxygen. The reaction rate is a slow process at pH < 7.0, with approximately 40% and 10% of Fe(II) being oxidized at pH levels of 6.9 and 6.6, respectively (Knocke et al., 1993). The reaction rate for oxidation of organically complexed iron is too slow a process to be used economically in water treatment systems (Kohl and Medler, 2006).
A pilot-scale study reported that aeration followed by chlorination and microfiltration effectively removed iron in drinking water (see Table 8). The precipitates accumulated on the microfiltration membrane, enhancing removal of both iron and Mn through autocatalytic activity. Backwashing with treated water removed the sludge that formed on the membrane. Chemical composition of the sludge included mainly iron, Mn, calcium and trace amounts of other oxides (Chen et al., 2011). These results are consistent with the results reported by Cheng et al. (2020) on the removal of iron from groundwater by aeration and ultrafiltration. The iron particle size formed by oxidation ranged from 1.5 to 50 µm. The authors concluded that ultrafiltration membranes with a pore size less than 1.0 µm would be an effective separation process for iron oxide particles.
| Fe species in source water (mg/L) | Process description | Fe(II) in treated water or % removal | References |
|---|---|---|---|
| Fe(II) – 0.35–1.8 | Pilot scale, groundwater: Cascade aeration (2 min) followed by chlorine oxidation (free Cl2 residual 0.3–0.7 mg/L) and microfiltration (filtration size 0.1 µm). Raw water quality: Mn(II): > –0.5 mg/L |
After aeration/chlorination:
Fe(II): 0.1 mg/L Microfiltration: Fe(II): 0.02 mg/L |
Chen et al. (2011) |
| Fe(II) – 3.0 | Lab study: Aeration/manganese green sand filtration/ultrafiltration Raw water quality: Simulated water- Fe(II) 3.0 ± 0.1 mg/L; Mn(II):1.0 ± 0.1 mg/L; pH 6.75 ± 0.25; turbidity < 1 NTU. |
After aeration:
Fe(II): 75%–85% Ultrafiltration: Fe(II): 100% |
Cheng et al. (2020) |
| Fe(II) –7.0–15.0 | Lab test: groundwater; aeration for 15 min at pH 8.0, followed by polymeric microfiltration membrane (porosity 0.2 µm) Raw water quality: Mn 1.8–2.0 mg/L; DOC < 2.0 mg/L; pH 8.0 and 80C; alkalinity 19–230 mg CaCO3/L; hardness 19–230 mg CaCO3/L; turbidity < 0.2 NTU; pH 6.9–7.2. |
Microfiltration permeate: Fe(II): < 0.1 mg/L | Ellis et al. (2000) |
DOC – dissolved organic carbon.
Chlorine: Generally, a combination of chlorination followed by a filtration process is recommended for removal of iron present at a low concentration (< 2.0 mg/L) (Wong, 1984). Kinetic studies have found that free chlorine effectively oxidized dissolved Fe(II) iron at pH levels greater than 5.0 and in the presence of low levels of DOC in source water. A soluble Fe(II) concentration of 2.0 mg/L was reduced to a level below 0.1 mg/L with a chlorine dose close to the stoichiometric requirements (0.63 mg/L) at pH 6.5, temperature 25°C, and DOC level below 1.0 mg/L, in 6 to 8 seconds. The oxidation rate decreased with a decrease in water temperature but increased with an increase in pH. It was noted that the increase in the rate was not linear with increasing pH due to the change in chlorine speciation at a pH greater than 8.0 (Knocke et al., 1990). However, free chlorine was shown to be an ineffective oxidant from the standpoint of removal of organically complexed iron (Knocke et al., 1990; Knocke et al., 1992). The data showed oxidation of less than 10% in the presence of 2.0 mg/L Fe(II) and 5.0 mg/L fulvic acid, using chlorine doses corresponding to 400% of the stoichiometric requirements, at pH levels of 6.0 to 7.5 and a contact time of up to 210 minutes (Knocke et al., 1992).
The pre-chlorination process requires an evaluation of source water quality to determine the amount of natural organic matter that may lead to the formation of chlorinated organic compounds as disinfection by-products (DBPs). Iron is oxidized faster than DBPs are generated by the reaction between free chlorine and NOM. Therefore, the iron oxidation reaction can only be targeted in raw water. The chlorine dose should be sufficient to oxidize the iron without leaving a chlorine residual (Tobiason and Brandhuber, 2018). More information on the formation of DBPs can be found in Health Canada's guidelines for trihalomethanes and haloacetic acids (Health Canada, 2006a,b).
Certain groundwater treatment facilities use more than one oxidant to remove both iron and Mn in their source waters. Since the rate of iron oxidation is faster than that of Mn, the sequence of oxidants addition is an important design and operational factor. If chlorine and KMnO4 are added simultaneously, for Fe(II) and Mn(II) oxidation respectively, KMnO4 will react with Fe(II) instead of Mn(II), since the reaction kinetics favour this interaction. The remaining free chlorine will not be effective for Mn(II) oxidation and, therefore, the result will be poor Mn(II) oxidation. A staged addition of the oxidants, with chlorine followed by KMnO4, and sufficient contact time will promote effective iron and Mn oxidation (Knocke et al., 1991).
Several case studies using a combination of chlorination followed by a dual-media (anthracite/sand) filtration have demonstrated effective removal of iron in source waters with low DOC concentrations. The results indicated rapid iron oxidation with a high percentage of iron being converted to Fe(OH)3 in response to chlorine addition (Wong, 1984; Knocke et al., 1990; Brandhuber et al., 2013) (see Table 9). Schneider et al. (2001) conducted a study to determine whether membrane microfiltration could be used instead of media filtration for iron and Mn removal in a conventional filtration plant. The tests conducted with a variety of oxidants, including chlorine (dose not specified), showed 98% removal of iron with the influent concentration reduced from 0.65 mg/L to 0.01 mg/L.
| Fe species in source water | Process description | Fe(II) in treated water or % removal | References |
|---|---|---|---|
| Total iron: 0.7–2.3 mg/L | Full-scale: WTP 10 MGD (groundwater): Pre-chlorination with 1.5 mg/L chlorine and contact time 1 min, followed by 0.2–0.4 mg/L KMnO4; flocculation; dual-media filtration (anthracite /sand) (HLR 1.5–2.5 gpm/ft2); secondary disinfection w/t 1.0 mg/L HOC1. Raw water quality: pH 7.1–7.3; alkalinity 260–290 mg/L (as CaCO3); hardness 375–400 mg/L (as CaCO3); temperature 13–16°C; total Mn 0.14–0.25 mg/L; low DOC concentration (not reported). Mn(II) 0.14–0.25 mg/L |
After chlorination:
ave. dissolved. Fe(II) 0.5 mg/L After KMnO4/flocculation: ave. dissolved Fe(II): 0.1 mg/L Finished water: ave. dissolved Fe(II): 0.1 mg/L |
Knocke et al. (1990) |
| Dissolved iron 1.5–2.5 mg/L | Pilot-scale (groundwater): Pre-chlorination w/t 2–3 mg/L chlorine; 3 parallel dual-media filters (anthracite/sand) (HLR 3 gpm/ft2 each); KMnO4 1.4 mg/L; followed by 3 parallel coarse media Mn contractors as a second stage (HLR 10 gpm/ft2 each); cationic polymer. Raw water quality: TOC ~ 1.0 mg/L; pH 7.0–7.2; Mn 0.15–0.25 mg/L. |
After dual-media filtration: Dissolved Fe(II): < 0.05 mg/L | Brundhuber et al. (2013); Tobiason and Brandhuber (2018) |
| Dissolved iron 2.0 mg/L | Pilot scale (groundwater): Chlorination: HOCl doses higher than stoichiometric doses (not provided); reaction time 20 min; dual media filtration (anthracite/sand); filtration rate 5.0 gpm/ft2 Raw water quality: alkalinity 77.0 mg/L (as CaCO3); total dissolved solids 162.0 mg/L; Mn 2.0 mg/L; pH adjustment to 8.5; turbidity 1.5 NTU. |
Dissolved Fe(II): > 90% | Wong, 1984 |
HLR – hydraulic loading rate; MGD – million gallons per day; WTP – Water treatment plant; TOC – total organic carbon.
Permanganate: Permanganate is a commonly used oxidant available in solid (KMnO4) or liquid (MnNaO4) form. KMnO4 is a moderately strong oxidant that is widely used for oxidation of soluble Fe(II) and Mn(II) in water treatment plants. Knocke et al. (1990) investigated the kinetics of Fe(II) oxidation by KMnO4 and found that the process was extremely rapid. The results showed complete oxidation of 2.0 mg/L Fe (II) with a KMnO4 dose equal to 105% of stoichiometric requirements, at pH 5.5, a temperature of 20°C and a low DOC level (below 1.0 mg/L). The authors concluded that oxidation of uncomplexed iron by KMnO4 occurred instantaneously, regardless of the water temperature, at pH values of 5.5 or greater. However, the presence of DOC significantly impacted the ability of KMnO4 to oxidize Fe(II) due to the formation of organically complexed iron, which was extremely resistant to oxidation. KMnO4 doses corresponding to 440% of stoichiometric requirements resulted in only 22% oxidation of 2.0 mg/L of soluble Fe(II) in the presence of 5.0 mg/L of humic acid at a pH of 7.5 and a contact time of 30 minutes (Knocke et al., 1990, 1993). Knocke et al. (1993) reported that Fe(II) complexed by lower molecule weight organic matter (fulvic acids) was more effectively oxidized by KMnO4. A KMnO4 dose of 2.5 mg/L in the presence of 3.0 mg/L fulvic acid with a contact time of 60 minutes was required to reduce 2.0 mg/L of soluble Fe(II) to approximately 1.0 mg/L at pH 6.5 and 250C. An increase in the KMnO4 dose to 5.5 mg/L resulted in the complete removing of 2.0 mg/L of soluble Fe(II) after 105 minutes under the same conditions (pH, DOC and temperature). These results showed conclusively that oxidation of complexed iron requires excessively high doses of KMnO4 and a long detention time to accomplish iron removal. Knocke et al. (1987) noted that using KMnO4 to oxidize Fe(II) and Mn(II) when significant organic matter is present in the source water may be impractical due to high chemical costs. It is important to note that when using permanganate, accurate dosing is critical to avoid any excess permanganate in the treated water. Excess permanganate can produce discoloured water (that is, pink water, MnOx(s) precipitation) in the distribution system leading to an increase in consumer complaints, and the amount that is present may exceed the maximum acceptable concentration (MAC) for manganese (Health Canada, 2019b).
A treatment plant using a combination of oxidation with KMnO4 followed by conventional mixing, flocculation, settling and dual-media filtration was able to achieve 95% removal of soluble Fe(II) with influent concentrations in the range 0.3 of 0.8 mg/L (see Table 10) (Knocke et al., 1990). In another study at full-scale, the data indicated 97% removal of an influent Fe(II) concentration of 0.4 mg/L using KMnO4 followed by ultrafiltration (AWWA, 2005).
| Fe species in source water | Process description | Fe(II) in treated water | References |
|---|---|---|---|
| Total iron: 0.4–1.1 mg/L Dissolved iron: 0.3–0.8 mg/L |
Full-scale surface water system 2 MGD: Pre-oxidation w/t KMnO4 (0.1– 1.0 mg/L); rapid mix, flocculation; sedimentation; dual media filtration. Raw water quality: Mn(II) 0.67 mg/L; no other information was provided. |
After flocculation:
average dissolved Fe(II): 0.3 mg/L After filtration: average dissolved Fe(II):0.04 mg/L |
Knocke et al. (1990) |
| Dissolved iron: 0.4 mg/L | Full-scale: groundwater (net operating flux 25 MGD): oxidation KMnO4 addition, static mixer followed by UF (three parallel-immersed membrane tanks). UF system recovery 95%. Overall system recovery > 99%. Raw water quality: alkalinity 57 mg/L (as CaCO3); hardness 79 mg/L (as CaCO3); Mn 0.62 mg/L; turbidity 1.52 NTU. |
Dissolved Fe(II): 0.01 mg/L | AWWA (2005) |
MGD – million gallons per day; UF – ultrafiltration.
Chlorine dioxide: Although the oxidation rates achieved using ClO2 were reported to be slightly slower than those reported for KMnO4, Knocke et al. (1991) observed that even at 20C, using a 125% stoichiometric dose of ClO2 at pH 5.5, more than 90% of the initial Fe(II) concentration of 2 mg/L was oxidized within 5 seconds in the absence of organic matter. However, organically complexed iron was stable even in the presence of high stoichiometric excesses of ClO2 doses. The results were similar to those reported for iron oxidation by free chlorine and KMnO4. ClO2 doses up to 1500% of stoichiometric requirements resulted in less than 10% to 15% removal of 2.0 mg/L of dissolved Fe(II) in the presence of 5.0 mg/L humic acid for both pH 6.5 and 8.0 (Knocke et al., 1991, 1993). Similar results were reported for oxidation of Fe(II) complexed with fulvic acids (< 10% removal).
Oxidation of Fe(II) by ClO2 generated chloride anions (Cl-). Chlorite anions (ClO2-) are an oxidation by-product that results when ClO2 is used for Mn treatment. One technique available for removing ClO2- anions from drinking water is the addition of Fe(II)to reduce ClO2- to chloride ( Cl-); the Fe(II) is oxidized to Fe(III) and precipitates as Fe(OH)3. In a treatment process where Mn removal is the main objective, the Fe(OH)3 that is produced could enhance the coagulation/flocculation processes used within the treatment plant depending upon the location of this Fe(II) addition (Brandhuber et al., 2013). Since the health-based drinking water guideline for chlorite and chlorate in Canada is 1.0 mg/L, treatment plants using ClO2 should not exceed a feed dose of 1.2 mg/L (Health Canada, 2008). This maximum feed dose limits the concentration of iron that can be managed by using ClO2. Understanding and having the ability to manage ClO2- chemistry is important for ensuring compliance of the related DBPs and addressing iron and Mn removal.
Schneider et al. (2001) conducted a pilot-scale study to determine if membrane microfiltration could replace media filtration for Mn removal in a conventional filtration plant and reported 100% removal of an influent iron concentration of 0.84 mg/L using chlorine dioxide (dose not provided).
Ozone: Ozone may be used for iron and Mn oxidation, but it is not used frequently because it has higher capital costs than other available methods.
Nieminski and Evans (1995) conducted pilot-scale testing to determine if ozone could replace chlorine to oxidize iron in a conventional filtration plant. The raw water quality at the treatment site had an alkalinity of 100 to 150 mg/L (as CaCO3), hardness of 170 to 220 mg/L (as CaCO3), a very low concentration of total organic carbon (TOC) (< 0.3 mg/L) and a pH between 7.0 and 8.1. Applying an ozone dose of 2.0 mg/L followed by pressure filtration (filter media not specified) resulted in a decrease in the influent iron concentration from 0.4 mg/L to below 0.02 mg/L.
Cromley and O'Connor (1976) noted that when iron was oxidized by ozone, the residual concentrations of soluble iron were greater than expected. The authors concluded that the use of ozone promoted oxidation of the organic matter, leading to the formation of additional carboxylic functional groups, which played a role in complexing iron. In a pilot-scale study, an ozone dose of 6.0 mg/L achieved 96% oxidization of 9.9 mg/L of dissolved Fe(II) iron in the presence of 7.8 mg/L of TOC. However, the authors reported that the resulting precipitates were not effectively removed by an anthracite-and-sand filter with a hydraulic loading rate of 5.0 m/h (Sallanko et al., 2006).
4.3.3 Oxidation, adsorption and filtration
Adsorption and filtration are processes often installed in groundwater treatment plants specifically for iron and Mn removal, typically when both substances are present. The granular filter media used to remove iron and Mn by sorption and surface oxidation are similar, since they rely on a surface coating of MnO2(s). The base materials vary, but the function of the MnO2(s) surface coating is often the same (Sommerfeld, 1999).
Manganese greensand filtration: Manganese greensand is a purple-black granular filter media processed from glauconite sand synthetically coated with a thin layer of Mn dioxide, MnO2(s). Prior to use, greensand is conditioned by soaking it in a KMnO4 or chlorine solution. Once the greensand filters are appropriately conditioned, iron and Mn removal occurs through both filtration and adsorption (Kohl and Medlar, 2006). Since the head loss generated is higher than an equivalent bed depth of silica sand, most applications of greensand use pressure filtration (Brandhuber et al., 2013).
Greensand filters are suitable for groundwater systems with iron and Mn concentrations < 5 mg/L. Greensand filter media have an adsorptive capacity for iron of 0.13 pound per cubic foot (59 g/0.028 m3), and removal capacity increases with an increase in the pH level of the water. Hydraulic loading and backwash rates will depend on the media used (size and depth) and the water temperature. The maximum pressure drop across the media should be kept to less than 6 to 8 psi to avoid degradation of the greensand. To maintain the adsorptive capacity of manganese greensand media, the bed is regenerated, either continuously or intermittently, and backwashed (Sommerfeld, 1999; Casale et al., 2002; Kohl and Medlar, 2006).
A continuous regeneration process is used for well waters in cases where iron removal is the main objective (Civardi and Tompeck, 2015). Continuous regeneration involves feeding an oxidant (chlorine or KMnO4 for Mn(II) removal) or a combination of two oxidants into the raw water prior to contact with the greensand medium. Most of the dissolved Fe(II) in the source water is directly oxidized to Fe(III), and the greensand medium will function primarily as a particle removal process. If any dissolved Fe(II) reaches the greensand media, it can be removed via adsorption and oxidation on the MnOx(s) surface coating (Sommerfeld, 1999; Kohl and Medlar, 2006; Tobiason and Brandhuber, 2018). An excess of oxidant is required to ensure that the MnOx(s) adsorption sites are regenerated. Utilities should be aware that continuously applying KMnO4 can result in discolouration of the treated water due to excess permanganate. Another alternative for greensand media regeneration is to apply free chlorine to the greensand media in conjunction with lower doses of KMnO4 or with no KMnO4. Maintaining a free chlorine concentration greater than 0.3 mg/L in the filtered water helps to ensure good regeneration of the greensand media. The advantages of using chlorine for regeneration include lower chemical costs, less solids loading to the filter and elimination of the risk of pink water occurring. However, utilities should weigh these benefits against the formation of DBPs when using chlorine for regeneration. Backwashing of the filter medium is required to remove accumulated particulates (Brandhuber et al., 2013; Tobiason and Brandhuber, 2018).
Intermittent regeneration involves the use of manganese greensand media to directly adsorb dissolved Fe(II) at low concentrations (and Mn(II)) until breakthrough starts to occur. The filter medium is then regenerated using an oxidant (typically MnO4) to oxidize the adsorbed reduced Fe(II), which is subsequently backwashed (as oxidized particulate iron). This ensures that the media surface is fully oxidized and restores its adsorptive capacity for Fe(II) (Civardi and Tompeck, 2015). Intermittent regeneration practices have an advantage when raw water constituents, such as organic carbon, ammonia and hydrogen sulphide, interfere with the pre-oxidation and filtration processes (Sommerfeld, 1999).
Studies conducted at several full-scale facilities with production capacities ranging from 0.06 to 2.0 million gallons per day (MGD) have demonstrated effective iron removal using a combination of oxidation (oxidant not specified) followed by manganese greensand filtration. Feed waters with iron concentrations of 1.01 to 5.5 mg/L were reduced to concentrations ranging from below the detection limit (not specified) to 0.3 mg/L in the treated waters (Metcalf, 2000).
Iron oxide filtration: Sharma et al. (1999) conducted batch tests with a synthetic groundwater to quantify the adsorption capacity of different filter media, including virgin sand and used sand (naturally coated with iron oxide). Although an increase in adsorption capacity with increasing pH levels was observed for both the virgin and used sand media, the study clearly demonstrated that the oxide coated sand had a greater adsorptive capacity than the virgin sand. When the pH increased from 6.0 to 6.5, adsorption capacities increased by 55% for the virgin sand and by 91% for the used sand, while the increases were 66% and 174%, respectively, at pH 7.0. In practice, the study demonstrated that if the adsorbed Fe(II) on the filter media is oxidized, the iron oxide builds up and forms a coating, which is capable of adsorbing Fe(II) from the water. However, different reaction rates were observed for the adsorption of Fe(II) on the filter media and for the oxidation of Fe(II) in water. The authors found that the effectiveness of iron removal by a filter can be improved by maximizing the adsorption of Fe(II) onto the iron oxide coated media. It was also determined that maintaining proper process conditions is essential for utilizing the capacity of the iron oxide coated media.
Aluminum silicate sand impregnated with MnO2(s): Iron can be removed by filtration with an aluminum silicate sand media impregnated with MnO2(s) and aeration applied upstream of the filter. This technology has been used mostly in point-of-use (POU) applications, with a few applications in municipal water treatment (Sommerfeld, 1999). The MnO2 (s) acts as a catalyst for the oxidation of soluble iron to ferric hydroxides, which precipitate to filterable form (Sommerfeld, 1999; Hiiob and Karro, 2012). Water quality parameters such as DO, TOC, hydrogen sulphide and pH greatly influence the effectiveness of this technology. The DO concentration needs to be at least 15% of the iron concentration; the organic matter concentration should be below 4.0 to 5.0 mg/L; the water should contain no hydrogen sulphide and should have a pH greater than 6.8 (Hiiob and Karro, 2012). Backwashing of the filters is required to remove precipitated ferric hydroxides.
Hiiob and Karro (2012) reported that aluminum silicate sand media impregnated with MnO2 (s) with aeration applied upstream of the filter, was effective at removing 85% and 99% of iron at pilot-scale in two groundwater systems. A reduction in iron concentrations from 3.56 mg/L to 0.27 mg/L in one system and 1.68 mg/L to 0.04 mg/L in the other system was achieved in treated water.
Pyrolusite media filtration: Iron can be removed from solution by adsorption on a packed bed of granular pyrolusite, which is the mineral form of MnO2 (s) (for example, no coating required) (Casale et al., 2002; Kohl and Medlar, 2006; Tobiason et al., 2006). Typically, pyrolusite filters are a blend of pyrolusite and sand ranging from 10% pyrolusite/90% sand to 50% pyrolusite/50% sand (percent by volume). The necessary ratio of pyrolusite to sand will depend on the concentrations of iron to be removed from the raw water. Depending on source water quality, aeration may be effective for oxidizing iron. Since chlorine is typically added prior to the filter to continuously regenerate the pyrolusite media, it will also oxidize the iron. Intermittent regeneration using chlorinated backwash water can also be effective. One advantage of using pyrolusite filter media is that higher filtration rates are possible than with greensand processes (Sommerfeld, 1999; Casale et al., 2002). Pyrolusite media has a very high specific gravity (> 4.0) and requires substantially higher hydraulic loading rates during backwashing operations to fluidize the media bed (Odell and Cyr, 1998; Kohl and Medlar, 2006). Casale at al. (2002) indicated that the increased filtration rate can reduce construction costs and filter size.
Limited information is available on the effectiveness of pyrolusite for iron removal. Olanczuk-Neyman et al. (2001) reported that a pilot-scale dual-media filter bed (sand/pyrolusite) achieved an average of 89% removal of iron in groundwater. The average influent iron concentrations of 1.1 mg/L (which fluctuated between 0.2 and 2.0 mg/L) was decreased to an average of 0.12 mg/L.
4.3.4 Lime softening and ion exchange
Treatment plants that use lime or soda ash softening can also achieve iron removal by raising the pH of the water above the solubility of iron hydroxide and carbonate solid phases. Because lime softening is more expensive than other iron removal processes, it is typically used only when significant softening of the water is required in addition to iron and/or Mn removal (Wormald and Clark 1994; Hamann et al., 1990; Benefield and Morgan, 1990; Sommerfeld, 1999).
Dissolved Fe(II)can also be removed by cation exchange using cationic exchange media typically used for ion-exchange-based softening. As with other cation exchange processes, backwashing with a brine solution removes the iron (as well as calcium and magnesium and Mn(II)) accumulated on the resin. If Fe(II) oxidation occurs during the process, the resulting precipitates may coat and foul the media (Sommerfeld, 1999).
4.3.5 Membrane filtration
Ultrafiltration membranes can be a cost-effective solution for particulate iron removal. Generally, they are a good solution for well water that is under the direct influence of surface water, when the combined concentration of iron and Mn is above 5 mg/L or as an alternative to sand/anthracite filtration for surface water. Their use under these conditions allows for some pathogen removal without a dedicated filtration system and coagulant addition, reduced space requirements and chemical costs (that is, less chlorine needed).
Batch tests of ultrafiltration membranes were conducted with feedwater containing 1.0 mg/L of iron in dead-end mode. Substantial iron removal was achieved without chlorine addition and ranged from 66% to 92% (influent concentrations of 0.4–1.0 mg/L). Removal efficiency of dissolved iron increased very rapidly and reached nearly 100% within 20 min with a chlorine dose as low as 0.5 mg/L as Cl2 (Choo et al., 2005).
Two commercially available polyamide nanofiltration (PA-NF) and ultrafiltration membranes (PA-UF) were tested at bench-scale, at a feed concentration of 100 mg/L, to examine their capacity to treat groundwater. Experimental results showed that at a pH range of 3 to 11, membrane rejection increased as the pH of the feed solution increased for both membranes. Iron removal by the PA-NF membrane at pH 9 and 11 achieved permeate concentrations of 0.08 and 0.12 mg Fe/L, respectively. The PA-UF membrane achieved permeate iron concentrations of 0.12, 0.07 and 0.13 mg Fe/L at pH 7, 9 and 11. Fe rejection was successful at pH 9 and above. When the feed solution pH was adjusted below 7, poor rejection of iron by both NF and UF membranes was observed (Kasim et al., 2017). Iron can foul membranes prematurely, so process or water quality adjustments (for example, maintaining anoxic water conditions) may be needed to minimize fouling (Duranceau, 2001).
4.3.6 Biological filtration
Biological removal can be an effective, economic and environmentally attractive method for the removal of iron and Mn in source waters. Biological filtration is mainly used for groundwater with more stable quality as the microbial populations on the filter may not react fast enough to water quality changes (Tobiason and Brandhuber, 2018). Large bacterial populations naturally present in water and soil can be established in the filters. These bacteria oxidize iron and precipitate the metal in the filter media (Mouchet 1992; Sogaard et al., 2000; Williams, 2002; Štembal et al., 2005; Kohl and Medlar, 2006; Burger et al., 2008; Marsadi et al., 2018; Earle et al., 2020). Iron oxidizing bacteria have the unique property of causing oxidation and precipitation of dissolved iron under pH and redox potential conditions that are intermediate between those of natural groundwater and those required for conventional (physical/chemical) iron removal (Mouchet et al., 1992). Biological oxidation of iron was found to be the dominant process when conditions for physicochemical iron oxidation were not optimal (Vet et al., 2011).
Many different strains of bacteria have been identified in the literature as being able to oxidize Fe(II); examples include Gallionella, Leptothrix, Crenothrix and Siderocapsa (Kohl and Medlar, 2006). Research has shown that the mechanisms involved in Fe(II) removal by iron bacteria include intercellular oxidation by enzymatic action or extracellular oxidation caused by the catalytic action of polymers excreted by iron bacteria. Some types of heterotrophic iron bacteria may also be capable of utilizing the organic fraction of the organically complexed iron, releasing the iron that can then be oxidized (Mouchet, 1992). The precipitates form during biologically based Fe(II) oxidation are more compact than the amorphous precipitates that form during chemical precipitation (Mouchet, 1992; Baudish, 2010). Backwashing of the media removes the accumulated oxidized metal, along with some of the biofilm (Tobiason and Brandhuber, 2018).
A key challenge in establishing a viable microbial population for effective Fe(II) oxidation and removal is determining the acclimation time required. This time depends on the pH, temperature and nutrients (N, P) but it can be reduced by introducing a small amount of filter media collected from a mature biologically active filter (Tekerlekopoulou et al., 2013; McClellan, 2015). Growth rates for Fe(II) oxidizing microorganisms are typically faster than the growth rates for organisms that promote Mn(II) oxidation. Optimum operating conditions for iron oxidation include pH levels in the range of 6.5 to 7.2, redox potential approximately 200 mV, DO levels of 5.0 to 25 mg/L and temperatures of 10°C to 25°C. Iron and Mn can be oxidized and removed simultaneously depending on their concentrations and the reactor configuration. However, the two metals are often treated in separate steps because iron is easily oxidized by aeration and different conditions are required for optimal oxidation and removal of Mn. If it is not removed first, iron may interfere with Mn oxidation and removal (Mouchet, 1992; Sommerfeld, 1999; Kohl and Medlar, 2006; Tekerlekopoulou et al., 2013). Kohl and Medlar (2006) stated that a typical treatment protocol for simultaneous iron and Mn removal would require two separate biofiltration stages, with an initial aeration for Fe(II) removal followed by a secondary aeration stage, pH adjustment and biological filtration for Mn(II) removal with post-treatment such as disinfection as the final step. McClellan (2015) described such a system whereby the biological filtration process effectively treated water with iron and Mn concentrations of 3 mg/L and 2.5 mg/L, respectively. Concentrations below the detection limits of 0.1 mg/L and 0.02 mg/L for iron and Mn, respectively, were achieved without using chemical oxidants and with significantly less backwashing than in the chemical oxidation process.
Multiple treatment stages may be required to remove iron more effectively depending on the contaminants present in the raw water (for example, Mn, NH3). Studies have reported that ammonia in the source water necessitated that biological iron removal be applied upstream of the nitrification stage (Mouchet, 1992; Kohl and Dixon, 2012). The biological oxidation of iron by the microorganisms Gallionella ferruginea and Leptothrix ochracea was found to be a promising technology for effective removal of As from groundwater. During the process, iron oxides were deposited in the filter medium, along with the microorganisms, which created a favourable environment for As adsorption and removal from the aqueous streams (Katsoyiannis and Zouboulis, 2004).
Advantages of biological filtration include a high filtration rate (up to 50 m/h), coarse sand (0.95–1.35 mm), high retention capacity (1–5 kg Fe/m3), elimination of chemical reagents, reduced capital and operating cost and good sludge treatability (Mouchet, 1992; Tekerlekopoulou et al., 2013).
Full- and pilot-scale biological filtration plants have successfully removed iron from groundwater, achieving iron removal in the range of 93% to 99% (see Table 11).
| Fe species in source water | Process description | Fe(II) in treated water or % removal | References |
|---|---|---|---|
| Dissolved Fe(II): 1.5–2.0 mg/L | Full-scale: Groundwater WTP (6.5 MGD). A portion of water is treated by reverse osmosis (RO).
Remaining flow: 1st stage biological filtration: pH 7.4; low DO concentration (not provided) for iron removal. Second stage biological filtration: O2 is added; pH adjustment to 7.7 for Mn removal. RO and biologically treated waters were blended before distribution. Raw water quality: Ammonia-nitrogen 1.4–1.7 mg/L; Mn(II) 0.08–0.12 mg/L. |
Ist stage: Dissolved Fe(II): < 0.1 mg/L | Brandhuber et al. (2013) |
| Dissolved Fe(II) - 2.3 mg/L | Full-scale (groundwater) 0.6 MGD: Aeration, followed by 3 gravel/sand biological filters in parallel (hydraulic loading rate [HLR] 2 gpm/ft2). Backwash every 3 days 14 gpm/ft2. Raw water quality: pH 7.48; DO 1.22 mg/L; ORP 114 mV; bTOC 1.2 mg/L |
After aeration:
Fe(II): 0.2 After dual-media filtration: Fe(II): < 0.025 |
Lytle et al. (2007) |
| Dissolved Fe(II): 0.75–1.1 mg/L | Full-scale (groundwater) 2 200 m3/h: Cascade aeration; Filter media: 4 gravity filters with depth 1.4 m sand; filtration rate: 22–23 m/h; Filter run 48 hours; Backwash 8.5 min with < 0.2% of the product water. | Filter effluent after 10 hours: 0.1 mg/L After 24 hours: < 0.03 mg/L |
Mouchet (1992) |
| Total iron: 6–8 mg/L | Pilot-scale (groundwater): Aeration; 2 parallel filtration columns a) manganese sand (flow rate 3.9 m/h) and b) silica sand (flow rate 3.1 m/h); Inoculated material- used sand of a slow sand filter. Raw water quality: Low organic matter; pH 7.2; DO 5 mg/L; Mn 1.5–2.25 mg/L. |
Both columns: 99% | Qin et al. (2009) |
HLR – hydraulic loading rate; MGD – million gallons per day; DO – dissolved oxygen; ORP–oxidation-reduction potential; WTP – Water treatment plant.
An important consideration for utilities contemplating the possibility of switching from MnOx(s)-coated media filtration to biological filtration is the potential for the release of previously accumulated metals (including iron) on the filter media once the free chlorine residual across the filters is depleted (Gabelich et al., 2006; Kohl and Dixon, 2012). The MnOx(s) coatings on filter media also demonstrated a significant affinity for adsorbing other metals, including aluminum, iron, calcium and a variety of heavy metals. Utilities intending to convert an existing MnOx(s)-coated media filter should consider removing the filter and cleaning or replacing it prior to converting to biological filtration (Kohl and Dixon, 2012).
4.3.7 Sequestration
Sequestration is a control measure that is aimed at minimizing aesthetic water quality problems associated with the oxidation of dissolved Fe(II) to Fe(III) particles within the distribution system. In general, sequestration is considered a temporary control measure for iron because its effect is time limited (Kohl and Medlar, 2006). Sequestering agents include compounds such as hexametaphosphate and polyphosphate. Sequestration is generally not recommended as a strategy for addressing discoloured water since it can have a negative impact on other metals, such as Pb.
Polyphosphates have been used to successfully control episodes of red water (Lytle and Snoeyink, 2002). When iron is oxidized (typically with chlorine) to form a colloidal ferric form, a polyphosphate is added to stabilize colloidal iron particles that are too small to cause any apparent colour or turbidity (Sommerfeld, 1999; Casale et al., 2002; Kohl and Medlar, 2006). However, polyphosphates are typically used for the sequestration and mitigation of discoloured water from source water Mn and iron. Many researchers have incorrectly concluded that iron by-products decreased with the use of polyphosphate, when in fact the iron concentrations or the iron corrosion rates may have increased (McNeill and Edwards, 2001).
Some systems with naturally occurring iron in their source water apply polyphosphates to sequester iron prior to chlorination. Sequestering agents are typically applied when iron concentrations in water are less than 2 mg/L (Kohl and Medlar, 2006). However, due to the hydrolysis reactions that cleave phosphate bonds, causing polyphosphates to convert to orthophosphate, the effectiveness of the sequestering agent diminishes over time. These reactions release iron ions into the water, where they are oxidized, precipitate and accumulate in the distribution system and can be released again (Friedman et al., 2010). Given the propensity for metals such as Pb and Mn to adsorb to iron (see section 4.3), exposure to these and other metals of health concern will occur if the water is consumed. Additionally, the use of polyphosphate has been reported to increase Pb and copper levels, depending on factors such as water quality conditions and pH (Health Canada, 2022).
Although technically not a sequestrant, sodium silicate is also used to reduce colour imparted by iron. Like polyphosphates, sodium silicate is a temporary control measure for iron because its effect is short lived (Robinson et al., 1992). Sodium silicate is a basic compound, and its use is always associated with an increase in pH. Li et al. (2021) found that, at high sodium silicate doses (48 mg/L), corrosion scales in cast iron pipe sections and lead service lines were dispersed, resulting in substantially increased Pb and iron release.
Even though sequestrants can reduce the visual impact of iron, they are a temporary measure and can negatively impact other metals (for example, Pb and copper). It is not recommended that sequestrants be used to address discoloured water related to iron or other metals.
4.4 Residential-scale treatment
In cases where iron removal is desired at the household level, for example, when using a private well, a residential drinking water treatment unit may be an option for decreasing iron concentrations in drinking water. Before a treatment unit is installed, the water should be tested to determine the general water chemistry and iron concentration in the source water. Periodic testing by an accredited laboratory should be conducted on both the water entering the treatment unit and the treated water, to verify that the treatment unit is effective. Since the iron removal capacity of units can decrease with use over time, they need to be maintained and/or replaced.
Consumers should verify the expected longevity of the components in the treatment unit according to the manufacturer's recommendations, and service it when required. Health Canada does not recommend specific brands of drinking water treatment units, but it strongly recommends that consumers use units that have been certified by an accredited certification body as meeting the appropriate NSF International Standard/American National Standards Institute (NSF/ANSI) for drinking water treatment units. The standards are minimum requirements for the materials, design and construction of drinking water treatment units that can be tested by a third party. This ensures that materials in the unit do not leach contaminants into the drinking water (that is, material safety). In addition, the standards include performance requirements that specify the removal that must be achieved for specific contaminants (for example, reduction claim) that may be present in water supplies.
Certification organizations (that is, third party) provide assurance that a product conforms to applicable standards and must be accredited by the Standards Council of Canada (SCC). Accredited organizations in Canada (SCC, 2023) include:
- CSA Group
- NSF International
- Water Quality Association
- UL LLC
- Bureau de normalisation du Québec (available in French only)
- International Association of Plumbing and Mechanical Officials
- Truesdail Laboratories Inc.
An up-to-date list of accredited certification organizations can be obtained from the SCC.
Certified residential treatment units for the removal of iron from drinking water are currently available. These devices rely on adsorption technologies. NSF/ANSI Standard 42 (Drinking Water Treatment Units—Aesthetic Effects) is applicable to the removal of iron from drinking water. For a drinking water treatment unit to be certified to Standard 42 for iron removal, it must be capable of reducing an average influent (incoming) concentration of 3.0 to 5.0 mg/L or 9.0 to 11.0 mg/L, to a maximum final concentration of 0.3 mg/L (NSF International, 2021).
The selection of the most effective treatment system for a household will depend on a variety of factors, including the concentration and form (dissolved or particulate) of iron and other parameters such as hardness, alkalinity, Mn, sulphide, ammonia and DOC that are present in the source water. A detailed report was prepared by Brodeur and Barbeau (2015) using the data from the Barbeau et al. (2011) study on the effectiveness of treatment technologies for the removal of Mn in groundwater. This report included results for iron removal by 96 systems using various technologies at an average influent concentration of 583.6 µg/L (0.584 mg/L) and treated water concentration of 88.5 µg/L (0.0885 mg/L) (average removal of 82.6%). Greater than 83% of systems could achieve an iron concentration below 100 µg/L (0.1 mg/L) in finished water. Results from the individual technologies are discussed below and summarized in Appendix C (Table C.1).
Conventional water softeners designed for the removal of hardness ions (Ca2+ and Mg2+) that treat water at the point of entry (POE) to the home use ion exchange technology and have the potential to remove iron. Brodeur and Barbeau (2015) observed a large range of removal efficiencies (-1 968% to 97%) of residential ion exchange systems (n=54). However, the authors found that the systems were generally effective with 75% of the systems achieving 97% removal of iron, achieving treated water concentrations below 81 µg/L (influent concentrations up to 644 µg/L). The resin used in ion exchange systems is selective towards hardness cations (calcium and magnesium). Therefore, iron removal using water softeners will be less effective when the source water has high hardness. Individuals on sodium restricted diets or needing to limit their exposure to potassium should be aware that residential softening systems will increase the concentration of sodium or potassium in the treated water.
Activated carbon filters were found to be capable of decreasing iron concentrations in drinking water at the POU. Brodeur and Barbeau (2015) observed that activated carbon systems achieved an average iron removal of 86% (range from 47.8% to 100%) for 17 of the 18 systems tested (influent concentrations 6.7–850 µg/L). However, one system released total iron, with an influent concentration of 17.3 µg/L, resulting in a treated water concentration of 48.1 µg/L (-178% of Fe removal). Only two (6%) of the systems had a treated water concentration above 100 µg/L (0.1 mg/L).
Reverse osmosis (RO) drinking water treatment systems have been shown to be effective and reliable POU treatment technology for decreasing iron concentrations in drinking water. However, RO membranes are more effective for removing dissolved iron since the oxidized form can cause severe fouling problems. Brodeur and Barbeau (2015) reported that POU reverse osmosis systems (n=9) were capable of achieving treated water concentrations below 6.0 µg/L when iron in the well water ranged from 784 µg/L to 16.8 µg/L (75–99% removal).
POE oxidizing filters such as greensand filters can be used for residential-scale iron removal. These systems have a filter medium with a Mn oxide coating that adsorbs and then oxidizes dissolved iron. They are often referred to as manganese greensand filters. Greensand filters require significant maintenance, including frequent regeneration with an oxidant and regular backwashing to remove oxidized iron particles. The preferred oxidant is chlorine, although potassium permanganate can also be effective. When not operated or maintained properly, greensand filters can release iron into the tap water (Barbeau et al., 2011). Brodeur and Barbeau (2015) reported iron removal data for three greensand filters installed in residences. All the systems were capable of removing iron to well below 100 µg/L, for influent concentrations ranging from 675 µg/L to 2 562 µg/L. Homeowners need to carefully consider the selection and operation of these types of treatment systems for iron removal, especially if they are used to concurrently remove Mn. It is also important to routinely monitor the Mn concentration in the water treated by greensand filtration to ensure that the system is working properly and not releasing Mn.
Depending on the concentration of iron in the source water and the type of treatment selected, households with a private well may want to treat water at the POE to reduce the likelihood of water discolouration and laundry staining.
4.5 Distribution system considerations
The distribution system is a hydraulically, physically, chemically and biologically dynamic system with significant implications for achieving the AO at the consumer's tap. Iron concentrations above 0.05 mg/L can lead to complaints about discoloured water, plumbing fixture and laundry staining, and general dissatisfaction with the water quality (Sommerfeld, 1999; Casale et al., 2002; Kohl and Medlar, 2006; Tobiason et al., 2008).
In some cases, iron issues at the tap are not associated with high iron concentrations in the influent water and cannot therefore be estimated by assessing iron levels at the entry to the distribution system. Rather, these elevated iron levels at the tap are the result of the release or resuspension of accumulated iron in the distribution system and the plumbing system from low but constant iron levels present in the source or treated water. The accumulated iron deposits can periodically be released because of physical or hydraulic disturbances or unstable water chemistry and can enter the distribution system water, resulting in discoloured water complaints.
The Fe(II) ions produced by iron pipe corrosion reactions may either be released in the water, or precipitate (accumulate) as a scale deposit on the corroded iron pipe. Iron release refers to the transport of iron from the metal surface or corrosion scale to the bulk water, in both soluble and particulate form. The soluble form may occur via pipe corrosion or dissolution of ferrous components of the deposit scales (Benjamin et al., 1996; Sarin, 2004a; Sarin et al., 2004b). Iron release in particulate form occurs via hydraulic scouring that resuspends iron precipitates deposited on the scale surface. The extent to which release or accumulation processes occur is a complex function of water quality (for example, DO, pH, alkalinity, conductivity, inhibitors) and hydraulic conditions (Benjamin et al., 1996; McNeill and Edwards, 2001; Sarin et al., 2004b).
"Red water" or discoloured water is a frequent complaint of consumers whose water supply comes from iron pipes, especially in the stagnant regions of the distribution system. Stagnation of the water leads to rapid depletion of oxygen and other oxidants near the corrosion scale and allows Fe(II) ions to diffuse out of the scale into the bulk water. Discoloured water is formed when iron enters the bulk water either as ferric particles or as Fe(II) ions that are oxidized to form ferric particles (Sarin, 2004a). Benjamin et al. (1996) stated that discoloured water problems are commonly caused by corrosion scale and often result from variations in water quality such as pH changes, a decrease in alkalinity and a change in dissolved inorganic carbon (DIC). Imran et al. (2005) reported that the release of discoloured water in distribution systems was caused by the release of corrosion by-products from unlined and galvanized-iron pipes.
Discoloured water should not be considered safe to consume or treated as only an aesthetic issue, since iron particles can adsorb contaminants such as As, Pb, Mn, uranium and radionuclides, and subsequently release them during discolouration episodes. While there are strategies or techniques to control discoloured water, it is important to realize that no single solution can be employed to control discoloured water.
To understand the discoloured water problem, utilities need to consider customer information, water supply system characteristics, water treatment operations and water quality and scale analyses. In addition, utilities need to determine whether the "red water" problem is chronic or acute. Acute problems can often be addressed by changing operational procedures, whereas chronic problems often require changes in water sources or treatment or rehabilitation of piping systems (Clement et al., 2002). Brandhuber and Tobiason (2018) suggested that, to avoid chronic problems, utilities should strive for an iron concentration of 0.1 mg/L in treated water. Water utilities that minimize the iron concentration entering the distribution system should also implement best practices to maintain stable chemical and biological water quality conditions throughout the system.
4.5.1 Iron corrosion and scales
Iron pipes are common in drinking water distribution systems and are typically present as cast and ductile forms (Benjamin et al., 1996; Świetlik et al., 2012; Folkman, 2018). When iron pipes are exposed to aerated or chlorinated water, metallic iron is oxidized to Fe(II) (pipes corrode). The Fe(II) ions produced by the corrosion reaction may either dissolve in the water or precipitate as a scale deposit on the corroded pipe. The interactions of corroded iron pipe surfaces with water are important because several distinct but related problems may be observed in a distribution system:
- Pipe mass is lost through the oxidation of metal iron to soluble iron species or the formation of iron-bearing scale.
- Corrosion scale can accumulate as large tubercles that increase head loss and decrease hydraulic capacity.
- The release of soluble or particulate iron to the water decreases its aesthetic quality and may lead to consumer complaints about red water.
- Iron corrosion depletes disinfectants.
- Iron corrosion scale protects biofilm.
- Iron corrosion scale influences DBP formation.
- Iron oxides adsorb and accumulate inorganic contaminants, such as As, Pb, Mn, uranium and radionuclides, which can be released into the bulk water and plumbing systems.
Iron corrosion potential is generally modelled as a function of DO concentration in the water and pH level (Benjamin et al., 1996; Revie and Uhlig, 2008). Disinfectants, such as chlorine and monochloramine, influence the redox potential of drinking water and therefore affect the iron corrosion rate (Benjamin et al., 1996; McNeill and Edwards, 2001; Sarin et al., 2004b). Although these disinfectants are effective electron acceptors, their concentrations are typically lower than the concentration of DO in the distribution system. In the pH range of drinking water (that is, 7.0–10.5) (Health Canada, 2015), DO reduction is the most important cathodic reaction that results in the oxidation of metallic iron (Sarin et al., 2004b). However, during stagnation the concentration of oxygen and/or disinfectants near the pipe wall may approach zero. Under these conditions, reduction of the hydrogen ion may occur, as well as reduction of Fe(III) to Fe(II) (see equation 1) (Benjamin et al., 1996).

Equation 1 - Text description
Equation 1 is written in chemical notation. It says two ferric hydroxide in solid form react with two hydrogen ions and two electrons to form two iron ions with a +2 charge and 4 hydroxyl ions with a negative charge.
Iron corrosion scale is a complex and heterogeneous deposit, and it is difficult to predict scale behaviour in the distribution system. Microscopy studies of iron corrosion scales have revealed three distinct structural regions: (a) a loose top surface layer; (b) a dense, shell-like layer below the top surface; and (c) a porous structure, with iron in the Fe(II) form near the pipe wall. The iron oxidation state in the scale increases with distance from the pipe wall (Clement et al., 2002; Sarin et al., 2001; Sarin et al., 2004a). Corrosion scales associated with ductile and cast-iron pipes are frequently composed of iron oxides, oxyhydroxides, hydroxycarbonates, carbonates and hydroxysulphates. Common iron mineral phases include goethite (α-FeOOH), lepidocrocite (γ-FeOOH), ferrihydrite (Fe2O3⋅H2O), siderite (FeCO3), magnetite (Fe3O4), and an assortment of mixed ferrous and ferric carbonate/sulphate/chloride compounds comprising green rusts (Schock, 2005; Dodge et al., 2002). The composition and structure of the iron scales depend on the water quality parameters (pH, alkalinity, buffer intensity, NOM, DO), physical factors such as flow patterns, and seasonal fluctuations in temperature, microbiological activity and water treatment practices such as application of corrosion inhibitors (Clement et al., 2002; Sarin et al., 2004b). Benjamin et al. (1996) investigated the corrosion of iron and steel pipes and the formation of iron scales. Low-alkalinity waters produced iron scales that were thick (~ 2–3 cm) and loose, with a dark orange-brown crust containing flecks of yellow and the tubercles could be easily scraped off. In contrast, scales that formed in waters with high levels of calcium carbonate were thin (≤ 1 mm), hard and tightly bound to the metal surface. More detailed information on iron corrosion chemistry and scale formation can be found in Benjamin et al. (1996) and Sarin et al. (2004b). Imran et al. (2005) concluded that alkalinity greater than 80 mg/L as CaCO3 had a beneficial effect on reducing red water. Therefore, it was recommended that in addition to minimizing chlorides and sulphates, alkalinity above 80 mg/L as CaCO3 should be targeted in the distribution systems.
4.5.2 Iron accumulation, release and transport in distribution systems
The reduced form of iron ions occurs naturally in groundwater supplies. Following chlorination (or another oxidative process), iron ions are oxidized to relatively insoluble hydrous ferric oxide precipitates. Without an effective solids removal process downstream, these precipitates may enter the distribution system as carryover solids. Depending on hydraulic conditions, the solids may accumulate on the surface of distribution system piping and/or in storage reservoirs (Carrière et al., 2005; U.S. EPA, 2006; Friedman et al., 2010, 2016).
The extent of loose deposit accumulation was studied in four distribution systems in three Canadian cities with a different combination of pipe material (PVC/cast iron,
cast iron/ductile iron and PVC/cast iron/ductile iron). Iron was the major fraction (32%–76%) found in the flushed deposits from all the distribution systems, followed by organic matter (14%–24%) and silico-aluminum compounds (7%–16%). The authors concluded that iron in deposits is attributable to corrosion of iron pipes and is affected by both water corrosivity and hydraulics. They also stated that the presence of organic matter was due to the high affinity of the organic matter for iron (Carrière et al., 2005).
Friedman et al. (2010) determined the elemental composition of 46 pipe specimen samples (cast iron, ductile and galvanized iron) and 26 flushed solid samples (from cast iron, cement-lined and PVC pipes). The iron levels ranged from 6.8 to 46.8 wt % for pipe specimens and from 5.1 to 43.9 wt % for flushed solids. Similarly, Peng and Korshin (2011) reported an iron level of 33.5 wt % in hydraulically flushed samples provided by a utility that relies on groundwater from multiple wells. In another detailed elemental analysis, the tubercles present on 80-year-old galvanized iron pipe and 90-year-old unlined cast iron pipe were found to be composed primarily of iron (Clement et al., 2002).
Crystalline and amorphous ferric precipitates have been shown to have a moderate-to-high sorption affinity for a variety of inorganic and radiological elements. Some studies reported that iron precipitates adsorb and accumulate continuously low concentrations of trace inorganic constituents. These precipitates can then release the adsorbed contaminants at high levels in tap water following changes in water quality, source water variability, hydraulic disturbance and/or pipe repair (Reiber and Dostal, 2000; Camara et al., 2003 Lytle et al., 2004; Schock, 2005; Deshommes, et al., 2010, 2012; Friedman et al., 2010, 2016).
Pb has a high affinity for iron deposit scale and could accumulate in the scales after years of exposure to low Pb levels in water (Schock et al., 2008; McFadden et al., 2011). McFadden et al. (2011) found that iron corrosion scales could act as a persistent source of Pb long after a full lead service line replacement occurred. Strong correlations were reported between Pb particles/colloids and iron particles detected in tap water (Hulsmann, 1990; Deshommes, et al., 2010, 2012; Friedman et al., 2010; Camara et al., 2013). Camara et al. (2013) observed that high Pb levels (> 10 µg/L) in tap water were associated with the presence of iron particulates. Another study reported that, in addition to the lead-bearing materials in the premise plumbing, particulate Pb found in tap water resulted from the adsorption of dissolved Pb onto iron deposits that formed in the lead service line and premise plumbing (including galvanized iron pipes) (Deshommes et al., 2010). It is important to consider the potential impact of leaded-iron scales because any treatment modifications leading to water quality changes could destabilize the scale and/or mobilize Pb into solution (Schock, 2005; Copeland et al., 2007).
Oxidized iron precipitates and iron corrosion scales have a high affinity for and ability to concentrate As into and on the surface of iron solids. A study was conducted to determine the elemental composition and mineralogy of hydrant flush and pipe solids. All source waters contained As (up to 69 µg/L) and iron (up to 2.5 mg/L). The As concentration of all solids ranged from 10 to 13 650 µg/g, and the main element in most solids was iron, with levels ranging from 70 to 337 mg/g for the hydrant flush solids and from 40 to 592 mg/g for pipe solids (Lytle et al., 2004). Scanlan (2003) found that over a 10-minute flushing period, concentrations in the discharge stream increased for As (from 21 to 151 μg/L), Pb (from 56 to 1 370 μg/L) and antimony (from 7.6 to 27 μg/L). Peng and Korshin (2011) reported that there was a significant association between As, chromium and vanadium and the crystalline iron oxide fractions of the corrosion scale (19.8%, 18.6% and 20.3%, respectively). Iron minerals, associated with corroding iron from drinking water mains, exhibit a strong tendency to adsorb and accumulate uranium (Dodge et al., 2002; Schock et al., 2005; Lytle et al., 2014; Stewart et al., 2015).
In a study conducted by Reiber and Dostal (2000), water samples were collected throughout the distribution system and analyzed for trace inorganic contaminants. The investigation indicated that the coloured water contained very high levels of iron (from 8 to 412 mg/L) and copper (from 8 to 300 mg/L). The analysis of pipe specimens (unlined cast iron and galvanized iron/steel) showed the presence of As, copper and Pb. The authors observed an accumulation of inorganics on the iron corrosion scales following remobilization caused by changes to the treatment process (implementation of chlorination) (Reiber and Dostal, 2000). Valentine and Stearns (1994) and Field et al. (1995) reported high concentrations of radon (222Rn) (up to 2,676 pCi/L) in samples of tap water samples. Both studies observed an increase in the concentrations of 222Rn with an increase in the distance (water ages) from the system entry points. In each case, it was identified as an accumulation of radium (226Ra) in iron pipe scale and that its alpha-decay was responsible for elevated concentrations of 222Rn in water. Although the two utilities had low levels of 226Ra in their treated water, the 226Ra concentrations in pipe scale ranged from 13 to 270 pCi/g.
4.5.3 Microbial activity and chemicals in drinking water distribution systems
Iron pipe corrosion in a distribution system supports microbial growth through several mechanisms. The oxidation of Fe(II) to Fe(III) by chlorine depletes disinfectant residuals in the distribution system and enables microbial growth (LeChevallier et al., 1993; Benjamin et al., 1996; Schwake et al., 2016). In addition, chlorine species may be consumed in iron corrosion reactions, accelerating the corrosion process (McNeill and Edwards, 2001). Free chlorine depletes faster than monochloramine by this mechanism, but both reactions are relevant on the time scales characteristic of water distribution (Frateur et al., 1999; Vikesland and Valentine, 2000). The depletion of chlorine protects both planktonic and biofilm associated bacteria (LeChevallier et al., 1990, 1993; Gibbs et al., 2004).
Iron-oxidizing bacteria may be present in drinking water biofilms. These bacteria convert Fe(II) to Fe(III), which is then deposited outside of the bacterial cells. Iron bacteria are not harmful to public health but are considered nuisance microbes since they can precipitate large quantities of iron. The precipitates can cause taste and odour problems, frothing, colour, and increased turbidity. Additionally, iron biofouling can cause reduced flow in the distribution system and lead to deterioration of distribution piping (U.S. EPA, 2006).
The relationship between iron corrosion and DBP formation is complex, and several distinct processes may be important. Due to the reaction of chlorine with (Fe(II), chlorine available to react with DBP precursors may be limited (Rossman et al., 2001). In addition, Fe(II) has been shown to degrade DBPs via reductive dehalogenation and other mechanisms (Chun et al., 2005, 2007). On the other hand, iron corrosion scale may be a source of DBP precursor. This precursor includes adsorbed NOM and extracellular polymeric substances associated with biofilm bacteria (Rossman et al., 2001; Wang et al., 2012b). Iron oxides preferentially adsorb NOM that is enriched in aromatic carbon (Korshin et al., 1999) and phenolic structures (Reckhow et al., 1990; Korshin et al., 1999). Moreover, NOM was found to be more reactive with chlorine when adsorbed to goethite (Hassan et al., 2006), one of the most common iron minerals occurring in iron scale deposits (Benjamin et al., 1996).
4.6 Residuals management
The impact of and issues related to residuals management need to be considered when evaluating and selecting any water treatment process. Most residuals produced by a water treatment plant will require treatment.
Treatment technologies may produce a variety of residuals such as backwash water, reject water/concentrate and media regeneration waste. If residuals are discharged directly to a water body or if the residuals treatment process involves a discharge to a water body, the responsible drinking water authority should be contacted to confirm the applicable requirements.
5.0 Management Strategies
All water utilities should implement a risk management approach, such as the source-to-tap or water safety plan approach, to ensure water safety (CCME, 2004; WHO, 2012, 2017). These approaches require a system assessment to characterize the source water, describe the treatment barriers that prevent or reduce contamination, identify the conditions that can result in contamination, and implement control measures. Operational monitoring is then established, and operational/management protocols, such as standard operating procedures, corrective actions and incident responses, are instituted. Compliance monitoring is put in place and other protocols to validate the water safety plan are implemented (for example, record keeping, consumer satisfaction). Operator training is also required to always ensure the effectiveness of the water safety plan (Smeets et al., 2009).
5.1 Control strategies
Control strategies for minimizing iron include the following:
- Controlling source water concentrations
- groundwater: blend multiple sources
- surface water: reservoir aeration, multiple intake depths
- Treatment for removal of iron
- multiple options (see sections 4.2 to 4.4)
- Managing legacy iron in distribution system
- Distribution system maintenance and renewal
5.1.1 Treatment
Many systems provide treatment only in response to episodes of excessive deposit buildup, discolouration or staining, and/or customer complaints. However, given the unique adsorptive affinity of iron for regulated trace inorganic and radiological contaminants, its removal can help reduce the accumulation of trace contaminants within distribution systems and thus reduce public health risks associated with intermittent release events. Additionally, the removal of iron facilitates Mn removal, thereby reducing public health risks related to Mn. It is also important to provide drinking water with minimal discolouration, as consumers may seek alternative sources that are less safe. Therefore, utilities should strive to remove iron to meet the proposed AO prior to distribution to minimize discoloured water complaints and improve consumer confidence in drinking water quality.
5.1.2 Distribution system
Options to limit the negative impacts of iron release and precipitation in the distribution system include the following:
- Selecting pipe material
- Producing non-aggressive water quality with stable water chemistry that will be maintained throughout the distribution system
- Limiting and removing deposit accumulation using regular flushing and mechanical cleaning
- Reducing the concentrations of iron and other trace contaminants entering the water distribution system
5.2 Monitoring
5.2.1 Source water characterization
Iron concentrations in a source of water can vary seasonally or vary from source to source. The dissolved iron in some deep lakes and reservoirs may be due to stratification, which can create anaerobic conditions in the bottom water zone and cause the dissolution of iron from bottom deposits. The dissolved iron species are subsequently dispersed into the general water body by the annual overturn. Reservoirs can periodically experience episodes where anaerobic conditions are present in the bottom layer of the impoundment and excessive levels of soluble iron are released into the water column.
Water sources should be characterized to determine the concentration and form of iron in the source water. It is recommended that groundwater be sampled every 6 months. Surface water should be sampled 4 times a year, with more frequent sampling during periods when high levels of iron are most likely to be present in surface waters, such as during thermal stratification in the summer and lake turnover in the fall. The frequency of monitoring for iron may be increased if iron levels have been highly variable or decreased if they have been very low. It is also worth noting that iron and Mn often co-occur in source water and can also cause water discolouration. Therefore, it is recommended that utilities determine if Mn is also present in the source water.
5.2.2 Treatment
Utilities that treat their water to remove iron will need to conduct frequent monitoring of raw and treated water to make necessary process adjustments and to ensure that treatment processes are effectively removing iron to concentrations below the proposed AO. The frequency of monitoring of finished water will depend on historical knowledge of iron fluctuations in the raw water and on the type of treatment processes in place. For example, surface water treatment plants where iron concentrations fluctuate, and oxidation and filtration are used for treatment, may need to monitor daily. Monitoring within the treatment plant, at key treatment steps, may be needed if a utility is having difficulty controlling iron concentrations in the treated water. Appropriate filtration should be conducted on a portion of samples collected, to determine the particulate and dissolved iron components. This is important for determining the type of treatment needed and for assessing treatment plant performance.
Utilities that experience difficulties controlling iron in treated water, and that use potassium permanganate, chlorine dioxide or ozone to directly oxidize iron, may also consider quantifying the colloidal iron fraction of selected samples within the treatment train. In many cases, process monitoring within a treatment plant can be conducted using colorimetric methods to reduce analytical costs.
5.2.3 Distribution system
Since iron can accumulate and be released in distribution systems, monitoring should be conducted at a variety of locations in systems where iron is or was historically present in the source water or in the distribution or plumbing systems (that is, cast iron or galvanized iron pipes). This will help ensure that operations and maintenance are maintaining iron concentrations below the proposed AO in the distribution system. Total iron in drinking water should also be monitored at the tap when discolouration (coloured water) events occur to determine if concentrations exceed the proposed AO.
Iron releases tend to be sporadic events, making it difficult to establish a routine monitoring program to effectively detect iron in tap water resulting from iron release within the distribution system. For particulate iron, turbidity could be an effective and easily implemented method for monitoring because turbidity can serve as a proxy for total iron concentration in many water systems (Imran et al., 2005; Boxall and Saul, 2005; Burlingame et al. 2006; Mutoti et al. 2007a,b; Dietrich, 2015).
The change in apparent colour may also be used as a surrogate for total iron in a monitoring program. Total iron in particulate form has been shown to have a strong correlation with apparent colour. Apparent colour is easy to analyze on a regular basis on-site using a spectrophotometer (Imran et al. 2005).
Additionally, risk factors associated with distribution system iron accumulation and release could be used as indicators of when (that is, event-based) and where to monitor for iron releases. Event-based monitoring may be needed in circumstances where the risk of release is increased, such as following any hydraulic disturbances to the system, such as main breaks or hydrant flushing, or changes in water chemistry, such as changes in pH, temperature, source water type or uncontrolled source water blending, chlorine residual, or uncontrolled disinfectant blending.
Distribution system sampling locations should ideally be located where there are increased risk factors for iron release (for example, areas known to have corroded/tuberculated pipes, pipe materials, biofilm) and event-based release risk factors. Monitoring should also be conducted during any discoloured water event. However, the absence of discoloured water should not be interpreted as the absence of an iron release. Monitoring for iron should be done in conjunction with other metals that can co-occur in the distribution system and have been shown to be released with iron (for example, As, Pb, Mn). Utilities that undertake preventive measures with stable hydraulic, physical and water quality conditions and have baseline data indicating that iron is minimal or does not occur in the system may conduct less frequent monitoring.
5.2.4 Residential
Homeowners with private wells using residential treatment devices should conduct routine testing on both the water entering the treatment device and the treated water to verify that the treatment device is working properly.
6.0 International considerations
Other national and international organizations have drinking water guidelines, standards and/or guidance values for iron in drinking water. Variations in these values can be attributed to the age of the assessments or differences in policies and approaches, including the choice of key study.
| Agency (Year) | Value (mg/L) |
|---|---|
| Health Canada – proposed guideline values (2023) | AO ≤ 0.1 |
| U.S. EPAFootnote a | SMCL = 0.3 |
| WHO (2003; affirmed 2004 and 2011)Footnote b | None specified |
| Australia (1996, 2011; updated 2018) | AO ≤ 0.3 |
| European Commission (2017, 2020)Footnote c | 0.2 |
AO – aesthetic objective; SMCL– secondary maximum contaminant level.
- Footnote a
-
Available at https://www.epa.gov/sdwa/secondary-drinking-water-standards-guidance-nuisance-chemicals. The U.S. EPA has also established a provisional subchronic and chronic reference dose of 0.7 mg/kg bw per day based on adverse gastrointestinal effects, using the same key study as IOM (U.S. EPA, 2006).
- Footnote b
-
Using a provisional maximum tolerable daily intake of 0.8 mg/kg bw, based on a non-specified effect, established by JECFA in 1983, WHO (2003) mentioned that "a DW value of about 2 mg/L can be derived, which does not present a hazard to health". The JECFA value was established as a precaution against storage of excessive iron in the body.
- Footnote c
-
Indicator parameter value, for operational monitoring and consumer acceptability (EU, 2020). This value is based on WHO (2003).
7.0 Rationale
Iron is a metal that is ubiquitous in the environment. It is primarily mined to make steel, with other uses included in a variety of industrial, commercial, and consumer product applications. Although food is the main source of the exposure of Canadians to iron, iron may also be present in water from natural sources, such as rock and soil weathering, or pipe materials in the distribution system. Iron is more prevalent in groundwaters than in surface waters. Iron may also be in drinking water because of the release of corrosion by-products from cast iron and galvanized pipes. It can cause discolouration, laundry staining and taste issues. Nonheme iron is the form of iron found in drinking water, with Fe(II) and Fe(III) ions being the most prevalent species.
Iron is an essential element for almost all living organisms. As such, nonheme iron in drinking water is not expected to cause significant systemic health effects in healthy individuals including pregnant women and bottle-fed infants, due to homeostasis. Current evidence indicates that nonheme iron is neither genotoxic, carcinogenic nor a repro-developmental toxicant when administered by the oral route. However, due to its pro-oxidative properties, at very high levels the metal may cause damage to many organ systems, with the GI tract being the most sensitive. Supplementation of adults with oral doses of 60 mg nonheme Fe/day or higher resulted in significant GI distress (Frykman et al. 1994). A UL of 45 mg per day for total intake of iron has been established (Health Canada, 2010; IOM 2001).
Health Canada, in collaboration with the Federal-Provincial-Territorial Committee on Drinking Water, is proposing an aesthetic objective (AO) of 0.1 mg (100 µg/L) for total iron in drinking water. The proposed AO can be reliably measured by available analytical methods and achieved by treatment. However, iron at low concentrations can cause operational and aesthetic issues in the treatment plant and distribution system, as well as discolouration of water and staining of fixtures and laundry. The proposed AO is established at a level that will do the following:
- reduce consumer complaints about discoloured water, staining of laundry and taste
- increase disinfectant residual stability when iron levels are controlled
- minimize excessive deposit buildup in the distribution system
- aid in the removal of co-occurring Mn
- reduce the public health risks associated with intermittent release events where iron has adsorbed trace amounts of inorganic and radiological contaminants that are themselves health hazards
- be measurable by available analytical methods and achievable by commonly available technologies
Based on the noted considerations, an AO of ≤ 0.1 mg/L for total iron is proposed. As part of its ongoing guideline review process, Health Canada will continue to monitor new research in this area and recommend any changes to this guideline technical document that are deemed necessary.
References
- Agrawal, S., Berggren, K.L., Marks, E. and Fox, J.H. (2017). Impact of high iron intake on cognition and neurodegeneration in humans and in animal models: A systematic review. Nutr. Rev., 75(6): 456–470.
- Ahmad, A., van der Wal, A., Bhattacharya, P., van Genuchten, C. (2019). Characteristics of Fe and Mn bearing precipitates generated by Fe(II) and Mn(II) co-oxidation with O2, MnO4 and HOCl in the presence of groundwater ions. J. Water Res., 161: 505–516.
- Alissa, E.M., Ahmed, W.H., Al-ama, N. and Ferns, G.A.A. (2007). Relationship between indices of iron status and coronary risk factors including diabetes and the metabolic syndrome in Saudi subjects without overt coronary disease. Journal of Trace Elements in Medicine and Biology, 21(4): 242–254.
- APHA, AWWA and WEF. (2017). Standard methods for the examination of water and wastewater. 23rd Ed. (online version). Standard methods for the examination of water and wastewater. American Public Health Association. Available at https://www.standardmethods.org/
- Anderson, G.J. and Frazer, D.M. (2017). Current understanding of iron homeostasis. Am. J. Clin. Nutr., 106(Suppl 6): 1559S-1566S.
- Andrews, N.C. and Schmidt, P.J. (2007). Iron homeostasis. Annu. Rev. Physiol., 69: 69–85.
- Appel, M.J., Kuper, C.F. and Woutersen, R.A. (2001). Disposition, accumulation and toxicity of iron fed as iron (II) sulfate or as sodium iron EDTA in rats. Food Chem. Toxicol., 39(3): 261–269.
- Asare, G.A., Paterson, A.C., Kew, M.C., Khan, S. and Mossanda, K.S. (2006). Iron-free neoplastic nodules and hepatocellular carcinoma without cirrhosis in wistar rats fed a diet high in iron. J. Pathol., 208(1): 82–90.
- Ashmore, J.H., Rogers, C.J., Kelleher, S.L., Lesko, S.M. and Hartman, T.J. (2016). Dietary iron and colorectal cancer risk: A review of human population studies. Crit. Rev. Food Sci. Nutr., 56(6): 1012–1020.
- AWWA (2005). Microfiltration and ultrafiltration membranes for drinking water. Manual for water supply practices M53. American Water Works Association. First edition.
- Bacon, B.R., Park, C.H., Brittenham, G.M., O-Neill, R. and Tavill, A.S. (1985). Hepatic mitochondrial oxidative metabolism in rats with chronic dietary iron overload. Hepatology, 5(5): 789–797.
- Bao, W., Rong, Y., Rong, S. and Liu, L. (2012). Dietary iron intake, body iron stores, and the risk of type 2 diabetes: A systematic review and meta-analysis. BMC Med., 10: 119-7015-10–119.
- Barbeau, B., Carrière, A., and Bouchard, M. (2011). Spatial and temporal variations in manganese concentrations in drinking water. J. Environ. Sci. Health A Tox. Hazard. Subst. Environ. Eng., 46(6): 608–616.
- Bastide, N.M., Pierre, F.H.F. and Corpet, D.E. (2011). Heme iron from meat and risk of colorectal cancer: A meta-analysis and a review of the mechanisms involved. Cancer Prev. Res. (Phila), 4(2): 177.
- Bateman, D.N., Eagling, V., Sandilands, E.A., Jackson, G., Crawford, C., Hawkins, L., Cheung, T., Cooper, G., Bradberry, S.M., Thompson, J.P., Thomas, S.H.L. and Eddleston, M. (2018). Iron overdose epidemiology, clinical features and iron concentration-effect relationships: The UK experience 2008-2017. Clin. Toxicol. (Phila), 56(11): 1098–1106.
- Beguin, Y., Aapro, M., Ludwig, H., Mizzen, L. and Österborg, A. (2014). Epidemiological and nonclinical studies investigating effects of iron in carcinogenesis—A critical review. Crit. Rev. Oncol., 89(1): 1–15.
- Benefield, L.D. and Morgan, J.M. (1990) Chemical Precipitation. Water Quality and Treatment, F.W. Pontius, editor, 4th ed., McGraw-Hill, New York.
- Benjamin, M.M., Sontheimer, H., and Leroy, P. (1996) Corrosion of iron and steel. In Internal corrosion of water distribution systems. 2nd edition. American Water Works Association Research Foundation and DVGW Technologiezentrum Wasser, Denver, CO. p. 46.
- Bialkowski, W., Bryant, B.J., Schlumpf, K.S., Wright, D.J., Birch, R., Kiss, J.E., D'Andrea, P., Cable, R.G., Spencer, B.R., Vij, V. and Mast, A.E. (2015). The strategies to reduce iron deficiency in blood donors randomized trial: Design, enrolment and early retention. Vox Sang., 108(2): 178–185.
- Bloomer, S.A. and Brown, K.E. (2019). Iron-induced liver injury: A critical reappraisal. Int. J. Mol. Sci., 20(9): 10.3390/ijms20092132.
- Boxall, J.B. and Saul, A.J. (2005). Modeling Discoloration in Potable Water Distribution Systems. Jour. Environ. Eng., 131(5).
- Brabin, B., Gies, S., Roberts, S.A., Diallo, S., Lompo, O.M., Kazienga, A., Brabin, L., Ouedraogo, S. and Tinto, H. (2019). Excess risk of preterm birth with periconceptional iron supplementation in a malaria endemic area: Analysis of secondary data on birth outcomes in a double blind randomized controlled safety trial in Burkina Faso. Malaria Journal, 18(1): 161.
- Brandhuber, P., Clark, S., Knocke, W. and Tobiason, J. (2013). Guidance for the treatment of manganese. Water Research Foundation, Denver, Colorado.
- Brandhuber, P. and Tobiason, J. (2018). Iron and manganese control. 15th Annual EPA Drinking Water Workshop Small Systems Challenges and Solutions. Cincinnati, OH, August 31, 2018 Hands-On Training Session.
- British Columbia Ministry of Health (2019). Personal communication with D. Fishwick.
- Brodeur, M.E. and Barbeau, B. (2015). Performance of point-of-use and point-of-entry technologies for the removal of manganese in drinking water: Summary of the EDU-MANGO Epidemiological Study. Report prepared for and available on request from Health Canada.
- Burger, M.S., Krentz, C.A., Mercer, S.S. and Gagnon, G.A. (2008). Manganese removal and occurrence of manganese oxidizing bacteria in full-scale biofilters. J. Water Supply Res. Technol. Aqua., 57(5), 351–359.
- Camara, E., Montreuil, K.R., Knowles, A.K. and Gagnon, G.A. (2013). Role of the water main in lead service line replacement: A utility case study. J. Am. Water Works Assoc., 105(8): E423-E431.
- Cancelo-Hidalgo, M., Castelo-Branco, C., Palacios, S., Haya-Palazuelos, J., Ciria-Recasens, M., Manasanch, J. and Pérez-Edo, L. (2013). Tolerability of different oral iron supplements: A systematic review. Curr. Med. Res. Opin., 29(4): 291–303.
- Carrière, A., Gauthier, V., Desjardins, R. and Barbeau, B. (2005). Evaluation of loose deposits in distribution systems through unidirectional flushing. J. Am. Water Works Assoc., 97(9), 82–92.
- Casale, R.J., LeChevallier, M.W. and Pontius, F.W. (2002). Manganese control and related issues. AWWARF and American Water Works Association. Denver, Colorado.
- CCME (2004). From source to tap: Guidance on the multi-barrier approach to safe drinking water. Canadian Council of Ministers of the Environment, Winnipeg, Manitoba.
- Chan, A.T., Ma, J., Tranah, G.J., Giovannucci, E.L., Rifai, N., Hunter, D.J. and Fuchs, C.S. (2005). Hemochromatosis gene mutations, body iron stores, dietary iron, and risk of colorectal adenoma in women. J. Natl. Cancer Inst., 97(12): 917–926.
- Chang, T.P. and Rangan, C. (2011). Iron poisoning: A literature-based review of epidemiology, diagnosis, and management. Pediatr. Emerg. Care, 27(10): 978–985.
- Chang, V.C., Cotterchio, M. and Khoo, E. (2019). Iron intake, body iron status, and risk of breast cancer: A systematic review and meta-analysis. BMC Cancer, 19(1): 543.
- Chen, P., Totten, M., Zhang, Z., Bucinca, H., Erikson, K., Santamaría, A., Bowman, A.B. and Aschner, M. (2019). Iron and manganese-related CNS toxicity: Mechanisms, diagnosis and treatment. 19(3): 243–260.
- Chen, W.H., Hsieh, Y.H., Wu, C.C., Wan, M.W., Futalan, C.M. and Kan, C.C. (2011) The on-site feasibility study of iron and manganese removal from groundwater by hollow-fiber microfiltration. J. Water Supply Res. Technol. Aqua., 60(6): 391.
- Cheng, L.H.,Xiong, X.X.,Cai, S., Li, D.W. and Xu, Z.H. (2020). Aeration-manganese sand filter-ultrafiltration to remove iron and manganese from water: Oxidation effect and fouling behavior of manganese sand coated film. J. Water Proc. Eng., 38:101621.
- Ching, D., Mews, C., Crompton, C., Ravikumar, M. and Abeysuriya, D. (2019). Iron pill-induced gastritis in the paediatric population. Case Rep. Pediatr., 2019: 7527608.
- Choo, K., Lee, H. and Choi, S. (2005). Iron and manganese removal and membrane fouling during UF in conjunction with prechlorination for drinking water treatment. J. Membr. Sci., 267(1-2): 18–26.
- Chua, A.C.G., Knuiman, M.W., Trinder, D., Divitini, M.L. and Olynyk, J.K. (2016). Higher concentrations of serum iron and transferrin saturation but not serum ferritin are associated with cancer outcomes. Am. J. Clin. Nutr., 104(3): 736–742.
- Cimino-Mathews, A., Broman, J.H., Westra, W.H. and Illei, P.B. (2010). Iron pill-induced tumefactive mucosal injury of the hypopharynx. Am. J. Surg. Pathol., 34(11): 1720–1722.
- Civardi, J. and Tompeck, M. (2015). Iron and Manganese Removal Handbook. Second Edition. American Water Works Association.
- Clement, J., Hayes, M., Sarin, P., Kriven, W.M., Bebee, J., Jim, K., Backett, M., Snoeyink, V.L., J. Kirmeyer, G.J. and Pierson, G. (2002). Development of Red Water Control Strategies. Publication No. 90883. AWWARF and American Water Works Association. Denver, Colorado.
- Collard, K.J. (2009). Iron homeostasis in the neonate. Pediatrics, 123(4): 1208–1216.
- Collings, R., Harvey, L.J., Hooper, L., Hurst, R., Brown, T.J., Ansett, J., King, M. and Fairweather-Tait, S.J. (2013). The absorption of iron from whole diets: A systematic review. Am. J. Clin. Nutr., 98(1): 65–81.
- Constante, M., Fragoso, G., Lupien-Meilleur, J., Calvé, A. and Santos, M.M. (2017). Iron supplements modulate colon microbiota composition and potentiate the protective effects of probiotics in dextran sodium sulfate-induced colitis. Inflamm. Bowel Dis., 23(5): 753–766.
- Cook, M.B., Kamangar, F., Weinstein, S.J., Albanes, D., Virtamo, J., Taylor, P.R., Abnet, C.C., Wood, R.J., Petty, G., Cross, A.J. and Dawsey, S.M. (2012). Iron in relation to gastric cancer in the alpha-tocopherol, beta-carotene cancer prevention study. Cancer Epidemiol. Biomarkers Prev., 21(11): 2033.
- Cooper, M., Greene-Finestone, L., Lowell, H., Levesque, J. and Robinson, S. (2012). Iron sufficiency of Canadians. Health Rep., 23(4): 41–48.
- Copeland, R.C., Lytle, D.A. and Dionysious, D.D. (2007). Desorption of arsenic from drinking water distribution system solids. Environ. Monit. Assess., 127: 523.Cornwell, D.A., and Lee, R. (1993). Recycle Stream Effects on Water Treatment. AWWARF and American Water Works Association, Denver.
- Cornwell, D.A. and Lee, R. (1994). Waste Stream Recycling: Its Effects on Water Quality. J. Am. Water Works Assoc., 86:11:50.
- Cromley, J.T. and O'Connor, J.T. (1976). Effect of ozonation on the removal of iron from a groundwater. J. Am. Water Works Assoc., 68(6): 315.
- Czerwonka, M. and Tokarz, A. (2017). Iron in red meat–friend or foe. Meat Sci., 123: 157–165.
- Danesh, J. and Appleby, P. (1999). Coronary heart disease and iron status. Circulation, 99(7): 852–854.
- Das De, S., Krishna, S. and Jethwa, A. (2015). Iron status and its association with coronary heart disease: Systematic review and meta-analysis of prospective studies. Atherosclerosis, 238(2): 296–303.
- Dawsey, S.P., Hollenbeck, A., Schatzkin, A. and Abnet, C.C. (2014). A prospective study of vitamin and mineral supplement use and the risk of upper gastrointestinal cancers. PLoS One, 9(2): e88774-e88774.
- Deshommes, E., Laroche, L., Nour, S., Cartier, C. and Prévost, M. (2010). Source and Occurrence of Particulate Lead in Tap Water. Water Res.,44:12:3734.
- Deshommes, E., Nour. S., Richer., B., Cartier, C. and Prévost, M. (2012). POU devices in large buildings: lead removal and water quality. J. Am. Water Works Assoc., E282-E297.
- de Valk, B. and Marx, J.J.M. (1999). Iron, Atherosclerosis, and Ischemic Heart Disease. Arch. Intern. Med. 159(14): 1542–1548.
- Diallo, A., Deschasaux, M., Partula, V., Latino-Martel, P., Srour, B., Hercberg, S., Galan, P., Fassier, P., Guéraud, F., Pierre, F.H. and Touvier, M. (2016). Dietary iron intake and breast cancer risk: Modulation by an antioxidant supplementation. Oncotarget, 7(48): 79008–79016.
- Dietrich, A.M. (2015). USEPA Secondary Maximum Contaminant Limits: A Strategy for Drinking Water Quality and Consumer Acceptability (Project No. 4537). Water Research Foundation, Denver, Colorado.
- Dietrich, A.M. and Burlingame, G.A. (2015). Critical review and rethinking of USEPA secondary standards for maintaining organoleptic quality of drinking water. Environ. Sci. Technol., 49:708-20. PMID 25517292 DOI: 10.1021/Es504403T
- Ding, H., Zhao, Y., Yu, X., Chen, L., Han, J. and Feng, J. (2021). Tolerable upper intake level of iron damages the liver of weaned piglets. J. Anim. Physiol. Anim. Nutr. (Berl), 105(4): 668–677.
- Dodge, D.J., Francis, A.J., Gillow, J.B., Halada, G.P. and Clayton, C.R. (2002). Association of Uranium with Iron Oxides Typically Formed on Corroding Steel Surfaces. Environ. Sci. Technol., 36:3504.
- Domellof, M. (2007). Iron requirements, absorption and metabolism in infancy and childhood. Curr. Opin. Clin. Nutr. Metab. Care, 10(3): 329–335.
- Dongiovanni, P., Ruscica, M., Rametta, R., Recalcati, S., Steffani, L., Gatti, S., Girelli, D., Cairo, G., Magni, P., Fargion, S. and Valenti, L. (2013). Dietary iron overload induces visceral adipose tissue insulin resistance. Am. J. Pathol., 182(6): 2254–2263.
- Dostal, A., Baumgartner, J., Riesen, N., Chassard, C., Smuts, C.M., Zimmermann, M.B. and Lacroix, C. (2014). Effects of iron supplementation on dominant bacterial groups in the gut, faecal SCFA and gut inflammation: A randomised, placebo-controlled intervention trial in South African children. Br. J. Nutr., 112(4): 547–556.
- Duranceau, S.J. (2001). Membrane practices for water treatment. First edition. American Water Works Association, Denver, Colorado.
- Dunn, L.L., Suryo Rahmanto, Y. and Richardson, D.R. (2007). Iron uptake and metabolism in the new millennium. Trends Cell Biol., 17(2): 93–100.
- Earle, M., Breda, I.L., Stoddart, A.K. and Gagnon, G.A. (2020). Predicting manganese and iron precipitation in drinking water biofilters. AWWA Water Sci., 3(1): e1216 https://doi.org/10.1002/aws2.1216
- ECCC (2019). Canadian Environmental Protection Act, 1999. Federal Environmental Quality Guidelines - Iron. Draft for public comment. Environment and Climate Change Canada. Government of Canada.
- ECHA (2020). REACH registration dossier for hydronium;iron(3+);hexahydroxide;disulfate. EC number: 940-441-4. Last updated November 11, 2020. European Chemical Agency, https://echa.europa.eu/brief-profile/-/briefprofile/100.232.301.
- EFSA (2004). Opinion of the scientific panel on dietetic products, nutrition and allergies [NDA] related to the tolerable upper intake level of iron. European Food Safety Authority. EFSA Journal, 2(11): 125.
- EFSA (2015). Scientific opinion on dietary reference values for iron. EFSA Panel on dietetic products, nutrition and allergies (NDA). European Food Safety Authority. EFSA Journal, 13(10): 4254.
- EU (2020). Proposal for a directive of the European parliament and the council on the quality of water intended for human consumption (recast) - outcome of proceedings. Council of the European Union. European Union, 2017/0332(COD), Brussels.
- Fakhfekh, R., Chabanon, E., Mangin, D., Amar, R.B. and Charcosset, C. (2017). Removal of iron using an oxidation and ceramic microfiltration hybrid process for drinking water treatment. Desalin. Water Treat., 66: 210-220.
- Fang, S., Zhuo, Z., Yu, X., Wang, H. and Feng, J. (2018b). Oral administration of liquid iron preparation containing excess iron induces intestine and liver injury, impairs intestinal barrier function and alters the gut microbiota in rats. J. Trace Elem. Med. Biol., 47: 12–20.
- Field R.W., Fisher E.L., Valentine, R.L. and Kross, B.C. (1995). Radium-bearing pipe scale deposits—implications for national waterborne radon sampling methods. Am J. Public Health. 85(4):567–70.
- Fonseca-Nunes, A., Jakszyn, P. and Agudo, A. (2014). Iron and cancer risk—A systematic review and meta-analysis of the epidemiological evidence. Cancer Epidemiol. Biomarkers Prev., 23(1): 12.
- Folkman, S. (2018). Water main break rates in the USA and Canada: A comprehensive study. Utah State University Buried Structures Laboratory, Logan, UT.
- Frateur, I., Deslouis, C., Kiene, L., Levi, Y. and Tribollet, B. (1999). Free chlorine consumption induced by cast iron corrosion in drinking water distribution systems. Water Res., 33(8): 1781–1790.
- Friedman, M.J., Hill, A.S., Reiber, S.H., Valentine, R.L., Larsen, G., Young, A., Korshin, G.V. and Peng, C-Y. (2010). Assessment of inorganics accumulation in drinking water system scales and sediments. Water Research Foundation and United States Environmental Protection Agency, Denver, Colorado.
- Friedman, M.J., Hill, A., Booth, S., Hallett, M., McNeill, L., McLean, J., Stevens, D., Sorensen, D., Hammer, T., Kent, W., De Haan, M., MacArthur, K. and Mitchell, K. (2016). Metals accumulation and release within the distribution system: evaluation and mitigation. Water Research Foundation and United States Environmental Protection Agency, Denver, Colorado.
- Frykman, E., Bystrom, M., Jansson, U., Edberg, A. and Hansen, T. (1994). Side effects of iron supplements in blood donors: Superior tolerance of heme iron. J. Lab. Clin. Med., 123(4): 561–564.
- Gahagan, S., Delker, E., Blanco, E., Burrows, R. and Lozoff, B. (2019). Randomized controlled trial of iron-fortified versus low-iron infant formula: Developmental outcomes at 16 years. J. Pediatr., 212: 124–130.e1.
- Geisser, P. and Burckhardt, S. (2011). The pharmacokinetics and pharmacodynamics of iron preparations. Pharmaceutics, 3(1): 12-33.
- Geldreich E.E. and LeChevallier, M.W. (1999). Microbial quality control in distribution systems. In: R. D. Letterman, Ed., Water Quality and Treatment: A Handbook of Community Water Samples, 5th Edition, McGraw-Hill, New York, 1999, pp. 1–18,49.
- Gibbs, S.G., Meckes, M.C., Green, C.F. and Scarpino, P.V (2004). Evaluation of the ability of chlorine to inactivate selected organisms from the biofilm of a drinking water distribution system simulator following a long-term wastewater cross connection. J. Environ. Eng. Sci. 3: 97–105.
- Gies, S., Diallo, S., Roberts, S.A., Kazienga, A., Powney, M., Brabin, L., Ouedraogo, S., Swinkels, D.W., Geurts-Moespot, A., Claeys, Y., D'Alessandro, U., Tinto, H., Faragher, B. and Brabin, B. (2018). Effects of weekly iron and folic acid supplements on malaria risk in nulliparous women in Burkina Faso: A periconceptional, double-blind, randomized controlled noninferiority trial. J. Infect. Dis., 218(7): 1099–1109.
- Gill, D., Del Greco, M.F., Walker, A.P., Srai, S.K.S., Laffan, M.A. and Minelli, C. (2017). The effect of iron status on risk of coronary artery disease. Arterioscler. Thromb. Vasc. Biol., 37(9): 1788–1792.
- Ginzburg, Y.Z. and Vinchi, F. (2019). Chapter 72 - iron overload. In Transfusion medicine and hemostasis (third edition). Shaz, B.H., Hillyer, C.D. and Reyes Gil, M. (eds.). Elsevier, pp. 433-436. eBook ISBN: 9780128137277
- Haig, A. and Driman, D.K. (2006). Iron-induced mucosal injury to the upper gastrointestinal tract. Histopathology, 48(7): 808–812.
- Hamann, C.L., McEwen, J.B. and Myers, A.G.. 1990. Guide to selection of water treatment processes, p. 157–187. In F.W. Pontius (ed.), Water quality and treatment. AWWA, McGraw-Hill, Inc., Toronto.
- Hare, D.J., Cardoso, B.R., Szymlek-Gay, E.A. and Biggs, B. (2018). Neurological effects of iron supplementation in infancy: Finding the balance between health and harm in iron-replete infants. The Lancet Child & Adolescent Health, 2(2): 144–156.
- Hashash, J.G., Proksell, S., Kuan, S.F. and Behari, J. (2013). Iron pill-induced gastritis. ACG Case Rep. J., 1(1): 13–15.
- Hayflick, S.J. and Hogarth, P. (2011). As iron goes, so goes disease? Haematologica, 96(11): 1571–1572.
- Health Canada (2008). Guidelines for Canadian drinking water quality: Guideline technical document—Chlorite and chlorate. Water, Air and Climate Change Bureau, Healthy Environments and Consumer Safety Branch, Health Canada, Ottawa, Ontario.
- Health Canada (2009). Prenatal nutrition guidelines for health professionals - iron. Government of Canada.
- Health Canada (2010). Dietary reference intakes tables. Government of Canada. Available at https://www.canada.ca/en/health-canada/services/food-nutrition/healthy-eating/dietary-reference-intakes/tables.html
- Health Canada (2017). Iron (present as ferric phosphate) and its associated end-use products. Consultation document. Proposed re-evaluation decision. Pest Management Regulatory Agency. PRVD2017-21.
- Health Canada (2018). Iron (present as ferric phosphate) and its associated end-use products. Final decision. Re-evaluation decision. Pest Management Regulatory Agency. RVD2018-23.
- Health Canada (2017). Personal communication with Anca-Maria Tugulea, Environmental and Health Sciences Research Bureau.
- Health Canada (2019a). Guidelines for Canadian drinking water quality: Guideline technical document-Lead. Water, Air and Climate Change Bureau, Healthy Environments and Consumer Safety Branch, Health Canada, Ottawa, Ontario. Available at https://www.canada.ca/content/dam/hc-sc/documents/services/publications/healthy-living/guidelines-canadian-drinking-water-quality-guideline-technical-document-lead/guidance-document/guidance-document.pdf.
- Health Canada (2019b). Guidelines for Canadian drinking water quality: Guideline technical document-Manganese. Water, Air and Climate Change Bureau, Healthy Environments and Consumer Safety Branch, Health Canada, Ottawa, Ontario. Available at https://www.canada.ca/content/dam/hc-sc/documents/services/publications/healthy-living/guidelines-canadian-drinking-water-quality-guideline-technical-document-manganese/pub-manganese-0212-2019-eng.pdf
- Health Canada (2021). Canadian exposure factors used in human health risk assessments. Fact Sheet. Health Canada, Ottawa, Ontario. Available at https://www.canada.ca/en/health-canada/services/chemical-substances/fact-sheets/canadian-exposure-factors-human-health-risk-assessments.html
- Health Canada (2022). Guidelines for Canadian drinking water quality: Draft guidance on sampling and mitigation measures for controlling corrosion. Water and Air Quality Bureau, Healthy Environments and Consumer Safety Branch, Health Canada, Ottawa, Ontario.
- Hercberg, S., Estaquio, C., Czernichow, S., Mennen, L., Noisette, N., Bertrais, S., Renversez, J., Briançon, S., Favier, A. and Galan, P. (2005). Iron status and risk of cancers in the SU.VI.MAX cohort. J. Nutr., 135(11): 2664-2668.
- Hem J.D. (1960) Complexes of ferrous iron with tannic acid. Geological Survey Water-Supply Paper # 1459D.
- Hiiob, M. and Karro, E. (2012). Iron in the Middle Devonian aquifer system and its removal at Yõru County water treatment plants, Estonia [raud kesk-devoni põhjaveekompleksis ja selle ärastus võrumaa veepuhastussüsteemide näitel]. Estonian Journal of Earth Sciences, 61(3): 181–190.
- Hoffmann, A., Haschka, D., Valente de Souza, L., Tymoszuk, P., Seifert, M., von Raffay, L., Hilbe, R., Petzer, V., Moser, P.L., Nairz, M. and Weiss, G. (2021). Baseline iron status and presence of anaemia determine the course of systemic salmonella infection following oral iron supplementation in mice. Ebiomedicine, 71: 103568.
- Hunnicutt, J., He, K. and Xun, P. (2014). Dietary iron intake and body iron stores are associated with risk of coronary heart disease in a meta-analysis of prospective cohort studies. J. Nutr., 144(3): 359–366.
- Hulsmann, A.D. (1990). Particulate lead in water supplies. Water and Environment Journal, 4(1): 19–25.
- Iannotti, L.L., Tielsch, J.M., Black, M.M. and Black, R.E. (2006). Iron supplementation in early childhood: Health benefits and risks. Am. J. Clin. Nutr., 84(6): 1261–1276.
- Iglesias, L., Canals, J. and Arija, V. (2018). Effects of prenatal iron status on child neurodevelopment and behavior: A systematic review. Crit. Rev. Food Sci. Nutr., 58(10): 1604–1614.
- Imran, S.A., Dietz, J.D., Mutoti, G., Taylor, J., Randall, A.A. and Cooper, C.D. (2005). Red water release in drinking water distribution systems. J. Am. Water Works Assoc., 97(9), 93–100.
- Inai, K., Fujihara, M., Yonehara, S. and Kobuke, T. (1994). Tumorigenicity study of ferric citrate administered orally to mice. Food Chem. Toxicol., 32(6): 493–498.
- IOM (2001). Dietary reference intakes for vitamin A, vitamin K, arsenic, boron, chromium, copper, iodine, iron, manganese, molybdenum, nickel, silicon, vanadium, and zinc. Food and Nutrition Board, Institute of Medicine. National Academy Press, Washington, DC, USA, 797 pp.
- Jaeggi, T., Kortman, G.A., Moretti, D., Chassard, C., Holding, P., Dostal, A., Boekhorst, J., Timmerman, H.M., Swinkels, D.W., Tjalsma, H., Njenga, J., Mwangi, A., Kvalsvig, J., Lacroix, C. and Zimmermann, M.B. (2015). Iron fortification adversely affects the gut microbiome, increases pathogen abundance and induces intestinal inflammation in Kenyan infants. Gut, 64(5): 731–742.
- Jiang, R., Ma, J., Ascherio, A., Stampfer, M.J., Willett, W.C. and Hu, F.B. (2004a). Dietary iron intake and blood donations in relation to risk of type 2 diabetes in men: A prospective cohort study. Am. J. Clin. Nutr., 79(1): 70–75.
- Jiang, R., Manson, J.E., Meigs, J.B., Ma, J., Rifai, N. and Hu, F.B. (2004b). Body iron stores in relation to risk of type 2 diabetes in apparently healthy women. Jama, 291(6): 711–717.
- Jobin R. and Ghosh M.M. (1972). Effect of buffer intensity and organic matter on the oxygenation of ferrous iron. J. Am. Water Works Assoc. 64: 590.
- Kabat, G.C., Miller, A.B., Jain, M. and Rohan, T.E. (2008). Dietary iron and haem iron intake and risk of endometrial cancer: A prospective cohort study. Br. J. Cancer, 98(1): 194–198.
- Kabat, G.C., Miller, A.B., Jain, M. and Rohan, T.E. (2007). Dietary iron and heme iron intake and risk of breast cancer: A prospective cohort study. Cancer Epidemiol. Biomarkers Prev., 16(6): 1306.
- Kabat, G.C., Cross, A.J., Park, Y., Schatzkin, A., Hollenbeck, A.R., Rohan, T.E. and Sinha, R. (2010). Intakes of dietary iron and heme-iron and risk of postmenopausal breast cancer in the national institutes of Health–AARP diet and health study. Am. J. Clin. Nutr., 92(6): 1478–1483.
- Kaluza, J., Larsson, S.C., Håkansson, N. and Wolk, A. (2014). Heme iron intake and acute myocardial infarction: A prospective study of men. Int. J. Cardiol., 172(1): 155–160.
- Kasim, N., Mohammad, A.W. and Abdullah, S.R.S. (2017). Iron and manganese removal by nanofiltration and ultrafiltration membranes: influence of ph adjustment. Malaysian J. Analytical Sci, 21(1): 149-158. DOI: http://dx.doi.org/10.17576/mjas-2017-2101-17
- Kataria, Y., Wu, Y., Horskjær, P.D., Mandrup-Poulsen, T. and Ellervik, C. (2018). Iron status and gestational Diabetes—A meta-analysis. Nutrients, 10(5).
- Katsoyiannis, IA, and Zouboulis, A.I. (2004). Biological treatment of Mn(II) and Fe(II) containing groundwater: kinetic considerations and product characterization. Water Res., 38: 1922.
- Kawabata, T., Ogino, T. and Awai, M. (1989). Protective effects of glutathione against lipid peroxidation in chronically iron-loaded mice. Biochim. Biophys. Acta, 1004(1): 89–94.
- Kew, M.C. (2014). Hepatic iron overload and hepatocellular carcinoma. Liver Cancer, 3(1): 31–40.
- Khadse, G.K., Patni, P.M., and Labhasetwar, P.K. (2015). Removal of iron and manganese from drinking water supply. Sustain. Water Resour. Manag. 1:157–165
- Knocke, W.R., Hoehn, R.C, and Sinsabaugh, R.L (1987). Using alternative oxidants to removal dissolved manganese from waters laden with organics. J. Am. Water Works Assoc. 79(3):75
- Knocke, W.R., Van Benschoten, J.E., Kearney, M., Soborski, A. and Reckhow, D.A. (1990). Alternative oxidants for the removal of soluble manganese. AWWARF and American Water Works Association, Denver, Colorado.
- Knocke, W.R., Conley, L. and Van Benschoten, J.E. (1992). Impact of dissolved organic carbon on the removal of iron during water treatment. Water Res. 26(11): 1515.
- Knocke, W.R., Shorney, H.L. and Bellamy, J. (1993). Impacts of dissolved organic carbon on iron removal. AWWARF and American Water Works Association, Denver, Colorado.
- Knocke, W.R., Occiano, S.C. and Hungate, R. (1991). Removal of soluble manganese by oxide-coated filter media: sorption rate and removal mechanism issues. J. Am. Water Works Assoc. 83 (8), 64–69.
- Knowles, A.D., Nguyen, C.K., Edwards, M.A., Stoddart, A., McIlwain, B. and Gagnon, G.A. (2015). Role of iron and aluminum coagulant metal residuals and lead release from drinking water pipe materials. J. Environ. Sci. Health A Tox. Hazard. Subst. Environ. Eng., 50(4): 414–423.
- Kohl, P.M. and Medlar, S.J. (2006). Occurrence of manganese in drinking water and manganese control. American Water Research Foundation, American Water Works Association and IWA Publishing. Denver, Colorado.
- Kohl, P.M. and Dixon, D. (2012). Occurrence, impacts and removal of manganese in biofiltration processes. Water Research Foundation, Denver, Colorado.
- Korshin, G.V., Ferguson, J.F., Lancaster, A.N. and Wu, H. (1999). Corrosion and metal release for lead-containing materials: influence of NOM. Water Research Foundation, Denver, Colorado. (AWWA Research Foundation Project No. 90759. No. 4349).
- Krishnan, K. and Carrier, R. (2008). Approaches for evaluating the relevance of multiroute exposures in establishing guideline values for drinking water contaminants. J. Environ. Sci. Health. C. Environ. Carcinog. Ecotoxicol. Rev., 26(3): 300–316.
- Krishnan, K. and Carrier, R. (2013). The Use of Exposure Source Allocation Factor in The Risk Assessment of Drinking-Water Contaminants. Journal of Toxicology and Environmental Health, Part B: Critical Reviews, 16:1, 39–51
- Kunutsor, S.K., Apekey, T.A., Walley, J. and Kain, K. (2013). Ferritin levels and risk of type 2 diabetes mellitus: An updated systematic review and meta-analysis of prospective evidence. Diabetes Metab. Res. Rev., 29(4): 308–318.
- LeChevallier M.W., Lowry C.D., Lee R.G. and Gibbon D.L. (1993). Examining the relationship between iron corrosion and disinfection of biofilm bacteria. J. Am. Water Works Assoc. 85(7):111–23.
- Li, B., Trueman, B.F., Rahman, M.S., Gao, Y., Park, Y. and Gagnon, G. (2019). Understanding the impacts of sodium silicate on water quality and iron oxide particles. Environ. Sci. Water Res. Technol.. DOI: 10.1039/c9ew00257j.
- Liabeuf, S., Gras, V., Moragny, J., Laroche, M.L., Andrejak, M. and French National Network of Pharmacovigilance Centers (2014). Ulceration of the oral mucosa following direct contact with ferrous sulfate in elderly patients: A case report and a review of the French National Pharmacovigilance Database. Clin. Interv. Aging, 9: 737–740.
- Lipinski, P., Stys, A. and Starzynski, R.R. (2013). Molecular insights into the regulation of iron metabolism during the prenatal and early postnatal periods. Cell. Mol. Life Sci., 70(1): 23–38.
- Lönnerdal, B. (2017). Excess iron intake as a factor in growth, infections, and development of infants and young children. Am. J. Clin. Nutr., 106: 1681S-1687S.
- Low, M., Speedy, J., Styles, C.E., De‐Regil, L. and Pasricha, S.R. (2016). Daily iron supplementation for improving anaemia, iron status and health in menstruating women. Cochrane Database Sys. Rev., (4).
- Lozoff, B., Castillo, M., Clark, K.M. and Smith, J.B. (2012). Iron-fortified vs low-iron infant formula: Developmental outcome at 10 years. Arch. Pediatr. Adolesc. Med., 166(3): 208–215.
- Lytle, D.A. and Snoeyink, V.L. (2002) Effect of ortho- and polyphosphate on the properties of iron particles and suspensions. J. Am. Water Works Assoc., 94(10): 87–99.
- Lytle, D.A., Sorg, T.J. and Frietch, C. (2004). Accumulation of Arsenic in Drinking Water Distribution Systems. Environ. Sci. Technol. 38(20): 5365–5372.
- Lytle, D.A., Sorg, T.J., Wang, L., Muhlen, C., Rahrig, M. and French, K. (2007). Biological nitrification in a full-scale and pilot-scale iron removal drinking water treatment plant. J. Water Supply Res. Technol. Aqua., 56(2): 125–136.
- Makrides, M., Crowther, C.A., Gibson, R.A., Gibson, R.S. and Skeaff, C.M. (2003). Efficacy and tolerability of low-dose iron supplements during pregnancy: A randomized controlled trial. Am. J. Clin. Nutr., 78(1): 145-153.
- Manitoba Sustainable Development (2019). Personal communication with Dr. H.D. Coulibaly.
- McClellan, J.N. (2015) Biological iron & manganese treatment:5 years of operating experience in Cavendish VT. Journal NEWWA. December.
- McFadden, M., Giani, R., Kwan, P. and Reiber, S.H. (2011). Contributions to drinking water lead from galvanized iron corrosion scales. J. Am. Water Works Assoc., 103:4:76.
- Manz, D.H., Blanchette, N.L., Paul, B.T., Torti, F.M. and Torti, S.V. (2016). Iron and cancer: Recent insights. Ann. N.Y. Acad. Sci., 1368(1): 149–161.
- Markova, V., Norgaard, A., Jørgensen, K. and Langhoff‐Roos, J. (2015). Treatment for women with postpartum iron deficiency anaemia. Cochrane Database Syst. Rev., (8).
- Meng, Y., Sun, J., Yu, J., Wang, C. and Su, J. (2019). Dietary intakes of calcium, iron, magnesium, and potassium elements and the risk of colorectal cancer: A meta-analysis. Biol. Trace Elem. Res., 189(2): 325–335.
- Metcalf, M. (2000). Pressure filtration for iron and manganese removal. J. New England Water Works Assoc., 114(3): 187.
- Moore, A.B., Shannon, J., Chen, C., Lampe, J.W., Ray, R.M., Lewis, S.K., Lin, M., Stalsberg, H. and Thomas, D.B. (2009). Dietary and stored iron as predictors of breast cancer risk: A nested case–control study in Shanghai. Int. J. Cancer, 125(5): 1110–1117.
- Morais, R., Ribeiro, A., Paiva, D., Rios, E., Rodrigues, S. and Macedo, G. (2017). Iron pill-induced gastroduodenopathy. Porto Biomed. J., 2(6): 344–346.
- Mørkedal, B., Laugsand, L.E., Romundstad, P.R. and Vatten, L.J. (2011). Mortality from ischaemic heart disease: Sex-specific effects of transferrin saturation, serum iron, and total iron binding capacity. The HUNT study. Eur. J. Cardiovasc. Prev. Rehabil., 18(5): 687–694.
- Mouchet, P. (1992). From conventional to biological removal of iron and manganese in France. J. Am. Water Works Assoc., 84(4): 158–167.
- Muckenthaler, M.U., Rivella, S., Hentze, M.W. and Galy, B. (2017). A red carpet for iron metabolism. Cell, 168(3): 344–361.
- Myers, B.M., Prendergast, F.G., Holman, R., Kuntz, S.M. and LaRusso, N.F. (1991). Alterations in the structure, physicochemical properties, and pH of hepatocyte lysosomes in experimental iron overload. J. Clin. Invest., 88(4): 1207–1215.
- New Brunswick Department of Environment and Local Government (2019). Personal communication with K. Gould.
- Newfoundland and Labrador Department of Municipal Affairs and Environment (2019). Personal communication with H. Khan.
- NHMRC and NRMMC (2011). Australian drinking water guidelines - paper 6, version 3.5 updated august 2018. National Water Quality Management Strategy. National Health and Medical Research Council, National Resource Management Ministerial Council. Commonwealth of Australia, Canberra.
- NRC (2019). Iron ore facts. Natural Resources Canada. Government of Canada. Available at https://www.nrcan.gc.ca/science-data/science-research/earth-sciences/earth-sciences-resources/earth-sciences-federal-programs/iron-ore-facts/20517
- NSF International (2021). NSF/ANSI Standard 42: Drinking water treatments units— Aesthetic effects. NSF International/American National Standards Institute. NSF International, Ann Arbor, MI.
- Nova Scotia Environment (2019). Personal communication with A. Polegato.
- Odell, L.H. (2010). Treatment technologies for groundwater. American Water Works Association. Denver, Colorado.
- OECD TG 422. Organisation for Economic Cooperation and Development Test Guideline 422 - Combined Repeated Dose Toxicity Study with the Reproduction/Developmental Toxicity Screening Test. Available at
- https://www.oecd-ilibrary.org/environment/test-no-422-combined-repeated-dose-toxicity-study-with-the-reproduction-developmental-toxicity-screening-test_9789264242715-en
- Ömür-Özbek, P. and Dietrich, A.M. (2011). Retronasal perception and flavour thresholds of iron and copper in drinking water. J. Water Health, 9 (1), 1–9.
- Onorati, M., Nicola, M., Renda, A., Lancia, M. and Di Nuovo, F. (2020). Iron overload in gastric mucosa: Underdiagnosed condition rarely documented in clinical and pathology reports. Cureus, 12(5): e8234.
- Ontario Ministry of the Environment, Conservation and Parks (2020). Personal communication with S. Deshpande.
- Orban, E., Schwab, S., Thorand, B. and Huth, C. (2014). Association of iron indices and type 2 diabetes: A meta-analysis of observational studies. Diabetes Metab. Res. Rev., 30(5): 372–394.
- Paganini, D. and Zimmermann, M.B. (2017). The effects of iron fortification and supplementation on the gut microbiome and diarrhea in infants and children: A review. Am. J. Clin. Nutr., 106: 1688S–1693S.
- Peeters, K., Lespes, G., Zuliani, T., Scancar, J. and Milacic, R. (2016). The fate of iron nanoparticles in environmental waters treated with nanoscale zero-valent iron, FeONPs and Fe3O4NPs. Water Res., 94: 315–327.
- PEI Department of Communities, Land and Environment (2019). Personal communication with G. Somers.
- Peng, C-Y. and Korshin, G.V. (2011). Speciation of trace inorganic contaminants in corrosion scales and deposits formed in drinking water distribution systems. Water Res., 45: 5553–5563.
- Pereira, D.I.A., Couto Irving, S.S., Lomer, M.C.E. and Powell, J.J. (2014). A rapid, simple questionnaire to assess gastrointestinal symptoms after oral ferrous sulphate supplementation. BMC Gastroenterology, 14: 103–103.
- Pestaner, J.P., Ishak, K.G., Mullick, F.G. and Centeno, J.A. (1999). Ferrous sulfate toxicity: A review of autopsy findings. Biol. Trace Elem. Res., 69(3): 191–198.
- Plummer, J.L., MacKinnon, M., Cmielewski, P.L., Williams, P., Ahern, M.J., Ilsley, A.H. and de la M Hall, P. (1997). Dose-related effects of dietary iron supplementation in producing hepatic iron overload in rats. J. Gastroenterol. Hepatol., 12(12): 839–842.
- Ponka, P., Tenenbein, M. and Eaton, J.W. (2015). Chapter 41 - iron. Handbook on the toxicology of metals (fourth edition): 879-902.
- Postawa, A. and Hayes, C. (2013). Best practice guide on the control of iron and manganese in water supply. IWA Publishing. London, UK.
- PubChem (2004). PubChem compound summary for CID 23925, Fe. [accessed Jan. 26, 2021]. National Library of Medicine (US), National Center for Biotechnology Information, Bethesda, MD. Available at https://pubchem.ncbi.nlm.nih.gov/compound/Fe
- Qi, X., Zhang, Y., Guo, H., Hai, Y., Luo, Y. and Yue, T. (2020). Mechanism and intervention measures of iron side effects on the intestine. Crit. Rev. Food Sci. Nutr., 60(12): 2113–2125.
- Qin, S., Ma, F., Huangc, P. and Yangb, J. (2009). Fe (II) and Mn (II) removal from drilled well water: A case study from a biological treatment unit in Harbin. Desalination 245: 183–193.
- Quinn, E.A. (2014). Too much of a good thing: Evolutionary perspectives on infant formula fortification in the United States and its effects on infant health. Am. J. Hum. Biol., 26(1): 10–17.
- Radtke, H., Tegtmeier, J., Rocker, L., Salama, A. and Kiesewetter, H. (2004). Daily doses of 20 mg of elemental iron compensate for iron loss in regular blood donors: A randomized, double-blind, placebo-controlled study. Transfusion, 44(10): 1427–1432.
- Ramm, G.A., Li, S.C., Li, L., Britton, R.S., O'Neill, R., Kobayashi, Y. and Bacon, B.R. (1995). Chronic iron overload causes activation of rat lipocytes in vivo. Am. J. Physiol., 268(3 Pt 1): G451–8.
- Reiber, S. and Dostal, G. (2000). Well Water Disinfection Sparks Surprises. Opflow, 26(3).
- Revie, R.W. and Uhlig, H.H. (2008) Corrosion and Corrosion Control. An Introduction to Corrosion Science and Engineering. 4th Edition, John Wiley & Sons, New Jersey.
- Reyes, C., Pons, N.A., Reñones, C.R., Gallisà, J.B., Val, V.A., Tebé, C. and Mateo, G.F. (2020). Association between serum ferritin and acute coronary heart disease: A population-based cohort study. Atherosclerosis, 293: 69–74.
- Robinson, R.B. and Reed, G.D., (1990). Sequestering Methods of Iron and Manganese Treatment. American Water Works Association Research Foundation. Denver, Colorado. (Report 90558).
- Robinson, R.B., Reed, G.D., and Frazier, B. (1992). Iron and Manganese Sequestration Facilities Using Sodium Silicate. J. Am. Water Works Assoc., 84(2), 77–82.
- Rodriguez-Ramiro, I., Dell'Aquila, C., Ward, J.L., Neal, A.L., Bruggraber, S.F.A., Shewry, P.R. and Fairweather-Tait, S. (2019). Estimation of the iron bioavailability in green vegetables using an in vitro digestion/Caco-2 cell model. Food Chem., 301: 125292.
- Rossman, L.A., Brown, R.A., Singer, P.C. and Nuckols, J.R. (2001) DBP formation kinetics in a simulated distribution system. Water Res., 35 (14): 3483–3489.
- Sain, A. and Dietrich, A.M. (2015). Rethinking aesthetic guidelines for manganese and iron in drinking water. J. Water Supply Res. Technol. Aqua, 64 (7): 775–782.
- Sain, A., Griffin, A. and Dietrich, A.M. (2014). Assessing taste and visual perception of Mn(II) and Mn(IV) in Drinking Water. J. Am. Water Works Assoc., 106(1): E32-34 and http://dx.doi.org/10.5942/jawwa.2014.106.0003, E32-E40.
- Sallanko, J., Lakso, E. and Ropelinen, J. (2006). Iron behavior in the ozonation and filtration of groundwater. Ozone-Sci. Eng., 28: 269.
- Salonen, J.T., Nyyssönen, K., Korpela, H., Tuomilehto, J., Seppänen, R. and Salonen, R. (1992). High stored iron levels are associated with excess risk of myocardial infarction in eastern Finnish men. Circulation, 86(3): 803–811.
- Salonen, J.T., Tuomainen, T.P., Nyyssönen, K., Lakka, H.M. and Punnonen, K. (1998). Relation between iron stores and non-insulin dependent diabetes in men: Case-control study. Bmj, 317(7160): 727.
- Sarin, P., Snoeyink, V.L., Bebee, J., Kriven, W.M. and Clement, J.A. (2001). Physico-chemical characteristics of corrosion scales in old iron pipes. Water Res., 35(12), 2961–2969.
- Sarin, P., Clement, J.A., Snoeyink, V.L. and Kriven, W.M. (2003) Iron release from corroded, unlined cast-iron pipe. J. Am. Water Works Assoc., 95(11): 85–96.
- Sarin, P., Snoeyink, V.L., Bebee, J., Jim, K.K., Beckett, M.A., Kriven, W.M. and Clement, J.A. (2004a). Iron release from corroded iron pipes in drinking water distribution systems: effect of dissolved oxygen. Water Res., 38(5), 1259–1269.
- Sarin, P., Snoeyink, V.L., Lytle, D.A. and Kriven, W.M. (2004b). Iron corrosion scales: model for scale growth, iron release, and coloured water formation. J. Environ. Eng., 130(4), 364–373.
- Saskatchewan Water Security Agency (2019). Personal communication with S. Ferris
- Sato, M., Furukawa, F., Toyoda, K., Mitsumori, K., Nishikawa, A. and Takahashi, M. (1992). Lack of carcinogenicity of ferric chloride in F344 rats. Food Chem. Toxicol., 30(10): 837–842.
- Sazawal, S., Black, R.E., Ramsan, M., Chwaya, H.M., Stoltzfus, R.J., Dutta, A., Dhingra, U., Kabole, I., Deb, S., Othman, M.K. and Kabole, F.M. (2006). Effects of routine prophylactic supplementation with iron and folic acid on admission to hospital and mortality in preschool children in a high malaria transmission setting: Community-based, randomised, placebo-controlled trial. Lancet, 367(9505): 133–143.
- SCC (2022). Directory of accredited product, process and service certification bodies. Standards Council of Canada, Ottawa, Ontario. Available at https://www.scc.ca/en/accreditation/product-process-and-service-certification/directory-of-accredited-clients
- Schneider, C., Johns, P. and Huehmer, R.P. (2001). Removal of manganese by microfiltration in a water treatment plant. In Proceedings of the AWWA membrane technology conference, Denver, Colorado. American Water Works Association.
- Schock, M.R. (2005). Distribution systems as reservoirs and reactors for inorganic contaminants. Chapter 6. In Distribution system water quality challenges in the 21st century—a strategic guide. M.J. Macphee (ed.). American Water Works Association, Denver, Colorado.
- Schock, M.R., Hyland, R.N. and Welch, M.M. (2008). Occurrence of contaminant accumulation in lead pipe scales from domestic drinking-water distribution systems. Environ. Sci. Technol., 42(12): 4285–4291.
- Schock, M.R., Cantor, A., Triantafyllidou, S., Desantis, M.K. and Scheckel, K.G. (2014). Importance of pipe deposits to Lead and Copper Rule compliance. J. Am. Water Works Assoc., 106(7): E336–E349.
- Schrier, S.L. (2015). So you know how to treat iron deficiency anemia. Blood, 126(17): 1971.
- Schwake, D.O., Garner, E., Strom, O.R., Pruden, A. and Edwards, M.A. (2016). Legionella DNA markers in tap water coincident with a spike in Legionnaires' disease in Flint, MI. Environ. Sci. Technol. Lett., 3(9), 311–315.
- Sharma, S.K., Kappelhof, J., Groenendijk, M. and Schippers, J.C. (2001). Comparison of physicochemical iron removal mechanisms in filters. J. Water Supply Res. Technol. Aqua., 50(4): 187–198.
- Shyu, H., Lung, C., Ho, C., Sun, Y.I., Ko, P., Huang, J., Pan, C., Chiang, Y., Chen, S. and Liaw, Y. (2013). Geographic patterns of hepatocellular carcinoma mortality with exposure to iron in groundwater in Taiwanese population: An ecological study. BMC Public Health, 13(1): 352.
- Smeets, P.W.M.H., Medema, G.J. and Van Dijk, J.C. (2009). The Dutch secret: How to provide safe drinking water without chlorine in the Netherlands. Drink. Water Eng. Sci., 2(1): 1–14.
- Sommerfeld, E.O. (1999). Iron and manganese removal handbook. American Water Works Association. Denver, Colorado.
- Soofi, S., Cousens, S., Iqbal, S.P., Akhund, T., Khan, J., Ahmed, I., Zaidi, A.K. and Bhutta, Z.A. (2013). Effect of provision of daily zinc and iron with several micronutrients on growth and morbidity among young children in Pakistan: A cluster-randomised trial. Lancet, 382(9886): 29–40.
- Stål, P., Olsson, J., Svoboda, P., Hultcrantz, R., Harms-Ringdahl, M. and Eriksson, L.C. (1997). Studies on genotoxic effects of iron overload and alcohol in an animal model of hepatocarcinogenesis. J. Hepatol., 27(3): 562–571.
- Stål, P., Wang, G.S., Olsson, J.M. and Eriksson, L.C. (1999). Effects of dietary iron overload on progression in chemical hepatocarcinogenesis. Liver, 19(4): 326–334.
- Statistics Canada (2019). Canadian Health Measures Survey (CHMS). Content summary for cycles 1 to 8.
- Statistics Canada (2021). Canadian Health Measures Survey (CHMS). Table 13-10-0336-01 nutritional status of the household population. DOI: Https://doi.org/10.25318/1310033601-eng
- Štembal, T., Markić, M., Ribičić, N., Briški, F. and Sipos, L. (2005). Removal of ammonia, iron and manganese from groundwaters of northern Croatia—pilot plant studies. Process Biochem. 40: 327–335.
- Stewart, B., Cismasu, A., Williams, K., Peyton, B., Peter S. and Nico, P. (2015). Reactivity of uranium and ferrous iron with natural iron oxyhydroxides. Environ. Sci. Technol., 49: 10357–10366.
- Sunkara, T., Caughey, M.E., Nigar, S., Olivo, R. and Gaduputi, V. (2017). Iron pill gastritis: An under diagnosed condition with potentially serious outcomes. Gastroenterology Res., 10(2): 138–140.
- Świetlik, J., Raczyk-Stanisławiak, U., Piszora, P. and Nawrocki, J. (2012). Corrosion in drinking water pipes: The importance of green rusts. Water Res., 46(1), 1–10
- Tekerlekopoulou, A.G., Pavlou, S. and Vayenas, D.V. (2013). Removal of ammonium, iron and manganese from potable water in biofiltration units: a review. J. Chem. Technol. Biotechnol., 88(5), 751–773.
- Tenenbein, M. (1998). Toxicokinetics and toxicodynamics of iron poisoning. Toxicol. Lett., 102-103: 653–656.
- Theis T.L. and Singer P.C. (1973) The stabilization of ferrous iron by organic compounds in natural waters. In: Trace metals and metal-organic interactions in natural waters. ed. Singer P. C.). Ann Arbor Science, Ann Arbor, Michigan.
- Tjalkens, R.B., Valerio, L.G., Jr, Awasthi, Y.C. and Petersen, D.R. (1998). Association of glutathione S-transferase isozyme-specific induction and lipid peroxidation in two inbred strains of mice subjected to chronic dietary iron overload. Toxicol. Appl. Pharmacol., 151(1): 174–181.
- Tobiason, J.E., Islam, A.A., Knocke, W.R., Goodwill, J., Hargette, P., Bouchard, R. and Zuravnsky, L. (2008). Characterization and performance of filter media for manganese control. American Water Works Research Foundation, Denver, Colorado.
- Tobiason, J. and Brandhuber, P. (2018). 15th Annual EPA Drinking Water Workshop Small Systems Challenges and Solutions. Cincinnati, Ohio.
- Tolkien, Z., Stecher, L., Mander, A.P., Pereira, D.I. and Powell, J.J. (2015). Ferrous sulfate supplementation causes significant gastrointestinal side-effects in adults: A systematic review and meta-analysis. PLoS One, 10(2): e0117383.
- Torti, S.V. and Torti, F.M. (2013). Iron and cancer: More ore to be mined. Nature Reviews Cancer, 13(5): 342–355.
- Toyoda, T., Cho, Y., Mizuta, Y., Akagi, J. and Ogawa, K. (2014). A 13-week subchronic toxicity study of ferric citrate in F344 rats. Food and Chemical Toxicology, 74: 68–75.
- Tseng, M., Sandler, R.S., Greenberg, E.R., Mandel, J.S., Haile, R.W. and Baron, J.A. (1997). Dietary iron and recurrence of colorectal adenomas. Cancer Epidemiol. Biomarkers Prev., 6(12): 1029.
- Ulvik, R.J., Moller, R. and Hervig, T. (2013). Dietary supplement of iron for iron deficiency. Tidsskr. nor. Laegeforen., 133(8): 845–849.
- U.S. EPA (1994a). Method 200.7: Determination of metals and trace elements in water and wastes by inductively coupled plasma-atomic emission spectrometry. Rev 4.4. Environment Monitoring Systems Laboratories. Office of Research and Development, Cincinnati, Ohio.
- U.S. EPA (1994b). Method 200.9, Revision 2.2: Determination of trace elements by stabilized temperature graphite furnace atomic adsorption. Environment Monitoring Systems Laboratories. Office of Research and Development, Cincinnati, Ohio.
- U.S. EPA (2003). Method 200.5. Determination of trace elements in drinking water by axially viewed inductively coupled plasma–atomic emission spectrometry. National Exposure Research Laboratory. Office of Research and Development. Cincinnati, Ohio. EPA 600/R-06/115.
- U.S. EPA (2006). Provisional peer reviewed toxicity values for iron and compounds (CASRN 7439-89-6). Derivation of subchronic and chronic oral RfDs. national center for environmental assessment. Office of Research and Development. U.S. Environmental Protection Agency, EPA/690/R-06/020F, Cincinnati, OH.
- U.S. GS (2017). U.S. geological survey. 2017 minerals yearbook. Iron ore. U.S. Department of the Interior.
- Valentine, R.L. and Stearns, S.W. (1994). Radon release from water distribution system deposits. Environ. Sci. Technol., 28(3): 534–537.
- van der A, D.L., Marx, J.J.M., Grobbee, D.E., Kamphuis, M.H., Georgiou, N.A., van Kats-Renaud, J.H., Breuer, W., Cabantchik, Z.I., Roest, M., Voorbij, H.A.M. and van der Schouw, Y.T. (2006). Non–transferrin-bound iron and risk of coronary heart disease in postmenopausal women. Circulation, 113(16): 1942–1949.
- van der A, D.L., Grobbee, D.E., Roest, M., Marx, J.J.M., Voorbij, H.A. and van der Schouw, Y.T. (2005). Serum ferritin is a risk factor for stroke in postmenopausal women. Stroke, 36(8): 1637–1641.
- Vikesland, P.J. and Valentine, R.L. (2000). Reaction pathways involved in the reduction of monochloramine by ferrous iron. Environ. Sci. Technol., 34: 83 (http://dx.doi.org/10.1021/es990511p)
- Wan, D., Zhou, X., Xie, C., Shu, X., Wu, X. and Yin, Y. (2015). Toxicological evaluation of ferrous N-carbamylglycinate chelate: Acute, sub-acute toxicity and mutagenicity. Regul. Toxicol. Pharmacol., 73(2): 644–651.
- Weiss, A., Spektor, L., Cohen, L.A., Lifshitz, L., Magid Gold, I., Zhang, D.L., Truman-Rosentsvit, M., Leichtmann-Bardoogo, Y., Nyska, A., Addadi, S., Rouault, T.A. and Meyron-Holtz, E.G. (2018). Orchestrated regulation of iron trafficking proteins in the kidney during iron overload facilitates systemic iron retention. PLoS One, 13(10): e0204471.
- Whittaker, P., Ali, S.F., Imam, S.Z. and Dunkel, V.C. (2002). Acute toxicity of carbonyl iron and sodium iron EDTA compared with ferrous sulfate in young rats. Regul. Toxicol. Pharmacol., 36(3): 280–286.
- WHO (2003). Iron in drinking-water. Background document for development of WHO guidelines for drinking-water quality. World Health Organization, WHO/SDE/WSH/03.04/08, Geneva.
- WHO (2012). Water safety planning for small community water supplies. World Health Organization, Geneva, Switzerland. Available at http://www.who.int/water_sanitation_health/publications/small-commwater_supplies/en/
- WHO (2017). Drinking water parameter cooperation project. Support to the revision of annex I council directive 98/83/EC on the quality of water intended for human consumption (drinking water directive) - recommendations. World Health Organization - Regional Office for Europe. World Health Organization - Europe, Bonn, Germany.
- WHO (2017). Guidelines for drinking-water quality. Fourth edition, incorporating the 1st addendum. World Health Organization, Geneva, Switzerland. Available at https://www.who.int/publications/i/item/9789241549950
- Yilmaz, B. and Li, H. (2018). Gut microbiota and iron: The crucial actors in health and disease. Pharmaceuticals (Basel), 11(4): 10.3390/ph11040098.
- Zhang, H., Zhabyeyev, P., Wang, S. and Oudit, G.Y. (2019). Role of iron metabolism in heart failure: From iron deficiency to iron overload. Biochimica et Biophysica Acta (BBA) - Molecular Basis of Disease; Genetic and Epigenetic Regulation of Aging and Longevity, 1865(7): 1925–1937.
- Zhao, Z., Li, S., Liu, G., Yan, F., Ma, X., Huang, Z. and Tian, H. (2012). Body iron stores and heme-iron intake in relation to risk of type 2 diabetes: A systematic review and meta-analysis. PLoS One, 7(7): e41641.
- Zhu, Q., Qian, Y., Yang, Y., Wu, W., Xie, J. and Wei, D. (2016). Effects of carbonyl iron powder on iron deficiency anemia and its subchronic toxicity. J. Food Drug Anal., 24(4): 746–753.
- Zimmermann, M.B., Chassard, C., Rohner, F., N'goran, E.K., Nindjin, C., Dostal, A., Utzinger, J., Ghattas, H., Lacroix, C. and Hurrell, R.F. (2010). The effects of iron fortification on the gut microbiota in African children: A randomized controlled trial in Cote d'Ivoire. Am. J. Clin. Nutr., 92(6): 1406–1415.
- Zogo, D., Bawa, L.M., Soclo, H.H. and Atchekpe, D. (2011). Influence of pre-oxidation with potassium permanganate on the efficiency of iron and manganese removal from surface water by coagulation-flocculation using aluminium sulphate: Case of the Okpara dam in Republic of Benin. J. Environ. Chem. and Ecotox. Vol 3 (1):1–8.
Appendix A: List of abbreviations
- ANSI
- American National Standards Institute
- AO
- aesthetic objective
- As
- arsenic
- bw
- body weight
- CCHS
- Canadian Community Health Survey
- CHD
- coronary heart disease
- CHMS
- Canadian Health Measures Survey
- CNF
- Canadian Nutrient File
- DBPs
- disinfection by-products
- DO
- dissolved oxygen
- DOC
- dissolved organic carbon
- DL
- detection limit
- Fe
- iron
- Fe(II)
- ferrous iron
- Fe(III)
- ferric iron
- GI
- gastrointestinal
- HBV
- health-based value
- HH
- hereditary hemochromatosis
- LOAEL
- lowest-observed-adverse-effect level
- MDL
- method detection limit
- Mn
- the element manganese, regardless of its valence state
- Mn(II)
- the divalent manganese ion
- Mt
- million tonnes
- MWD
- molecular weight distribution
- NF
- nanofiltration
- NOAEL
- no-observed-adverse-effect level
- NOM
- natural organic matter
- NTU
- nephelometric turbidity unit
- PA
- polyamide
- POE
- point of entry
- POU
- point of use
- RCT
- randomized controlled trial
- RDA
- recommended dietary allowance
- RDL
- reporting detection limit
- ROS
- reactive oxygen species
- SCC
- Standards Council of Canada
- SE
- standard error
- TOC
- total organic carbon
- UF
- Ultrafiltration
- UL
- tolerable upper intake level
- U.S. EPA
- United States Environmental Protection Agency
Appendix B: Canadian water quality data
| Jurisdiction (MDL mg/L) | # detects/ samples | % Detect | Concentration (mg/L) | ||
|---|---|---|---|---|---|
| Median | Mean | 90th percentile | |||
| Manitoba (0.01–0.1) [2010–2020] | 149/155 | 96.1 | 0.80 | 1.34 | 2.40 |
| Nova Scotia (0.05) [2000–2020] | 1 907/2 770 | 68.8 | 0.05 | 0.67 | 1.12 |
| Quebec (0.005–0.1) [2004–2014] | 1 792/3 013 | 59.5 | 0.06 | 2.47 | 3.60 |
Appendix C: Summary of iron removal for residential scale technologies
| Water treatment units | Average | Median | Min | Max | Percentage of samples above | Percentile | |||
|---|---|---|---|---|---|---|---|---|---|
| 300 μg/L | 100 μg/L | 75th | 95th | ||||||
| Total (n=96) | Influent (μg/L) | 583.6 | 166.0 | 6.7 | 7 008 | 35.4% | 64.6% | 49.7 | 2 709 |
| Effluent (μg/L) | 88.5 | 14.3 | 0.06 | 2 195 | 5.2% | 16.7% | 604 | 374 | |
| % removal | 82.6 | 93 | -1 968% | 100% | - | - | 98 | 100 | |
| Ion exchange (n=54) | Influent (µg/L) | 586 | 240 | 8.8 | 7 008 | 53% | 43% | 644 | 2 255 |
| Effluent (µg/L) | 88.2 | 37 | 3 | 993 | 6% | 22% | 81 | 405 | |
| % removal | 79% | 92% | -1 968% | 97% | - | - | 97% | 99% | |
| Activated carbon (n=18) | Influent (µg/L) | 133 | 65 | 6.7 | 850 | 43% | 53% | 157 | - |
| Effluent (µg/L) | 25 | 3.5 | 0.06 | 176 | 0% | 6% | 13 | - | |
| % removal | 86% | 94% | -178% | 100% | - | - | 98% | - | |
| Reverse osmosis (n=9) | Influent (µg/L) | 201 | 84 | 16.8 | 784 | 22% | 44% | 338 | - |
| Effluent (µg/L) | 2.91 | 2.6 | 1.1 | 5.6 | 0% | 0% | 4.4 | - | |
| % removal | 93% | 97% | 75% | 99% | - | - | 99 | - | |
| Green sand (n=3) | Influent (µg/L) | 1 312 | 700 | 675 | 2 562 | 100% | 100% | - | - |
| Effluent (µg/L) | 8.48 | 12.6 | 0.25 | 12.6 | 0% | 0% | - | - | |
| % removal | 99% | 100% | 98% | 100% | - | - | - | - | |
| Ceramic microfilter (n=1) | Influent (µg/L) | 166 | - | - | - | 0% | 100% | - | - |
| Effluent (µg/L) | 2 | - | - | - | 0% | 0% | - | - | |
| % removal | 99% | - | - | - | - | - | - | - | |
| Sediment filter (n=1) | Influent (µg/L) | 79.3 | - | - | - | 0% | 0% | - | - |
| Effluent (µg/L) | 7.8 | - | - | - | 0% | 0% | - | - | |
| % removal | -917 | - | - | - | - | - | - | - | |
| Combinations (n=10) | Influent (µg/L) | 1 609 | 353 | 13.6 | 6 214 | 50 | 80 | 3 346 | - |
| Effluent (µg/L) | 315 | 13.9 | 1.8 | 2 195 | 20 | 20 | 267 | - | |
| % removal | 76.8% | 81% | 35% | 100% | - | - | 0.99 | - | |
POE – point of entry; POU – point of use.
Note: Effluent=treated water
Brodeur, M.E. and Barbeau, B. (2015). Performance of point-of-use and point-of-entry technologies for the removal of manganese in drinking water: Summary of the EDU-MANGO Epidemiological Study. Report prepared for and available on request from Health Canada.