
Alcohol and Drug Use among Students in Canada, 2023–24
Download in PDF format
(2,014 KB, 25 pages)
Organization: Health Canada
Date published: March 2025
Cat.: H134-44/2025E-PDF
ISBN: 978-0-660-75675-2
Pub.: 240846
Key findings from the Canadian Student Alcohol and Drugs Survey
Background
The Canadian Student Alcohol and Drugs Survey (CSADS)Footnote 1 collects information on substance use every two years from students in grades 7 to 12 attending private and public schools across Canada. The survey covers a broad range of topics that help to track changes in behaviours, perceptions, and wellbeing over time and through an intersectional lens. Since 1994, results from the survey have helped shape policies and programs to better address substance use and its impacts on youth in Canada.
This report highlights key findings from the 12th iteration of the survey, which ran between September 2023 and June 2024 in 9 provincesFootnote 2. A total of 51,844 students in grades 7 to 12 completed the survey, weighted to represent over 1.79 million students. Most students were aged 12 to 18 at the time of the survey.
Data from this iteration, modified to protect student and school identities, will be made available at a later date on the Open Government portal (https://open.canada.ca/en) as a Public Use Microdata File (PUMF).
This report covers a selection of data from the 2023–24 survey. For a deeper dive into student substance use across multiple years, visit our interactive data tool.
Highlights
Substance use levels have remained largely steady from 2021–22 to 2023–24.
- Alcohol (22%) continues to be the most widely used substance by students in Canada in the past 30 days, followed by vapes (15%) and cannabis (12%).
- Substance use varied by age, gender, and rurality, with Grade 12 students reporting the highest use of most substances. Gender-diverse students reported higher prevalences of past 30-day cigarette use (12%), as well as past 12-month illegal drug use (16%) and non-recommended prescription medication use (11%). Students in rural areas reported higher prevalences of past 30-day non-cannabis vape use (22%), as well as past 12-month alcohol use (45%), non-recommended prescription medication use (8%), illegal drug use (9%), and polysubstance use (24%).
- Students rated alcohol (69%) and cannabis (49%) the easiest to get and often accessed them through friends and family (81% and 77%, respectively), highlighting the role of social networks in substance use.
- Grade 7 students were the most likely to be unaware of the risks of substance use; as many as 13% to 20% perceived regular use as posing little to no risk, depending on the substance. In contrast, Grade 12 students were most likely to perceive little to no risk from cannabis use, whether consumed by eating (36%) or smoking (28%). Many students, regardless of grade, considered vaping without nicotine to pose little to no risk (39%).
- Students were most likely to look for information on the risks and harms of alcohol and drug use from official websites (26%), from classes at school (21%), or from healthcare professionals (14%).
Alcohol
Changes over time
Text description
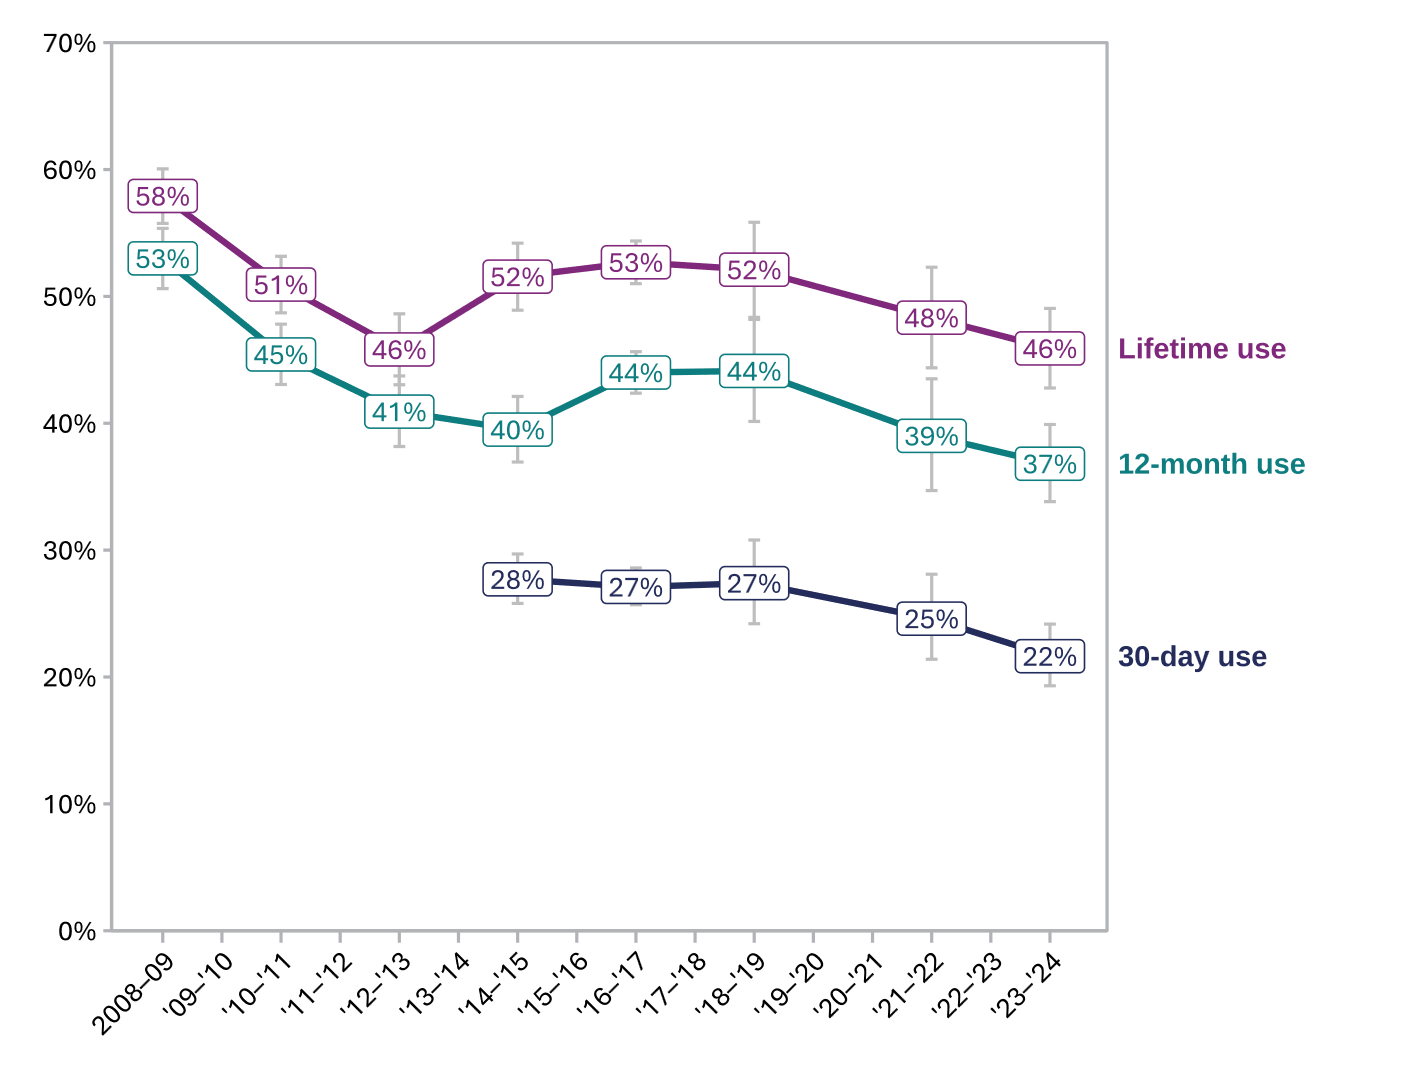
This figure shows trends in alcohol use among students over time, categorized as lifetime, 12-month, and 30-day use.
In the earliest school year, 58% of students reported lifetime alcohol use, 53% reported use in the past year in 2008-2009, and 28% in the past 30 days in 2014-2015. By the most recent school year, 2023-2024, these numbers fell slightly to 46%, 37%, and 22%, respectively.
Main takeaway: From 2021–22 to 2023–24, while there may appear to be a drop, there was no statistical change in lifetime use, in past 12-month use, or in past 30-day use of alcohol among students.
Patterns of Use
Text description
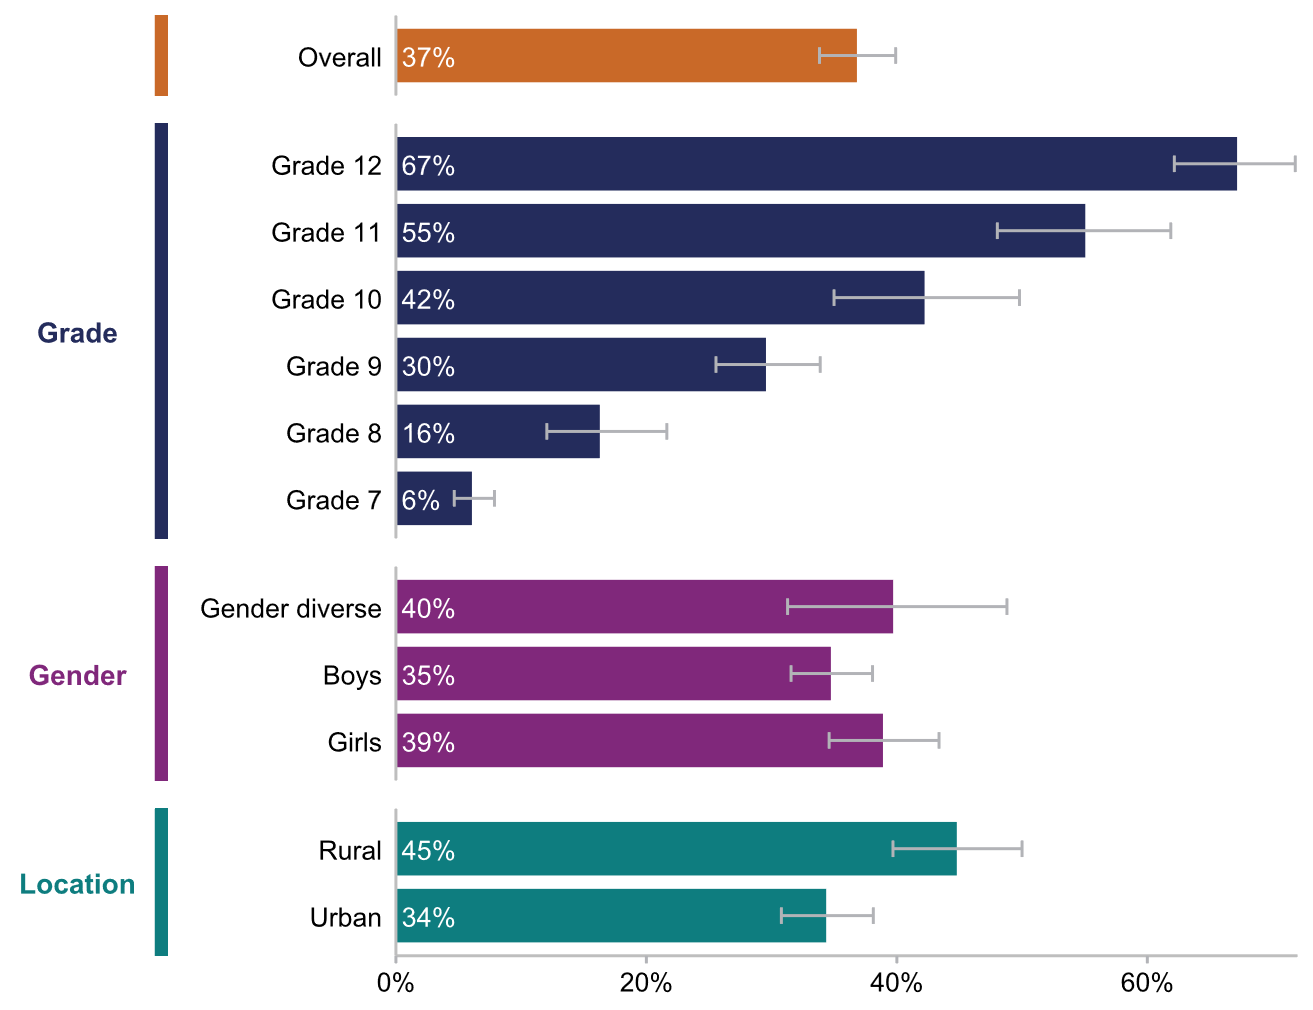
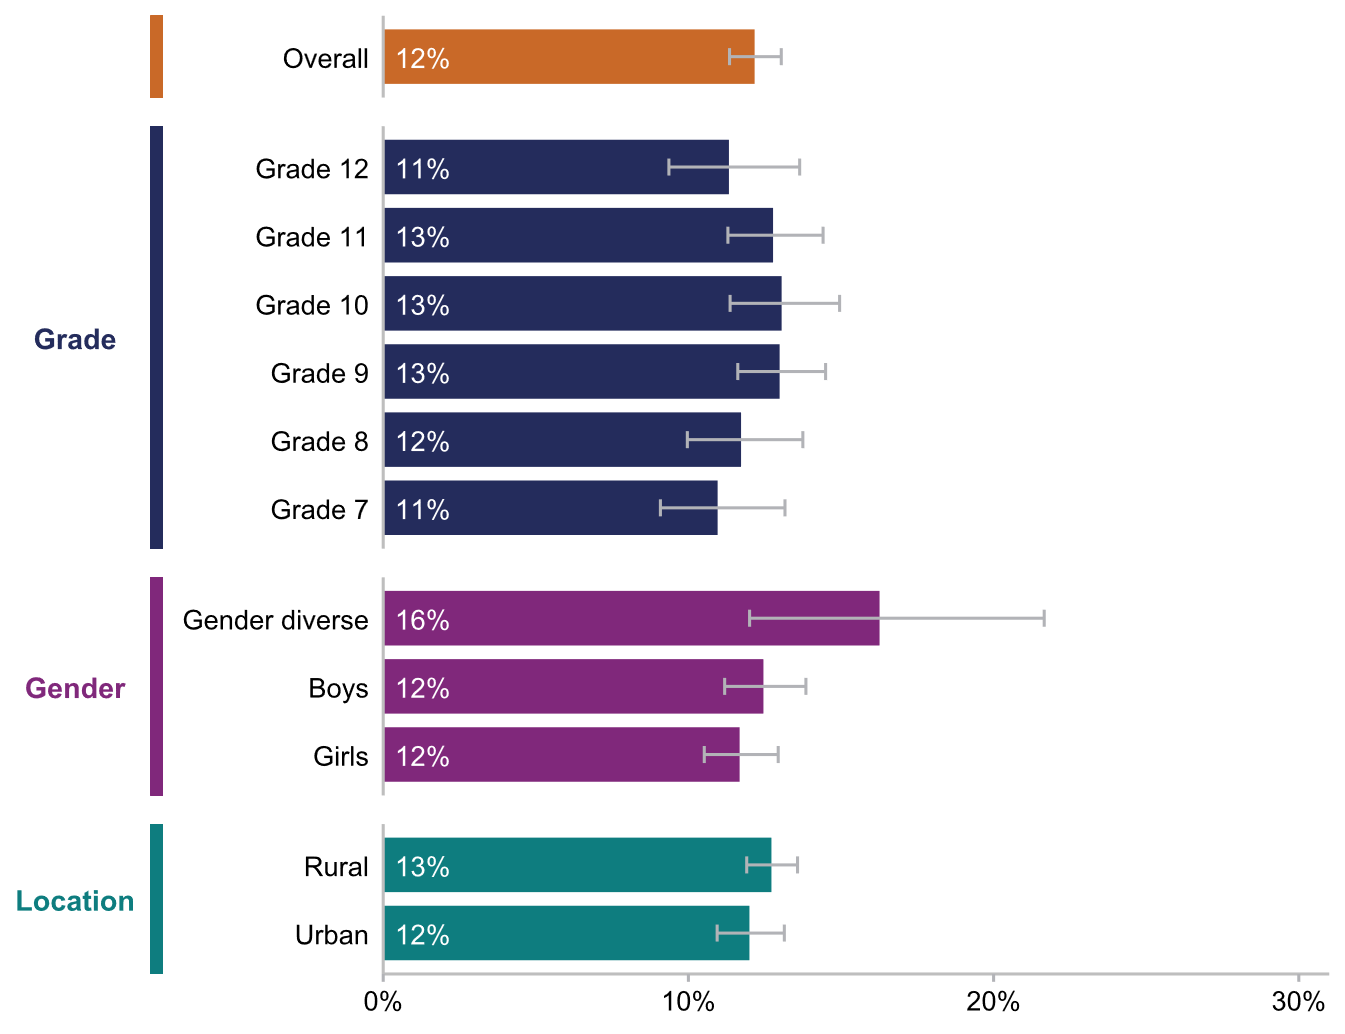
This figure looks at past 12-month alcohol use among student subgroups in the 2023-2024 school year.
Overall, 37% of students reported past 12-month alcohol use. This number increased in older grades, with 6% reporting use in Grade 7 and 67% in Grade 12. It was also higher among students in rural areas, at 45%, compared to 34% among students in urban areas. Past 12-month alcohol use was not different by gender.
Use and access
- On average, students had alcohol for the first time at 13 years old.
- 69% of students rated alcohol as fairly or very easy to get.
- Among those who reported alcohol use, alcohol was most often obtained from a parent with permission (34%), at a party (18%), or by buying or getting it from a friend or family member (14%).
Risks and harms
- 1% of students drank most days (5+ days a week) in the past 30 days.
- 21% of students engaged in high-risk drinking (5+ drinks on one occasion) in the past 12 months.
- In the previous 30 days, 2% of students had driven within an hour of drinking and 10% had been driven by someone who had been drinking in the last hour.
- 1% of students had 911 called for them, visited an emergency room, or had been hospitalized in the past 12 months because of their alcohol use. 3% reported experiencing this in their lifetime as a result of any substance use.
Cannabis
Changes over time
Text description
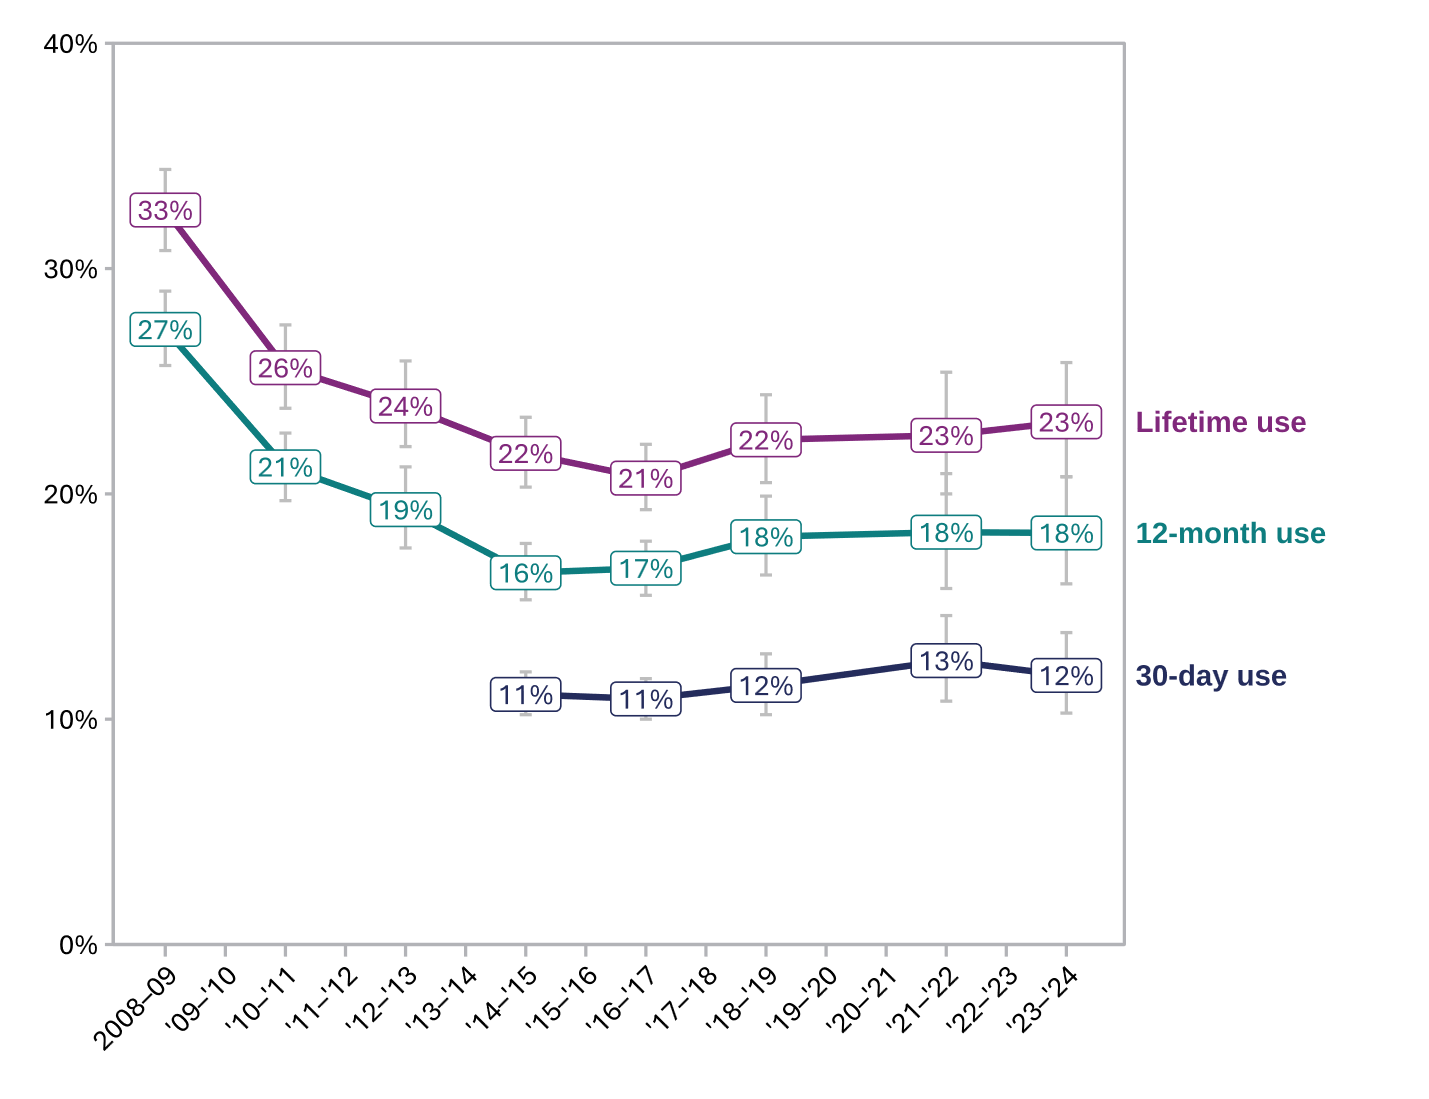
This figure shows trends in cannabis use among students over time, categorized as lifetime, 12-month, and 30-day use.
In the earliest school year, 33% of students reported lifetime cannabis use, 27% reported use in the past year in 2008-2009, and 11% in the past 30 days in 2014-2015. By the most recent school year, 2023-2024, these numbers remained relatively stable at 23%, 18%, and 12%, respectively.
Main takeaway: From 2021–22 to 2023–24, there was no statistical change in lifetime use, in past 12-month use, or in past 30-day use of cannabis among students.
Patterns of Use
Text description
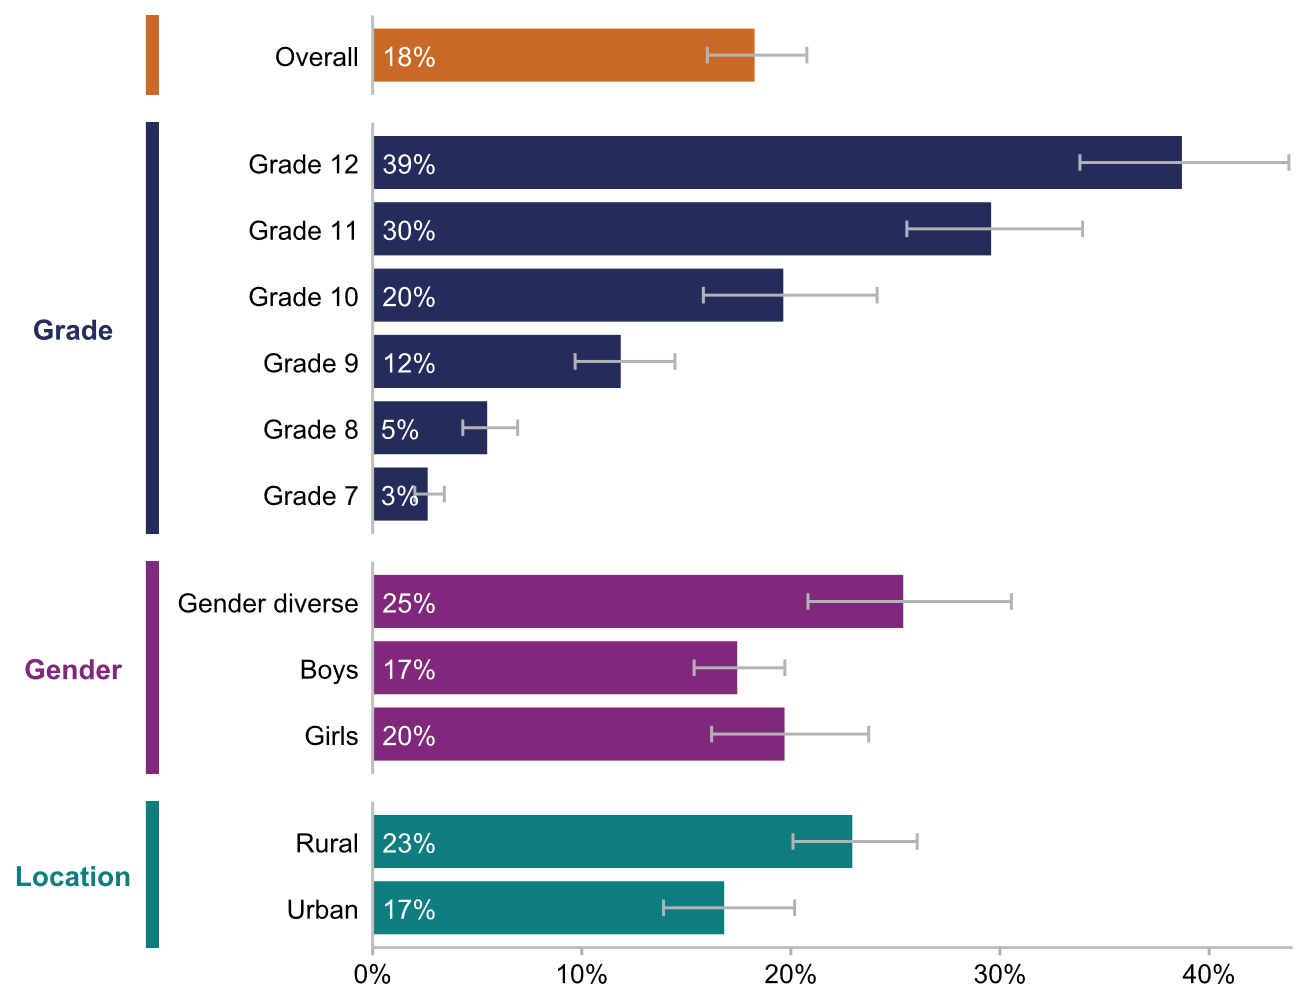
This figure looks at past 12-month cannabis use among student subgroups in the 2023-2024 school year.
Overall, 18% of students reported past 12-month cannabis use. This number increased in older grades, with 3% reporting use in Grade 7 and 39% in Grade 12. Past 12-month cannabis use was not different between genders and school locations.
Use and access
- On average, students used cannabis for the first time at 14 years old.
- Among all students, the most common methods of cannabis use were vaping liquid (9%), smoking (8%), and vaping dried (5%) cannabis.
- 49% of students rated cannabis as fairly or very easy to get.
- Among those who reported cannabis use, cannabis was most often obtained by being shared around a group of friends (40%), by buying or getting it from a friend or family member (22%), or by buying or getting it from someone else (12%).
Risks and harms
- 4% of students used cannabis most days (5+ days a week) in the past 30 days.
- In the previous 30 days, 2% of students had driven within two hours of smoking or vaping cannabis and 11% had been driven by someone who had been smoking or vaping in the previous two hours.
- 21% of students believed there was little to no risk of harm from smoking cannabis on a regular basis, while 19% believed the same about vaping cannabis and 26% about eating cannabis.
- Grade 12 students were more likely to believe there was little to no risk of regularly smoking (28%) or eating cannabis (36%) compared to Grade 7 students (17% and 17%, respectively).
Cigarettes and Vapes
Changes over time
Text description
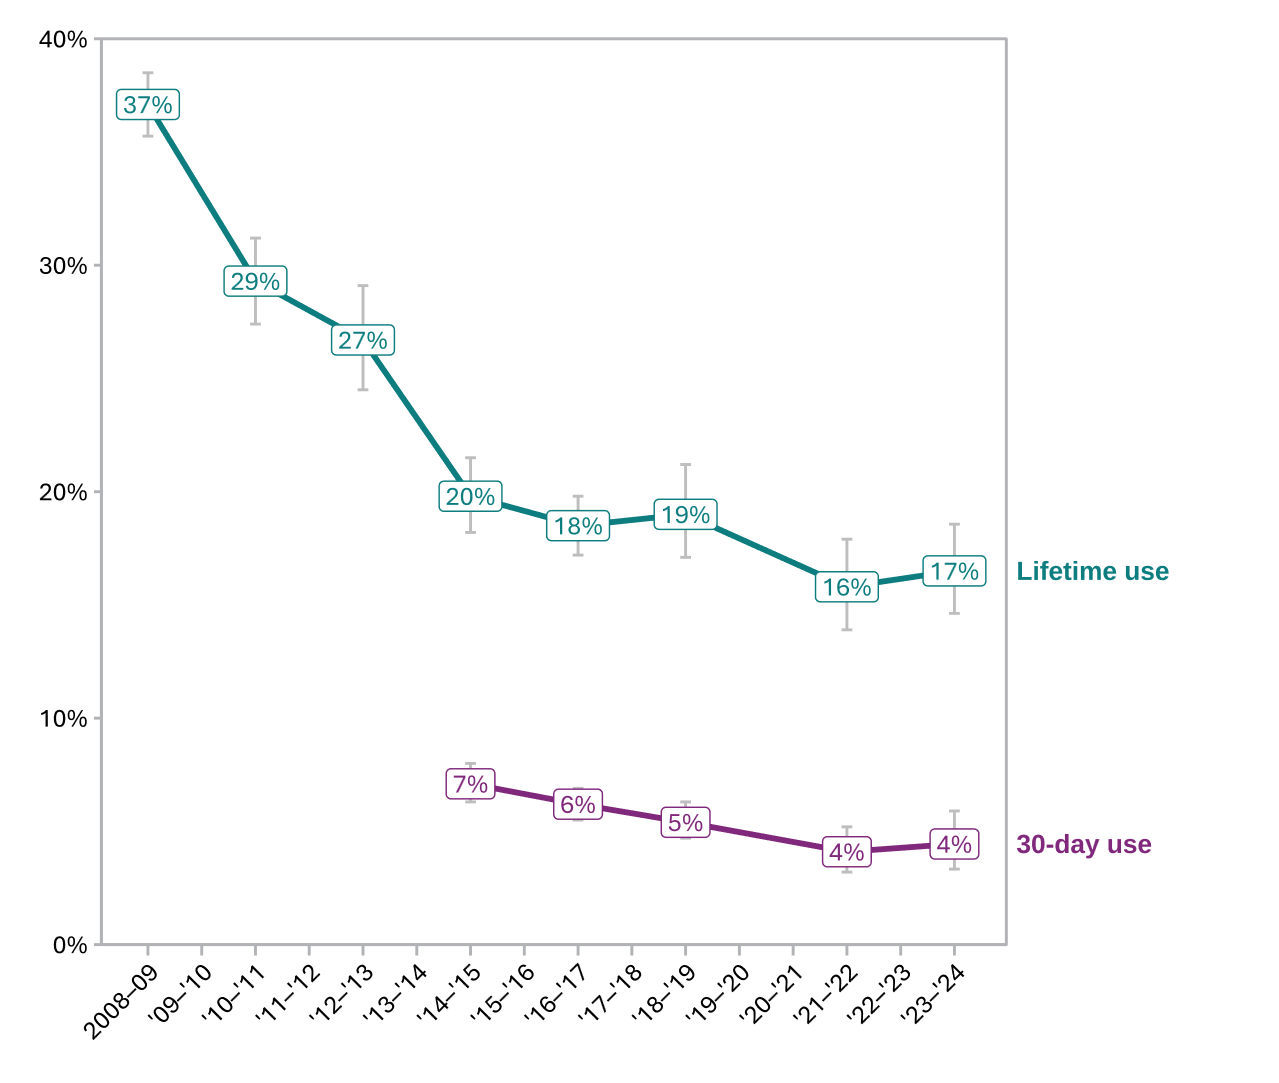
This figure shows trends in cigarette use among students over time, categorized as lifetime and 30-day use.
In the earliest school year, 37% of students reported lifetime cigarette use in 2008-2009 and 7% reported use in the past 30 days in 2014-2015. By the most recent school year, 2023-2024, these numbers fell to 17% and 4%, respectively.
Main takeaway: From 2021–22 to 2023–24, there was no statistical change in lifetime use or in past 30-day use of cigarettes among students.
Text description
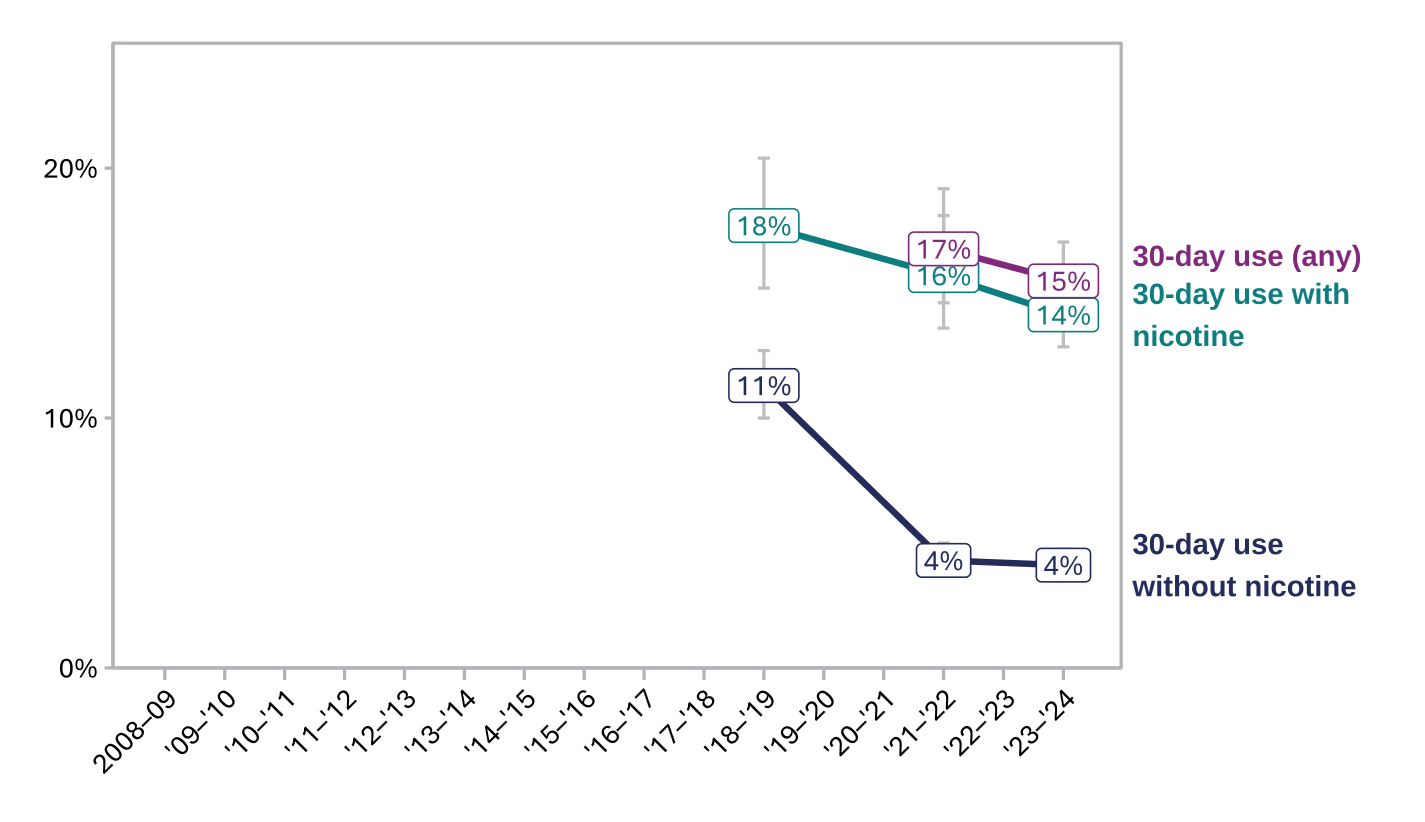
This figure shows trends in past 30-day non-cannabis e-cigarette and vape use among students over time, divided by type: any vape, vapes with nicotine, and vapes without nicotine.
In the most recent school year, 2023-2024, 15% of students reported past 30-day use of any vape, 14% of vapes with nicotine, and 4% of vapes without nicotine. These numbers have remained largely steady since 2018-2019, except for students' use of vapes without nicotine, which fell from 11% to 4%.
Main takeaway: From 2021–22 to 2023–24, there was no statistical change in past 30-day vaping, use of vapes with nicotine, or use of vapes without nicotine among students.
Patterns of Use
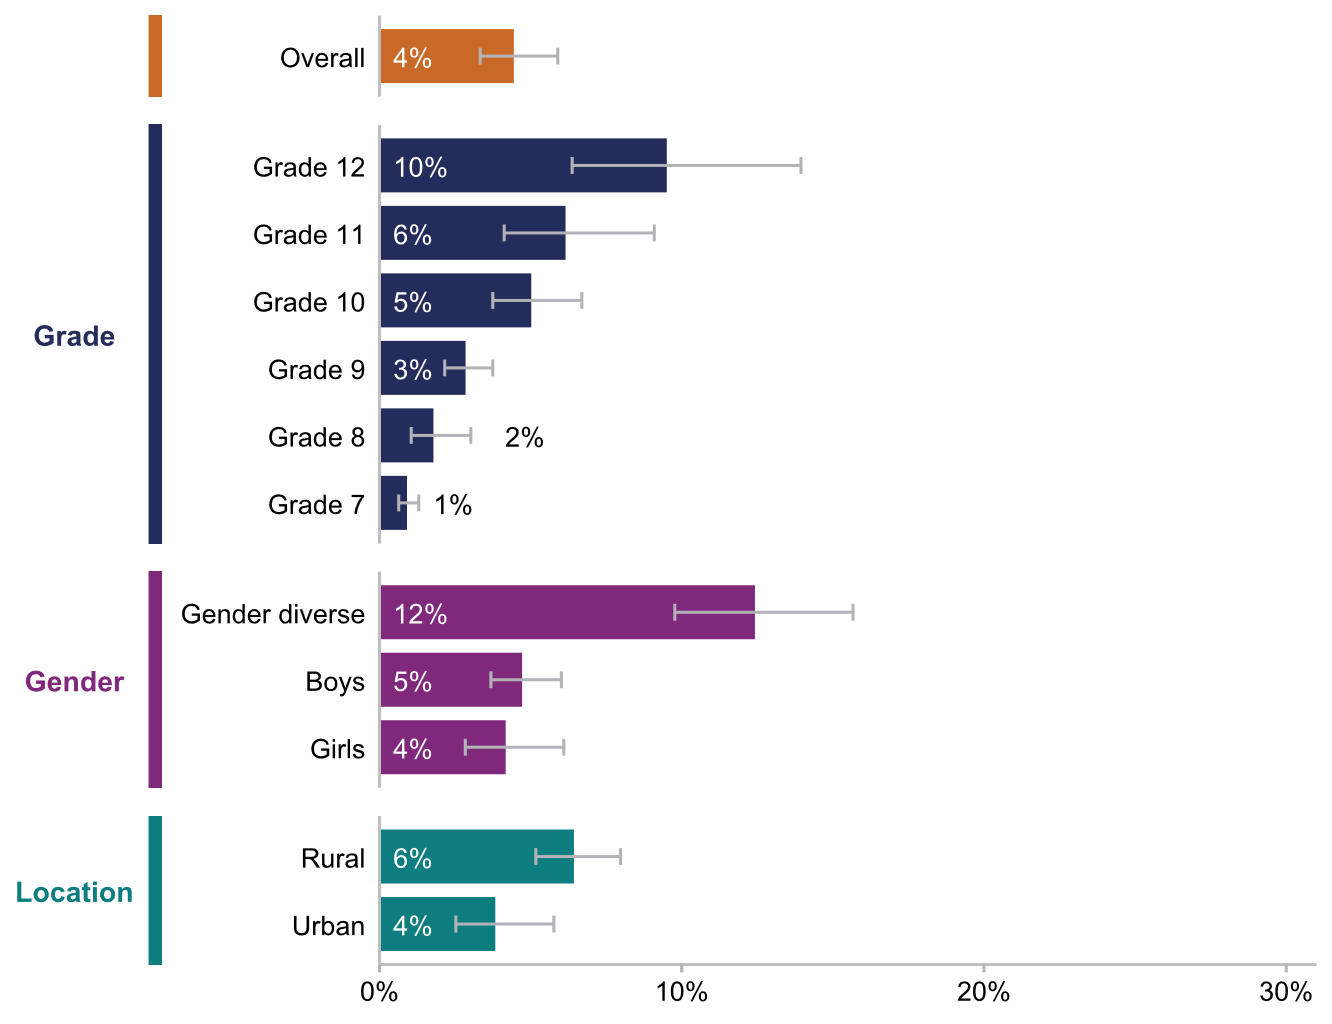
Text description
This figure looks at past 30-day cigarette use among student subgroups in the 2023-2024 school year.
Overall, 4% of students reported past 30-day cigarette use. This number increased in older grades, with 1% reporting use in Grade 7 and 10% in Grade 12. It was also higher among gender-diverse students, at 12%, compared to 5% and 4% among boys and girls. Past 12-month cigarette use was not different between school locations.
Text description
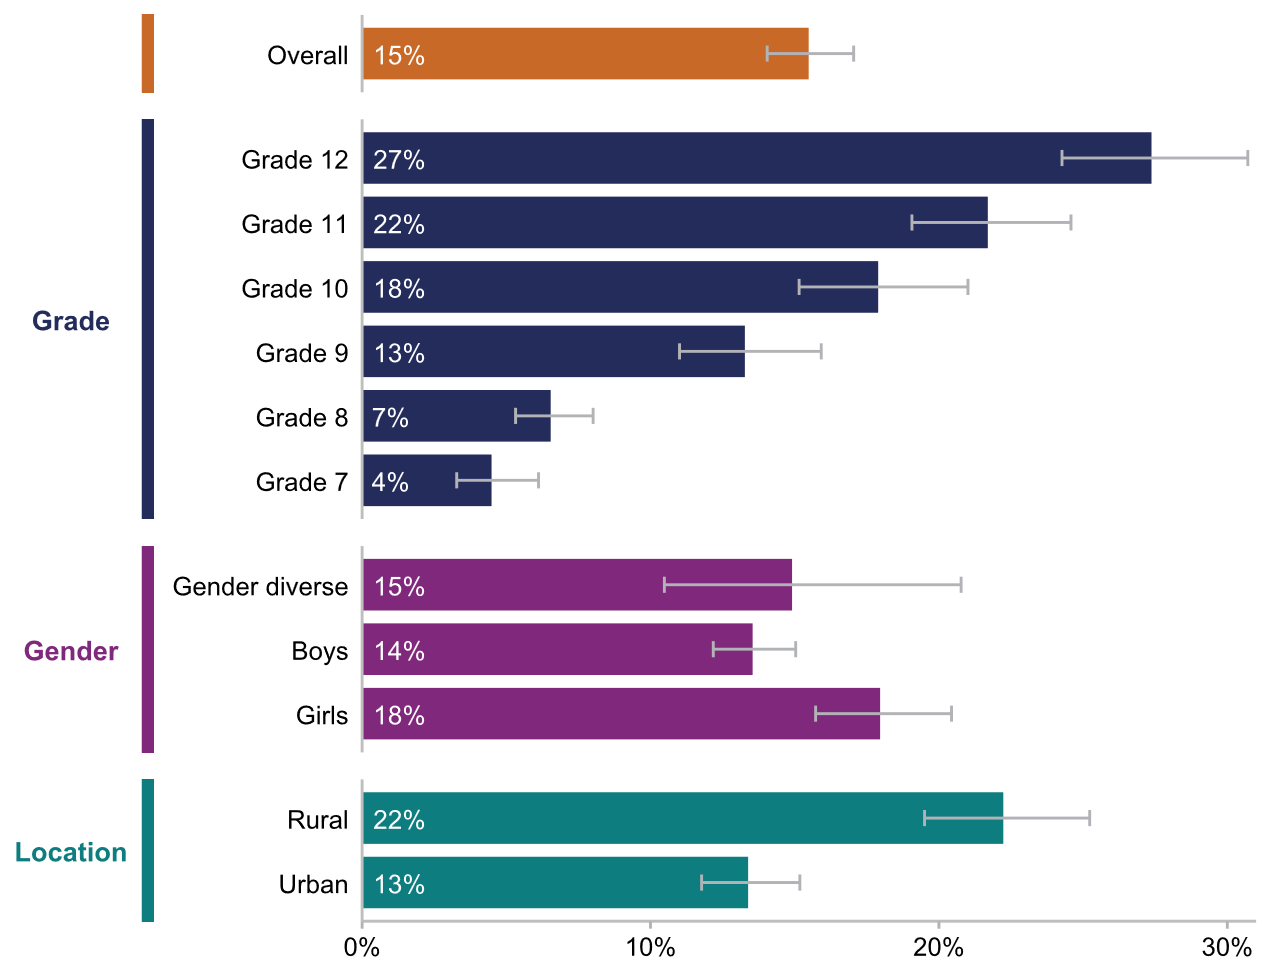
This figure looks at past 30-day use of any non-cannabis vape among student subgroups in the 2023-2024 school year.
Overall, 15% of students reported past 30-day use. This number increased in older grades, with 4% reporting use in Grade 7 and 27% in Grade 12. It was also higher among students in rural areas, at 22%, compared to 13% in urban areas. Past 12-month use was not different between genders.
Risks and harms
- 15% of students believed there was little to no risk of harm from regularly smoking cigarettes, while 16% believed the same about vapes with nicotine, and 39% about vapes without nicotine.
- Grade 7 students were more likely to believe there was little to no risk of regularly smoking cigarettes (18%) and using vapes with nicotine (19%) compared to Grade 12 students (12% and 14%, respectively). For vapes without nicotine, there was no difference across grades (39%).
Pharmaceuticals
The survey asks students about their use of specific prescription medications and over-the-counter drugs for non-recommended purposes (including non-medical reasons or reasons other than those intended by a healthcare provider). Prescription medications include ADHD medication, sedatives, and opioids. Over-the-counter drugs include sleeping aids, stimulants, cold and cough medicine, Gravol®, and, in 2023–24, non-prescription codeine.
Changes over time
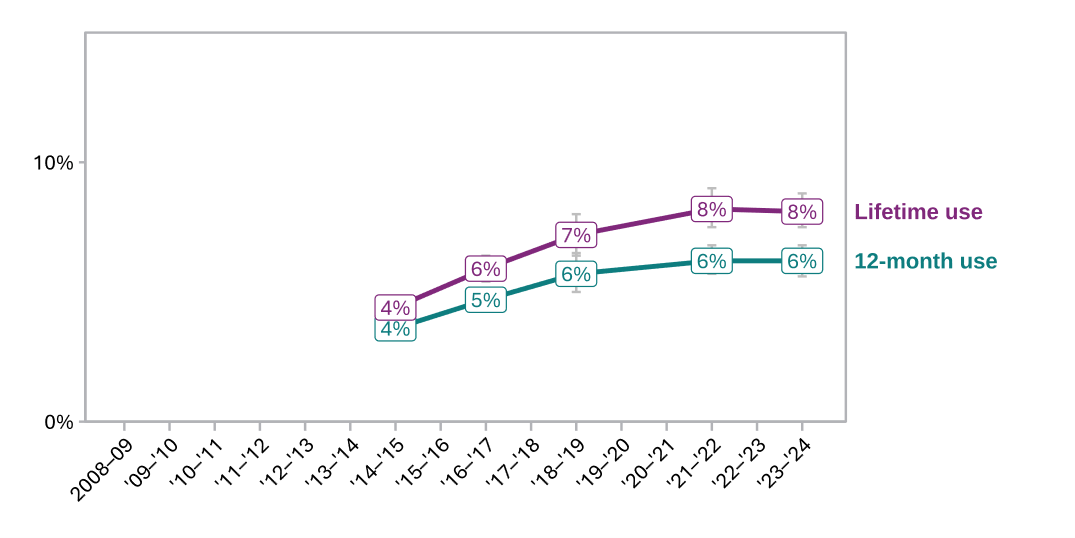
Text description
This figure shows trends in prescription medication use for non-recommended purposes among students over time, categorized as lifetime and 12-month use.
In the earliest school year, 2014-2015, 4% of students reported lifetime use and 4% reported use in the past 12 months. By the most recent school year, 2023-2024, these numbers increased to 8% and 6%, respectively.
Main takeaway: From 2021–22 to 2023–24, there was no statistical change in lifetime use or in past 12-month use of prescription medications for non-recommended purposes among students.
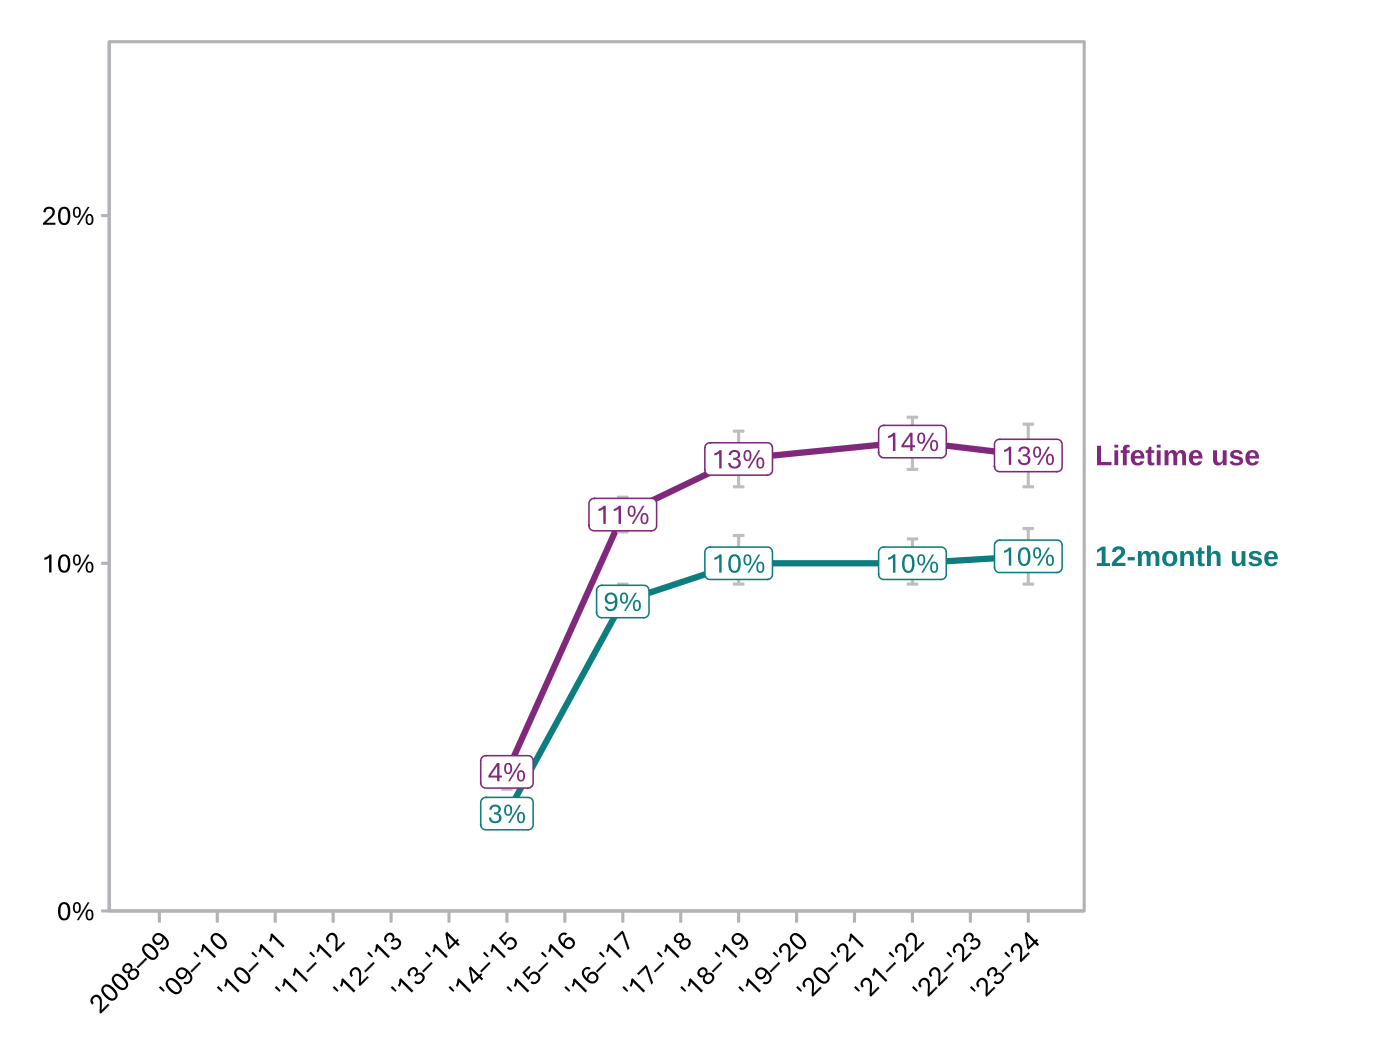
Text description
This figure shows trends in over-the-counter medication use for non-recommended purposes among students over time, categorized as lifetime and 12-month use.
In the earliest school year, 2014-2015, 4% of students reported lifetime use and 3% reported use in the past 12 months. By the most recent school year, 2023-2024, these numbers climbed to 13% and 10%, respectively.
Main takeaway: From 2021–22 to 2023–24, there was no statistical change in lifetime use or in past 12-month use of over-the-counter medications for non-recommended purposes among students, including sleeping aids, stimulants, cold and cough medicine, and Gravol®.
When including low-dose codeine, which was newly added this cycle, lifetime use of over-the-counter drugs in 2023–24 was 15%, while past 12-month use was 12%.
Patterns of Use
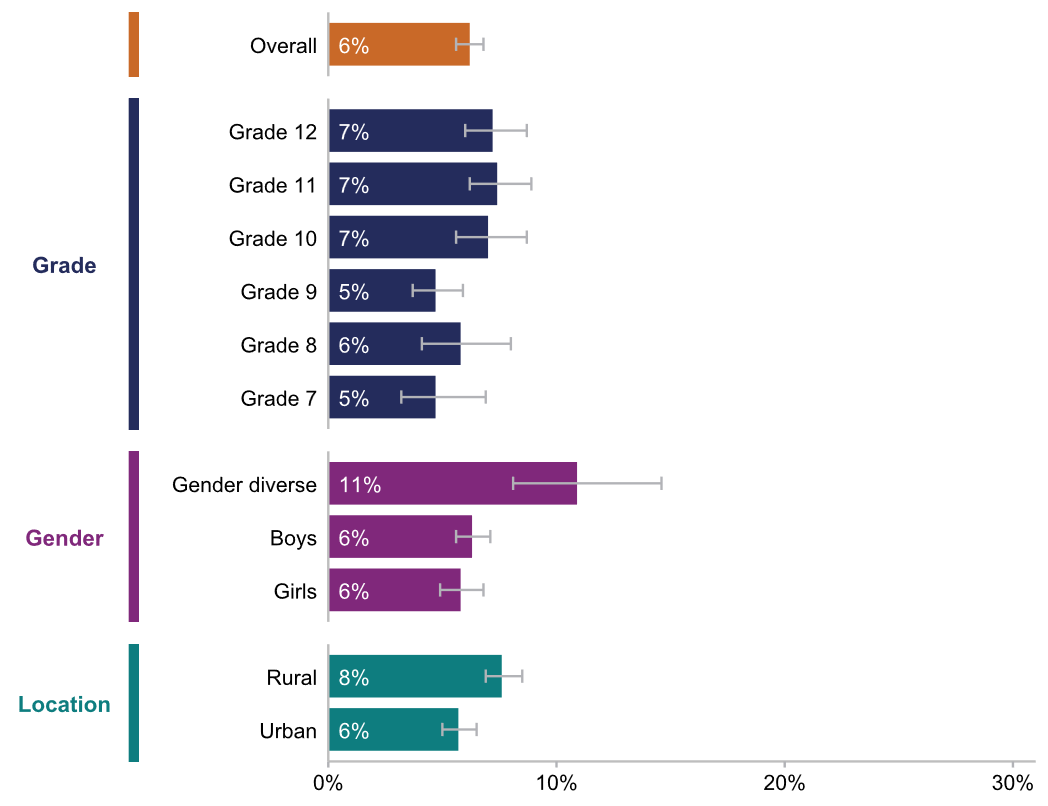
Text description
This figure looks at past 12-month prescription medication use for non-recommended purposes among student subgroups in the 2023-2024 school year.
Overall, 6% of students reported past 12-month use. This number was higher among gender-diverse students, at 11%, compared to 6% among both boys and girls, as well as among those in rural areas, at 8%, compared to 6% among those in urban areas. Past 12-month use was not different between grades.
Text description
This figure looks at past 12-month over-the-counter medication use for non-recommended purposes among student subgroups in the 2023-2024 school year.
Overall, 12% of students reported past 12-month use, with no differences by grade, gender, or school location.
Use and access
- In the previous 12 months, 2% of students had used ADHD medication for non-recommended purposes, 2% had used sedatives for non-recommended purposes, and 5% had used opioids for non-recommended purposes.
- 26% of students rated prescription pain relievers fairly or very easy to get, while 35% said the same about ADHD medication and 37% about sedatives.
- Among those who reported non-recommended opioid use, the most common non-recommended purposes for using opioids were to manage physical pain (21%), to help them sleep (13%), or to feel numb (11%). Additionally, they most often obtained opioids from unspecified sources (39%), from their own prescription (16%), or by buying or getting them from someone else, like a dealer (14%).
- Among all students, the over-the-counter drugs with the highest non-recommended use in the past 12 months were low-dose codeine (7%), dextromethorphan (6%), and sleeping medicine (5%).
Risks and harms
- 14% of students believed there was little to no risk of harm from regularly using prescription medication to get high, while 9% believed the same about specifically using prescription opioids.
- Grade 7 students were more likely to believe there was little to no risk of regularly using prescription medication to get high (20%) and of regularly using prescription opioids to get high (14%), compared to Grade 12 students (12% and 7%, respectively).
Illegal Drugs
This section presents survey findings on students' use of specific illegal drugs. Illegal drugs covered in the survey include amphetamines, ecstasy, hallucinogens, salvia, heroin, cocaine, synthetic cannabinoids, benzylpiperazine (BZP), bath salts, and tryptamines.
Changes over time
Text description
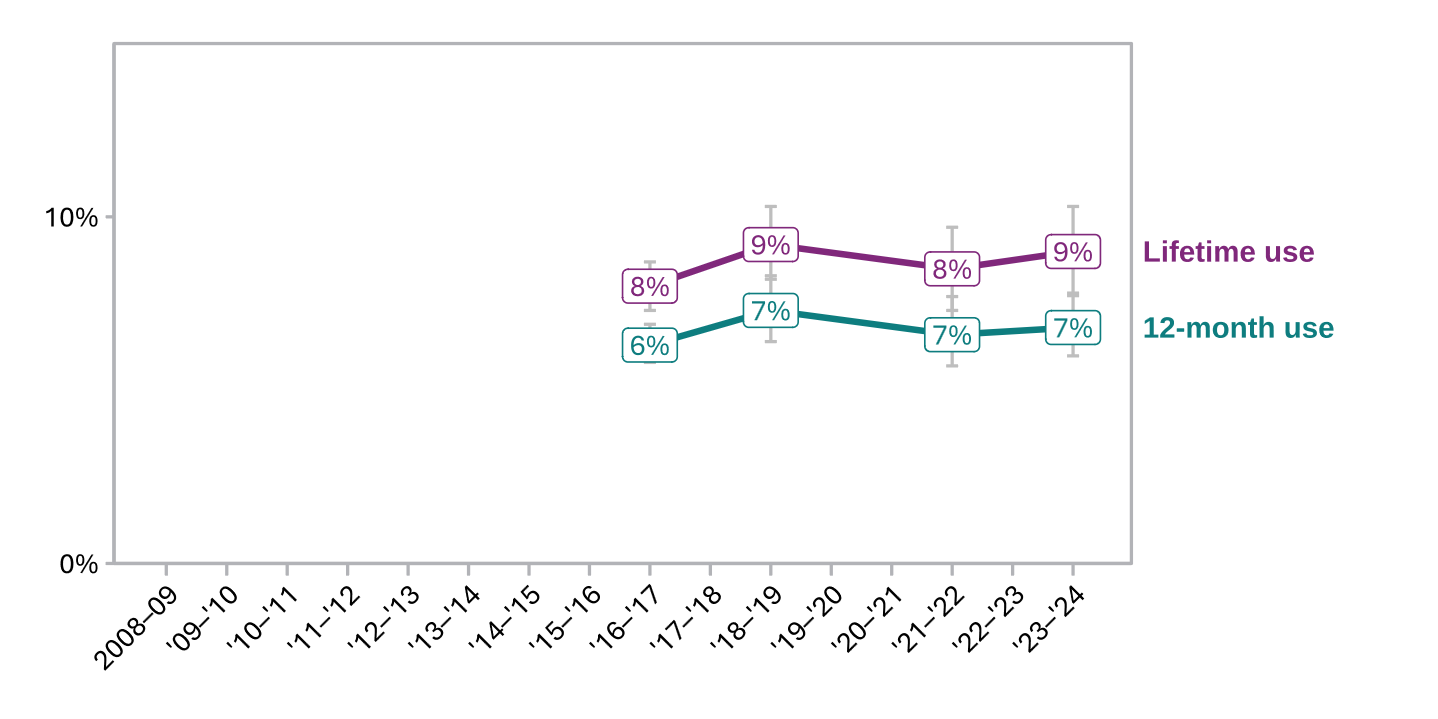
This figure shows trends in illegal drug use among students over time, categorized as lifetime and 12-month use.
In the earliest school year, 2016-2017, 8% of students reported lifetime use and 6% reported use in the past 12 months. By the most recent school year, 2023-2024, these numbers remained steady at 9% and 7%, respectively.
Main takeaway: From 2021–22 to 2023–24, there was no statistical change in lifetime use or in past 12-month use of illegal drugs among students.
Patterns of Use
Text description
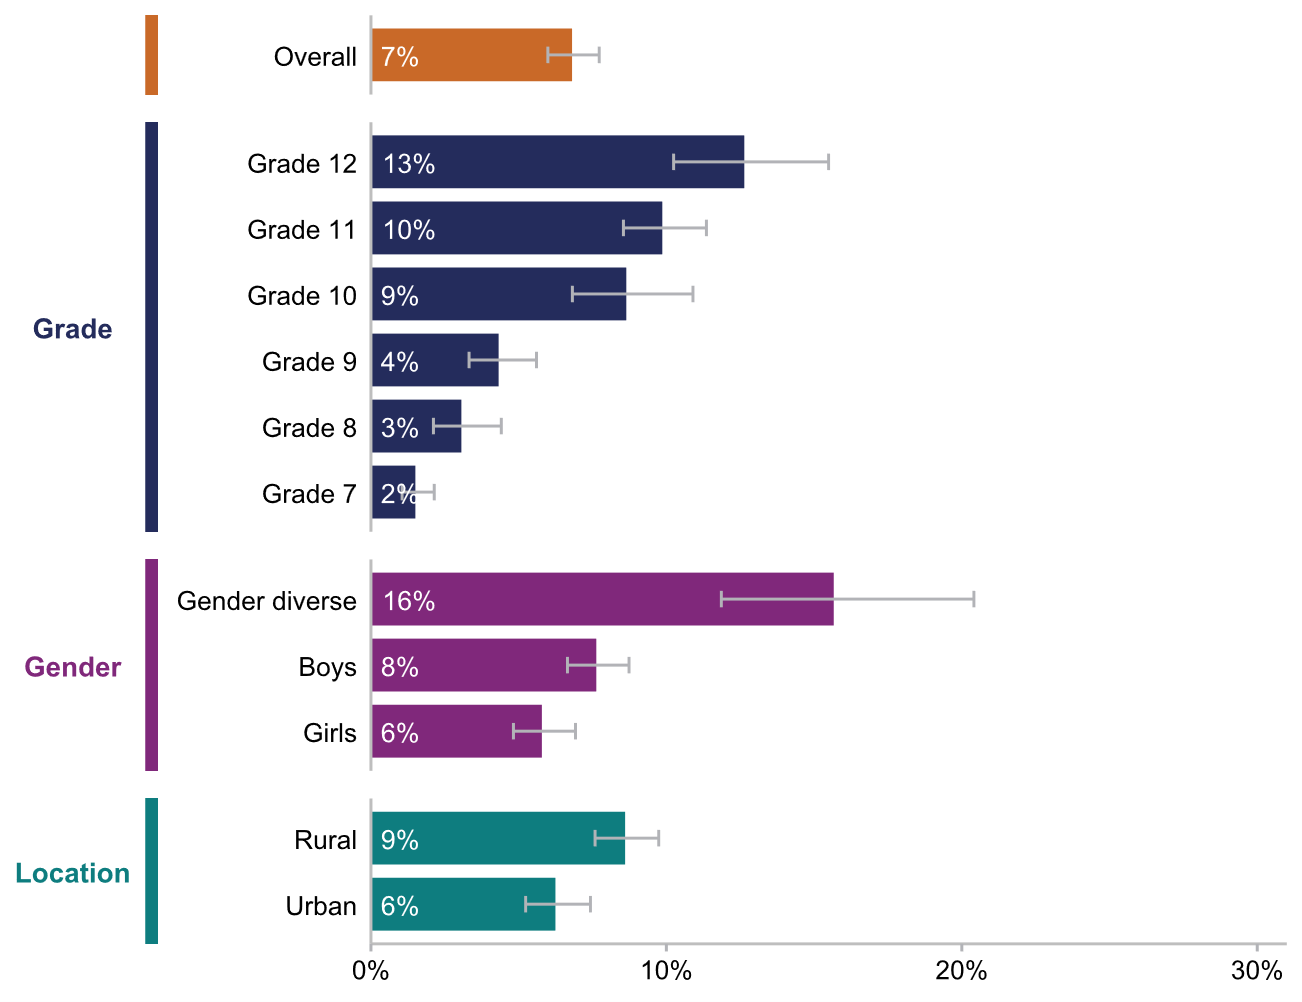
This figure looks at past 12-month illegal drug use among student subgroups in the 2023-2024 school year.
Overall, 7% of students reported past 12-month use. This number increased by grade, with 2% reporting use in Grade 7 and 13% in Grade 12. It was also higher among gender-diverse students, at 16%, compared to 8% and 6% among boys and girls, respectively, and among those in rural areas, at 9%, compared to 6% among students in urban areas.
Use and access
- Among all students, the most commonly used illegal drugs were hallucinogens (4%), synthetic cannabinoids (4%), and ecstasy (1%).
- 19% of students rated hallucinogens fairly or very easy to get, while 13% reported the same about cocaine, 10% about ecstasy, 10% about heroin, and 9% about amphetamines.
Risks and harms
- 1% of students had 911 called for them, visited an emergency room, or been hospitalized in the past 12 months because of their drug use. 3% reported experiencing this in their lifetime as a result of any substance use.
- Students were most likely to look for information on the risks and harms of alcohol and drug use from official websites like government or public health (26%), from health class or other classes at school (21%), or from healthcare professionals (14%).
Polysubstance Use
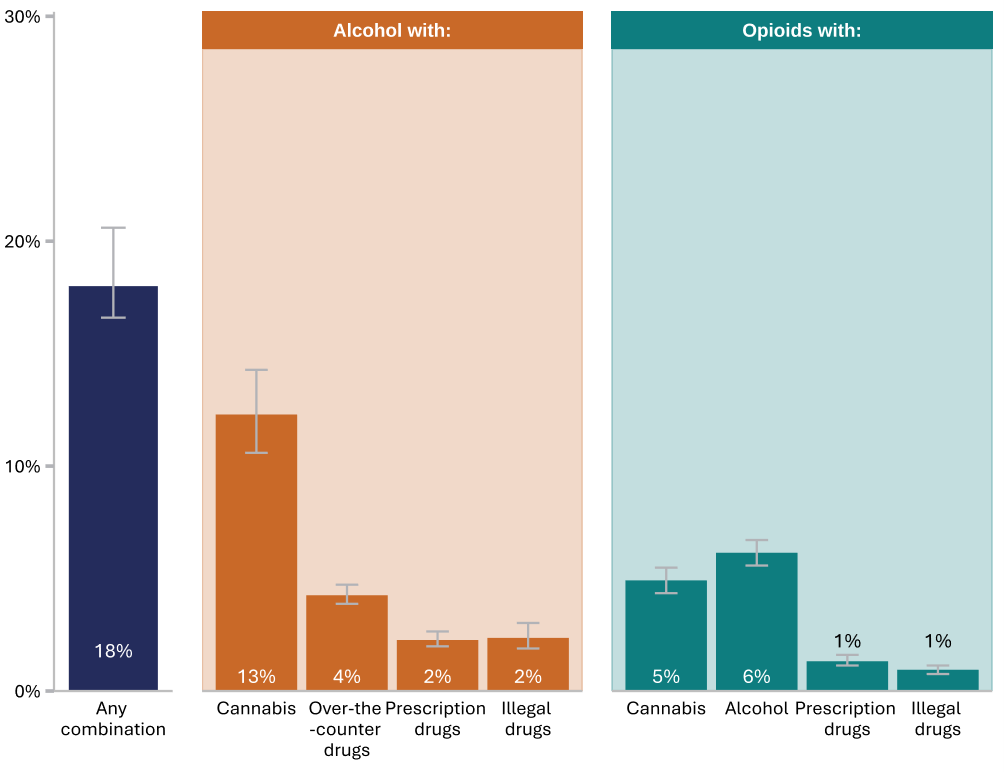
Text description
This figure shows polysubstance use among students in the past 12 months in the 2023-2024 school year, overall and by combinations with alcohol or opioids.
In the past 12 months, 18% of students reported engaging in polysubstance use, meaning they used two or more substances in one occasion. The substances most commonly used together were alcohol with cannabis, at 13%, followed by opioids and alcohol, at 6%.
Main takeaway: 22% of students reported using two drugs on the same occasion in their lifetime, while 18% did so in the past 12 months.
Patterns of Use
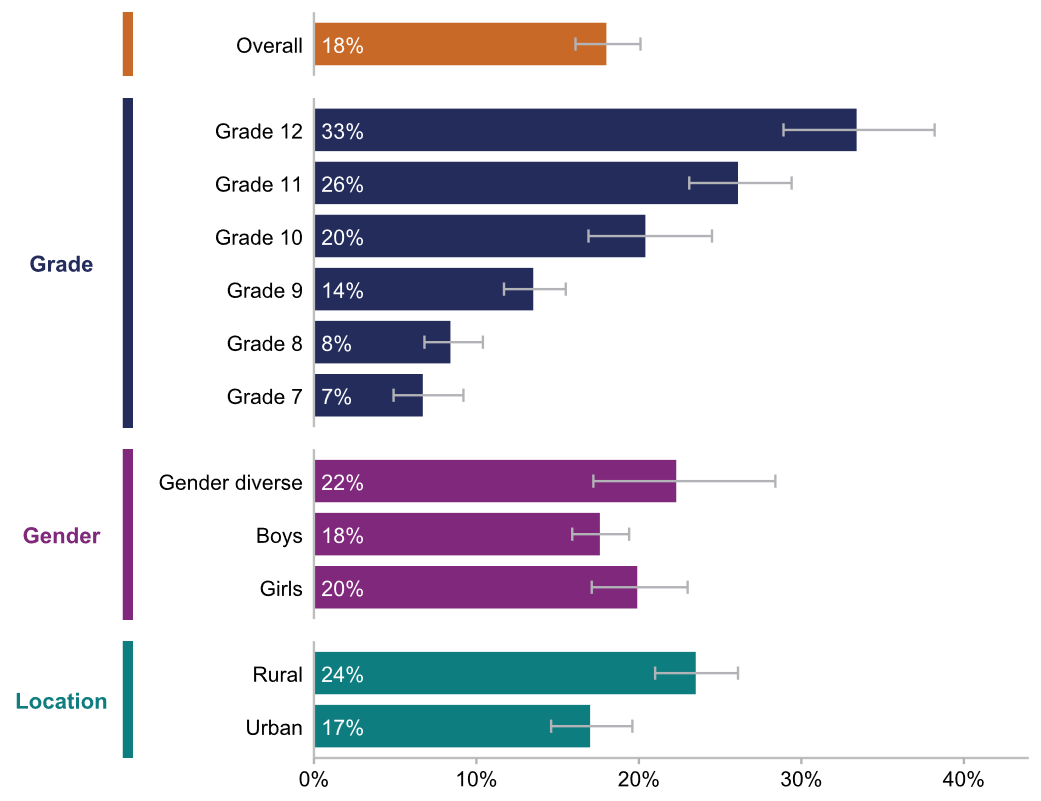
Text description
This figure looks at past 12-month polysubstance use among student subgroups in the 2023-2024 school year.
Overall, 18% of students reported past 12-month polysubstance use. This number increased by grade, with 7% reporting polysubstance use in Grade 7 and 33% in Grade 12. It was also higher among students in rural areas, at 24%, compared to 17% among students in urban areas. Past 12-month use was not different by gender.
Risks and harms
- 10% of students believed there was little to no risk of harm from regularly engaging in polysubstance use.
- Grade 7 students were more likely to believe there was little to no risk of regularly engaging in polysubstance use (13%) compared to Grade 12 students (7%).
Reference
- Footnote 1
-
The survey was previously called the Youth Smoking Survey (YSS; pre-2014) and the Canadian Student Tobacco, Alcohol and Drugs Survey (CSTADS; 2014–22).
- Footnote 2
-
Quebec did not participate in CSADS 2023-24.
- Footnote 3
-
Location refers to that of the school the student attended when the survey was completed.
- Footnote 4
-
"30-day use (any)" includes using vapes with nicotine, without nicotine, and with unknown content. It does not include vapes with cannabis.
- Footnote 5
-
"30-day use (any)" includes using vapes with nicotine, without nicotine, and with unknown content. It does not include vapes with cannabis.