
Spotlight : The evolution of Fentanyl in Canada over the past 11 years

Download in PDF format
(1.2 MB, 10 pages)
Organization: Health Canada
Date published: March 2023
Cat.: H139-46/2022E-PDF
ISBN: 978-0-660-46037-6
Pub.: 220521
On this Page
- Drug Analysis Service
- Summary
- Context
- Aim
- Fentanyl and Canada's opioid crisis
- Data limitations
- Analytical methods
- Geographical locations
- Physical description
- Co-occurring substances
- Conclusion
- Suggested citation
Drug Analysis Service
Health Canada's Drug Analysis Service (DAS) operates laboratories across Canada that analyze suspected illegal drugs seized by Canadian law enforcement agencies. These statistics are based on samples analyzed and may not be representative of all substances seized in Canada, nor of what drugs are circulating on the market. The data below represent the number of times a substance was identified in submitted samples. A single sample may contain more than one substance. Categorization of substances is based on the Controlled Drugs and Substances Act (CDSA).
Summary
- Between January 2012 and December 2022, Fentanyl has been identified in 77,141 samples submitted to the Drug Analysis Service (DAS) by Canadian law enforcement agencies.
- A majority of Fentanyl identifications were reported from samples submitted by law enforcement agencies in Ontario and British Columbia.
- 75% of exhibits containing Fentanyl were in powder form.
- Fentanyl has most often been detected with co-occurring substances.
- The number of co-occurring substances with Fentanyl has increased across the years.
- Since 2020, sedative/hypnotics have increasingly been co-occurring with Fentanyl.
Context
Fentanyl was first identified in Canada in 1989 in exhibits submitted by law enforcement agencies. Since 2016, there has been a sharp increase in the number of Fentanyl identifications in Canada (Figure 1, Table 1). Between January 2012 and December 2022, Fentanyl has been identified in 77,141 exhibits submitted for analysis to the Drug Analysis Service (DAS).
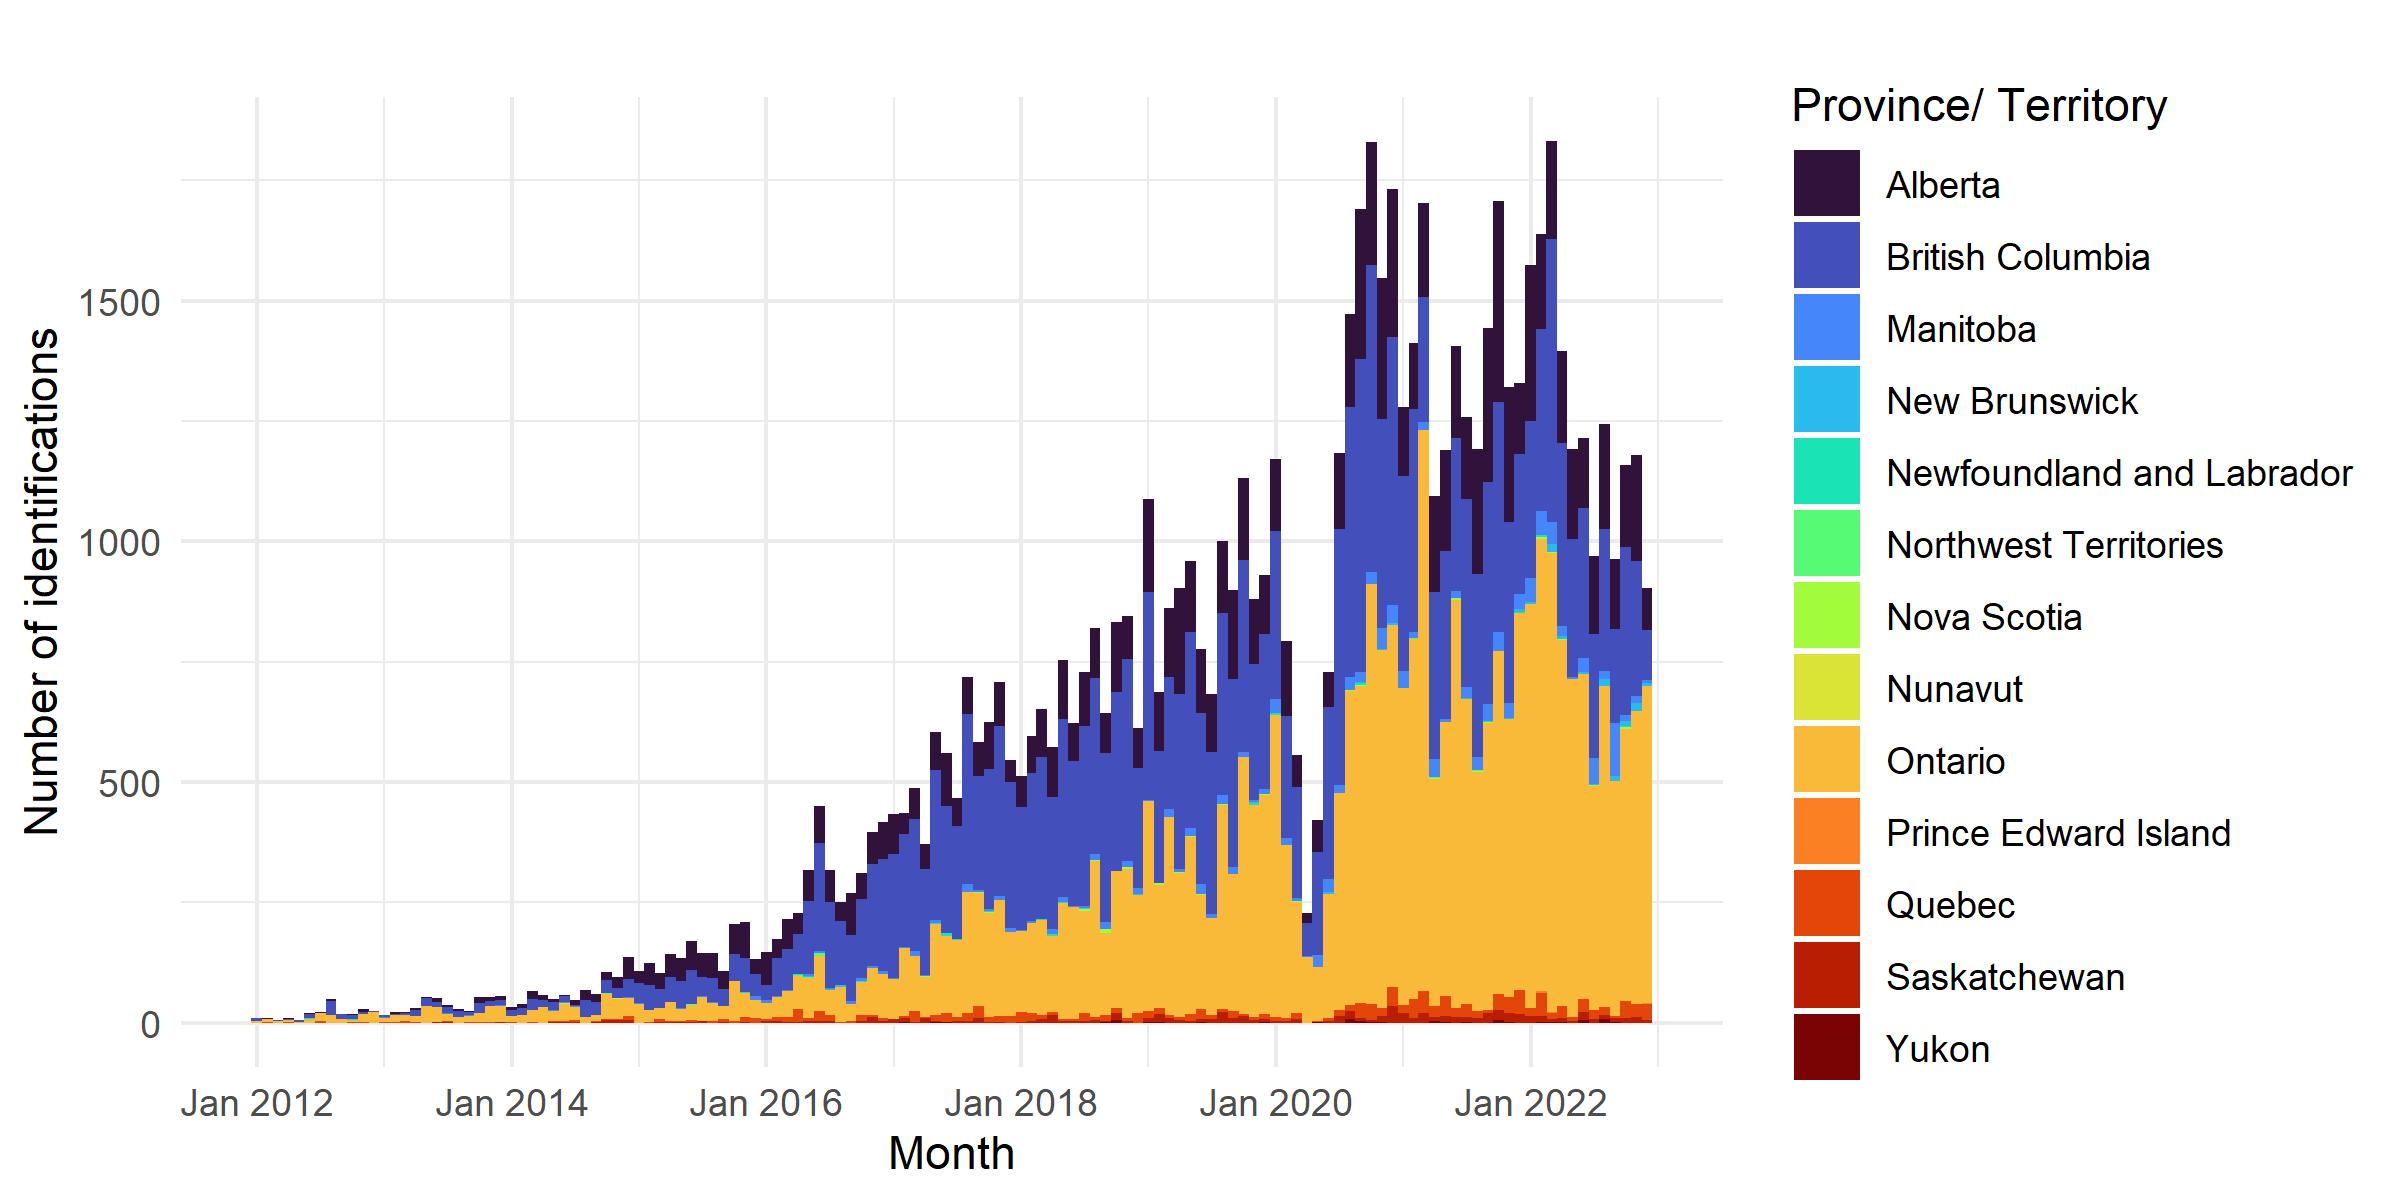
* Decrease of Fentanyl identifications in April 2020 is due to a number of factors related to the COVID-19 pandemic.
The data presented in this figure is available in Table 1
Aim
The aim of this spotlight report is to characterize trends in Fentanyl identifications across Canada since 2012 and draw a more comprehensive picture of Fentanyl in Canada based on exhibits seized and submitted to DAS for analysis by law enforcement agencies.
Fentanyl and Canada's opioid crisis
- Fentanyl is a synthetic opioid that is 50 to 100 times more potent than morphine and has been a key contributor to the opioid crisis in Canada. It is prescribed to help control severe pain, especially after surgery Footnote 1.
- The sale, possession and production of Fentanyl and its analogues is illegal (unless authorized for medical, scientific or industrial purposes) and controlled under Schedule I of the Controlled Drugs and Substances Act Footnote 1.
- The fast-acting drug Naloxone can be used to temporarily reverse the effects of Fentanyl (opioids) overdose Footnote 2.
- Fentanyl is a major contributor to the opioid crisis in Canada; in 2021, 86% of all accidental apparent opioid toxicity death involved Fentanyl and 32% of all opioid-related poisoning hospitalizations involved Fentanyl or Fentanyl analogues Footnote 3.
- The opioid crisis has had a significant human toll in Canada with an estimated 30,843 apparent opioid toxicity deaths and 32,319 opioid-related poisoning hospitalizations reported between January 2016 and March 2022 in Canada Footnote 3.
- During the first two years of the COVID-19 pandemic (April 2020 to March 2022), the number of apparent opioid toxicity deaths increased by 91% and the number of opioid-related poisoning hospitalizations increased by 24% compared to the two previous years (April 2018 to March 2020) Footnote 3.
Data limitations
This report is based on data made available by the Drug Analysis Service (DAS) which regularly analyses suspected illegal drugs seized by Canadian law enforcement agencies and samples submitted by public health partners. Some limitations govern the present data. First, law enforcement agencies submit samples for laboratory analysis based on investigation needs. Thus, analyzed samples may not be representative of substances circulating on the market as a number of factors may influence substances submitted by Canadian law enforcement agencies and reporting, such as increased awareness of substances and law enforcement capacities and priorities. Additionally, the DAS is only required to report substances that are controlled under the Controlled Drugs and Substances Act. As such, it is possible that not all noncontrolled substance were reported.
Analytical methods
Results of analyzed samples submitted by Canadian law enforcement agencies are reported in a centralized database called the Laboratory Information Management System (LIMS). The presented data were retrieved from the LIMS and covers the period between January 1, 2012 and December 31, 2022, inclusively. Fentanyl identifications are defined as the identification of Fentanyl in a unique exhibit.
The analysis of presented data was performed in R4.0.2. Data wrangling and visualization was performed using the tidyverse package Footnote 4. Time trends were computed on a monthly basis and 3-month rolling averages are plotted in line plots.
Geographical locations
From 2012 to 2022, the majority of Fentanyl identifications originated from sample submitted by law enforcement agencies in Ontario (43%), British Columbia (36%) and Alberta (16%) (Table 1). In 2016, there was an increase in Fentanyl identifications from samples submitted by law enforcement agencies in British Columbia. While samples containing Fentanyl from British Columbia represented 35% of all Fentanyl samples in Canada in 2015, they accounted for almost half (49%) of all Fentanyl samples in Canada in 2016. In 2021 and 2022, the majority of samples containing Fentanyl were from samples submitted by Ontario's law enforcement agencies.
| Province/Territory | Year | |||||||||||||||||||||
|---|---|---|---|---|---|---|---|---|---|---|---|---|---|---|---|---|---|---|---|---|---|---|
| 2012 | 2013 | 2014 | 2015 | 2016 | 2017 | 2018 | 2019 | 2020 | 2021 | 2022 | ||||||||||||
| n | % | n | % | n | % | n | % | n | % | n | % | n | % | n | % | n | % | n | % | n | % | |
Alberta |
18 |
8.3 |
60 |
13.5 |
182 |
22.5 |
565 |
32.8 |
746 |
21.4 |
874 |
13.4 |
1,167 |
14.3 |
1,843 |
17.1 |
2,048 |
15.3 |
2,666 |
16.3 |
2,250 |
14.7 |
British Columbia |
76 |
35.0 |
124 |
27.8 |
242 |
29.9 |
608 |
35.3 |
1,713 |
49.1 |
3,334 |
51.0 |
3,970 |
48.5 |
4,211 |
39.0 |
4,842 |
36.3 |
4,521 |
27.7 |
3,755 |
24.6 |
Manitoba |
2 |
0.9 |
8 |
1.8 |
5 |
0.6 |
15 |
0.9 |
42 |
1.2 |
63 |
1.0 |
86 |
1.1 |
131 |
1.2 |
273 |
2.0 |
308 |
1.9 |
411 |
2.7 |
New Brunswick |
- |
- |
- |
- |
- |
- |
1 |
0.1 |
9 |
0.3 |
- |
- |
4 |
<0.1 |
4 |
<0.1 |
11 |
0.1 |
9 |
0.1 |
92 |
0.6 |
Newfoundland and Labrador |
5 |
2.3 |
- |
- |
- |
- |
1 |
0.1 |
5 |
0.1 |
15 |
0.2 |
9 |
0.1 |
5 |
<0.1 |
9 |
0.1 |
5 |
<0.1 |
8 |
0.1 |
Northwest Territories |
- |
- |
- |
- |
4 |
0.5 |
3 |
0.2 |
11 |
0.3 |
- |
- |
- |
- |
- |
- |
- |
- |
3 |
<0.1 |
- |
0.0 |
Nova Scotia |
- |
- |
1 |
0.2 |
- |
- |
2 |
0.1 |
- |
- |
5 |
0.1 |
21 |
0.3 |
13 |
0.1 |
11 |
0.1 |
15 |
0.1 |
13 |
0.1 |
Nunavut |
- |
- |
- |
- |
3 |
0.4 |
- |
- |
- |
- |
- |
- |
- |
- |
- |
- |
- |
- |
- |
- |
- |
0.0 |
Ontario |
106 |
48.8 |
235 |
52.7 |
325 |
40.2 |
467 |
27.1 |
809 |
23.2 |
2,054 |
31.4 |
2,730 |
33.3 |
4,344 |
40.2 |
5,854 |
43.9 |
8,258 |
50.6 |
8,324 |
54.5 |
Prince Edward Island |
- |
- |
- |
- |
- |
- |
- |
- |
- |
- |
- |
- |
- |
- |
- |
- |
2 |
<0.1 |
- |
- |
7 |
0.0 |
Quebec |
10 |
4.6 |
14 |
3.1 |
26 |
3.2 |
45 |
2.6 |
118 |
3.4 |
141 |
2.2 |
130 |
1.6 |
128 |
1.2 |
176 |
1.3 |
350 |
2.1 |
275 |
1.8 |
Saskatchewan |
- |
- |
4 |
0.9 |
22 |
2.7 |
14 |
0.8 |
38 |
1.1 |
49 |
0.7 |
65 |
0.8 |
110 |
1.0 |
108 |
0.8 |
177 |
1.1 |
108 |
0.7 |
Yukon |
- |
- |
- |
- |
- |
- |
- |
- |
- |
- |
3 |
<0.1 |
6 |
0.1 |
6 |
0.1 |
15 |
0.1 |
14 |
0.1 |
18 |
0.1 |
Total |
217 |
100 |
446 |
100 |
809 |
100 |
1,721 |
100 |
3,491 |
100 |
6,538 |
100 |
8,188 |
100 |
10,795 |
100 |
13,349 |
100 |
16,326 |
100 |
15,261 |
100 |
ⴕ <0.1 indicates that the proportion of identifications is smaller than 0.1% |
||||||||||||||||||||||
Physical description
Since 2019, over 85% of exhibits containing Fentanyl were in powder form. Between 2012 and 2016, however, Fentanyl was predominantly identified in tablet form or in a material (Figure 2).
The majority of Fentanyl derma patches analysed by the DAS were from Ontario (87%) and Quebec (11%). Fentanyl found in a material were primarily from exhibits from British Columbia (74%) and Alberta (19%). Finally, 42% of Fentanyl in tablet form were from Alberta, 32% from British Columbia and 16% from Ontario. Fentanyl in tablets form was predominantly found in the provinces of Alberta and British Columbia (data not shown).
Nevertheless, in 2022, Fentanyl in powder appears to be the dominant form in most provinces and territories.
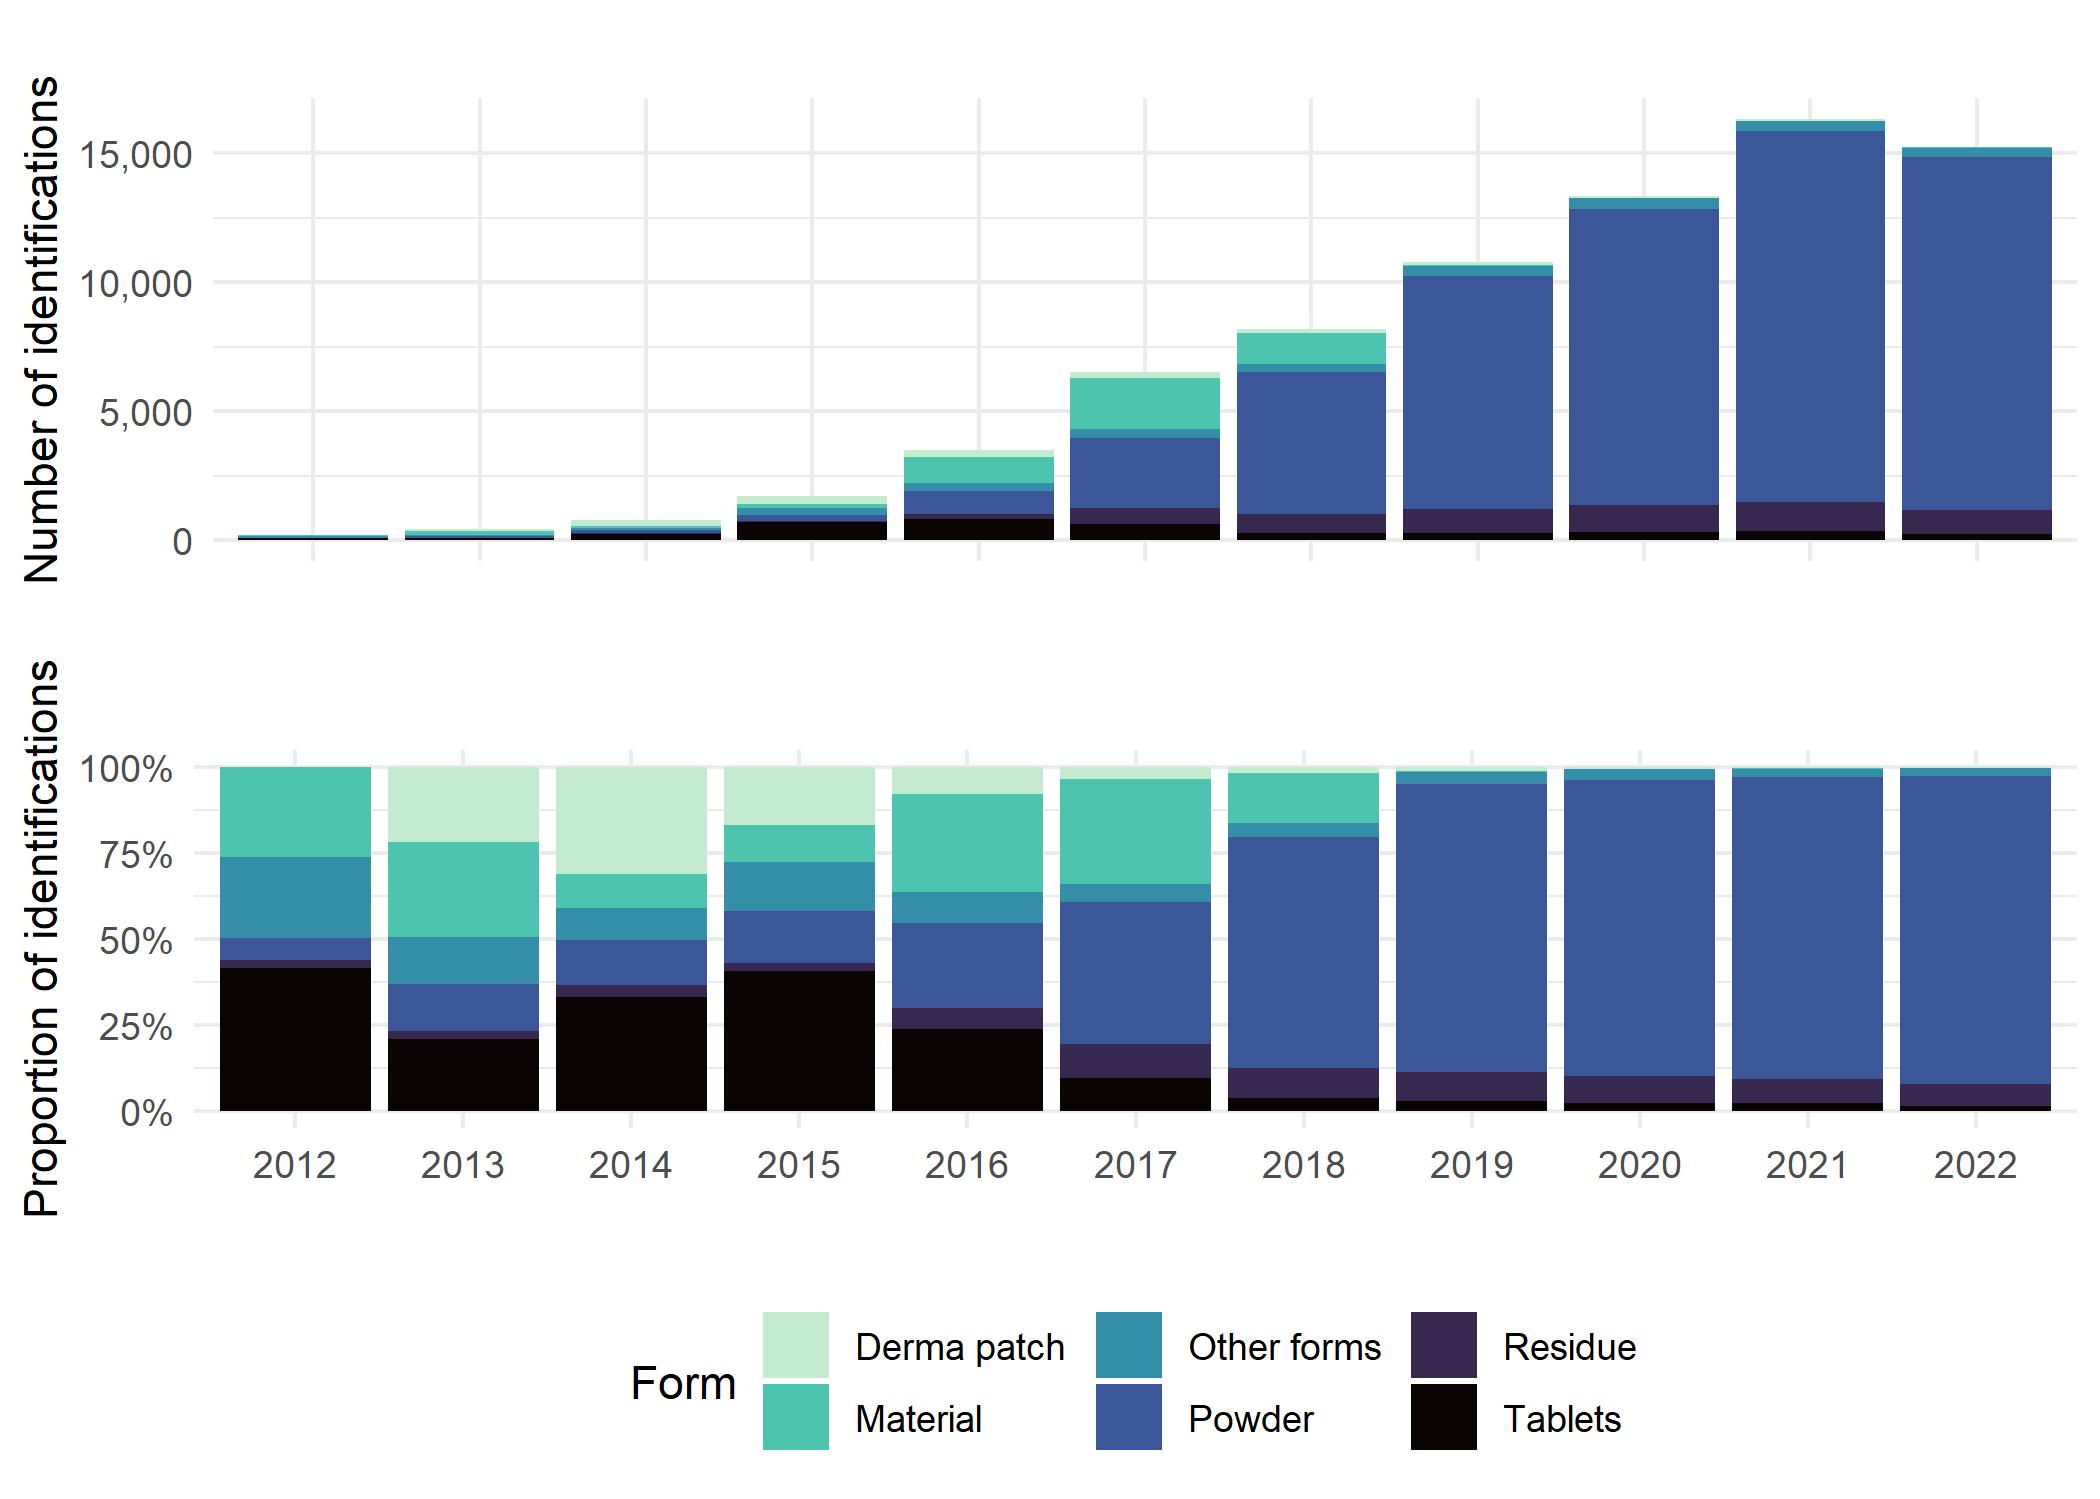
Figure 2 - Text description
| Form | Year | ||||||||||
|---|---|---|---|---|---|---|---|---|---|---|---|
| 2012 | 2013 | 2014 | 2015 | 2016 | 2017 | 2018 | 2019 | 2020 | 2021 | 2022 | |
Powder |
14 |
61 |
107 |
263 |
869 |
2,697 |
5,498 |
9,046 |
11,470 |
14,356 |
13,693 |
Residue |
5 |
11 |
29 |
40 |
206 |
637 |
712 |
921 |
1,045 |
1,148 |
948 |
Material |
57 |
124 |
80 |
181 |
988 |
1,995 |
1,190 |
22 |
36 |
17 |
20 |
Tablets |
90 |
93 |
267 |
698 |
835 |
633 |
306 |
298 |
318 |
358 |
232 |
Derma patch |
- |
97 |
252 |
292 |
277 |
237 |
151 |
119 |
60 |
69 |
24 |
Other forms |
51 |
60 |
74 |
247 |
316 |
339 |
331 |
389 |
420 |
378 |
344 |
| Form | Year | ||||||||||
|---|---|---|---|---|---|---|---|---|---|---|---|
| 2012 | 2013 | 2014 | 2015 | 2016 | 2017 | 2018 | 2019 | 2020 | 2021 | 2022 | |
Powder |
6.5% |
13.7% |
13.2% |
15.3% |
24.9% |
41.3% |
67.1% |
83.8% |
85.9% |
87.9% |
89.7% |
Residue |
2.3% |
2.5% |
3.6% |
2.3% |
5.9% |
9.7% |
8.7% |
8.5% |
7.8% |
7.0% |
6.2% |
Material |
26.3% |
27.8% |
9.9% |
10.5% |
28.3% |
30.5% |
14.5% |
0.2% |
0.3% |
0.1% |
0.1% |
Tablets |
41.5% |
20.9% |
33.0% |
40.6% |
23.9% |
9.7% |
3.7% |
2.8% |
2.4% |
2.2% |
1.5% |
Derma patch |
0.0% |
21.7% |
31.1% |
17.0% |
7.9% |
3.6% |
1.8% |
1.1% |
0.4% |
0.4% |
0.2% |
Other forms |
23.5% |
13.5% |
9.1% |
14.4% |
9.1% |
5.2% |
4.0% |
3.6% |
3.1% |
2.3% |
2.3% |
Co-occurring substances
From 2012 to 2022, there was an increase in the number of Fentanyl exhibits containing multiple co-occurring substances (Figure 3, Table 2). This trend is particularly apparent for provinces of Ontario, Alberta and British Columbia (Figure 4). From 2012 to 2022, there was a general decrease in the proportion of exhibits with only Fentanyl identified and an increase in Fentanyl identifications with 2 or more co-occurring substances (Table 2). In 2022, the proportion of Fentanyl samples containing 2 or more co-occurring substances was 53% in British Columbia, 62% in Alberta and 77% in Ontario. Overall, in 2022, 69% of Fentanyl samples contained 2 or more co-occurring substances (Table 2).
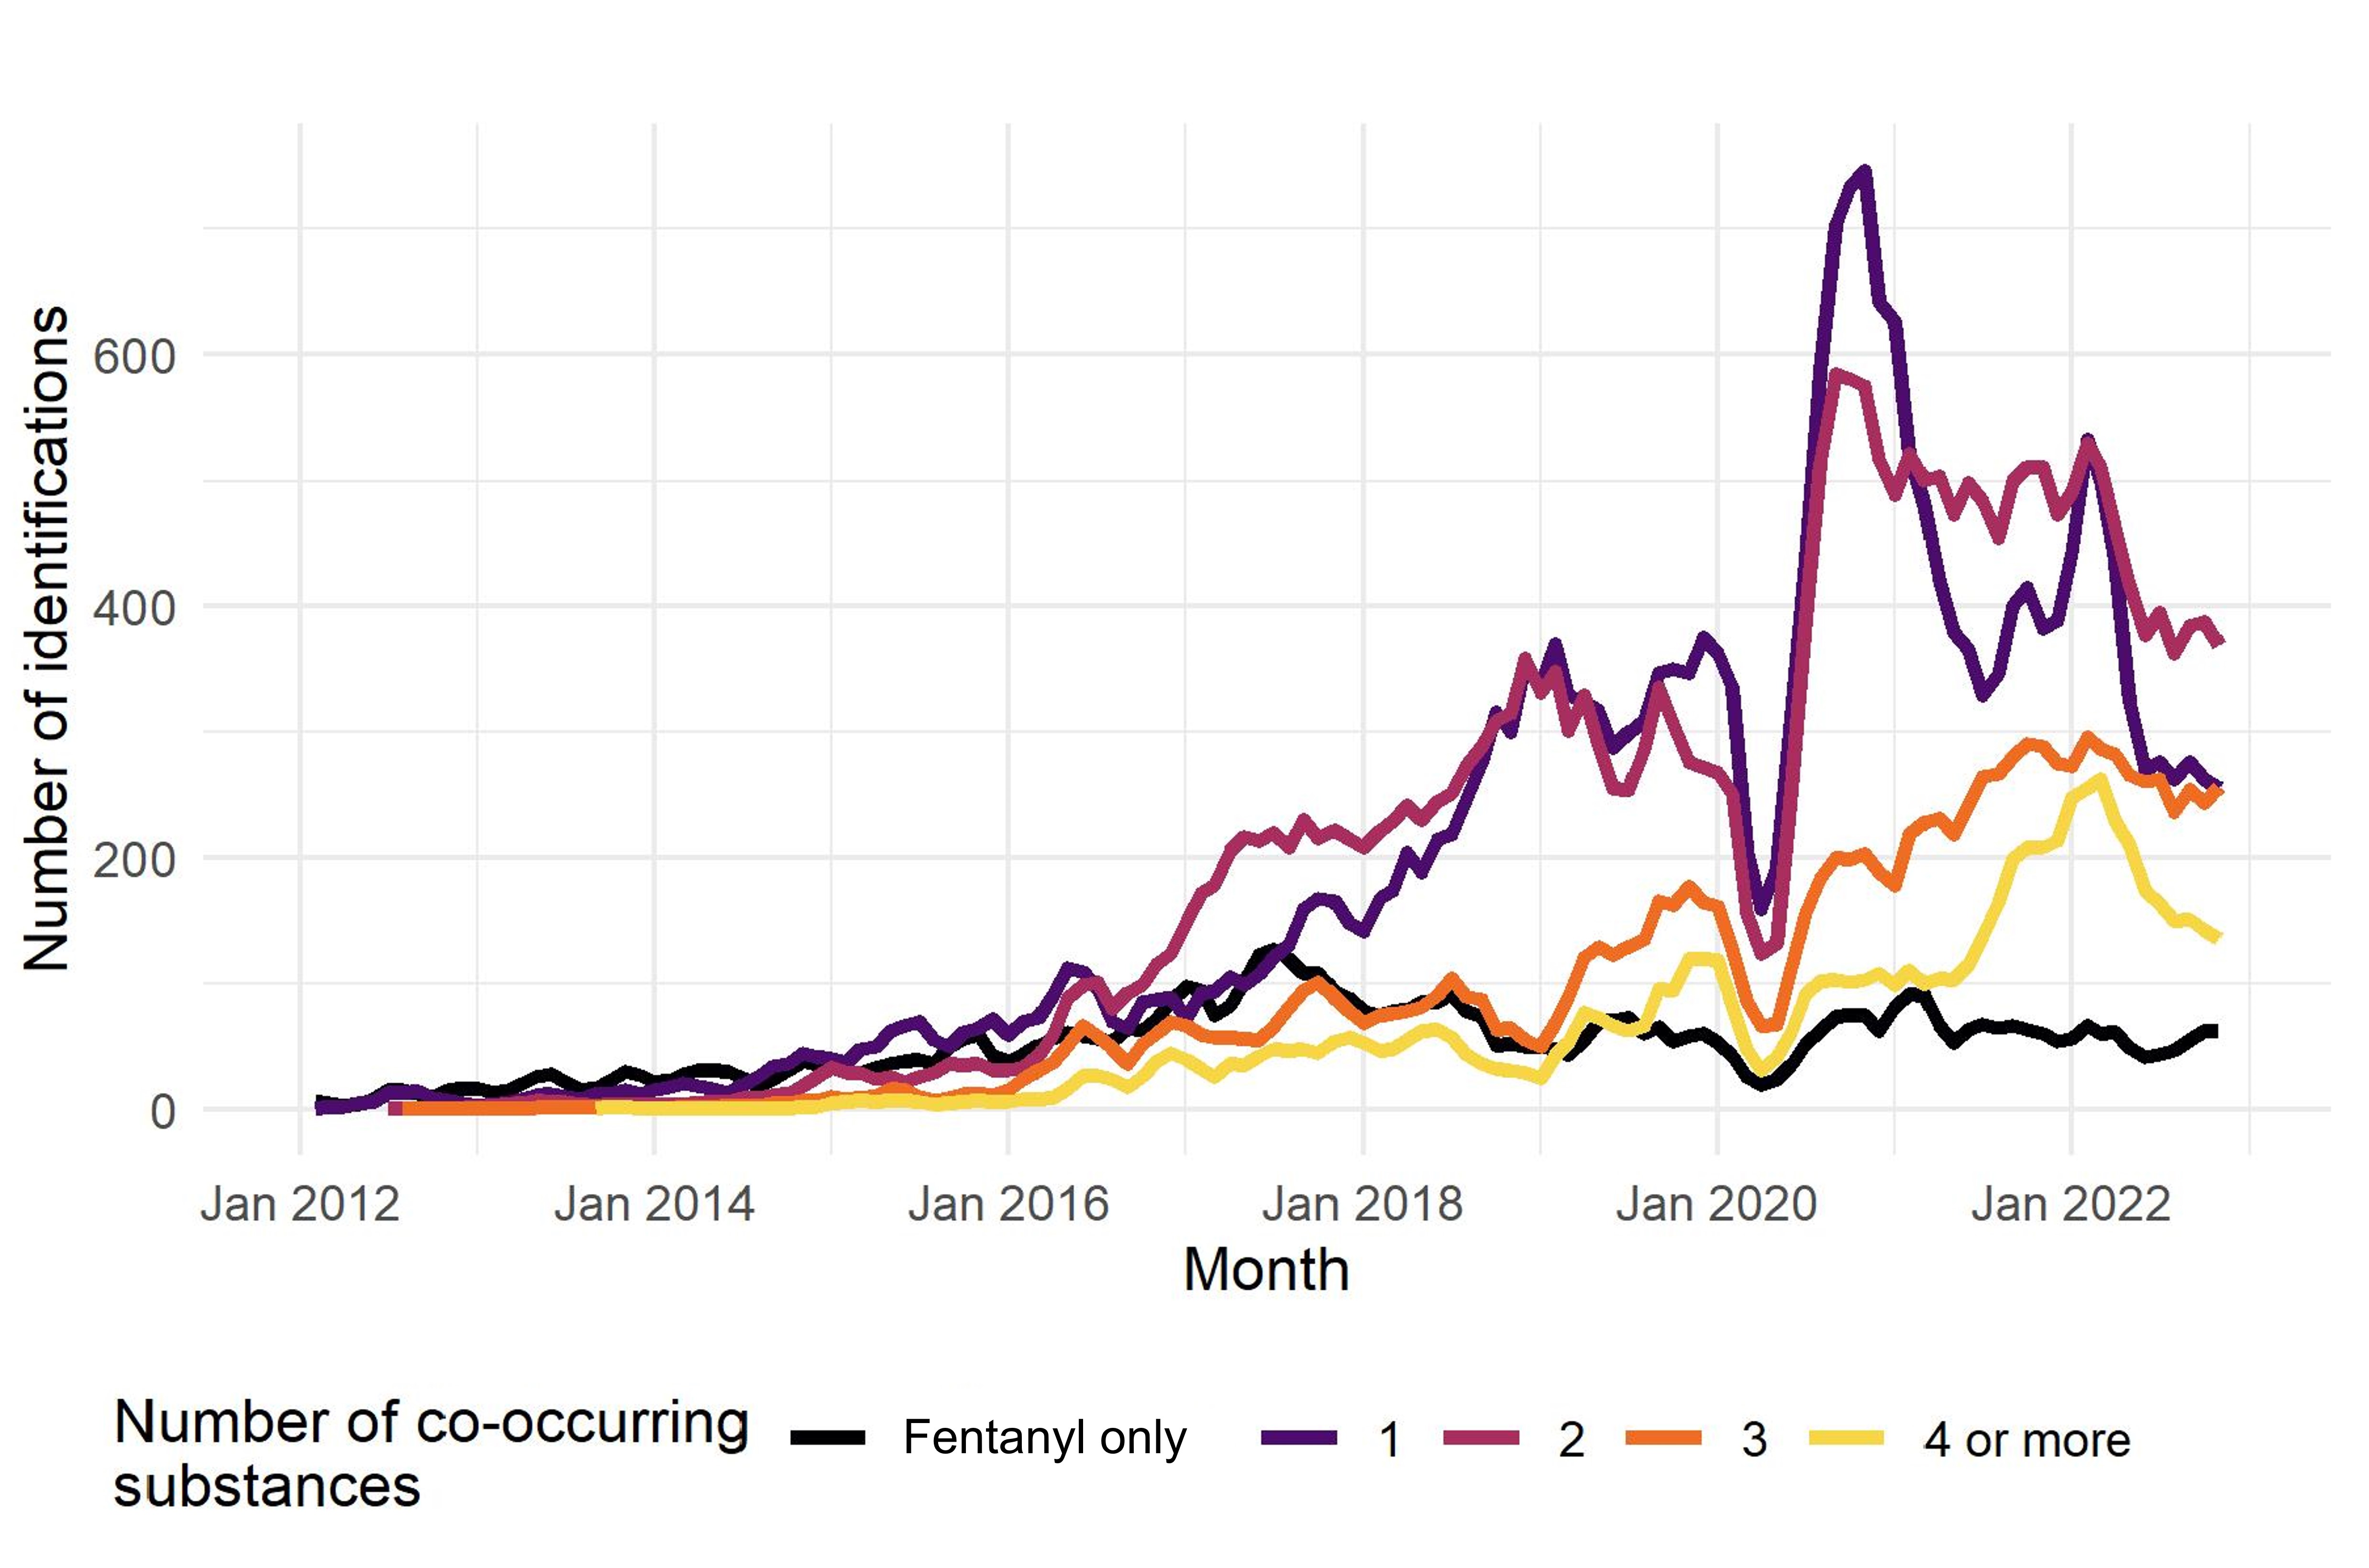
The data presented in this figure is available in Table 2
| Number of co-occurring substances | Year | Total | ||||||||||
|---|---|---|---|---|---|---|---|---|---|---|---|---|
| 2012 | 2013 | 2014 | 2015 | 2016 | 2017 | 2018 | 2019 | 2020 | 2021 | 2022 | ||
| % | % | % | % | % | % | % | % | % | % | % | % | |
Fentanyl only |
58.1 |
57.6 |
41.4 |
28.2 |
19.9 |
18.9 |
10.7 |
6.6 |
4.6 |
5.0 |
4.4 |
8.8 |
1 |
39.2 |
26.9 |
39.1 |
38.5 |
29.2 |
22.5 |
33.1 |
37.4 |
41.8 |
29.9 |
27.0 |
32.4 |
2 |
1.4 |
12.1 |
14.1 |
21.2 |
27.4 |
37.6 |
38.1 |
33.4 |
33.1 |
36.0 |
33.0 |
33.7 |
3 |
1.4 |
2.2 |
4.1 |
7.8 |
15.9 |
13.2 |
11.4 |
14.2 |
13.1 |
18.3 |
20.7 |
15.5 |
4 |
0.0 |
0.7 |
0.6 |
2.4 |
5.2 |
5.6 |
4.6 |
5.3 |
5.2 |
7.3 |
8.9 |
6.2 |
5 |
0.0 |
0.4 |
0.5 |
1.1 |
1.6 |
1.6 |
1.3 |
1.9 |
1.5 |
2.4 |
3.4 |
2.1 |
6 |
0.0 |
0.0 |
0.0 |
0.7 |
0.5 |
0.4 |
0.6 |
1.0 |
0.4 |
0.7 |
1.7 |
0.8 |
7 or more |
0.0 |
0.0 |
0.2 |
0.2 |
0.2 |
0.2 |
0.2 |
0.3 |
0.3 |
0.3 |
0.8 |
0.4 |
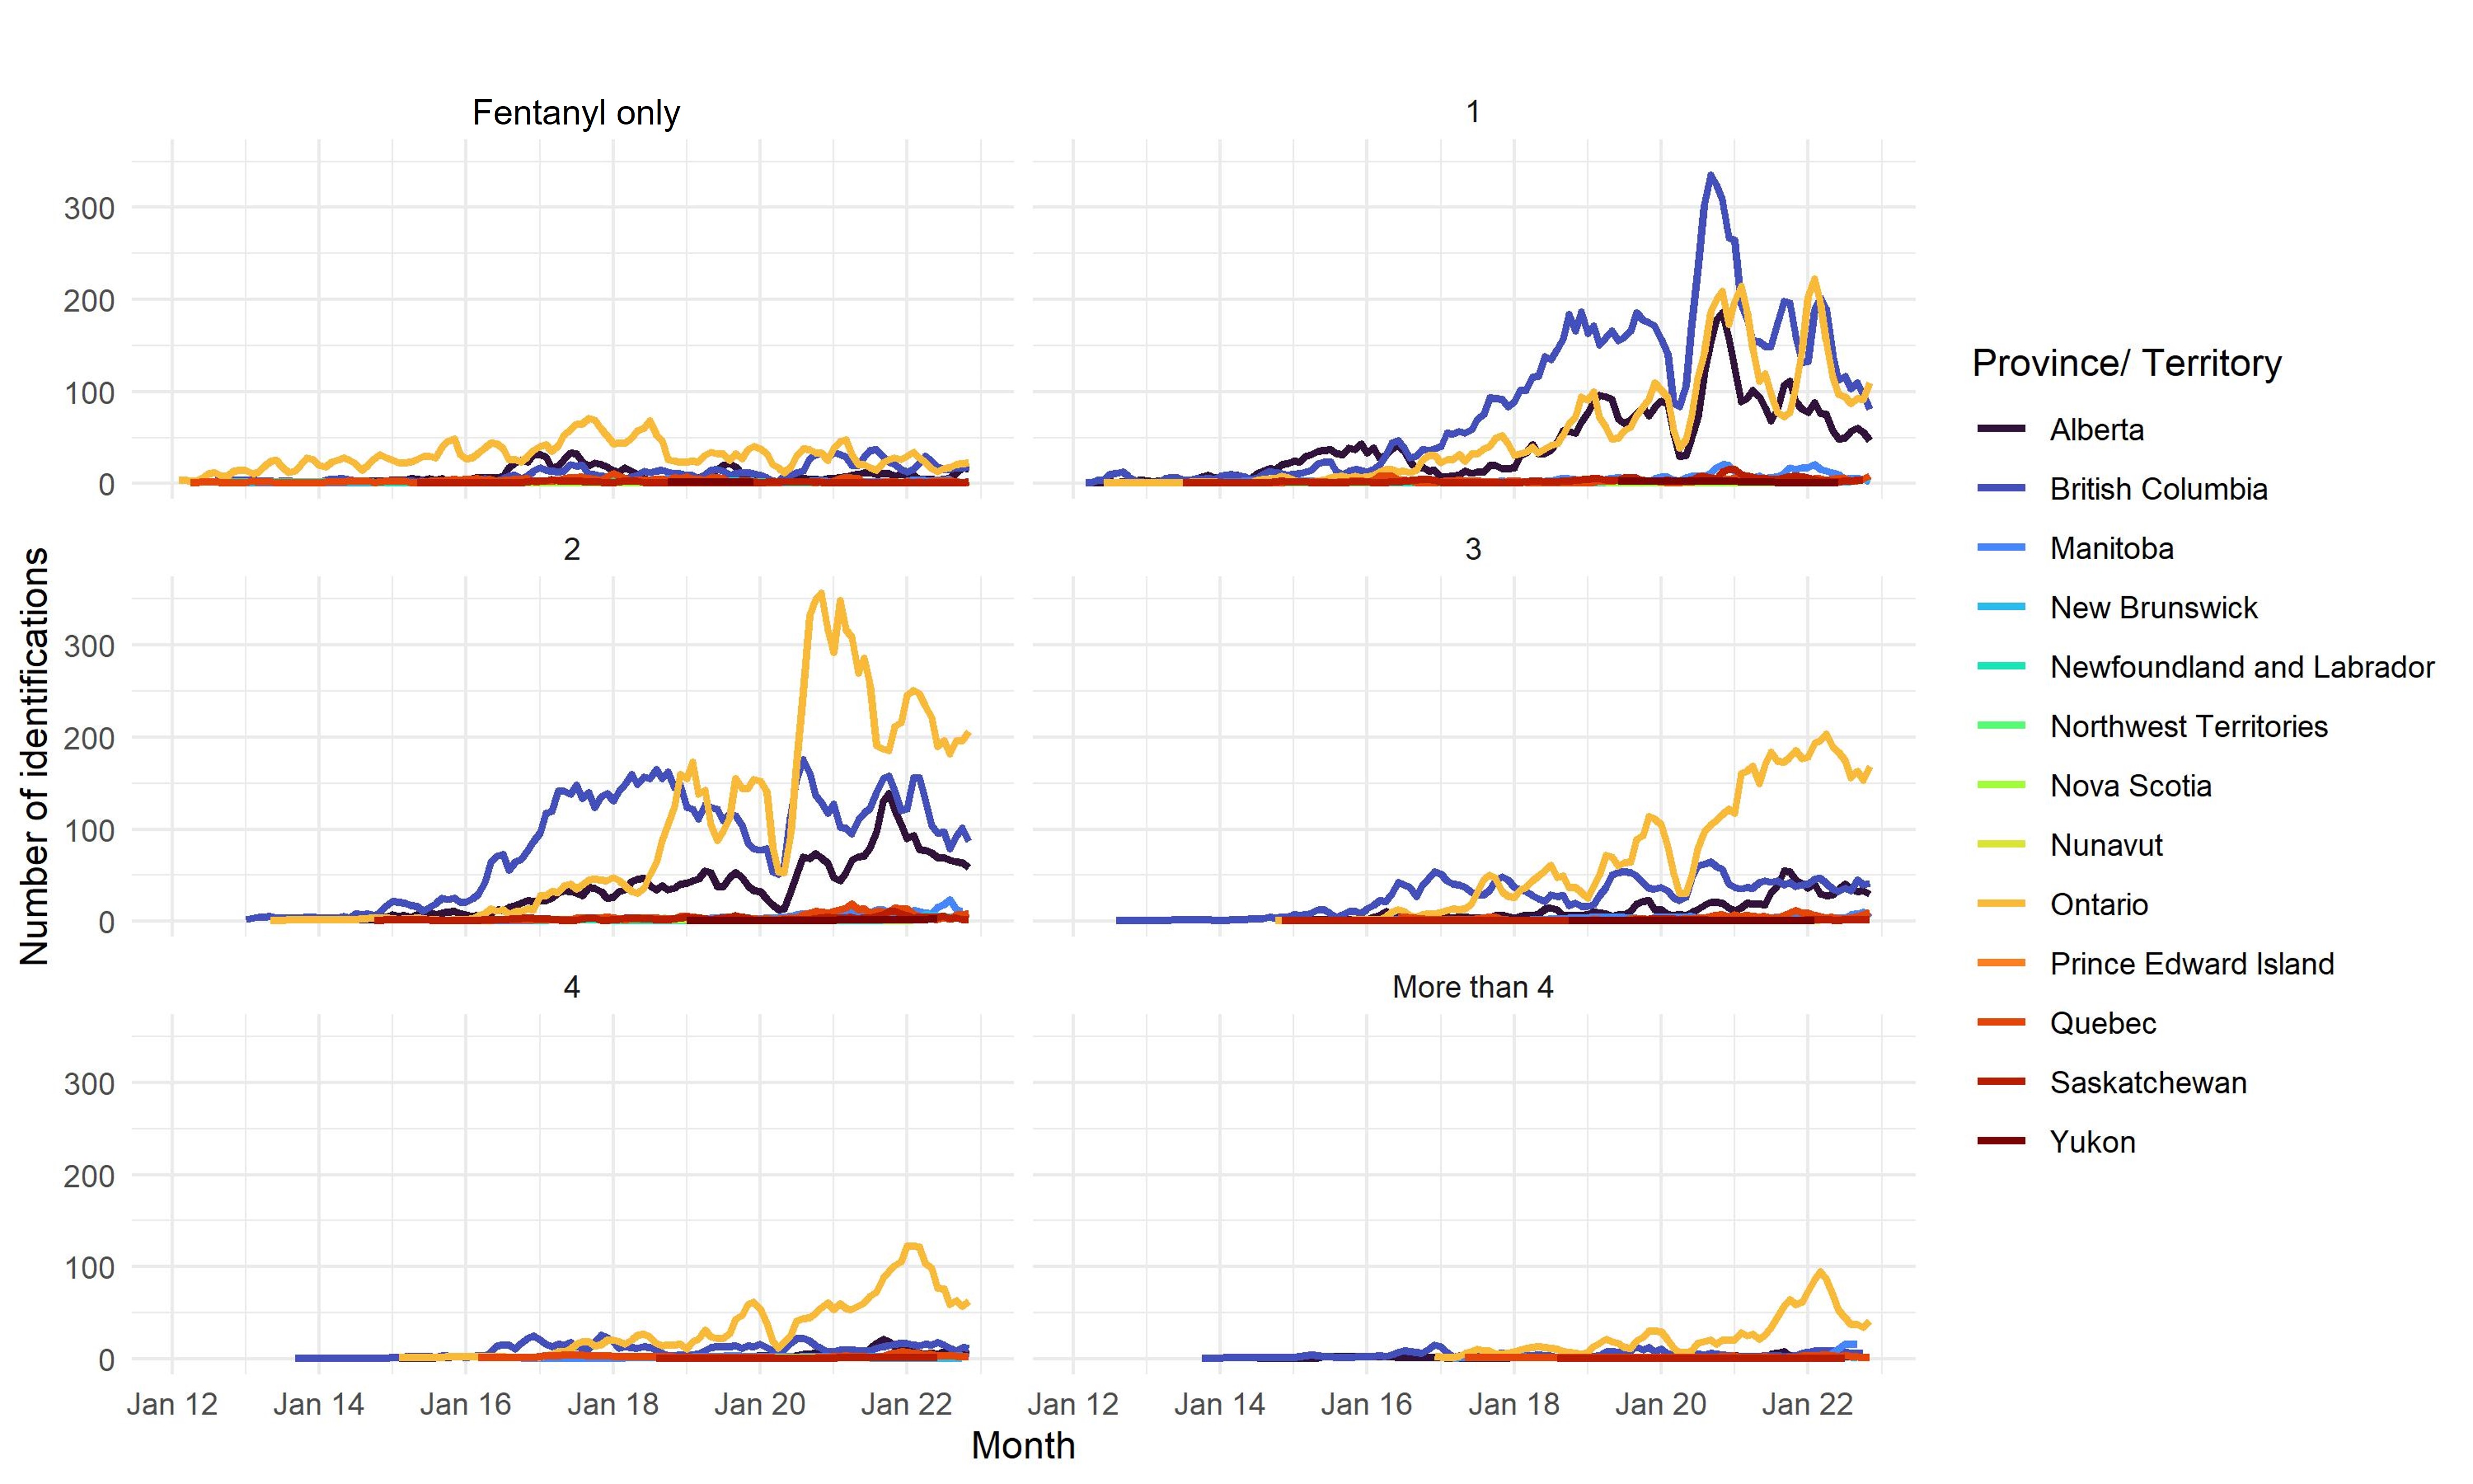
Figure 4 - Text description
| Province/ Territory | Year | ||||||||||
|---|---|---|---|---|---|---|---|---|---|---|---|
| 2012 | 2013 | 2014 | 2015 | 2016 | 2017 | 2018 | 2019 | 2020 | 2021 | 2022 | |
Alberta |
1 |
2 |
8 |
47 |
162 |
303 |
99 |
137 |
43 |
109 |
89 |
British Columbia |
13 |
11 |
23 |
25 |
69 |
169 |
119 |
138 |
186 |
332 |
211 |
Manitoba |
1 |
4 |
4 |
6 |
18 |
23 |
28 |
8 |
11 |
9 |
31 |
New Brunswick |
- |
- |
- |
1 |
3 |
- |
- |
1 |
2 |
- |
1 |
Newfoundland and Labrador |
4 |
- |
- |
- |
2 |
3 |
- |
5 |
2 |
1 |
5 |
Northwest Territories |
- |
- |
- |
- |
- |
- |
- |
- |
- |
- |
- |
Nova Scotia |
- |
1 |
- |
1 |
- |
1 |
- |
2 |
1 |
1 |
- |
Nunavut |
- |
- |
- |
- |
- |
- |
- |
- |
- |
- |
- |
Ontario |
99 |
226 |
277 |
376 |
389 |
662 |
539 |
363 |
348 |
329 |
184 |
Prince Edward Island |
- |
- |
- |
- |
- |
- |
- |
- |
- |
- |
- |
Quebec |
8 |
13 |
22 |
28 |
48 |
55 |
72 |
49 |
19 |
27 |
16 |
Saskatchewan |
- |
- |
1 |
2 |
5 |
18 |
15 |
7 |
2 |
4 |
8 |
Yukon |
- |
- |
- |
- |
- |
1 |
4 |
1 |
1 |
- |
- |
Total |
126 |
257 |
335 |
486 |
696 |
1,235 |
876 |
711 |
615 |
812 |
545 |
| Province/ Territory | Year | ||||||||||
|---|---|---|---|---|---|---|---|---|---|---|---|
| 2012 | 2013 | 2014 | 2015 | 2016 | 2017 | 2018 | 2019 | 2020 | 2021 | 2022 | |
Alberta |
17 |
54 |
148 |
385 |
343 |
151 |
491 |
972 |
1,265 |
1,060 |
636 |
British Columbia |
59 |
52 |
114 |
184 |
373 |
834 |
1,590 |
2,033 |
2,574 |
2,051 |
1,357 |
Manitoba |
1 |
4 |
1 |
5 |
10 |
17 |
26 |
40 |
131 |
115 |
72 |
New Brunswick |
- |
- |
- |
- |
5 |
- |
1 |
- |
7 |
3 |
22 |
Newfoundland and Labrador |
1 |
- |
- |
- |
2 |
3 |
5 |
- |
3 |
4 |
- |
Northwest Territories |
- |
- |
4 |
3 |
10 |
- |
- |
- |
- |
1 |
- |
Nova Scotia |
- |
- |
- |
- |
- |
4 |
7 |
6 |
2 |
6 |
4 |
Nunavut |
- |
- |
3 |
- |
- |
- |
- |
- |
- |
- |
- |
Ontario |
6 |
6 |
29 |
60 |
206 |
424 |
546 |
902 |
1,471 |
1,519 |
1,007 |
Prince Edward Island |
- |
- |
- |
- |
- |
- |
- |
- |
1 |
- |
1 |
Quebec |
1 |
1 |
4 |
14 |
46 |
29 |
16 |
26 |
39 |
33 |
58 |
Saskatchewan |
- |
3 |
13 |
11 |
25 |
9 |
25 |
54 |
79 |
88 |
31 |
Yukon |
- |
- |
- |
- |
- |
1 |
- |
1 |
10 |
8 |
6 |
Total |
85 |
120 |
316 |
662 |
1,020 |
1,472 |
2,707 |
4,034 |
5,582 |
4,888 |
3,194 |
| Province/ Territory | Year | ||||||||||
|---|---|---|---|---|---|---|---|---|---|---|---|
| 2012 | 2013 | 2014 | 2015 | 2016 | 2017 | 2018 | 2019 | 2020 | 2021 | 2022 | |
Alberta |
- |
4 |
21 |
95 |
157 |
350 |
445 |
550 |
534 |
995 |
743 |
British Columbia |
1 |
46 |
73 |
242 |
664 |
1,585 |
1,803 |
1,343 |
1,329 |
1,483 |
1,110 |
Manitoba |
- |
- |
- |
1 |
7 |
14 |
21 |
33 |
62 |
112 |
123 |
New Brunswick |
- |
- |
- |
- |
1 |
- |
3 |
2 |
2 |
5 |
39 |
Newfoundland and Labrador |
- |
- |
- |
1 |
1 |
8 |
2 |
- |
1 |
- |
1 |
Northwest Territories |
- |
- |
- |
- |
- |
- |
- |
- |
- |
- |
- |
Nova Scotia |
- |
- |
- |
- |
- |
- |
10 |
3 |
4 |
1 |
3 |
Nunavut |
- |
- |
- |
- |
- |
- |
- |
- |
- |
- |
- |
Ontario |
1 |
3 |
16 |
23 |
115 |
454 |
792 |
1,604 |
2,395 |
3,063 |
1,985 |
Prince Edward Island |
- |
- |
- |
- |
- |
- |
- |
- |
1 |
- |
5 |
Quebec |
1 |
- |
- |
2 |
6 |
26 |
26 |
27 |
67 |
145 |
49 |
Saskatchewan |
- |
1 |
4 |
- |
7 |
20 |
16 |
42 |
19 |
69 |
37 |
Yukon |
- |
- |
- |
- |
- |
1 |
- |
1 |
2 |
6 |
9 |
Total |
3 |
54 |
114 |
364 |
958 |
2,458 |
3,118 |
3,605 |
4,416 |
5,879 |
4,104 |
| Province/ Territory | Year | ||||||||||
|---|---|---|---|---|---|---|---|---|---|---|---|
| 2012 | 2013 | 2014 | 2015 | 2016 | 2017 | 2018 | 2019 | 2020 | 2021 | 2022 | |
Alberta |
- |
- |
1 |
20 |
66 |
55 |
95 |
150 |
149 |
353 |
329 |
British Columbia |
3 |
10 |
25 |
106 |
392 |
473 |
316 |
472 |
532 |
478 |
405 |
Manitoba |
- |
- |
- |
2 |
5 |
3 |
3 |
30 |
46 |
51 |
54 |
New Brunswick |
- |
- |
- |
- |
- |
- |
- |
- |
- |
- |
17 |
Newfoundland and Labrador |
- |
- |
- |
- |
- |
1 |
2 |
- |
- |
- |
- |
Northwest Territories |
- |
- |
- |
- |
1 |
- |
- |
- |
- |
1 |
- |
Nova Scotia |
- |
- |
- |
- |
- |
- |
3 |
- |
2 |
3 |
4 |
Nunavut |
- |
- |
- |
- |
- |
- |
- |
- |
- |
- |
- |
Ontario |
- |
- |
3 |
5 |
77 |
313 |
504 |
861 |
971 |
2,011 |
1,667 |
Prince Edward Island |
- |
- |
- |
- |
- |
- |
- |
- |
- |
- |
1 |
Quebec |
- |
- |
- |
- |
14 |
17 |
4 |
16 |
36 |
77 |
55 |
Saskatchewan |
- |
- |
4 |
1 |
- |
1 |
4 |
6 |
8 |
9 |
13 |
Yukon |
- |
- |
- |
- |
- |
- |
2 |
1 |
1 |
- |
1 |
Total |
3 |
10 |
33 |
134 |
555 |
863 |
933 |
1,536 |
1,745 |
2,983 |
2,546 |
| Province/ Territory | Year | ||||||||||
|---|---|---|---|---|---|---|---|---|---|---|---|
| 2012 | 2013 | 2014 | 2015 | 2016 | 2017 | 2018 | 2019 | 2020 | 2021 | 2022 | |
Alberta |
- |
- |
1 |
9 |
17 |
11 |
17 |
27 |
36 |
111 |
62 |
British Columbia |
- |
3 |
4 |
26 |
144 |
207 |
111 |
132 |
168 |
141 |
142 |
Manitoba |
- |
- |
- |
1 |
1 |
5 |
11 |
16 |
14 |
21 |
|
New Brunswick |
- |
- |
- |
- |
- |
- |
- |
1 |
- |
1 |
5 |
Newfoundland and Labrador |
- |
- |
- |
- |
- |
- |
- |
- |
- |
- |
- |
Northwest Territories |
- |
- |
- |
- |
- |
- |
- |
- |
- |
1 |
- |
Nova Scotia |
- |
- |
- |
1 |
- |
- |
1 |
1 |
1 |
2 |
1 |
Nunavut |
- |
- |
- |
- |
- |
- |
- |
- |
- |
- |
- |
Ontario |
- |
- |
- |
3 |
16 |
137 |
230 |
391 |
467 |
871 |
736 |
Prince Edward Island |
- |
- |
- |
- |
- |
- |
- |
- |
- |
- |
- |
Quebec |
- |
- |
- |
1 |
3 |
12 |
10 |
5 |
6 |
44 |
36 |
Saskatchewan |
- |
- |
- |
- |
1 |
- |
2 |
- |
- |
6 |
3 |
Yukon |
- |
- |
- |
- |
- |
- |
- |
2 |
1 |
- |
- |
Total |
- |
3 |
5 |
41 |
182 |
367 |
376 |
570 |
695 |
1,191 |
1,006 |
| Province/ Territory | Year | ||||||||||
|---|---|---|---|---|---|---|---|---|---|---|---|
| 2012 | 2013 | 2014 | 2015 | 2016 | 2017 | 2018 | 2019 | 2020 | 2021 | 2022 | |
Alberta |
- |
- |
3 |
9 |
1 |
4 |
20 |
7 |
21 |
38 |
24 |
British Columbia |
- |
2 |
3 |
25 |
71 |
66 |
31 |
93 |
53 |
36 |
75 |
Manitoba |
- |
- |
- |
- |
1 |
6 |
3 |
9 |
7 |
7 |
48 |
New Brunswick |
- |
- |
- |
- |
- |
- |
- |
- |
- |
- |
7 |
Newfoundland and Labrador |
- |
- |
- |
- |
- |
- |
- |
- |
3 |
- |
- |
Northwest Territories |
- |
- |
- |
- |
- |
- |
- |
- |
- |
0 |
- |
Nova Scotia |
- |
- |
- |
- |
- |
- |
- |
1 |
1 |
2 |
- |
Nunavut |
- |
- |
- |
- |
- |
- |
- |
- |
- |
- |
- |
Ontario |
- |
- |
- |
- |
- |
64 |
119 |
223 |
202 |
465 |
502 |
Prince Edward Island |
- |
- |
- |
- |
- |
- |
- |
- |
- |
- |
- |
Quebec |
- |
- |
- |
- |
1 |
2 |
2 |
5 |
9 |
24 |
19 |
Saskatchewan |
- |
- |
- |
- |
- |
1 |
3 |
1 |
- |
1 |
3 |
Yukon |
- |
- |
- |
- |
- |
- |
- |
- |
- |
- |
1 |
Total |
- |
2 |
6 |
34 |
80 |
143 |
178 |
339 |
296 |
573 |
679 |
Pharmacological classes of substances frequently co-occurring with Fentanyl are opioid, sedative/hypnotic and stimulant. The rise in the co-occurrences of sedative/hypnotics with Fentanyl can be observed since late 2019 (Figure 5).
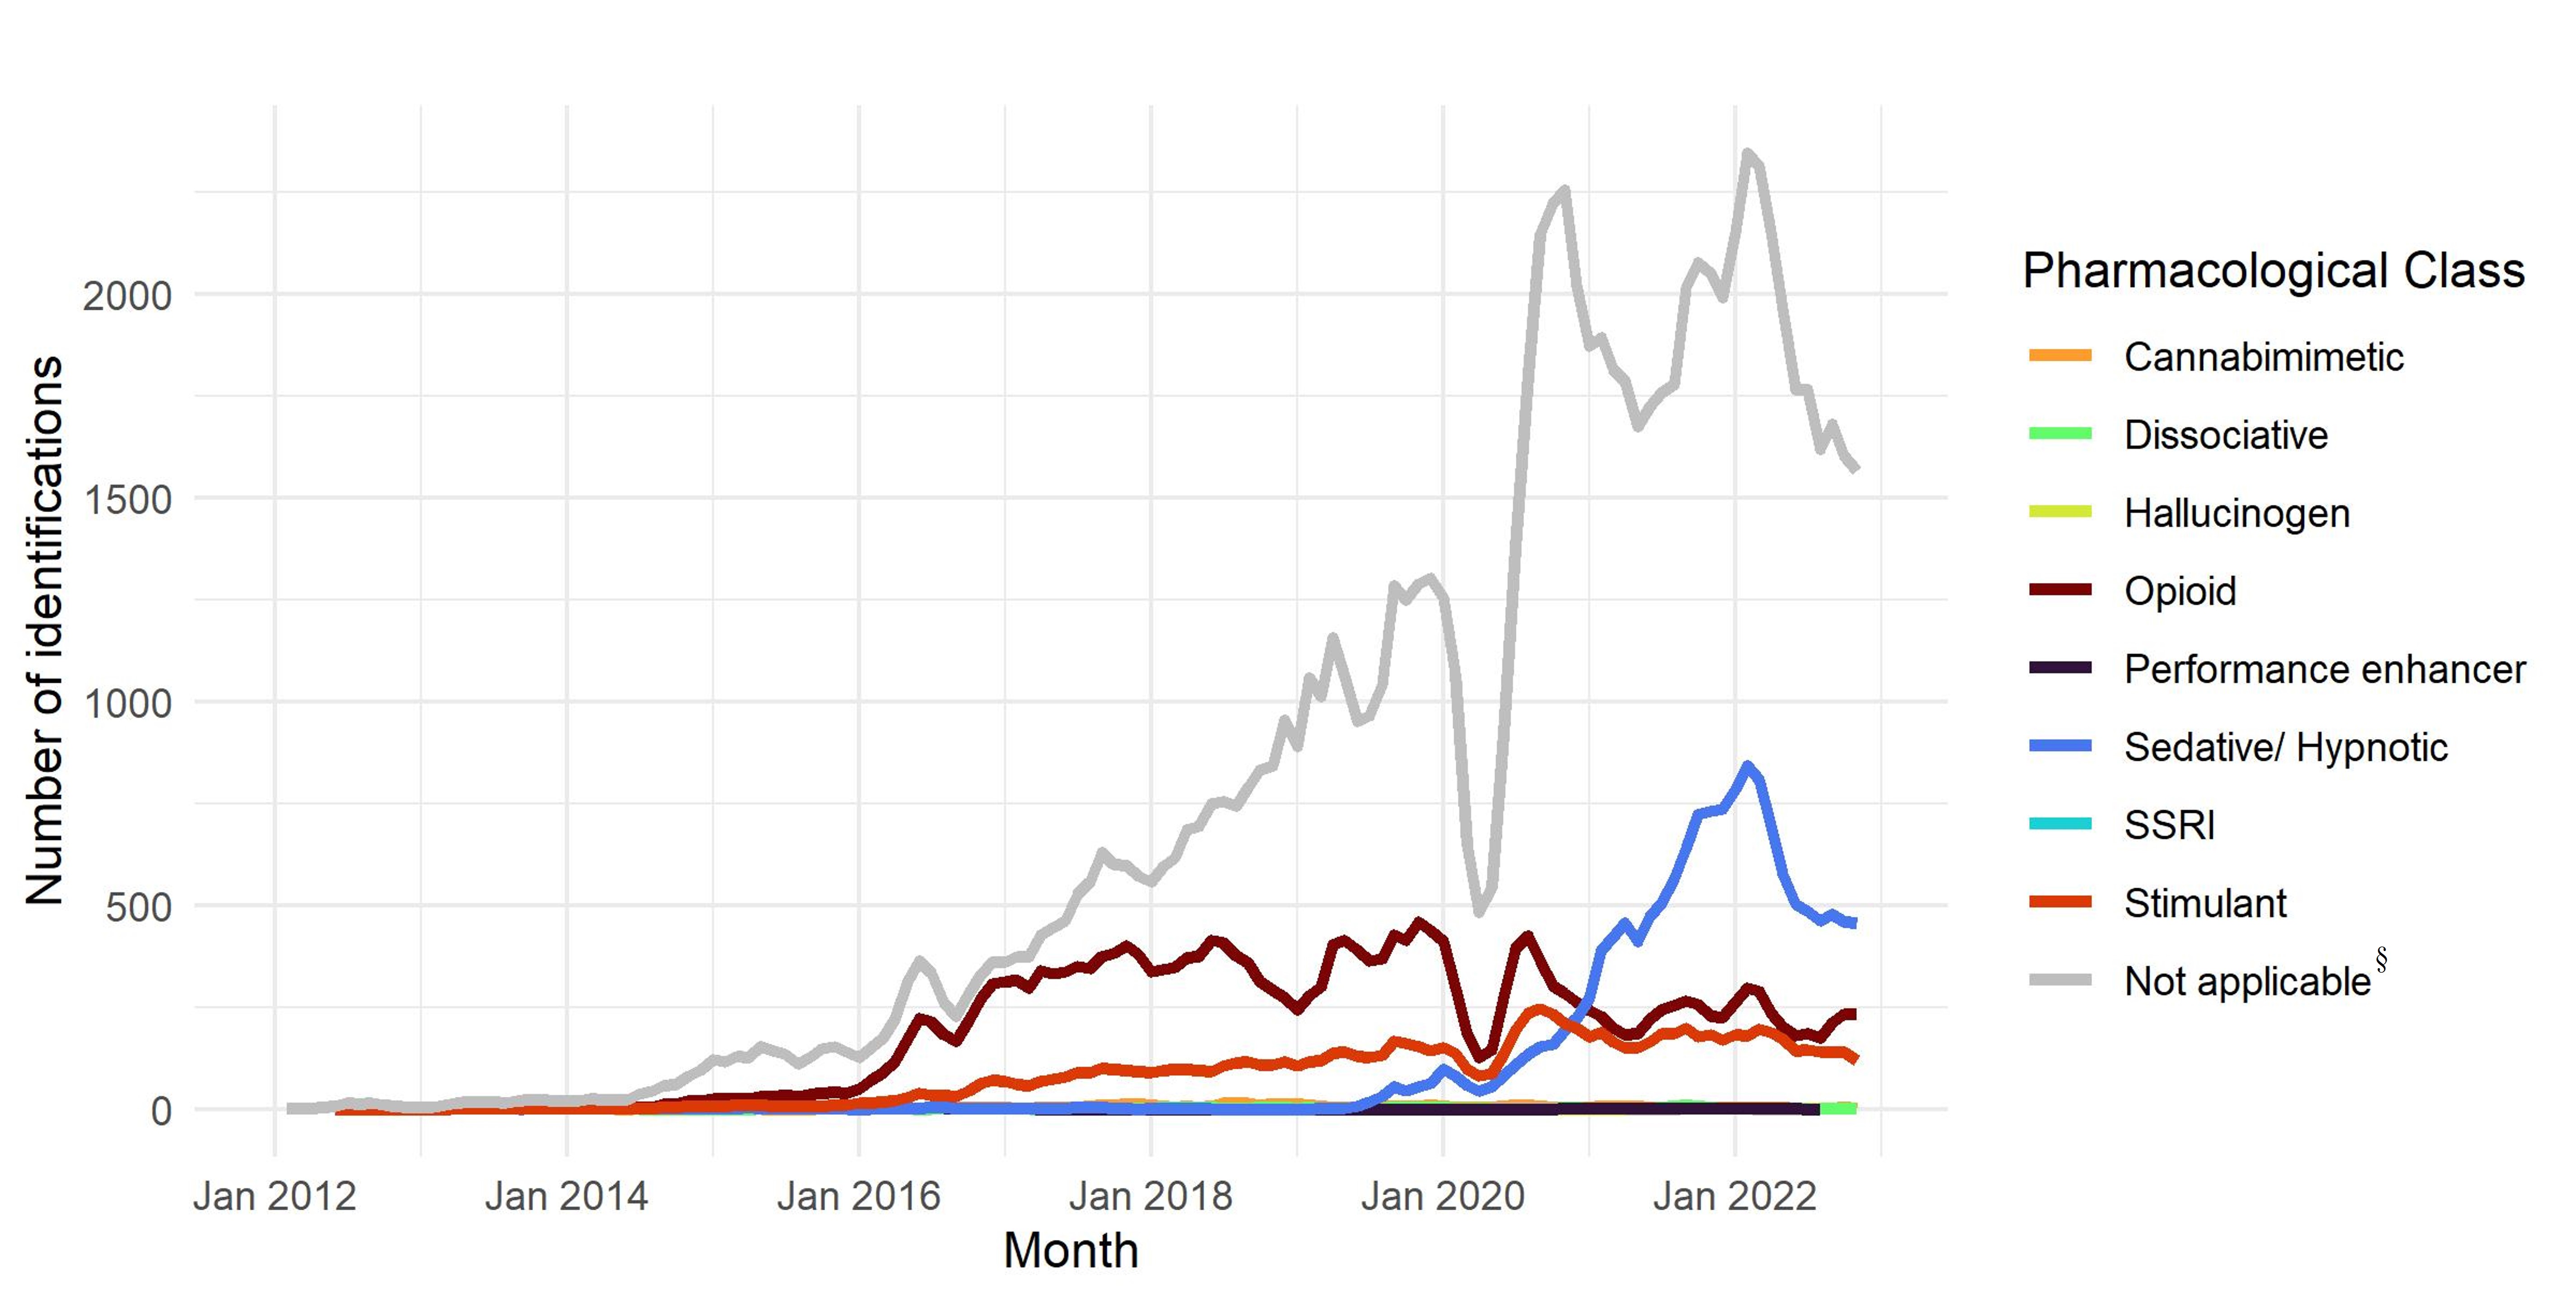
§ Includes cutting agents, precursors/key intermediates/reagents, prescription drugs, over the counter drugs and non-drugs.
Figure 5 - Text description
| Pharmacological class | Year | Total | ||||||||||
|---|---|---|---|---|---|---|---|---|---|---|---|---|
| 2012 | 2013 | 2014 | 2015 | 2016 | 2017 | 2018 | 2019 | 2020 | 2021 | 2022 | ||
Cannabimimetic |
- |
- |
12 |
3 |
24 |
89 |
129 |
104 |
82 |
77 |
54 |
574 |
Dissociative |
- |
- |
3 |
- |
19 |
9 |
47 |
43 |
25 |
55 |
30 |
231 |
Hallucinogen |
- |
- |
- |
- |
- |
- |
2 |
2 |
3 |
8 |
6 |
21 |
Opioid |
6 |
52 |
103 |
394 |
2,094 |
4,192 |
4,158 |
4,576 |
3,477 |
2,701 |
2,734 |
24,487 |
Performance enhancer |
- |
- |
- |
- |
8 |
1 |
1 |
2 |
1 |
6 |
6 |
24 |
Sedative/ Hypnotic |
- |
4 |
- |
33 |
18 |
32 |
14 |
284 |
1,408 |
6,300 |
7,021 |
15,113 |
SSRI |
- |
- |
- |
- |
- |
- |
- |
- |
1 |
- |
2 |
3 |
Stimulant |
4 |
27 |
53 |
108 |
430 |
962 |
1,250 |
1,643 |
2,025 |
2,129 |
1,846 |
10,477 |
Not applicable§ |
90 |
197 |
527 |
1,607 |
3,168 |
5,931 |
8,627 |
13,355 |
17,027 |
22,206 |
22,474 |
95,178 |
§ Includes cutting agents, precursors/key intermediates/reagents, prescription drugs, over the counter drugs and non-drugs. |
||||||||||||
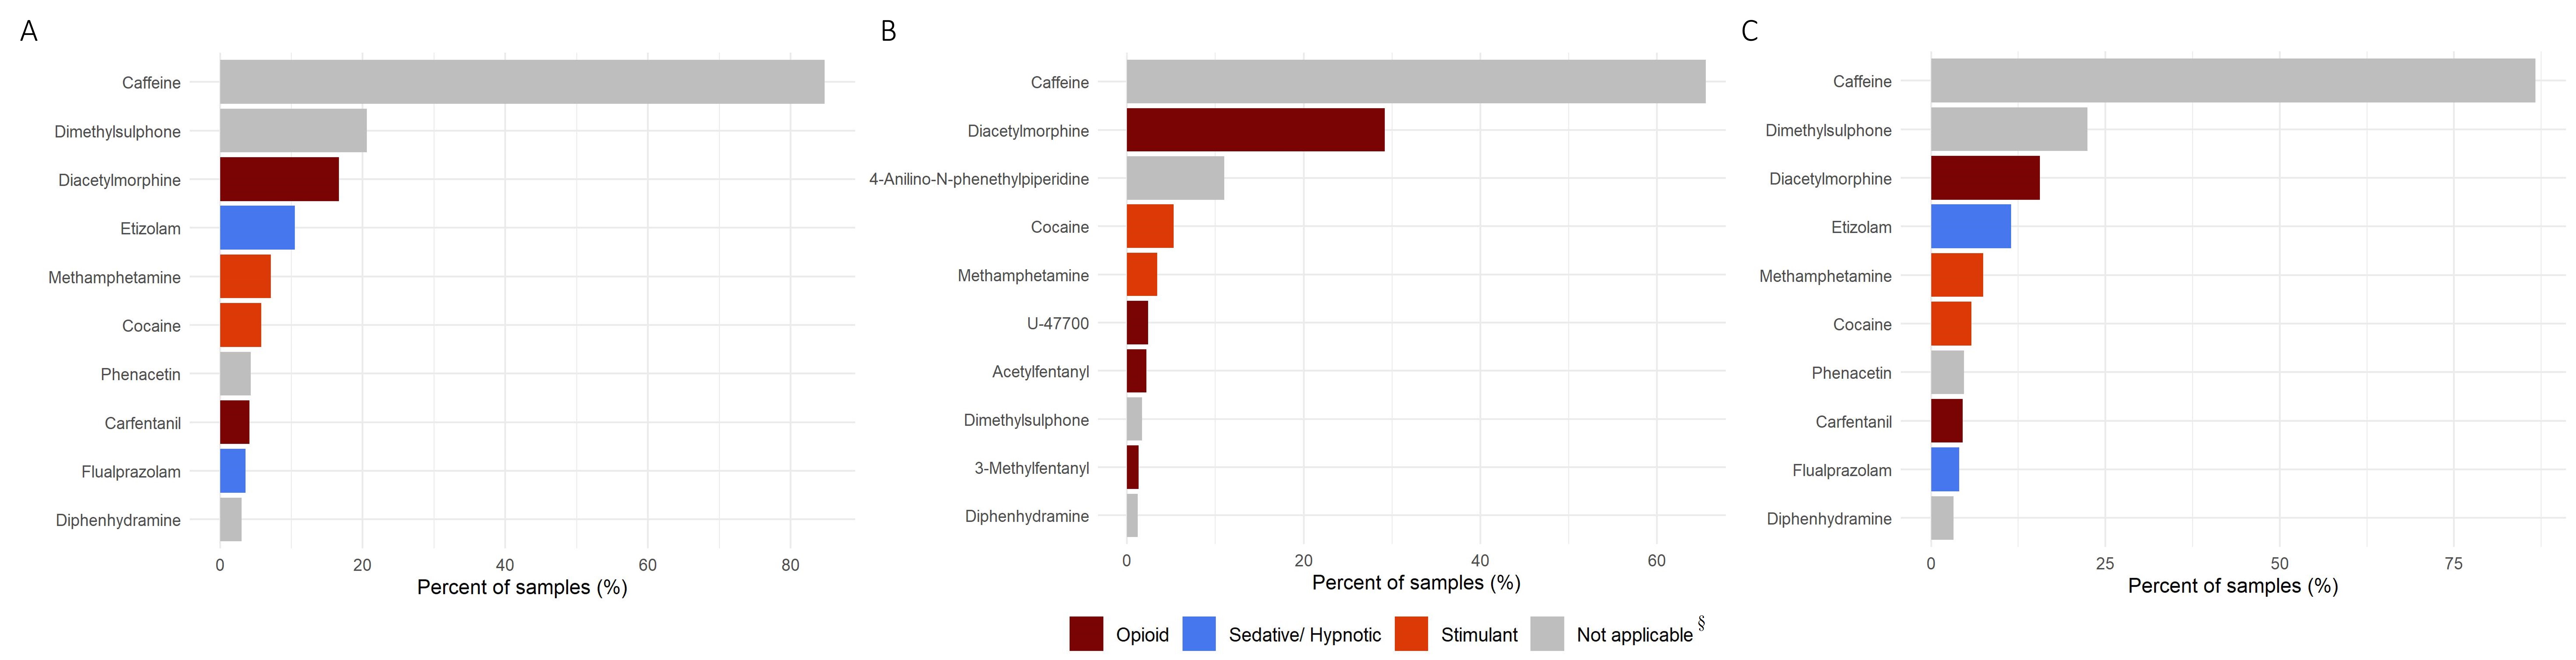
Caffeine (cutting agent) has consistently been the most common co-occurrence with Fentanyl in the past 10 years (Figure 6A) but the top 10 co-occurring substances have changed throughout the years. The psychoactive substances that were most often co-occurring with Fentanyl from 2012 to 2016 include Diacetylmorphine (aka Heroin) (opioid), Cocaine and Methamphetamine (stimulant) (Figure 6B). With the increase in co-occurring sedative/hypnotics with Fentanyl since 2020, Etizolam and Flualprazolam were among the top 10 psychoactive substances most often identified alongside Fentanyl between 2017 and 2022 (Figure 6C).
§ Includes cutting agents, precursors/key intermediates/reagents, prescription drugs, over the counter drugs and non-drugs.
Figure 6 - Text description
| Name | Pharmacological Class | Percent (%) |
|---|---|---|
Caffeine |
Not applicable§ |
84.8 |
Dimethylsulphone |
Not applicable |
20.6 |
Diacetylmorphine |
Opioid |
16.7 |
Etizolam |
Sedative/Hypnotic |
10.5 |
Methamphetamine |
Stimulant |
7.1 |
Cocaine |
Stimulant |
5.8 |
Phenacetin |
Not applicable |
4.3 |
Carfentanil |
Opioid |
4.1 |
Flualprazolam |
Sedative/Hypnotic |
3.6 |
Diphenhydramine |
Not applicable |
3.0 |
| Name | Pharmacological Class | Percent (%) |
|---|---|---|
Caffeine |
Not applicable |
65.5 |
Diacetylmorphine |
Opioid |
29.2 |
4-Anilino-N-phenethylpiperidine |
Not applicable |
11.0 |
Cocaine |
Stimulant |
5.3 |
Methamphetamine |
Stimulant |
3.4 |
U-47700 |
Opioid |
2.4 |
Acetylfentanyl |
Opioid |
2.2 |
Dimethylsulphone |
Not applicable |
1.7 |
3-Methylfentanyl |
Opioid |
1.3 |
Diphenhydramine |
Not applicable |
1.2 |
| Name | Pharmacological Class | Percent (%) |
|---|---|---|
Caffeine |
Not applicable |
84.8 |
Dimethylsulphone |
Not applicable |
20.6 |
Diacetylmorphine |
Opioid |
16.7 |
Etizolam |
Sedative/Hypnotic |
10.5 |
Methamphetamine |
Stimulant |
7.1 |
Cocaine |
Stimulant |
5.8 |
Phenacetin |
Not applicable |
4.3 |
Carfentanil |
Opioid |
4.1 |
Flualprazolam |
Sedative/Hypnotic |
3.6 |
Diphenhydramine |
Not applicable |
3.0 |
§ Includes cutting agents, precursors/key intermediates/reagents, prescription drugs, over the counter drugs and non-drugs.
In 2020 to 2022, psychoactive substances frequently co-occurring with Fentanyl include Etizolam (sedative/hypnotic), Methamphetamine (stimulant), Flualprazolam (sedative/hypnotic), and Diacetylmorphine (aka Heroin) (opioid) (Table 3). Emerging new psychoactive substances (NPS) such as Bromazolam (sedative/hypnotic), Metonitazene (opioid) and para-Fluorofentanyl (opioid) can also be found among the top 20 co-occurring substances with Fentanyl in 2020 to 2022.
| Name | Chemical Class | Pharmacological Class | Count (n) | Percent (%) |
|---|---|---|---|---|
Caffeine |
Cutting Agent |
Not applicable |
39,977 |
89.0 |
Dimethylsulphone |
Cutting Agent |
Not applicable |
11,956 |
26.6 |
Etizolam |
Benzodiazepine (BZD) Class |
Sedative/Hypnotic |
7,825 |
17.4 |
Methamphetamine |
Amphetamine / Methamphetamine (Sub) Class |
Stimulant |
3,338 |
7.4 |
Flualprazolam |
Benzodiazepine (BZD) Class |
Sedative/Hypnotic |
2,794 |
6.2 |
Phenacetin |
Cutting Agent |
Not applicable |
2,656 |
5.9 |
Diacetylmorphine |
Opiate Class |
Opioid |
2,587 |
5.8 |
Cocaine |
Tropane (Cocaine) Class |
Stimulant |
2,396 |
5.3 |
Diphenhydramine |
Cutting Agent |
Not applicable |
2,106 |
4.7 |
Xylazine |
Cutting Agent |
Not applicable |
1,924 |
4.3 |
Carfentanil |
Fentanyl (Sub) Class |
Opioid |
1,653 |
3.7 |
Flubromazepam |
Benzodiazepine (BZD) Class |
Sedative/Hypnotic |
1,629 |
3.6 |
Bromazolam |
Benzodiazepine (BZD) Class |
Sedative/Hypnotic |
1,299 |
2.9 |
Lidocaine |
Cutting Agent |
Not applicable |
1,078 |
2.4 |
Dextromethorphan |
Other¥ |
Not applicable |
861 |
1.9 |
Acetaminophen |
Cutting Agent |
Not applicable |
612 |
1.4 |
Metonitazene |
Opioid Class (Non-Fentanyl, Non-Opiates) |
Opioid |
605 |
1.3 |
para-Fluorofentanyl |
Fentanyl (Sub) Class |
Opioid |
570 |
1.3 |
Flubromazolam |
Benzodiazepine (BZD) Class |
Sedative/Hypnotic |
494 |
1.1 |
Furanyl UF-17 |
Opioid Class (Non-Fentanyl, Non-Opiates) |
Opioid |
486 |
1.1 |
¥Includes prescription and over the counter drugs. |
||||
Conclusion
This spotlight report summarises the trends in Fentanyl identifications based on exhibits seized and submitted to DAS by law enforcement agencies in the past 11 years. Between 2012 and 2022, Fentanyl was identified in 77,141 samples and was most often found in exhibits from Ontario and British Columbia. The frequency of Fentanyl without any other co-occurring substances decreased in the past 11 years. Psychoactive substances most often co-occurring with Fentanyl from 2012 to 2016 include Diacetylmorphine (aka Heroin) (opioid), Cocaine (stimulant) and Methamphetamine (stimulant). However, there has been an increase in co-occurring sedative/hypnotics with Fentanyl since 2020. Several emerging new psychoactive substances (NPS) can also be found among the top 20 co-occurring substances with Fentanyl in 2020 to 2022. More information about the emergence of NPS, including nitazenes, can be found in our reports ''At-A-Glance: Newly Reported Psychoactive Substances in Canada'' Footnote 5 and ''At-A-Glance: The Emergence of Nitazenes and Brorphine in Canada'' Footnote 6. Continued monitoring of Fentanyl and its co-occurring substances is required to ensure accurate information is available about concomitant harmful substances with Fentanyl on the Canadian market.
Drug Analysis Service– Health Canada:
- Marie-Line Gilbert
- Caroline Maurice-Gélinas
- James Rodrigues
- Janike Pitre
- Benoit Archambault
Public Health Agency of Canada:
- Cindy Leung Soo
References
- Footnote 1
-
Government of Canada, « Fentanyl, » [Online]. Available: https://www.canada.ca/en/health-canada/services/substance-use/controlled-illegal-drugs/fentanyl.html. [Accessed on July 21, 2022].
- Footnote 2
-
Government of Canada, « Naloxone, » [Online]. Available: https://www.canada.ca/en/health-canada/services/opioids/naloxone.html. [Accessed on July 21, 2022].
- Footnote 3
-
Substance-related Overdose and Mortality Surveillance Task Group (SOMS-TG) of the Special Advisory Committee (SAC) on the Epidemic of Opioid Overdoses, « Opioid- and Stimulant-related Harms in Canada, » Public Health Agency of Canada, [Online]. Available: https://health-infobase.canada.ca/substance-related-harms/opioids-stimulants/. [Accessed on November 2022].
- Footnote 4
-
Wickham H, Averick M, Bryan J, Chang W, McGowan LD, François R, Grolemund G, Hayes A, Henry L, Hester J, Kuhn M, Pedersen TL, Miller E, Bache SM, Müller K, Ooms J, Robinson D, Seidel DP, Spinu V, Takahashi K, Vaughan D, Wilke C, Woo K, Yutani H, « Welcome to the tidyverse, » Journal of Open Source Software, vol. 4, n°143, p. 1686, 2019.
- Footnote 5
-
Government of Canada, « At-A-Glance: Newly Reported Psychoactive Substances in Canada, » Health Canada Drug Analysis Service, 2022. [Online]. Available: https://www.canada.ca/en/health-canada/services/publications/healthy-living/psychoactive-substances-canada-2020-2021.html.
- Footnote 6
-
Government of Canada, « At-A-Glance: The Emergence of Nitazenes and Brorphine in Canada since 2019, » Health Canada Drug Analysis Service, Royal Canadian Mounted Police, Canada Border Services Agency, 2022. [Online]. Available: https://www.canada.ca/en/health-canada/services/publications/healthy-living/emergence-nitazenes-brorphine-canada-2019.html.
Suggested citation
Government of Canada. (2023). Health Canada Drug Analysis Service. Spotlight: The evolution of Fentanyl in Canada over the past 11 years. Longueuil (QC), 2023. Retrieved from https://www.canada.ca/en/health-canada/services/publications/healthy-living/evolution-fentanyl-canada-11-years.html.
For more information, please contact Health Canada's Drug Analysis Service.
©His Majesty the King in Right of Canada, as represented by the Minister of Health, 2023
Cat.: H139-46/2022E-PDF ׀ ISBN: 978-0-660-46037-6 ׀ Pub.: 220521