
Page 5: National and provincial/territorial tobacco sales data 2021
Pipe tobacco sales
- Pipe tobacco sales in Canada from 2001-2021
- Pipe tobacco sales in Canada by province 2021
- Alberta pipe tobacco sales from 2001-2021
- British Columbia pipe tobacco sales from 2001-2021
- Manitoba pipe tobacco sales from 2001-2021
- New Brunswick pipe tobacco sales from 2001-2021
- Newfoundland and Labrador pipe tobacco sales from 2001-2021
- Nova Scotia pipe tobacco sales from 2001-2021
- Ontario pipe tobacco sales from 2001-2021
- Quebec pipe tobacco sales from 2001-2021
- Saskatchewan pipe tobacco sales from 2001-2021
- Prince Edward Island, Northwest Territories, Nunavut and Yukon pipe tobacco sales from 2001-2021
Since 2001, tobacco companies have been required by the Tobacco Reporting Regulations to provide Health Canada with reports on sales of tobacco products.
There are three important factors to consider when using these data:
- The data are subject to ongoing revision due to re-submissions by tobacco companies and/or audits by Health Canada.
- Sales represent shipments to wholesalers or retailers in a province/territory. Sales totals may not be representative of tobacco consumption for that province/territory.
- In certain cases, provincial/territorial sales were not reportable due to a limited number of companies active in that market. In these cases, the data were merged into a larger geographical grouping.
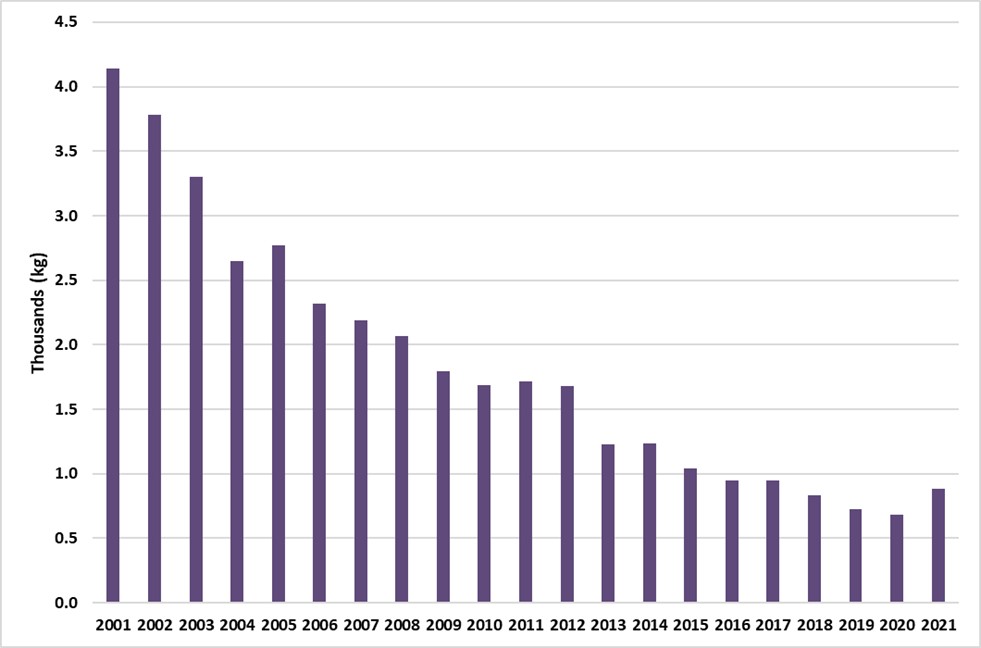
Pipe tobacco sales in Canada from 2001-2021
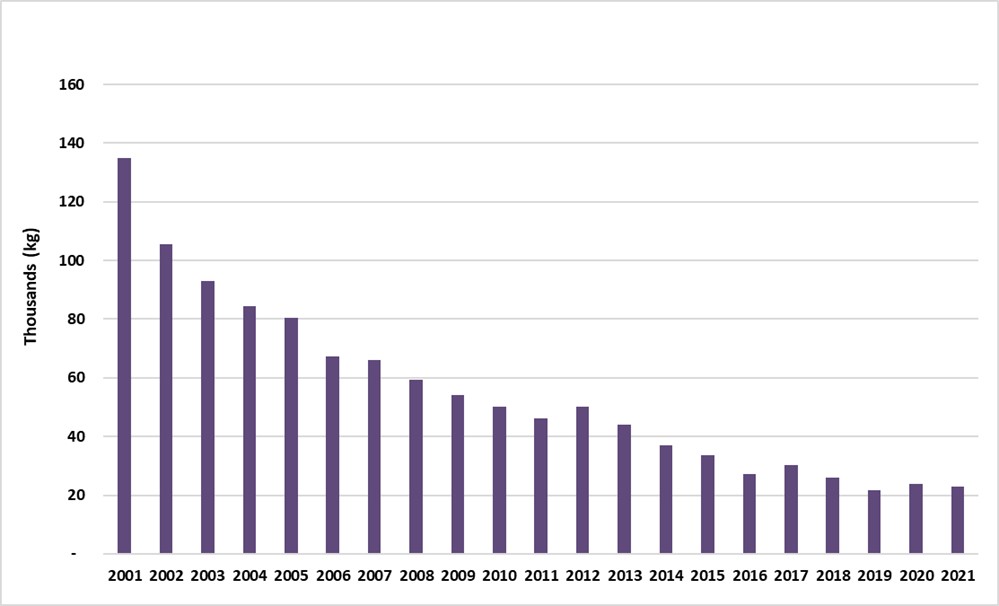
| Year | Kilograms |
|---|---|
| 2001 | 135,010 |
| 2002 | 105,409 |
| 2003 | 93,071 |
| 2004 | 84,383 |
| 2005 | 80,338 |
| 2006 | 67,239 |
| 2007 | 66,197 |
| 2008 | 59,425 |
| 2009 | 54,112 |
| 2010 | 50,297 |
| 2011 | 46,038 |
| 2012 | 50,056 |
| 2013 | 43,931 |
| 2014 | 37,087 |
| 2015 | 33,653 |
| 2016 | 27,319 |
| 2017 | 30,140 |
| 2018 | 25,855 |
| 2019 | 21,671 |
| 2020 | 23,735 |
| 2021 | 22,817 |
Pipe tobacco sales in Canada from 2001-2021 - Text Equivalent
Bar graph showing pipe tobacco sales in Canada from 2001 to 2021. Pipe tobacco unit sales decreased from 135 thousand kilograms in 2002 to 23 thousand kilograms in 2021.
Pipe tobacco sales in Canada by province 2021 - 22,817kg
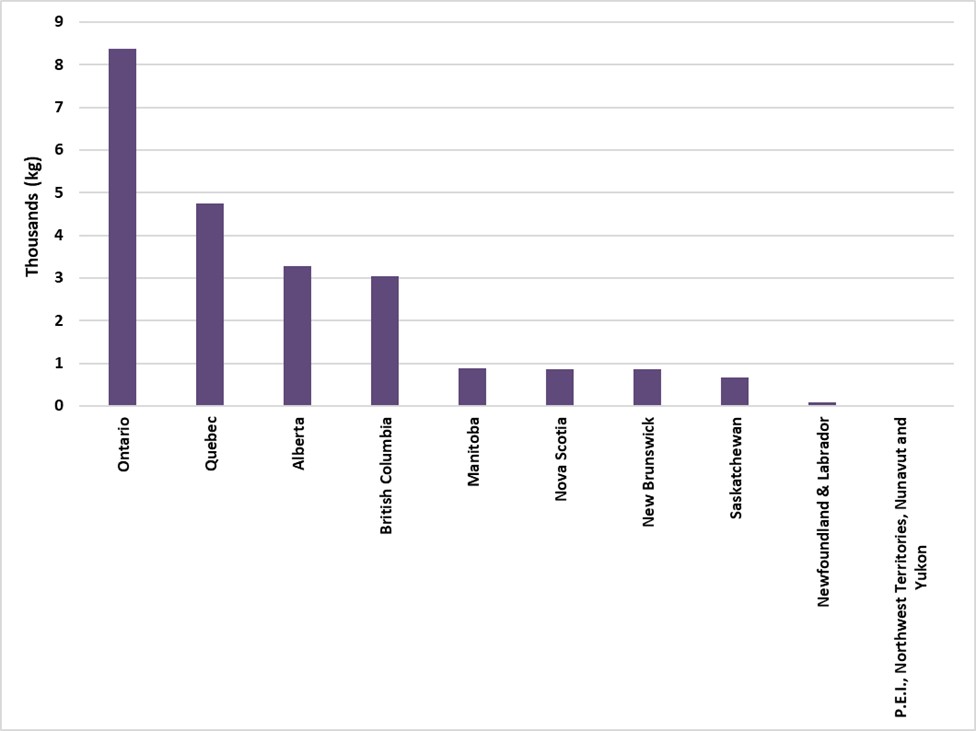
| Province | Kilograms |
|---|---|
| Ontario | 8,367 |
| Quebec | 4,738 |
| Alberta | 3,288 |
| British Columbia | 3,047 |
| Manitoba | 880 |
| Nova Scotia | 865 |
| New Brunswick | 857 |
| Saskatchewan | 676 |
| Newfoundland & Labrador | 82 |
| P.E.I., Northwest Territories, Nunavut and Yukon | 16 |
| Canada | 22,817 |
Pipe tobacco sales in Canada by province 2021 - Text Equivalent
Bar graph showing pipe tobacco sales in Canada for 2021. Cigar unit sales were led by Ontario, followed by Quebec and Alberta.
Alberta pipe tobacco sales from 2001-2021
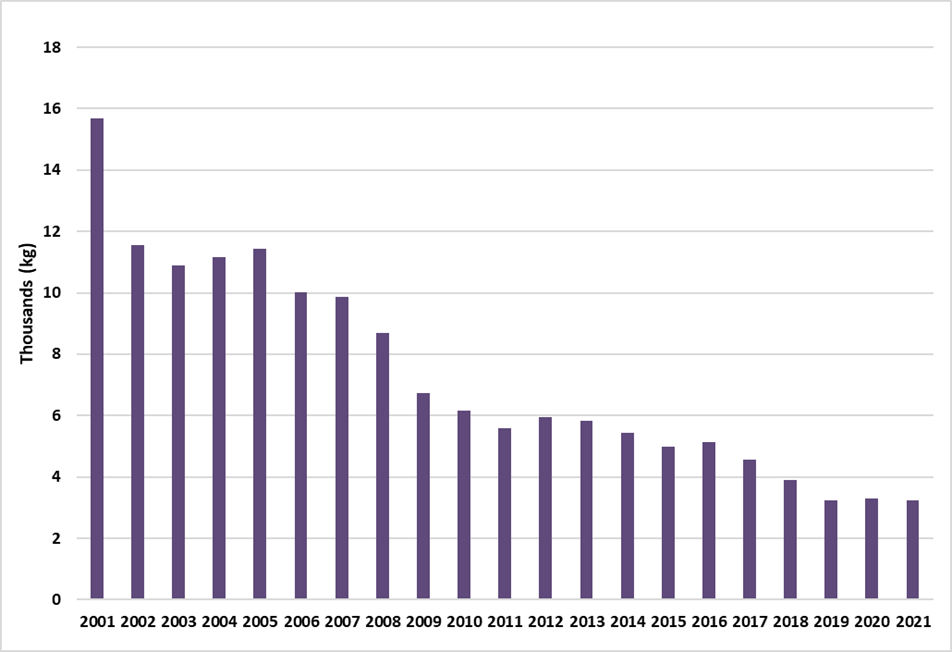
| Year | Kilograms |
|---|---|
| 2001 | 15,678 |
| 2002 | 11,559 |
| 2003 | 10,898 |
| 2004 | 11,164 |
| 2005 | 11,442 |
| 2006 | 10,004 |
| 2007 | 9,876 |
| 2008 | 8,689 |
| 2009 | 6,732 |
| 2010 | 6,156 |
| 2011 | 5,582 |
| 2012 | 5,936 |
| 2013 | 5,821 |
| 2014 | 5,431 |
| 2015 | 4,973 |
| 2016 | 5,127 |
| 2017 | 4,570 |
| 2018 | 3,891 |
| 2019 | 3,234 |
| 2020 | 3,288 |
| 2021 | 3,234 |
Alberta pipe tobacco sales from 2001-2021 - Text Equivalent
Bar graph showing pipe tobacco sales in Alberta from 2001 to 2021. Cigar unit sales decreased from 16 thousand kilograms in 2001 to 3.3 thousand kilograms in 2021.
British Columbia pipe tobacco sales from 2001-2021
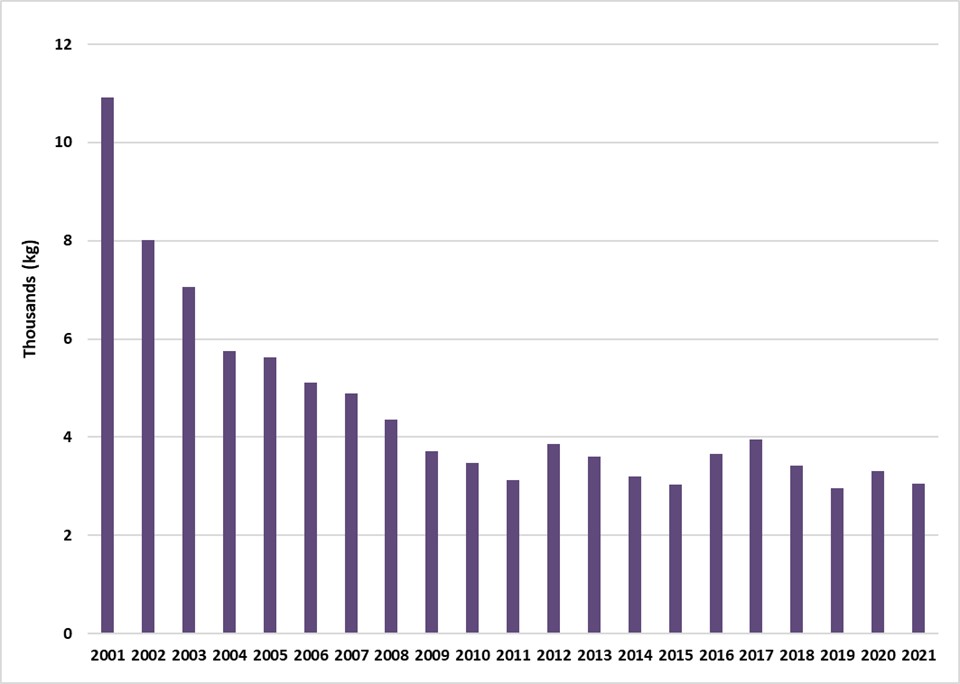
| Year | Kilograms |
|---|---|
| 2001 | 10,909 |
| 2002 | 8,021 |
| 2003 | 7,055 |
| 2004 | 5,760 |
| 2005 | 5,629 |
| 2006 | 5,104 |
| 2007 | 4,890 |
| 2008 | 4,348 |
| 2009 | 3,718 |
| 2010 | 3,465 |
| 2011 | 3,131 |
| 2012 | 3,864 |
| 2013 | 3,609 |
| 2014 | 3,198 |
| 2015 | 3,031 |
| 2016 | 3,665 |
| 2017 | 3,946 |
| 2018 | 3,426 |
| 2019 | 2,956 |
| 2020 | 3,301 |
| 2021 | 3,047 |
British Columbia pipe tobacco sales from 2001-2021 - Text Equivalent
Bar graph showing pipe tobacco sales in British Columbia from 2001 to 2021. Pipe tobacco unit sales decreased from 11 thousand kilograms in 2001 to 3 thousand kilograms in 2021.
Manitoba pipe tobacco sales from 2001-2021
| Year | Kilograms |
|---|---|
| 2001 | 4,140 |
| 2002 | 3,778 |
| 2003 | 3,305 |
| 2004 | 2,652 |
| 2005 | 2,772 |
| 2006 | 2,316 |
| 2007 | 2,192 |
| 2008 | 2,070 |
| 2009 | 1,798 |
| 2010 | 1,686 |
| 2011 | 1,713 |
| 2012 | 1,682 |
| 2013 | 1,230 |
| 2014 | 1,233 |
| 2015 | 1,043 |
| 2016 | 944 |
| 2017 | 949 |
| 2018 | 836 |
| 2019 | 728 |
| 2020 | 685 |
| 2021 | 880 |
Manitoba pipe tobacco sales from 2001-2021 - Text Equivalent
Bar graph showing pipe tobacco sales in Manitoba from 2001 to 2021. Pipe tobacco unit sales decreased from 1,410 kilograms in 2001 to 880 kilograms in 2021.
New Brunswick pipe tobacco sales from 2001-2021
| Year | Kilograms |
|---|---|
| 2001 | 3,448 |
| 2002 | 2,734 |
| 2003 | 2,276 |
| 2004 | 2,142 |
| 2005 | 2,165 |
| 2006 | 2,373 |
| 2007 | 2,181 |
| 2008 | 2,176 |
| 2009 | 2,289 |
| 2010 | 2,238 |
| 2011 | 2,183 |
| 2012 | 2,113 |
| 2013 | 1,983 |
| 2014 | 1,533 |
| 2015 | 1,307 |
| 2016 | 958 |
| 2017 | 1,223 |
| 2018 | 992 |
| 2019 | 881 |
| 2020 | 922 |
| 2021 | 857 |
New Brunswick pipe tobacco sales from 2001-2021 - Text Equivalent
Bar graph showing pipe tobacco sales in New Brunswick from 2001 to 2021. Pipe tobacco sales declined from 3,448 kilograms in 2001 to 857 kilograms in 2021.
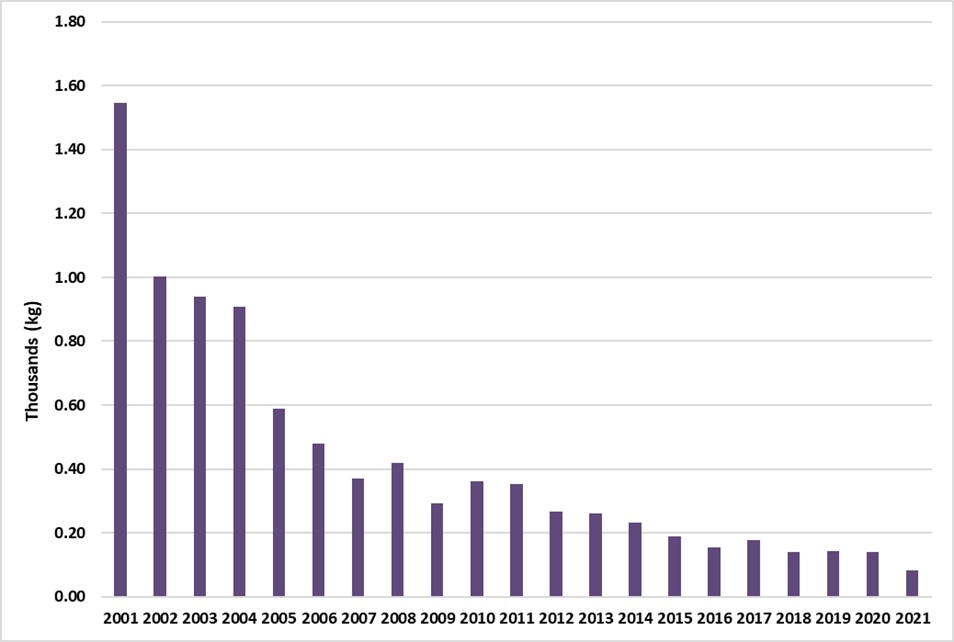
Newfoundland and Labrador pipe tobacco sales from 2001-2021
| Year | Kilograms |
|---|---|
| 2001 | 1,546 |
| 2002 | 1,002 |
| 2003 | 941 |
| 2004 | 908 |
| 2005 | 589 |
| 2006 | 479 |
| 2007 | 371 |
| 2008 | 419 |
| 2009 | 291 |
| 2010 | 361 |
| 2011 | 353 |
| 2012 | 266 |
| 2013 | 261 |
| 2014 | 232 |
| 2015 | 188 |
| 2016 | 154 |
| 2017 | 177 |
| 2018 | 140 |
| 2019 | 142 |
| 2020 | 139 |
| 2021 | 82 |
Newfoundland and Labrador pipe tobacco sales from 2001-2021 - Text Equivalent
Bar graph showing pipe tobacco sales in Newfoundland and Labrador from 2001 to 2021. Pipe tobacco unit sales decreased from 1,546 kilograms in 2001 to 82 kilograms in 2021.
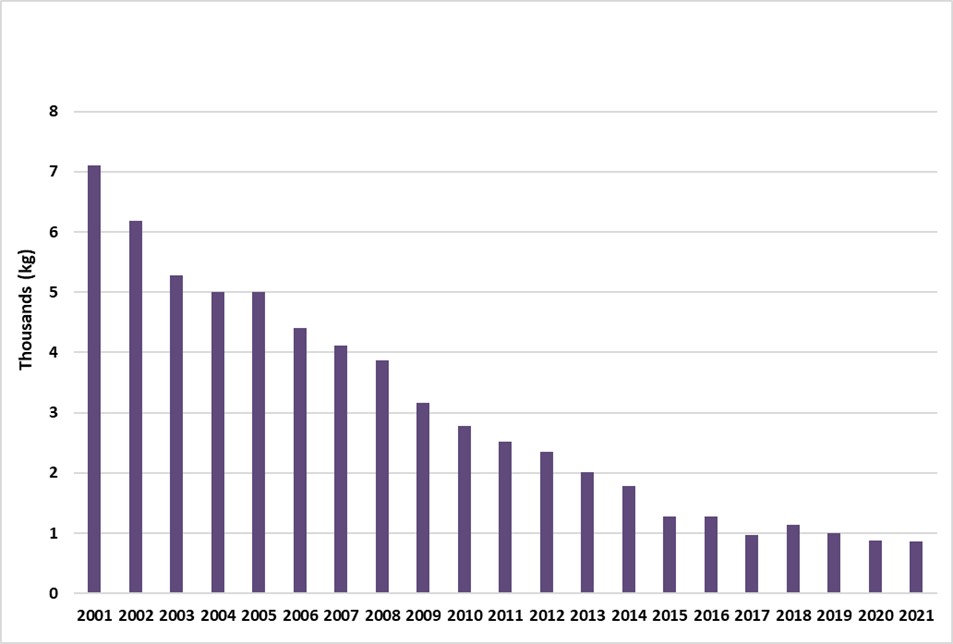
Nova Scotia pipe tobacco sales from 2001-2021
| Year | Kilograms |
|---|---|
| 2001 | 7,113 |
| 2002 | 6,183 |
| 2003 | 5,283 |
| 2004 | 5,008 |
| 2005 | 5,012 |
| 2006 | 4,401 |
| 2007 | 4,107 |
| 2008 | 3,863 |
| 2009 | 3,167 |
| 2010 | 2,787 |
| 2011 | 2,518 |
| 2012 | 2,349 |
| 2013 | 2,013 |
| 2014 | 1,779 |
| 2015 | 1,281 |
| 2016 | 1,282 |
| 2017 | 973 |
| 2018 | 1,147 |
| 2019 | 999 |
| 2020 | 880 |
| 2021 | 865 |
Nova Scotia pipe tobacco sales from 2001-2021 - Text Equivalent
Bar graph showing pipe tobacco sales in Nova Scotia from 2001 to 2021. Pipe tobacco unit sales decreased from 7.1 thousand kilograms in 2001 to 865 kilograms in 2021.
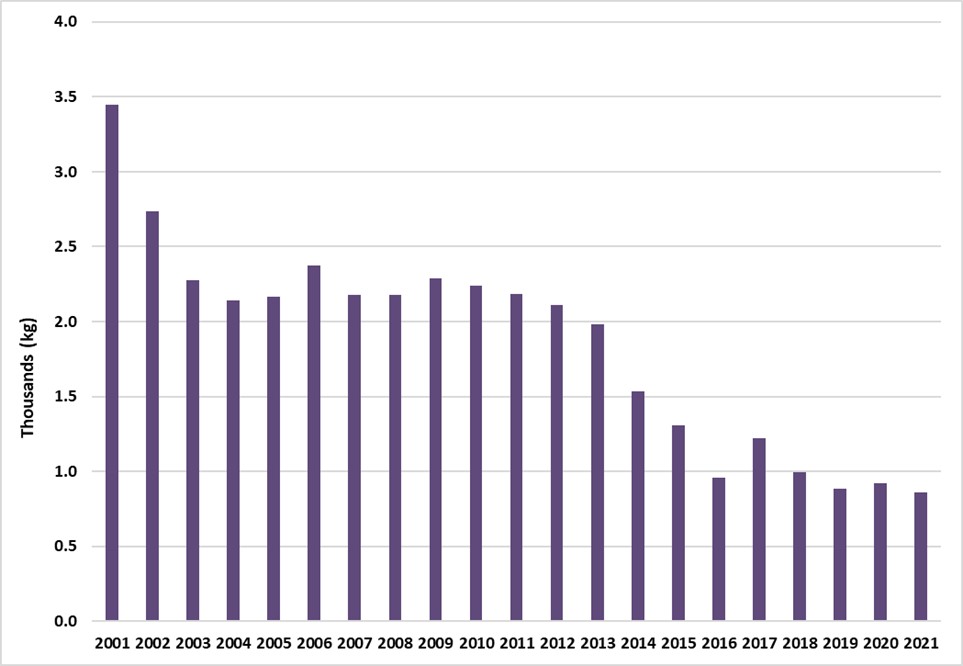
Ontario pipe tobacco sales from 2001-2021
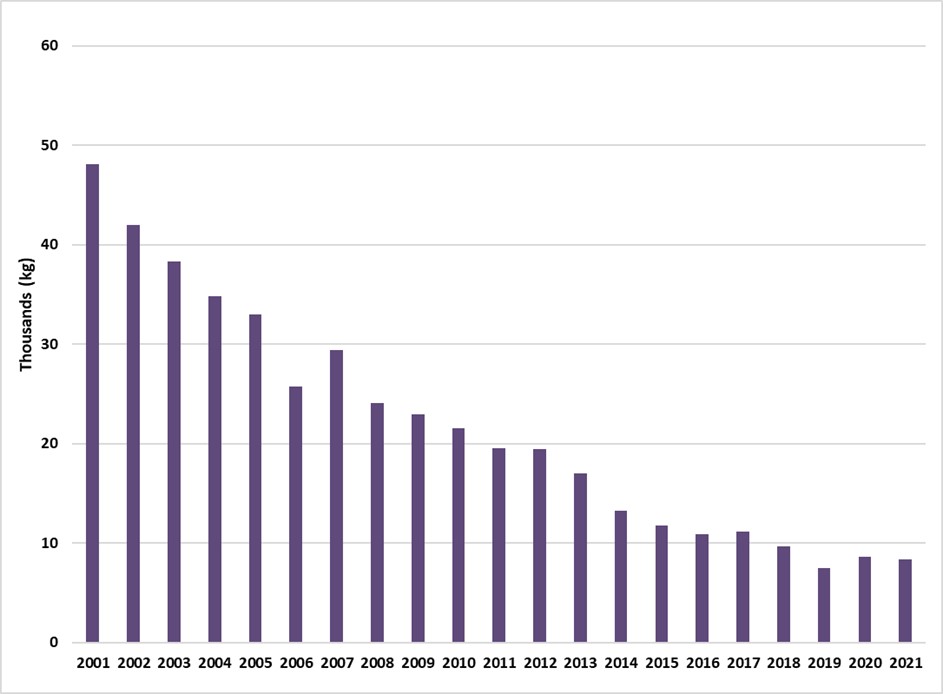
| Year | Kilograms |
|---|---|
| 2001 | 48,101 |
| 2002 | 41,966 |
| 2003 | 38,359 |
| 2004 | 34,798 |
| 2005 | 33,008 |
| 2006 | 25,759 |
| 2007 | 29,386 |
| 2008 | 24,090 |
| 2009 | 22,955 |
| 2010 | 21,558 |
| 2011 | 19,530 |
| 2012 | 19,439 |
| 2013 | 17,033 |
| 2014 | 13,256 |
| 2015 | 11,747 |
| 2016 | 10,843 |
| 2017 | 11,167 |
| 2018 | 9,636 |
| 2019 | 7,508 |
| 2020 | 8,601 |
| 2021 | 8,367 |
Ontario pipe tobacco sales from 2001-2021 - Text Equivalent
Bar graph showing pipe tobacco sales in Ontario from 2001 to 2021. Pipe tobacco unit sales decreased from 48 thousand kilograms in 2001 to 8.4 thousand kilograms in 2021.
Quebec pipe tobacco sales from 2001-2021
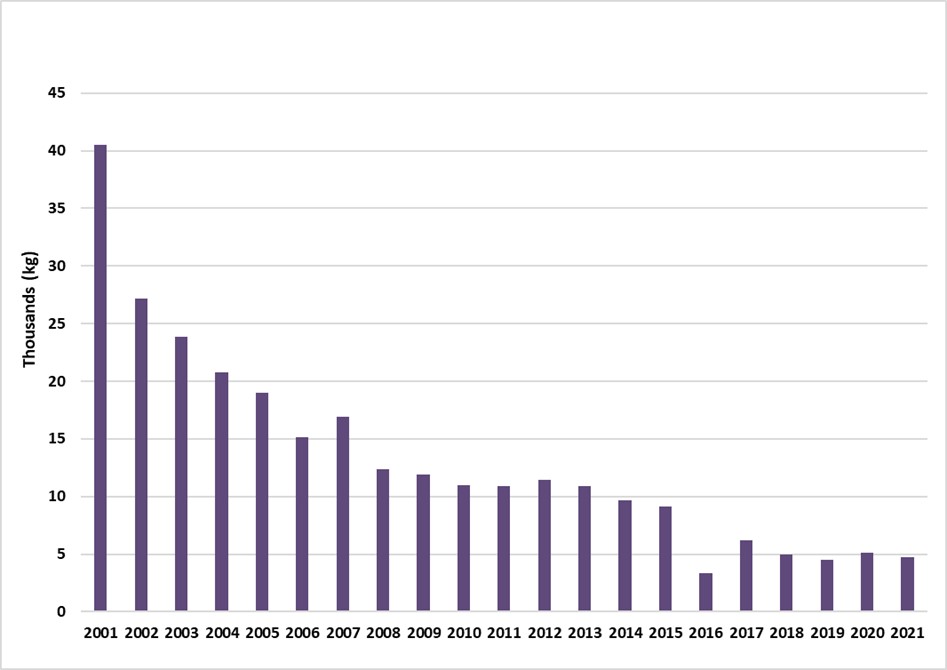
| Year | Kilograms |
|---|---|
| 2001 | 40,476 |
| 2002 | 27,211 |
| 2003 | 23,850 |
| 2004 | 20,776 |
| 2005 | 18,970 |
| 2006 | 15,122 |
| 2007 | 16,920 |
| 2008 | 12,377 |
| 2009 | 11,885 |
| 2010 | 10,954 |
| 2011 | 10,920 |
| 2012 | 11,440 |
| 2013 | 10,886 |
| 2014 | 9,652 |
| 2015 | 9,112 |
| 2016 | 3,369 |
| 2017 | 6,214 |
| 2018 | 4,986 |
| 2019 | 4,535 |
| 2020 | 5,144 |
| 2021 | 4,738 |
Quebec pipe tobacco sales from 2001-2021 - Text Equivalent
Bar graph showing pipe tobacco sales in Quebec from 2001 to 2021. Pipe tobacco unit sales decreased from 40 thousand kilograms in 2001 to 4,738 kilograms in 2021.
Saskatchewan pipe tobacco sales from 2001-2021
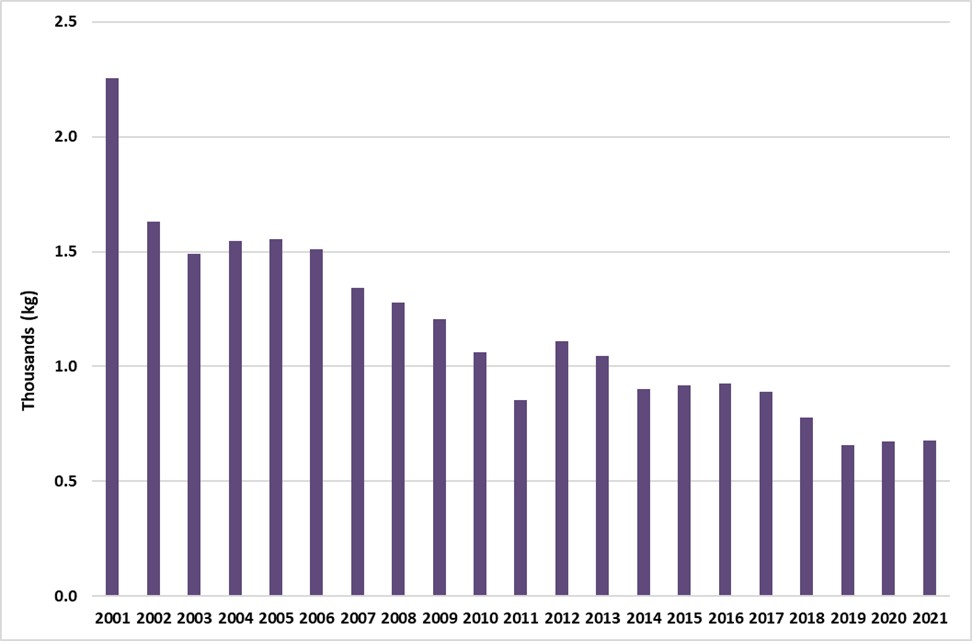
| Year | Kilograms |
|---|---|
| 2001 | 2,256 |
| 2002 | 1,629 |
| 2003 | 1,489 |
| 2004 | 1,545 |
| 2005 | 1,552 |
| 2006 | 1,512 |
| 2007 | 1,342 |
| 2008 | 1,278 |
| 2009 | 1,207 |
| 2010 | 1,060 |
| 2011 | 852 |
| 2012 | 1,110 |
| 2013 | 1,044 |
| 2014 | 901 |
| 2015 | 919 |
| 2016 | 924 |
| 2017 | 890 |
| 2018 | 779 |
| 2019 | 656 |
| 2020 | 674 |
| 2021 | 676 |
Saskatchewan pipe tobacco sales from 2001-2021 - Text Equivalent
Bar graph showing pipe tobacco sales in Saskatchewan from 2001 to 2021. Pipe tobacco unit sales decreased from 2,256 kilograms in 2001 to 676 kilograms in 2021.
Prince Edward Island, Northwest Territories, Nunavut and Yukon pipe tobacco sales from 2001-2021
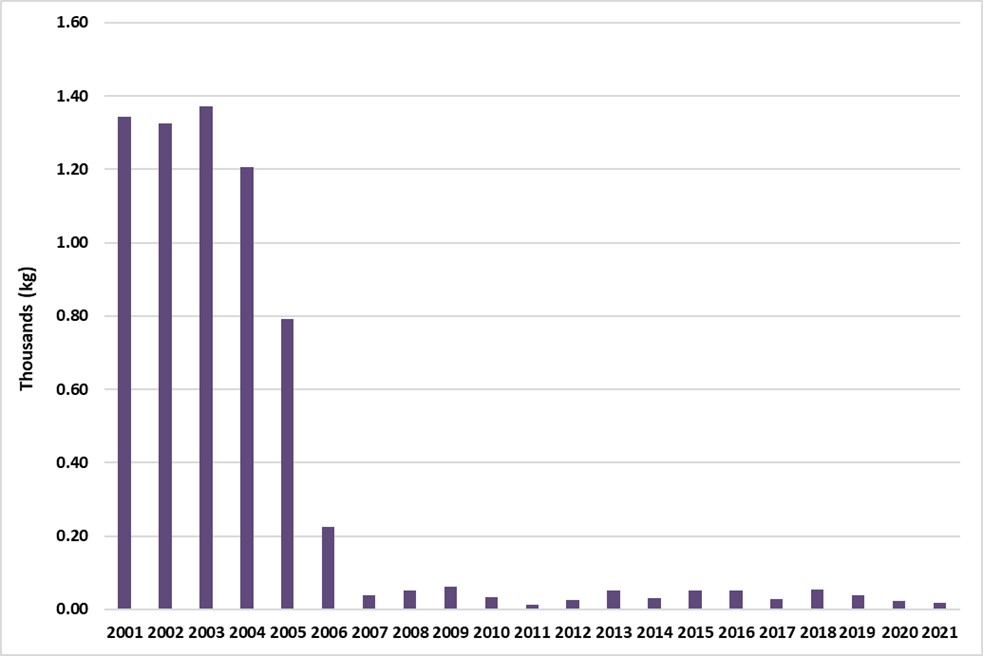
| Year | Kilograms |
|---|---|
| 2001 | 1,343 |
| 2002 | 1,326 |
| 2003 | 1,371 |
| 2004 | 1,207 |
| 2005 | 792 |
| 2006 | 225 |
| 2007 | 37 |
| 2008 | 51 |
| 2009 | 62 |
| 2010 | 32 |
| 2011 | 11 |
| 2012 | 26 |
| 2013 | 51 |
| 2014 | 31 |
| 2015 | 52 |
| 2016 | 52 |
| 2017 | 29 |
| 2018 | 54 |
| 2019 | 37 |
| 2020 | 24 |
| 2021 | 16 |
Sales data for PEI and the territories are merged due to the limited number of companies active in those markets. Unit sales may not represent total consumption as they only include direct shipments by tobacco companies and exclude products shipped from wholesalers in other provinces.
Prince Edward Island, Northwest Territories, Nunavut and Yukon pipe tobacco sales from 2001-2021
Bar graph showing pipe tobacco sales in Prince Edward Island, Northwest Territories, Nunavut and Yukon from 2001 to 2021. Pipe tobacco unit sales decreased from 1,343 kilograms in 2001 to 16 kilograms in 2021.