
Guidelines for Canadian Drinking Water Quality: Guideline Technical Document - Bromate
Download the alternative format
(PDF format, 911 KB, 82 pages)
Organization: Health Canada
Type: Guidelines
Date published: 2018-08-24
Related Topics
Table of Contents
- Part I. Overview and Application
- 1.0 Guideline
- 2.0 Executive summary
- 3.0 Application of the guideline
- Part II. Science and Technical Considerations
- 4.0 Identity, use and sources in the environment
- 5.0 Exposure
- 6.0 Analytical methods
- 7.0 Treatment technology considerations
- 8.0 Kinetics and metabolism
- 9.0 Health effects
- 10.0 Classification and assessment
- 11.0 Rationale for guideline
- 12.0 References
- Appendix A: List of acronyms
- Appendix B: Recommendations for the handling and storage of hypochlorite solutions
Part I. Overview and Application
Guideline
A maximum acceptable concentration (MAC) of 0.01 mg/L (10 µg/L) is established for bromate in drinking water, based on a locational running annual average of a minimum of quarterly samples. Efforts to limit the concentration and/or formation of bromate must not compromise the effectiveness of disinfection.
Executive summary
Bromate is usually found in drinking water as a result of water treatment, rather than through source water contamination. The presence of bromate in treated drinking water is primarily related to the reaction between ozone and naturally occurring bromide in source water and to its formation during the generation of hypochlorite solutions used to disinfect water.
This guideline technical document reviews and assesses all identified health risks associated with bromate in drinking water. It assesses new studies and approaches and incorporates analytical and treatment considerations. Based on this review, the guideline for bromate in drinking water is a maximum acceptable concentration of 0.01 mg/L (10 µg/L), based on a locational running annual average of a minimum of quarterly samples.
2.1 Health effects
Potassium bromate is classified as a possible human carcinogen, based on sufficient evidence of carcinogenicity in experimental animals but inadequate evidence in humans. However, it is clear that the toxicity of potassium bromate is associated with the bromate anion, and is not a function of the salt used in a given toxicological study.
Experimental animal studies have shown links between the ingestion of bromate in drinking water and various types of tumours in rats and mice, including tumours of the kidney, thyroid and testicular mesothelium. Non-cancer health effects related to exposure to bromate were also observed in rodents. No studies were available that reported the health effects in humans resulting from long-term exposure to bromate.
Both cancer and non-cancer risk assessments were considered in the derivation of the MAC. The MAC is based on the cancer risk assessment, which provided the lowest health-based value, but is risk managed in light of the limitations related to technical considerations.
2.2 Exposure
Canadians are primarily exposed to bromate through its presence in drinking water. Bromate has also been detected in ozonated bottled water. Sodium and potassium bromate are used in the production of some consumer products, including in the cosmetic industry. Little bromate is expected to be found in air or soil.
2.3 Analysis and treatment
The establishment of a drinking water guideline must take into consideration the ability to both measure the contaminant and remove it from drinking water supplies. There are several methods available for the analysis of bromate in drinking water. Based on the capacity of commercial laboratories, analytical methods are available to reliably measure bromate in drinking water at concentrations below the MAC.
Bromate is difficult to remove from drinking water once formed. For bromate produced during ozonation, controlling the ozonation process is the recommended approach, as removing bromide from source water is not cost effective. For bromate contamination related to the use of hypochlorite solutions, the best approach is also to minimize its formation by focusing on the use of certified treatment chemicals, including for on-site generation of the hypochlorite solutions, and appropriate handling and storage. The MAC also takes into consideration the requirements for the certification of water treatment chemicals and the need to ensure the microbiological safety of drinking water.
At the residential level, reverse osmosis, distillation and ion exchange devices are expected to be effective for decreasing bromate concentrations in drinking water. However, as the water produced by reverse osmosis and distillation devices may be corrosive to plumbing components, these devices should be installed only at the point of use (a single faucet).
2.4 International considerations
Other organizations have set guidelines or regulations pertaining to the concentration of bromate in drinking water. The World Health Organization’s guideline for drinking-water quality, the United States Environmental Protection Agency’s maximum contaminant level and the European Union’s parametric value are all also set at 0.01 mg/L. The Australia National Health and Medical Research Council established a slightly higher guideline value of 0.02 mg/L.
3.0 Application of the guideline
Note: Specific guidance related to the implementation of drinking water guidelines should be obtained from the appropriate drinking water authority in the affected jurisdiction.
Bromate is a possible human carcinogen, and exposure should be limited as much as possible. However, bromate is found in drinking water as a result of various treatment processes and cannot be effectively removed once formed. The guideline is based on a locational running annual average of quarterly samples, because bromate levels can vary over time, including seasonally, with factors such as the levels of organic matter and ammonia, as well as temperature, pH and alkalinity.
The guideline for a carcinogen is normally established at a level at which the increased cancer risk is “essentially negligible” when a person is exposed at that level in drinking water over a lifetime. In the context of drinking water guidelines, Health Canada has defined “essentially negligible” as a range from one new cancer above background levels per 100 000 people to one new cancer above background levels per 1 million people (i.e., 10-5–10-6). The estimated lifetime risk associated with ingestion of water containing bromate at the MAC is 2.5 × 10⁻⁵, which is slightly above the range that is considered to represent “essentially negligible” risk. The MAC is a risk-managed value based on the challenges associated with obtaining certified hypochlorite solutions with lower bromate concentrations.
The approach for reducing exposure to bromate is generally focused on best practices for both ozonation and the use of hypochlorite solutions.
For ozonation facilities, fluctuations in water quality may require treatment process adjustments to minimize bromate formation. As such, water utilities should be aware of how their process responds to water quality changes and adjust their treatment goals accordingly to optimize their process and minimize bromate formation.
For facilities using hypochlorite solutions, bromate concentrations in drinking water can be minimized by applying the following best practices:
- Purchase hypochlorite solutions that are certified as meeting NSF International (NSF) /American National Standards Institute (ANSI) Standard 60 for the maximum use level (MUL) of 10 mg Cl2/L and that have minimum handling and storage time between product manufacturing and delivery dates.
- For water utilities using on-site systems for the generation of hypochlorite, use a low-bromide salt that is certified as meeting NSF/ANSI Standard 60.
- Follow the handling and storage recommendations outlined in Appendix B.
- Establish a quality control program to verify product quality and manage solution storage.
3.1 Monitoring
All water utilities should implement a risk management approach such as the source-to-tap multi-barrier approach or water safety plan approach. These approaches require a system assessment that involves: characterizing the water source; describing the treatment barriers that prevent or reduce contamination; highlighting the conditions that can result in contamination; and identifying control measures. Operational monitoring is then established and operational/management protocols, including corrective actions and incident responses, are instituted. Compliance monitoring is determined and other protocols to validate the water safety plan are implemented (e.g., record keeping, consumer satisfaction). Operator training is also required to ensure the effectiveness of the water safety plan at all times.
Since ozonation of bromide-containing waters and the use of hypochlorite solutions are currently considered the primary sources of bromate in drinking water, monitoring should focus on these processes.
3.1.1 Source characterization
Water utilities using ozone should characterize their source water to assess water quality parameters (i.e., bromide, temperature, pH, alkalinity, natural organic matter, ammonia) as well as how these change on a seasonal basis.
Quarterly monitoring of raw water bromide is recommended to characterize the source water and allow correlation to bromate (and brominated disinfection by-products). This frequency may be reduced if monitoring for bromate does not show elevated concentrations once the source water has been adequately characterized.
For facilities generating hypochlorite on-site, it important to know the bromide concentration in the water used for the brine as this affects the amount of bromate that can be generated in the hypochlorite solution and subsequently added to the treated water.
3.1.2 Operational monitoring
Since variability of water quality parameters may affect the concentration of bromate in drinking water, monitoring for process control is important.
Seasonal variability of water quality parameters may affect the ozone dose (and the formation of bromate). Therefore, for facilities using ozone, parameters such as ozone, alkalinity, temperature and pH require more frequent process control monitoring. The goal for optimized system operation should be to meet treatment objectives with the lowest possible ozone dose.
For facilities using hypochlorite solutions, process monitoring is also required to ensure water is adequately disinfected and disinfection by-product formation is minimized. Procedures regarding the purchasing, handling and storage of hypochlorite solutions are also required to minimize the bromate concentration in the treated water. It is also important to verify the available chlorine in hypochlorite solutions as this concentration affects the chlorine dose required to achieve disinfection targets and, by association, the bromate concentration in the treated water.
3.1.3 Compliance monitoring
At a minimum, quarterly monitoring of treated water from surface water and groundwater sources is recommended at facilities using ozone or hypochlorite solutions to verify that the MAC is being achieved. It is critical that the effectiveness of disinfection not be compromised by any method used to control bromate concentrations in drinking water. As bromate levels can vary over time due to a number of factors, the guideline value should be compared with the locational running annual average of quarterly samples, to allow adequate response to short term water quality fluctuations that may affect disinfection targets. Although individual monitoring results may exceed the guideline value, this would only be of concern if they caused the locational running annual average of quarterly samples to exceed the guideline value. In systems with re-chlorination stations using hypochlorite solutions, quarterly samples should also be collected where re-chlorinated water enters the distribution system.
For facilities using hypochlorite solutions, the sampling frequency should be representative of the “worst-case” scenario. For example, the available chlorine in the hypochlorite solution will be at its highest concentration when the solution is delivered and will decrease with storage time. Sampling when approximately 80% of the solution is used will provide a close estimate of the maximum amount of bromate being added to the treated water (i.e., close to the maximum storage time). It is important that this exposure to bromate be captured in the sampling plan. Monitoring for bromate may be reduced if elevated concentrations are not observed and the best practices recommended in Appendix B are in place.
For facilities using ozone, sources with highly variable water quality may require more frequent monitoring if elevated bromate concentrations are observed.
The analytical method used to measure bromate concentrations should have a reporting limit of 0.005 mg/L (5 µg/L) or less.
Part II. Science and Technical Considerations
4.0 Identity, use and sources in the environment
The bromate ion (BrO3–; Chemical Abstracts Service [CAS] Registry No. 15541-45-4) has a molecular mass of 127.9 Da. It exists in a number of salts, the most common of which is potassium bromate. Studies investigating the possible health effects of bromate on humans and experimental animals are largely performed with the potassium bromate salt, although sodium bromate has also been studied. Potassium bromate (CAS Registry No. 7758-01-2) is a colourless and odourless crystal that is soluble in water and dissociates into the bromate ion and metal. It has a molecular mass of 167.0 Da, a water solubility of 75 g/L at 25°C and negligible vapour pressure and Henry’s law constant (Environment Canada and Health Canada, 2010). Bromate does not volatilize and adsorbs only slightly to soil or sediment.
The presence of bromate in drinking water is typically associated with drinking water treatment, rather than its presence in source waters.
Salts of bromate are used commercially. Although not all uses of potassium bromate in Canada can be disclosed because of confidential business information, the nature of these uses is primarily industrial and commercial. Potassium bromate is also present as an impurity in a processing aid for paper food packaging (Environment Canada and Health Canada, 2010).
Potassium bromate is a powerful oxidizer and had a common use in baking in the past; however, its use in food is no longer permitted in Canada. In the United States, the Food and Drug Administration has requested that companies omit the use of potassium bromate in their food products, as this compound may be harmful if consumed in sufficient doses (Environment Canada and Health Canada, 2010).
4.1 Environmental fate
Based on its physical and chemical properties, bromate in water is unlikely to volatilize, and its adsorption to soil or sediment is minimal. Available thermodynamic data suggest that complexation of bromate is likely to be negligible in most natural waters. However, seawater and more mineralized waters are expected to weakly complex bromate owing to the increased ionic strength of these waters. Relatively little bromate is expected to partition to sediments and soils. Natural bromate reduction to bromide ion may occur in waters with low oxygen concentrations (Environment Canada and Health Canada, 2010).
5.0 Exposure
Drinking water is considered the primary source of exposure for this assessment. Exposure to bromate from other media (air, soil, food and consumer products) is expected to be negligible.
5.1 Water
Bromate is not reported to occur naturally in source waters (U.S. EPA, 2001a; WHO, 2005). The presence of bromate in drinking water is typically associated with drinking water disinfection, rather than its presence in source waters. In general, all drinking water supplies should be disinfected. Where applicable, an adequate concentration of disinfectant residual should be maintained throughout the distribution system at all times. The most commonly used disinfectant for both primary and secondary disinfection is chlorine, with hypochlorite being the most commonly used form of chlorine.
The presence of bromate in treated drinking water can be related to the reaction between naturally occurring bromide in source water and ozone (Haag and Hoigné, 1983), its formation during the generation of hypochlorite solutions used to disinfect water (Bolyard et al., 1992), when chlorine dioxide is photolyzed in the presence of bromide ion (Gordon and Emmert, 1996), or during the chlorination of bromide-containing waters in the presence of copper (Liu et al., 2012, 2013). The weight of evidence suggests that the ozonation of bromide-containing waters and the use of hypochlorite solutions are the primary sources of exposure to bromate in drinking water.
In Canada, bromate has rarely been detected in raw water. Between 2002 and 2011, bromate was not detected in any of 69 raw water samples taken in Nova Scotia (method detection limit [MDL] = 0.001-0.01 mg/L; Nova Scotia Environment, 2011). In New Brunswick, no bromate was detected in either of two raw water samples taken in 2008 (MDL = 0.003 mg/L; New Brunswick Department of Health, 2011). In Ontario, bromate was detected at a concentration of 1.7 μg/L in one of eight raw water samples collected between 2005 and 2011 (MDL = 0.2 μg/L) (Ontario Ministry of the Environment, 2011).
In the United Kingdom, groundwater contamination with bromate from a chemical production plant has been reported, with bromate concentrations in areas of the plume exceeding 2 mg/L (Butler et al., 2005). Legube (1996) reported that bromate concentrations in 36 raw water sources, including river water, impounded water and groundwater, in Europe were below the detection limit of 2 µg/L and that trace levels (2 and 3 µg/L) were found in two raw water sources. Lefebvre et al. (1995) found the bromate concentrations in three groundwaters, three impounded waters and three river/canal waters in France to be below the detection limit (2 µg/L). Kruithof and Meijers (1995) reported bromate concentrations ranging from 4 to 8 µg/L in four of 36 surface water samples, possibly as a result of industrial oxidation/disinfection processes.
Bromate has been detected in treated drinking water across Canada. In Nova Scotia, bromate was detected in seven of 136 treated water samples collected between 2002 and 2011 at water treatment plants using hypochlorite. Bromate concentrations ranged from 0.0012 to 0.060 mg/L (MDL = 0.001–0.01 mg/L); four samples had bromate concentrations below 0.010 mg/L and three samples had bromate concentrations of 0.060 mg/L (Nova Scotia Environment, 2011).
Newfoundland and Labrador conducted a special monitoring program in 2008 to measure bromate concentrations in 10 communities using ozone. Bromide and bromate concentrations were less than the MDLs (bromide MDL = 0.05 mg/L; bromate MDL = 0.003 mg/L) in all samples (n = 10; Newfoundland and Labrador Department of Environment and Conservation, 2011).
In Quebec, between 2001 and 2011, bromate was detected in 31 of 330 samples submitted by municipal water supplies using ozone and chlorine gas; concentrations ranged from 0.0005 to 0.005 mg/L (MDL = 0.0005–0.004 mg/L), with a median of 0.0017 mg/L and a mean of 0.0019 mg/L. For facilities using ozone and sodium hypochlorite, bromate was detected in 29 of 136 samples; concentrations ranged from 0.0005 to 0.008 mg/L (MDL = 0.0005–0.01 mg/L), with a median of 0.0013 mg/L and a mean of 0.002 mg/L (Ministère du Développement durable, de l’Environnement et des Parcs du Québec, 2011).
In Ontario, between 2005 and 2011, bromate was detected in 342 of 841 samples (MDL = 0.2 µg/L); concentrations ranged from 0.3 to 11.6 µg/L, with a median of 1.1 µg/L and a mean of 2.0 µg/L. No information on treatment processes was provided with the Ontario data. However, maximum concentrations occurred at water treatment plants known to use ozone; mean concentrations at these plants ranged from 2.0 to 5.1 µg/L.
In Manitoba, bromate was detected at a concentration of 0.038 mg/L in one of four treated water samples collected in 2011 (MDL = 0.01 mg/L); no information was provided on treatment processes (Manitoba Conservation and Water Stewardship, 2011).
In Saskatchewan, between 2011 and 2016, bromate was detected in 9 of 37 samples submitted by water supplies using ozone and chlorine gas or sodium hypochlorite; concentrations ranged from 0.008 to 0.42 mg/L (MDL = 0.0003–0.005 mg/L), with a median of 0.030 mg/L and a mean of 0.104 mg/L. For facilities not using ozone, bromate was not detected in any samples (n = 10; MDL = 0.005 mg/L) (Saskatchewan Water Security Agency, 2016).
Two reports were commissioned by Health Canada in 2012 to determine the potential bromate contribution to drinking water from commercially produced sodium and calcium hypochlorite solutions certified to NSF International (NSF)/American National Standards Institute (ANSI) Standard 60 between 2004 and 2011 (NSF, 2012; Underwriters Laboratories LLC, 2012). Data was compiled from product certification and ongoing surveillance evaluations. Samples were collected directly from hypochlorite manufacturers or their distribution terminals during factory audits. These samples were collected from a bulk storage tank, bulk shipping vessel or smaller packaged quantities or, in some cases, were sent directly to the certifier by the manufacturer. Although information regarding the age of the solutions was not provided, audit samples are generally representative of fresh batches.
Table 1. Summary statistics for bromate concentration in undiluted hypochlorite product
| Certification body (type of solution) |
Years analysed | Number of samples | Bromate concentration in undiluted product (mg/kg) | ||
|---|---|---|---|---|---|
| Average | Minimum | Maximum | |||
| NSF – sodium hypochlorite (NaOCl) | 2004 – 2011 | 886 | 31 | 2.0 | 313 |
| NSF – calcium hypochlorite (Ca(OCl)2) | 2004 – 2011 | 73 | 119 | 2.0 | 370 |
Table 2. Estimated bromate contributions to drinking water from commercially produced hypochlorite solutions (normalized results)
| Certification body (type of solution) |
Years analysed | Number of samples | Estimated bromate contribution to drinking water at MUL (µg/L) | ||
|---|---|---|---|---|---|
| Average | Minimum | Maximum | |||
| NSF –NaOCl | 2004 – 2011 | 886 | 2.5 | 0.10 | 26 |
| NSF –Ca(OCl)2 | 2004 – 2011 | 73 | 1.8 | 0.005 | 4.5 |
| UL –NaOCl and Ca(OCl)2 | 2006 – 2011 | 147 Footnote * | 2.5 | 0.3 | 8 |
- Footnote *
-
Of the 147 samples, 142 were sodium hypochlorite and 5 were calcium hypochlorite.
The concentrations of bromate measured in undiluted sodium and calcium hypochlorite solutions are summarized in Table 1. From these results, estimates of the amount of bromate added to drinking water at the maximum use level (MUL) of 10 mg of chlorine (Cl2) per litre can be calculated (i.e., normalized). These normalized results are summarized in Table 2 and indicate that sodium hypochlorite solutions could add, on average, 2.5 µg of bromate per litre of treated drinking water (range = 0.1 to 26 µg/L), with lower concentrations in calcium hypochlorite, when dosed at the MUL. It is important to note that these are estimated concentrations, not actual measured concentrations found in treated drinking water. If a product is found non-compliant, actions can include withdrawing the product certification, lowering the product's MUL, making a change to the manufacturing process, or revising the product formulation.
Coulombe et al. (2015) published actual measured concentrations for nine small utilities in Quebec (population served = 40 to 1,800 people). Bromate concentrations were measured in bulk sodium hypochlorite and in the treated and distribution system water from July 2014 to May 2015 (Ministère du Développement durable, de l'Environnement, et de la Lutte contre les changements climatiques, 2016). Samples were collected on a monthly basis for the first three months of the study and quarterly thereafter. Bromate concentrations in bulk sodium hypochlorite solutions ranged from 1.1 to 24 mg/L (n = 40). For treated and distribution system samples, bromate was detected in 19 of 104 samples (MDL = 0.1–2.0 µg/L). Measured concentrations ranged from 0.2 to 13 µg/L, with a median of 1.3 µg/L and a mean of 3.7 µg/L. One sample exceeded 10 µg/L. Samples taken at five utilities in the United States (n = 5) found bromate concentrations in bulk sodium hypochlorite ranged from 7.7 to 30 mg/L and treated water concentrations ranged from 0.5 to 2.6 µg/L (Snyder et al., 2009; Stanford et al., 2011).
Based on bromate's physicochemical properties, exposure by inhalation or dermal absorption during bathing or showering is considered negligible.
5.2 Food
Bromate has been measured in bottled water at concentrations ranging from < 0.2 to 37.3 µg/L, with average concentrations of 3.72 µg/L for non-ozonated bottled water and 18.14 µg/L for ozonated water (Dabeka et al., 2002). More recently, the presence of bromate in 288 bottled water samples was investigated in a study by the Canadian Food Inspection Agency (CFIA, 2012). It was reported that 87% of samples did not contain detectable levels of bromate, and the remaining samples had bromate concentrations that ranged from 1.2 – 21 ppb (1.2-21 µg/L). Approximately 2% of samples contained bromate at concentrations that exceeded 10 ppb (10 µg/L).
Potassium bromate was once a food additive in Canada, but it is no longer permitted in foods for sale in Canada (Environment Canada and Health Canada, 2010).
5.3 Air
Potassium bromate is not expected to partition to air, as its vapour pressure is negligible. However, small amounts of bromate may be associated with aerosols. One study has reported a small amount of bromate in particulate of Arctic air, determined by ion chromatography. Concentrations of bromate ranged from below the detection limit (<0.01 nmol m−3) to 0.19 nmol m−3 (Hara et al., 2002; Environment Canada and Health Canada, 2010).
5.4 Soil
Very little bromate is expected to partition into sediments and soils. No empirical data on the presence of bromate in soil were available.
5.5 Consumer products
Potassium bromate is used as a processing aid for packaging (Environment Canada and Health Canada, 2010). Both sodium bromate and potassium bromate are used in the cosmetic industry for permanent wave and hair straightening products (Environment Canada and Health Canada, 2010; Suzuta et al., 2012). Potassium bromate can also be used as an oxidizing reagent in laboratories and in the dyeing of textiles (Environment Canada and Health Canada, 2010).
6.0 Analytical methods
The U.S. Environmental Protection Agency (EPA) currently has seven approved methods for the analysis of bromate in drinking water. These analytical methods are based on ion chromatography with various detection techniques. Their MDLs will vary depending upon the laboratory conducting the analysis, the nature of interferences in the sample matrix and the specific instrumentation used. Samples should be collected in precleaned opaque plastic or amber glass bottles containing the appropriate quenching agent for the analytical method. Temperature specifications may apply during transportation and storage of samples. Sample pretreatment methods should remove high concentrations of chloride, which may interfere with bromate measurement.
Table 3 provides an overview of the approved methods: the techniques they use, the applicable MDLs and other analytes that can be measured by each method (if applicable). MDLs must be established using specific quality control criteria. They represent the minimum concentration that can be identified, measured and reported with 99% confidence that the analyte concentration is greater than zero (U.S. EPA, 1997a, 1997b, 2001b, 2002, 2009a, 2009b). In practice, they are calculated from the absolute precision of replicate samples. Some laboratories no longer disclose their MDLs, but rather provide their minimum reporting levels (MRLs). MRLs represent the minimum concentration that laboratories feel confident reporting to data users (Symons et al., 2000). The MRL can be no lower than the concentration of the lowest standard used by the laboratory to calibrate the specific instrumentation used for sample analysis. MRLs can be used only if acceptable quality control criteria are met (U.S. EPA, 1997a, 1997b, 2001b, 2002, 2009a, 2009b).
Water utilities should discuss sampling requirements with the accredited laboratory conducting the analysis to ensure that quality control procedures are met and that MDLs/MRLs are low enough to ensure accurate monitoring at concentrations below the MAC.
In the second six-year review of existing National Primary Drinking Water Regulations, the U.S. EPA maintained the practical quantitation level (PQL) for bromate at 10 µg/L, given the variable laboratory passing rates and the lack of data below 10 µg/L (U.S. EPA, 2009c). The report also noted the availability of two new approved methods, Method 317.0 Rev. 2.0 (MDL range = 0.12-0.98 µg/L) and Method 326.0 Revision 1.0 (MDL range = 0.17–1.2 µg/L). These methods could lead to an overall improvement in analytical performance and possibly support a reduction of the PQL. Since the publication of the U.S. EPA's six-year review in 2009, EPA Methods 302.0 and 557 have been approved, with MDLs of 0.12 and 0.020 µg/L, respectively (U.S. EPA, 2014). Snyder et al. (2004) reported that ion chromatography with conductivity detection methods typically have an MRL of 5 µg/L.
Lower quantification levels may be achievable by some laboratories. For example, the MDLs provided by provinces ranged from 0.0002 to 0.01 mg/L, although the analytical methods associated with these MDLs were not provided. In addition, a number of commercial laboratories were contacted to determine what MRLs are achievable for bromate analysis. The MRLs ranged from 0.0003 mg/L using EPA Method 6850 (modified for bromate analysis) to 0.003 mg/L using EPA Method 317.0 and to 0.010 mg/L using Standard Method 4110 (AGAT Laboratories, 2014; ALS Environmental, 2014; Maxxam Analytics, 2014; SGS Environmental Services, 2014; SRC Environmental Analytical Laboratories, 2014).
Based on the above information, the bromate concentration that is considered measurable by laboratories within reasonable limits of precision and accuracy is 0.005 mg/L using U.S. EPA–approved methods. Water utilities should establish performance measures when specifying which analytical method to use (i.e., sample volume, sampling requirements, sample preservation and storage, MDL).
Table 3. Approved analytical methods for the analysis of bromate in drinking water
| Method (reference) | Technique | MDL (µg/L) | Other analytes of interest |
|---|---|---|---|
| EPA 300.1 Revision 1.0 (U.S. EPA, 1997a) |
Ion chromatography equipped with conductivity detector | 1.32Footnote a–1.44Footnote b | Part A: Bromide, chloride, fluoride, nitrate, nitrite, orthophosphate, sulphate Part B: Bromide, chlorate, chlorite |
| EPA 321.8 Revision 1.0 (U.S. EPA, 1997b) |
Ion chromatography with detection by inductively coupled plasma – mass spectrometry | 0.3 | Not applicable |
| EPA 317.0 Revision 2.0 (U.S. EPA, 2001b) |
Ion chromatography with post-column reagent (PCR) and ultraviolet/visible (UV/VIS) absorbance detection for trace bromate analysis | 0.12Footnote c –0.98Footnote d | Bromide, chlorate, chlorite |
| EPA 326.0 Revision 1.0 (U.S. EPA, 2002) |
Ion chromatography with suppressed acidified PCR and UV/VIS absorbance detection for trace bromate analysis | 0.17Footnote e–1.2Footnote f | Bromide, chlorate, chlorite |
| EPA 302.0 (U.S. EPA, 2009a) |
Ion chromatography with suppressed conductivity detection | 0.12 | Not applicable |
| EPA 557 (U.S. EPA, 2009b) |
Ion chromatography with electrospray ionization tandem mass spectrometry | 0.020 | Haloacetic acids (nine), dalapon |
| ASTM D6581-12 (ASTM, 2012; originally approved in 2000) |
Suppressed ion chromatography with conductivity detection | 0.4214Footnote g–2.73Footnote h | Bromide, chlorate, chlorite |
- Footnote 1
-
Using a 4 mm column.
- Footnote 2
-
Using a 2 mm column; the MDL can be dropped to 1.28 µg/L when high ionic strength water is used.
- Footnote 3
-
Bromate only by post-column UV/VIS absorbance detection.
- Footnote 4
-
Conductivity detection without PCR online; with PCR online, MDL = 0.71 µg/L.
- Footnote 5
-
Bromate by UV/VIS absorbance detection.
- Footnote 6
-
Bromate by conductivity detection.
- Footnote 7
-
Test Method B: Electrolytically suppressed ion chromatography.
- Footnote 8
-
Test Method A: Chemically suppressed ion chromatography.
7.0 Treatment technology considerations
In general, all water supplies should be disinfected, and an adequate concentration of disinfectant residual should be maintained throughout the distribution system at all times. The most commonly used disinfectant for both primary and secondary disinfection is chlorine, with hypochlorite being the most commonly used form of chlorine.
Bromate formation during ozonation is a complex multi-step process involving the bromide ion, molecular ozone, hydroxyl radicals (a decomposition product of ozone) and other water quality parameters (Haag and Hoigné, 1983; Krasner et al., 1991, 1993; von Gunten and Hoigné, 1992, 1994; Siddiqui and Amy, 1993; Kruithof and Meijers, 1995; Siddiqui et al., 1995; Song et al., 1996, 1997; Amy et al., 1997; Westerhoff et al., 1998, 1999; Elovitz and von Gunten, 1999; Elovitz et al., 2000; Gillogly et al., 2001; Hofmann and Andrews, 2001, 2006; Pinkernell and von Gunten, 2001; Hofmann et al., 2002; Chao and Westerhoff, 2003; von Gunten, 2003; Williams et al., 2003; Legube et al., 2004; Naumov and von Sonntag, 2008; Heeb et al., 2014).
When bromide is oxidized, "reactive bromine" species are formed. Under normal drinking water treatment conditions, the important reactive bromine species include the acid/base pair hypobromous acid (HOBr) and hypobromite ion (OBr−). With an acid dissociation constant (pKa) of 8.8, the pH dependency of the HOBr and OBr− equilibrium dictates that above pH 8.8, OBr− is predominant, whereas at lower pH values, HOBr is predominant (Figure 1). The requisite formation of HOBr/OBr− is a critical step in controlling both bromate and brominated disinfection by-products (DBPs) (e.g., some trihalomethanes [THMs] and haloacetic acids [HAAs]), because the pH-dependent speciation of HOBr/OBr− affects the efficacy of strategies used to minimize their concentrations. In addition to pH, the following are important factors that can influence bromate formation: bromide concentration, ozone dose, temperature, alkalinity, organic matter, ammonia and hydrogen peroxide (H2O2); all are further discussed in Section 7.3.
Both ozone and chlorine can oxidize bromide to reactive bromine (i.e., HOBr/OBr−). Further oxidation to bromate is dependent on the mode of action (MOA) of the specific disinfectant. Although chlorine dioxide is an effective oxidant for disinfection purposes, it does not oxidize bromide. Consequently, reactive bromine and bromate are not produced when it is used (Hoigné and Bader, 1994). Hydrogen peroxide with ultraviolet disinfection (H2O2/UV) is an advanced oxidation process that is reported to not produce bromate (Symons and Zheng, 1997; Ikehata and Gamel El-Din, 2006; Wang et al., 2015). However, further research is recommended due to some limitations with these studies (i.e., high MDL, pesticide reduction focus, high quality source, respectively).
Bromate formation by chlorination is not considered significant under typical drinking water treatment conditions (von Gunten, 2003). However, in the case of hypochlorite solutions, bromate can be formed when bromide, which is naturally present in the chloride salt, is oxidized during the manufacturing process (Weinberg et al., 2003; Stanford et al., 2013); bromate is not formed when gaseous chlorine is manufactured (Stanford et al., 2011).
It should be noted that treatment processes and conditions that favour the formation of bromate can also promote the formation of other DBPs. A speciation shift from chlorinated to brominated DBPs may result in an increased mass concentration of DBPs under the same chlorination, pH and temperature conditions (Krasner et al., 1994; Wu and Chadik, 1998). The HOBr formed when bromide is oxidized by ozone and chlorine can react with organic matter present in water to form brominated DBPs (Cooper et al., 1985; Krasner et al., 1989; Glaze et al., 1993; Siddiqui and Amy, 1993). This reaction has been shown to be at least ten times faster than hypochlorous acid (HOCl) DBPs (Symons et al., 1993; Westerhoff et al., 2004).This phenomenon is well-known for chlorination but less so for ozonation. More information can be obtained from the guideline technical documents for THMs and HAAs (Health Canada, 2006, 2008).
Water utilities should have a good understanding of the sources and concentration of bromide in their source waters and the seasonal variability of water quality parameters that may affect the formation of bromate or other DBPs as described in Section 7.3. Although water utilities must balance effective disinfection against the creation of DBPs, it is critical that the effectiveness of disinfection is not compromised by any method used to manage DBP concentrations in drinking water.
Figure 1. Distribution of HOBr and OBr– in aqueous solution in relation to pH (adapted with permission from Haag and Hoigné, 1983)
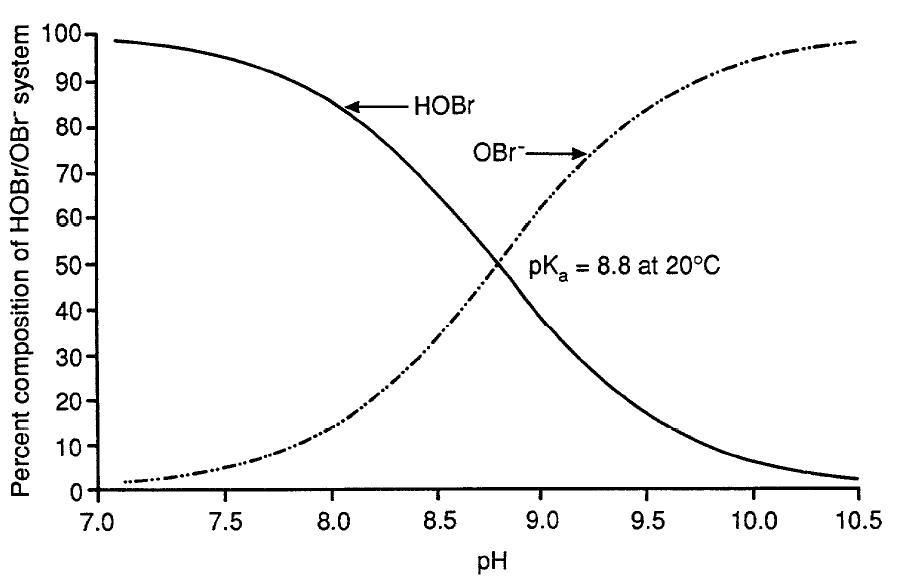
Figure 1. Distribution of HOBr and OBr– in aqueous solution in relation to pH (adapted with permission from Haag and Hoigné, 1983) - Text Equivalent
With a vertical axis, ranging from 0 to 100%, showing the percent composition of HOBr and OBr– in aqueous solution and a horizontal axis showing pH, ranging from 7.0 to 10.5, the graph depicts two lines. At a pH near 7.0, the line depicting the percent composition of HOBr begins at approximately 100%, while the line depicting the percent composition of OBr– begins near 0 percent. As the pH increases, the percent composition of HOBr declines, while the percent composition of OBr– increases. At a pH value of 8.8, the two lines cross at a point where the percent composition for each is 50%, indicating a pKa equal to 8.8 at 20°C. As pH values increase, the line depicting the percent composition of HOBr declines and approaches 0% at a pH of 10.5, while the line depicting the percent composition of OBr– increases, approaching 100% at a pH of 10.5.
7.1 Bromate formation
7.1.1 Ozonation
Considerable research has been conducted to establish the mechanisms for the formation of bromate in ozonated water (Haag and Hoigné, 1983; von Gunten and Hoigné, 1992, 1994; Krasner et al., 1993; Siddiqui and Amy, 1993; Kruithof and Meijers, 1995; Siddiqui et al., 1995; Song et al., 1996, 1997; Amy et al., 1997; Elovitz and von Gunten, 1999; Elovitz et al., 2000; Gillogly et al., 2001; Pinkernell and von Gunten, 2001; Chao and Westerhoff, 2003; von Gunten, 2003; Legube et al., 2004; Naumov and von Sonntag, 2008; Heeb et al., 2014).
In natural waters, it is generally accepted that ozone (O3) reacts with bromide in three ways, as shown in Figure 2. The first is a “direct” pathway whereby O3 and bromide react to form HOBr/OBr−; additional oxidation of OBr− by O3 ultimately forms bromate. In the second pathway, referred to as a “direct/indirect” pathway, O3 and bromide react to form HOBr/OBr−; additional oxidation by both hydroxyl radicals (OH•) and O3 ultimately forms bromate. In the third pathway, referred to as an “indirect/direct” pathway, bromide is oxidized by OH• to form bromine radicals; additional oxidation by O3 ultimately forms bromate.
The reactions involved are extremely complex and non-linear, because both O3 and OH• contribute to the oxidation process. Both are powerful oxidants with oxidation potentials of 2.07 and 2.70 electron volts (eV), respectively, compared with chlorine at 1.49 eV (Dorfman and Adams, 1973). Although OH• is an extremely powerful oxidant, it plays a minor role in disinfection relative to O3 because of its high reactivity with both organic and inorganic compounds in source water (Peyton et al., 1998; Acero and von Gunten, 2001).
Knowledge of the reaction pathways can help water utilities select the most appropriate control strategy. If the dominant pathways are blocked, bromate formation can be minimized. The relative importance of each pathway depends on water quality and treatment conditions as described in Section 7.3. Bench- or pilot-scale studies can be conducted to assess the significance of the pathways.
Figure 2. Main bromate formation pathways (adapted with permission from Song et al., 1997)
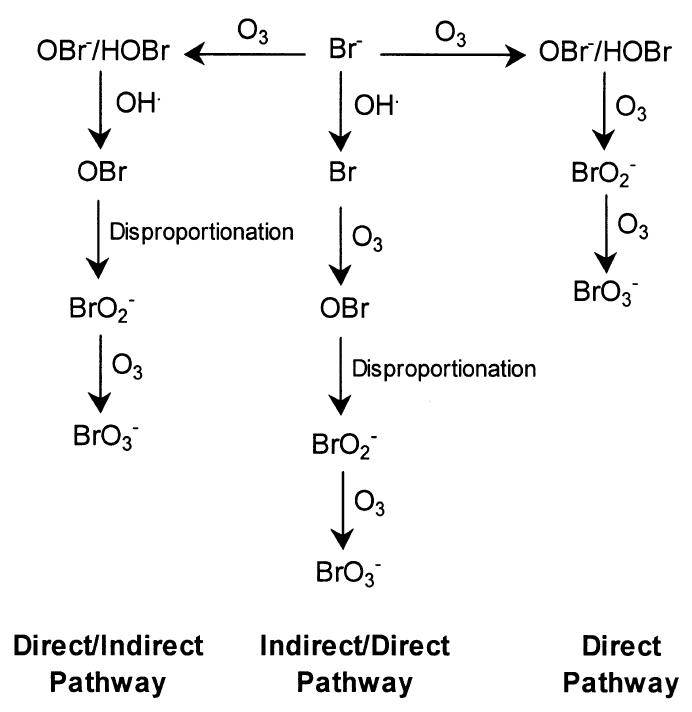
Figure 2. Main bromate formation pathways (adapted with permission from Song et al., 1997) - Text Equivalent
Figure 2 depicts the three main pathways of bromate formation by showing bromide (Br-) as a central starting point with arrows leading away from Br- to the left, right and below and pointing to the main stages within each pathway as follows: firstly, to the right of Br- , the “direct” pathway is shown whereby ozone (O3) and bromide (Br-) react to form OBr-/HOBr which are further oxidized by ozone (O3) to give rise to bromite (BrO2-) which is again oxidized by ozone (O3) to give rise to bromate (BrO3-); secondly to the left of Br-, the “direct/indirect” pathway is shown whereby ozone (O3) and Br- similarly react to form OBr- /HOBr which in turn react with hydroxyl radicals (OH·) which results in disproportionation, yielding both bromine oxide radicals (OBr) and bromite (BrO2-) which are further oxidized by ozone (O3) to yield bromate (BrO3 -), and; thirdly, below Br-, the “indirect/direct” pathway is shown whereby bromide (Br-) is oxidized by hydroxyl radicals (OH·) to yield bromine radicals (Br) which further react with ozone (O3) to yield bromine oxide radicals (OBr) and then, by disproportionation, bromite (BrO2-) which are further oxidized by ozone (O3) to yield bromate (BrO3-).
7.1.2 Hypochlorite treatment chemicals
Hypochlorite solutions are produced by electrolyzing sodium or calcium chloride brines. Bromide naturally co-exists with chloride in the brines and is oxidized to bromate during the manufacturing or on-site generation process. The amount of bromate contamination will depend on the sources of the salt used to produce brines for electrolysis for both commercially produced bulk hypochlorite and on-site generated hypochlorite. The type of electrolysis cells that are used in the manufacturing of commercially produced bulk hypochlorite also affects the process.
Bromide is present at varying concentrations in the different sources of salt used to manufacture hypochlorite solutions. As a result, the bromide content in the brine has a significant impact on the bromate content in the hypochlorite solution (Chlorine Institute, 1999) and is an important consideration for utilities that produce their own hypochlorite using on-site generation equipment (Stanford et al., 2013).
The types of electrolytic cells used to manufacture commercially produced bulk hypochlorite include diaphragm, mercury and membrane cells. Studies have found that when a diaphragm cell is used, 60% of the bromide originating from the brine will end up in the sodium or calcium hydroxide, and 40% in the chlorine; when a mercury or membrane electrolytic cell is used, 20% of the bromide will end up in the sodium or calcium hydroxide, and 80% in the chlorine. When the sodium or calcium hydroxide and chlorine are combined to produce the hypochlorite product, 100% of the bromide ion in the hydroxide product is converted to bromate (NSF/ANSI, 2013).
7.2 Preventing bromate formation
7.2.1 Ozonation
The use of ozone in drinking water treatment is well recognized and has been practiced in Canada since 1954 (Larocque, 1999). Ozonation may be implemented to achieve multiple water quality goals, including, but not limited to, disinfection, reduction of chlorinated DBP concentrations, control of tastes and odours, removal of colour, transformation of organic carbon, enhanced particulate removal and oxidization of inorganic (e.g., hydrogen sulphide, iron, manganese) and organic compounds (e.g., algal toxins, pesticides, pharmaceuticals and personal care products) (Langlois et al., 1991). It should be noted that the use of ozone may increase the biologically available organic content of the treated water. As a result, biologically active filtration may be necessary. Producing biologically stable water is important to stabilize ozonation DBPs, optimize the secondary disinfection process and prevent biological growth in the water distribution system (GLUMRB, 2012). Excess biological growth in the distribution system can lead to undesirable tastes and odours, as well as corrosion (LeChevallier et al., 1993).
Control of the ozonation process is recognized by the U.S. EPA as the best available technology (BAT) to minimize bromate formation (U.S. EPA, 1998, 2006). This recognizes that bromate is difficult to remove once formed and that bromide is not cost effectively removed from source waters. In the U.S., monitoring of bromate for utilities using O3 is based on a running annual average, computed quarterly, of monthly bromate samples collected at the entrance to the distribution system (U.S. EPA, 1998, 2006). The U.S. EPA did not include monitoring for systems using hypochlorite as it was estimated that hypochlorite solutions contributed an average of 0.001 mg/L of bromate (U.S. EPA, 2003). However, it has subsequently been established that contributions from hypochlorite solutions can exceed this concentration (Bolyard et al., 1992; Weinberg, 2003; Snyder et al., 2009; Stanford et al., 2011, 2013; NSF, 2012; Underwriters Laboratories LLC, 2012; Coulombe et al., 2015).
Process optimization will depend on many factors, including the raw water source and characteristics, operational conditions and the water utility’s treatment goals. Process optimization to reduce the formation of DBPs, including bromate, must not compromise the effectiveness of disinfection. Additional information regarding the factors that influence bromate formation is provided in Section 7.3.
7.2.2 Hypochlorite solutions
The handling and storage of hypochlorite solutions are important to minimize the potential for bromate addition to drinking water (Snyder et al., 2009; Stanford et al., 2011). Light, warmer temperatures, organic matter and certain heavy metal cations, such as copper, nickel and cobalt, accelerate the decomposition of the chlorine in the hypochlorite solution (ANSI/AWWA, 2010). The bromate concentration, however, does not decrease (or increase) during storage. As a result, a decrease in chlorine concentration in the hypochlorite solution will lead to an increase in chlorine dose to maintain disinfection targets; the increased chlorine dose will result in a higher bromate concentration in the treated water (Bouland et al., 2005). Snyder et al. (2009) developed recommendations for the handling and storage of hypochlorite solutions to help water utilities minimize the concentrations of contaminants in hypochlorite solutions. These recommendations can be found in Appendix B.
NSF/ANSI Standard 60 sets maximum concentrations for impurities, such as bromate, that may be present in chemicals that are directly added to drinking water as part of the treatment process. This maximum concentration is known as the single product allowable concentration (SPAC). The SPAC represents the maximum concentration that can be contributed to drinking water when hypochlorite is dosed at its MUL, typically based on dosing up to 10 mg Cl2/L. The SPAC for bromate is calculated by dividing the regulatory value for drinking water as harmonized between Canada and the U.S (i.e., 0.01 mg/L) by the number of sources that contribute bromate to drinking water. Based on the limited number of bromate sources (i.e., ozonation of bromide-containing waters, use of hypochlorite solutions and a third unspecified source), the SPAC for bromate is 0.0033 mg/L (i.e., 0.01 mg/L divided by 3) (NSF/ANSI, 2016). Manufacturers of certified hypochlorite treatment chemicals are required to meet this SPAC to safeguard drinking water quality. However, manufacturers may select to reduce the product MUL to as low as 2 mg Cl2/L if a product cannot meet the SPAC at the MUL of 10 mg Cl2/L. Thus, it is important that water utilities consider the maximum anticipated dose at their facilities when purchasing hypochlorite solutions to ensure that the product MUL can achieve this anticipated maximum dose (ANSI/AWWA, 2010). To minimize the amount of bromate added to treated water, utilities should purchase hypochlorite treatment chemicals that are certified as meeting NSF/ANSI Standard 60 for the MUL of 10 mg Cl2/L (NSF/ANSI, 2016) and have minimum handling and storage time between product manufacturing and product delivery (Coulombe, 2016).
The bromate contribution to drinking water during chlorination will therefore depend on the bromate and chlorine concentrations in the sodium hypochlorite solution and the applied chlorine dose, as summarized in Table 4 below. For example, the use of a 12% sodium hypochlorite solution (i.e., 120 g Cl2/L) containing a bromate contaminant concentration of 30 mg/L and application of a 1 mg Cl2/L dose would result in a bromate concentration of 0.25 µg/L in the treated water. If the bromate contaminant concentration in the hypochlorite solution increases to 100 mg/L, the treated water would have a bromate concentration of approximately 0.8 µg/L. It should be noted, however, that at the MUL, this solution would not meet the SPAC for bromate.
For on-site sodium hypochlorite generators, NSF/ANSI Standard 60 specifies that bromide should not exceed 59 mg/kg in NaCl at a chlorine maximum feed concentration of 10 mg/L provided there is no bromide in the water used for brine. If there is 0.5 mg/L of bromide in the water used for brine, the maximum amount of bromide permitted in the salt drops to 36 mg/kg as shown in table 5 below. NSF/ANSI Standard 60 allows a higher concentration of bromide for generators delivering lower maximum feed concentrations of chlorine but the total concentration of bromate must not exceed 0.0033 mg/L and the MUL must not be less than 2 mg Cl2/L (NSF/ANSI, 2016).
Table 4. Bromate concentration in treated water as a function of the applied chlorine dose and bromate concentration in a 12% sodium hypochlorite solution
Applied chlorine dose Footnote * (mg/L) |
NaOCl solution with 15 mg/L bromate | NaOCl solution with 30 mg/L bromate | NaOCl solution with 60 mg/L bromate | NaOCl solution with 100 mg/L bromate |
|---|---|---|---|---|
| Bromate concentration in treated water (µg/L) | ||||
| 0.7 | 0.09 | 0.18 | 0.35 | 0.58 |
| 1.0 | 0.13 | 0.25 | 0.50 | 0.83 |
| 1.3 | 0.16 | 0.33 | 0.65 | 1.08 |
| 2.0 | 0.25 | 0.50 | 1.00 | 1.67 |
| 2.5 | 0.31 | 0.63 | 1.25 | 2.08 |
| 10.0 (MUL) | 1.25 | 2.50 | 5.0 | 8.33 |
- Footnote *
-
Chlorine concentration = 120 g/L.
Table 5. Bromate concentration in treated water as a function of bromide concentration in salt used for on-site generation of hypochlorite solutionsFootnote *
| Bromide in water used for brine (mg/L) |
Bromate contribution from brine water (µg/L) |
Bromate in treated water from salt (µg/L) |
Maximum allowable bromide in salt (ppm) |
|---|---|---|---|
| 0.0 | 0.0 | 3.3 | 59 |
| 0.05 | 0.1 | 2.9 | 52 |
| 0.5 | 1.0 | 2.0 | 36 |
| 1.0 | 2.0 | 1.0 | 18 |
- Footnote *
-
Allowable bromate concentration in treated water of 3.3 µg/L
It is recommended that water utilities establish a quality control program to verify product quality and manage solution storage. ANSI/AWWA Standard B300 recommends a verification program to confirm that hypochlorite treatment chemicals meet specifications, particularly for available chlorine. This concentration affects the chlorine dose required to achieve disinfection targets and, by association, the bromate concentration added to the treated water. Test procedures are described in the standard (ANSI/AWWA, 2010).
7.3 Factors influencing bromate formation during ozonation
7.3.1 Bromide concentration
Bromide ion can occur naturally from saltwater intrusion and the dissolution of geological formations, or it can enter water sources by human activities, such as the spreading of methyl bromide on crops, the spreading of salt on roads during winter, sewage or industrial effluent discharges, as well as contamination by landfill leachate or brominated flame retardants used in textile manufacturing (Siddiqui et al., 1995; Boyer et al., 2013; States et al., 2013; McTigue et al., 2014; Regli et al., 2015; Winid, 2015). Specific human activities with reported impacts on DBP concentrations due to bromide discharges to the environment include salt mining (Carrasco-Turigas et al., 2013), hydraulic fracturing operations and blowdown wastes from coal power plants (Cornwell, 2014) and textile manufacturing (Greune and Knappe, 2014). Water utilities should identify natural and anthropogenic sources of bromide by adequately characterizing their source water. Monitoring of seasonal changes is important to ensure that water utilities evaluate impacts of seasonal variations on the full range of raw water conditions (Valade et al., 2009; Huck and Sozański, 2011). For river sources with a high volume of sewage or industrial discharges that contain bromide, peak concentrations may occur during low flow conditions (States et al., 2013).
Relatively little information is available on the occurrence of bromide in Canadian water bodies. Bromide concentrations were measured in March and August 1993 in 53 Canadian drinking water sources, including rivers (n = 28), lakes (n = 19), impoundment (n = 1), wells (n = 3) and a mixture of these sources (n = 2) (Health Canada, 1995). Bromide was detected in only two of 52 March raw water samples (0.2 and 0.5 mg/L), likely because of the high MDL of 0.01 mg/L; both were river sources. Bromide was detected in 10 of 37 August raw water samples (MDL = 0.002 mg/L); these were from five lake and five river sources. Bromide concentrations ranged from 0.006 to 0.070 mg/L (mean = 0.030 mg/L). Bromide was detected more frequently in treated and distribution system samples, 24 of 51 and 25 of 50 samples, respectively, as raw water samples were not collected for all sources as part of the August sampling. Concentrations ranged from 0.002 to 0.32 mg/L (mean = 0.023 mg/L) and from 0.002 to 0.49 mg/L (mean = 0.030 mg/L) for treated and distribution system samples, respectively. The results from Ontario’s most recently published Drinking Water Surveillance Program (Ontario Ministry of the Environment, 2009) indicated that bromide concentrations ranged from 0.0002 to 1.09 mg/L in 2009, with a median of 0.028 mg/L and a mean of 0.060 mg/L (n = 70). Health Canada conducted a drinking water survey of high-bromide sources in Canada in winter 2012 and summer 2013. Bromide was detected in 22 of 23 raw water samples (MDL = 0.006 mg/L); concentrations ranged from 0.034 to 2.55 mg/L, with a median of 0.505 mg/L and a mean of 0.62 mg/L (Health Canada, 2014a). In Quebec, raw water bromide concentrations were measured at nine small utilities from July 2014 to May 2015 (n = 71); concentrations ranged from 16 to 1,100 µg/L (MDL = 1.0 µg/L) with a median of 74 µg/L and a mean of 163 µg/L (Ministère du Développement durable, de l’Environnement, et de la Lutte contre les changements climatiques, 2016). In a study of 23 cities in the United States and Canada, bromide concentrations ranged from 0.024 to 1.12 mg/L (median of 0.109 mg/L) in source waters (Richardson et al., 2008). In the United States, the average raw water bromide concentration was found to be approximately 0.1 mg/L in a study undertaken to assess the nationwide occurrence of bromide in preparation for new DBP regulations (Amy et al., 1994).
Hem (1985) reported that bromide concentrations in rainwater and snow range from approximately 5 µg/L to > 150 µg/L. Water sources that are highly dependent on rainwater or snowmelt should also be tested to determine the bromide concentration in raw water, particularly if drinking water is disinfected using ozonation or chlorination, because of the potential to form bromate or chlorination DBPs, respectively.
In general, most researchers report that increasing the bromide concentration tends to lead to an increase in bromate formation during ozonation. However, because other water quality parameters influence the oxidation process, it is difficult to instinctly predict bromate formation potential. For example, bromate formation potential was evaluated by Gillogly et al. (2001) for three source waters with similar bromide concentrations (bromide concentration = 145, 170, 200 µg/L; O3 dose = 1 mg/L per milligram dissolved organic carbon [DOC]); measured bromate concentrations were 23, 4.2 and 35 µg/L, respectively. The source with low bromate (4.2 µg/L) was found to contain natural ammonia, which inhibits bromate formation (see Section 7.3.7).
Water utilities should have a good understanding of the bromide concentrations in their source water to control the formation of bromate and other brominated DBPs. For example, if it is determined that 100% of bromide is converted to bromate during ozonation, a maximum amount of bromate can be calculated. This can be a useful quality control tool for water utilities (Westerhoff, 2014).
Monitoring of raw water bromide is recommended to characterize the source water and allow correlation to bromate (or brominated DBPs) formation (Owen et al., 1993; McTigue et al, 2014; Wang, 2014). If monitoring for bromate (or brominated DBPs) does not indicate elevated concentrations, monitoring for bromide may be reduced once the source water has been adequately characterized.
A number of commercial laboratories were contacted to determine what MRLs are achievable for bromide analysis. The MRLs ranged from 0.001 mg/L using EPA Method 317.0 to 0.3 mg/L using EPA Method 4110 (AGAT Laboratories, 2014; ALS Environmental, 2014; Maxxam Analytics, 2014; SGS Environmental Services, 2014). Water utilities should ensure that the MRL is low enough for their purposes when specifying which analytical method to use; laboratories may offer a lower MRL if requested. It is recommended that the MDL for bromide be 0.01 mg/L (10 µg/L) or less (Westerhoff, 2014).
7.3.2 Ozone dose
Ozone dose plays an important role in bromate formation. In general, applying a higher O3 dose leads to higher bromate formation (Krasner et al., 1993; von Gunten and Hoigné, 1994). The O3 dose required will be dictated by the water utility’s treatment objectives and water quality characteristics and may vary due to seasonal changes in temperature as well as fluctuations in natural organic matter (NOM) and other water quality characteristics. The location where O3 will be dosed should be established as it relates to treatment objectives (i.e., pre-ozonation or intermediate ozonation). Krasner et al. (1993) reported that the O3 dose required to meet O3 demand was proportional to DOC concentrations. Typical O3/DOC dose ratios reported in the literature generally range from 0.5 to 1.0 mg O3/mg DOC. Westerhoff et al. (2005) reported that O3 doses and concentrations relevant to the drinking water industry typically range from 0.1 to 5 mg/L, although doses as high as 16–20 mg/L for colour removal (total organic carbon [TOC] = 8.3 mg/L) have been reported (Loveland et al., 2004). Thompson and Drago (2015) reported that the average O3 dose was 4.4 mg/L at surface water filtration plants and 11 mg/L at groundwater treatment facilities. The authors noted that the O3 dose required to oxidize hydrogen sulphide and colour in groundwater tends to be significantly higher that the dose required to achieve surface water treatment goals.
Water utilities should be aware of seasonal changes to optimize the applied O3 dose at all times while minimizing the formation of bromate and other DBPs. The goal for optimized system operation should be to meet treatment objectives with the lowest possible O3 dose (Rakness et al., 1996). Determining the O3 demand and decay beforehand will help optimize the process. The bench-scale “solution ozone test” can be used to estimate O3 demand and decay up to a maximum dose of 4 mg/L (Rakness, 2005). Howe et al. (2015) reported that this test was particularly helpful for evaluating seasonal changes in O3 demand for source waters with variable water quality. Alternatively, pilot testing may be necessary.
Water quality, O3 consumption and energy consumption should be monitored to ensure that treatment objectives are met. Information regarding how O3 disinfection performance is measured and optimized, which analyzers are used in drinking water treatment and how calibration affects instrument accuracy is provided in Haught and Fabris (2002), Rakness (2005) and Shen et al. (2015).
It is critical that the effectiveness of disinfection not be compromised by any method used to control DBP concentrations in drinking water.
7.3.3 Temperature
The effects of temperature on bromate formation are threefold: 1) dissolved O3 is more stable at lower temperatures, 2) oxidation rates increase with increased temperature and 3) the pKa of the HOBr/OBr− system decreases as temperature increases (Krasner et al., 1991; Siddiqui et al., 1995). In addition, pathogen inactivation is temperature dependent. Elovitz et al. (2000) studied the influence of temperature on the reaction rates of O3 and OH• . The authors reported an increase in O3 decay rates when temperatures were increased from 5°C to 35°C (pH 8.0); OH• reactions, however, were not influenced by temperature. This supports the general understanding that O3 reactions have a considerable temperature dependency, whereas the OH• reactions have very little temperature dependency. Therefore, reaction pathways involving O3 will be more affected by temperature than those involving OH• (see Figure 2).
Siddiqui and Amy (1993) observed a 20% increase in bromate formation when temperature was increased from 20°C to 30°C (O3/DOC = 3; pH 7.5; bromide = 1.0 mg/L). Kruithof and Meijers (1995) stated that there was a significant increase in bromate formation when temperature was increased from 5°C to 20°C at pH 7.8–8.0 (bromate and bromide data not given). Gillogly et al. (2001) performed batch ozonation experiments to evaluate the effect of temperature on five water sources (pH 7.0; bromide range = 17–200 µg/L). An average of 46% less bromate was formed at 10°C than at 20°C (range 29–54%), even though the O3 exposure was increased to achieve the same level of inactivation at the lower temperature. Legube et al. (2004) reported a 50% increase in bromate formation when temperature was increased from 5°C to 21°C (CT=5 mg O3·min/L; pH 7.6; DOC = 2.6 mg/L; ammonia < 10 µg/L).
Conflicting results have also been reported in the literature. Krasner et al. (1991) observed that bromate concentrations decreased from 41 to 28 µg/L (approximately 32% reduction) when temperature was increased from 13°C to 23°C in a bench-scale flow-through O3 contactor. Gillogly et al. (2001) found that when a laboratory-scale continuous-flow reactor was used (compared with batch experiments noted above), increasing the temperature from 5°C to 25°C resulted in a 28–85% reduction in bromate formation for seven of eight water supplies; for one supply, there was a 113% increase in bromate formation for the same increase in temperature (pH 7; O3 exposure = 2 log Cryptosporidium inactivation). The hydraulic characteristics of the system controlling O3 exposure were thought to contribute to these results.
The effect of water temperature during treatment is important from the perspective of both pathogen inactivation, which is typically more difficult to achieve at low temperature, and DBP formation, which typically increases with higher temperature, although results vary for bromate specifically. As water utilities cannot adjust the temperature during water treatment, they should be aware of seasonal changes and how their process responds for bromate and other DBP formation, so that they can adjust their water quality goals accordingly (Gillogly et al., 2001).
7.3.4 pH
The influence of pH on bromate formation has been studied in detail (Haag and Hoigné, 1983; von Gunten and Hoigné, 1992, 1994; Krasner et al., 1993; Siddiqui and Amy, 1993; Kruithof and Meijers, 1995; Siddiqui et al., 1995; Song et al., 1996, 1997; Amy et al., 1997; Gillogly et al., 2001; Pinkernell and von Gunten, 2001; Chao and Westerhoff, 2003; Haidri et al., 2003; von Gunten, 2003; Williams et al., 2003; Legube et al., 2004; Bonacquisti, 2006; Heeb et al., 2014).
As shown in Figure 1 above, pH is important in determining the equilibrium of the HOBr/OBr− system. A high pH drives the equilibrium towards OBr−, which readily reacts with O3 and OH• to form bromate, whereas a lower pH drives the equilibrium towards HOBr, which is less amenable to form bromate. At lower pH, the O3 decay rate is also slower, and less O3 is required to achieve disinfection targets.
Researchers consistently report that bromate formation is reduced when pH is lowered. This occurs because the HOBr species, predominant below pH 8.8, is less readily oxidized by O3 or OH•. It is generally accepted that a reduction of 30–50% can be achieved per unit decrease of pH when the initial pH is above 7.5. As a result, pH depression is a control strategy that water utilities can consider to minimize bromate formation, particularly for water with low alkalinity or water subjected to acid addition prior to enhanced coagulation treatment (Song et al., 1997).
A number of trade-offs must be considered when implementing pH depression for bromate control: 1) a low pH is undesirable with respect to corrosion control; hence, supplementary pH adjustment may be necessary; 2) a lower pH increases the formation of HOBr, which can react with organic matter to form brominated DBPs (Glaze and Weinberg, 1993; Glaze et al., 1993); 3) pH adjustment increases the total dissolved solids (TDS) concentration of the water; and 4) the feasibility of pH depression may be limited for high-alkalinity sources owing to the amount of acid that can reasonably be added.
In addition, the common chemicals used to depress pH include carbon dioxide (CO2) and sulphuric acid (H2SO4). Carbon dioxide may be preferred as a safer alternative to H2SO4 and because it stabilizes O3 to a greater extent; however, it is a weaker acid, and costs may be prohibitive if a significant pH change is necessary (Haidri et al., 2003; Williams et al., 2003).
7.3.5 Alkalinity
Alkalinity is an important water quality parameter that is known to affect bromate formation (Krasner et al., 1993; Siddiqui et al., 1995; von Gunten et al., 1995; Song et al., 1996; Peyton et al., 1998; Elovitz et al., 2000; Hofmann et al., 2002; Chao and Westerhoff, 2003; Legube et al., 2004; Hofmann and Andrews, 2006). The primary source of alkalinity is the carbonate system, which is assumed to be at equilibrium in water treatment processes.
It is recognized that bicarbonate (HCO3−) and carbonate (CO32−) act as OH• scavengers; therefore, increasing alkalinity would be expected to decrease bromate formation by blocking the “direct/indirect” and “indirect/direct” pathways. However, alkalinity scavenges OH• according to the following chemical reactions and produces a carbonate radical (CO3•−), which is a mild oxidant (von Gunten et al., 1995):
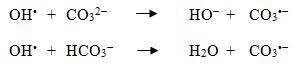
Equation 1 - Text Equivalent
The first equation shows how the hydroxyl radical (OH−) reacts with carbonate (CO32−) to yield hydroxide (HO−) and a carbonate radical (CO3•−). The second equation shows how the hydroxyl radical reacts with bicarbonate (HCO3–) to yield water (H2O) and a carbonate radical.
As a result, when alkalinity scavenges OH•, bromate formation pathways may be blocked or O3 decay may be reduced, thereby allowing more bromate to form via the “direct” pathway, or OBr− may be oxidized by CO3•− to ultimately form bromate. Reaction kinetics are complex, and the literature confirms that alkalinity can either inhibit or promote bromate formation.
Krasner et al. (1993) found that at pH 7, increased alkalinity reduced bromate formation, whereas at pH 8, it increased bromate formation. Von Gunten et al. (1995) reported no significant trend in bromate formation as alkalinity varied (pH 8; bromide = 1 mg/L; alkalinity = 1, 2.5, 10 mM as HCO3−). Song et al. (1996) reported that an increase in alkalinity resulted in increased bromate formation as a result of the oxidation of OBr− by CO3•− (data not shown). Chao and Westerhoff (2003) also reported that bromate formation increased as alkalinity increased (O3 = 3 mg/L; bromide = 170 µg/L; pH 7.5; temperature = 24°C; DOC = 3 mg/L; alkalinity = 20, 50, 100, 200 mg/L as calcium carbonate [CaCO3]). Hofmann et al. (2002) reported that when ammonia was present at 0.4 mg/L, bromate formation was reduced as alkalinity increased (O3 = 2 mg/L; bromide = 0.2 mg/L; pH 7.5; temperature = 20°C; alkalinity = 50, 120, 357 mg/L as CaCO3). Williams et al. (2003) reported similar findings regarding the presence of ammonia for low- and high-alkalinity waters (60 and 130 mg/L as CaCO3, respectively), but attributed the result to changes in pH (see Section 7.3.7). Hofmann and Andrews (2006) observed a 30–50% reduction in bromate formation when alkalinity was increased from 50 to 119 mg/L as CaCO3 in the presence of excess ammonia (pH 7.5; temperature = 22°C); further increases in alkalinity did not result in any additional benefit. The authors noted that the confounding effects of NOM were not considered as part of the study.
The dominant reactions regarding alkalinity will be influenced by source water characteristics and may vary seasonally. Water utilities should be aware of how their process responds for bromate and other DBP formation so that they can adjust their water quality goals accordingly.
7.3.6 Organic matter
Natural organic matter (NOM) is another important water quality parameter that is known to affect bromate formation (Song et al., 1996; Westerhoff et al., 1998, 1999; Acero and von Gunten, 2001; Gillogly et al., 2001; Chiang et al., 2002; Hofmann et al., 2002; Legube et al., 2004; Grefte et al., 2013). NOM is a term used to describe the complex composition of organic material present in source waters. The most common methods used to measure NOM in water are TOC, DOC and UV absorbance at a wavelength of 254 nm (UV254). Specific UV254 absorbance (SUVA) can be used to assess the hydrophobicity of NOM (SUVA = UV254/DOC) (Weishaar et al., 2003). The chemical fractions of NOM can also be measured to assess hydrophobicity and treatability characteristics using liquid chromatography with organic carbon detection. NOM hydrophobicity is influenced by watershed or aquifer characteristics and may change seasonally, during rain events or algal blooms or if changes occur in the source water area (e.g., fire, land development).
The presence of NOM is important for a number of reasons. First, NOM exerts an O3 demand, which may affect the performance of disinfection. Second, NOM reacts with HOBr/OBr− to form DBPs, such as bromoform and bromoacetic acids. Third, NOM scavenges OH•, which may block the “direct/indirect” and “indirect/direct” bromate formation pathways. Fourth, when NOM reacts with O3, it forms OH•, hydrogen peroxide (H2O2) and superoxide (O2−), all of which accelerate O3 decay (Amy et al., 1997; Westerhoff et al., 1999).
When NOM is present, bromate concentrations tend to be lower, because the NOM reacts with O3 and OH•, reducing the amount of oxidant available to oxidize bromide. The amount of bromate formed depends on the nature and amount of the NOM. Ozone reacts preferentially with certain NOM fractions, whereas OH• reacts relatively unselectively (Westerhoff et al., 1998). Legube et al. (2004) also reported that the NOM hydrophobic fraction is less effective at scavenging OH•.
The effect of NOM on bromate formation has been studied for several source waters and NOM compositions. Amy et al. (1997) studied five surface waters (DOC range = 1.95 to 5.05 mg/L) and one groundwater (DOC = 3.00 mg/L) and observed that the presence of the hydrophobic fraction resulted in less bromate formation. Gillogly et al. (2001) studied 14 source waters (surface water, groundwater and surface water/groundwater mix) and also found that the presence of the hydrophobic fraction inhibited bromate formation. The authors concluded that NOM had confounding effects on O3 demand, O3 decay and disinfection and suggested that NOM removal prior to ozonation would be beneficial. This would suggest that intermediate ozonation is preferable to pre-ozonation. Grefte et al. (2013) evaluated one surface water at different stages of treatment with varying DOC concentrations (DOC = 1.1, 3.1, 5.1 mg/L). The authors observed that O3 demand was NOM composition specific and mainly determined by the hydrophobic fraction, which was highly reactive with O3, OH• and HOBr/OBr−. It was concluded that the production of bromate increases as the O3/DOC ratio increases, suggesting that the ratio of O3/DOC should be kept low to minimize bromate formation. This can be achieved by reducing the NOM fraction that consumes O3, thereby lowering the ozone dose.
Water utilities should have a good understanding of their water source and the nature and generation of NOM, whether it changes seasonally and how it relates to O3 demand and bromate formation. The calculation of SUVA can provide water utilities with a good measure of NOM hydrophobicity and be an indicator of changes in source water quality; this would require water utilities to monitor for DOC and UV254 (Westerhoff et al., 1999). The calculation of SUVA is suggested as a process control tool not a bromate control strategy.
7.3.7 Ammonia
The impact of ammonia on bromate formation has been extensively studied (Haag and Hoigné, 1983; Haag et al., 1984; von Gunten and Hoigné, 1992, 1994; Krasner et al., 1993; Siddiqui and Amy, 1993; Kruithof and Meijers, 1995; Siddiqui et al., 1995; Song et al., 1996, 1997; Amy et al., 1997; Amy and Siddiqui, 1999; Gillogly et al., 2001; Hofmann and Andrews, 2001, 2006, 2007; Pinkernell and von Gunten, 2001; Hofmann et al., 2002; Chao and Westerhoff, 2003; von Gunten, 2003; Williams et al., 2003; Legube et al., 2004; Heeb et al., 2014).
Ammonia quickly reacts with HOBr/OBr− to form monobromamine and effectively blocks the “direct” and “direct/indirect” bromate formation pathways shown in Figure 2. As long as the bromide is sequestered as monobromamine during ozonation, it cannot be converted to bromate. However, once the ammonia is fully oxidized, the ability to sequester HOBr/OBr− as bromamines is exhausted, and bromate formation resumes via the “direct” and “direct/indirect” pathways. In essence, the presence of ammonia delays the formation of bromate. As ammonia does not block the “indirect/direct” pathway, some bromate will continue to form via this pathway. Ammonia addition is a recognized control strategy that water utilities can consider to minimize bromate formation, although its effectiveness varies, depending on water quality characteristics.
Siddiqui and Amy (1993) reported that bromate formation was reduced by 36% when ammonia was added before ozonation (ammonia:O3 = 0.25 mg/mg; pH 7.5). Krasner et al. (1993) concluded that the addition of ammonia did not appear to be effective at or below pH 8. Amy and Siddiqui (1999) reported a 20–84% reduction in bromate formation when 1 mg/L of ammonia was added to NOM-free water over a pH range of 6.5 to 8.5. Pinkernell and von Gunten (2001) reported that the addition of ammonia at a concentration of 200 µg/L reduced bromate formation by 50%, but ammonia addition beyond 200 µg/L did not achieve any further reduction. Williams et al. (2003) observed that bromate formation was reduced by 67 and 70% when 0.2 and 0.9 mg/L ammonia were added to a high-alkalinity water (130 mg/L as CaCO3; pH 8), respectively. In a low-alkalinity water (60 mg/L as CaCO3; pH 8), bromate formation was reduced by 40 and 60% for 0.2 mg/L and 0.9 mg/L of ammonia addition, respectively. The decreased effectiveness in low-alkalinity water was attributed to the increased pH that resulted when ammonia was added (i.e., bromate formation increases as pH increases; see Section 7.3.4). At pH 7, Williams et al. (2003) found that bromate formation was not reduced significantly, regardless of the ammonia dose.
The variable results observed by researchers may be attributed to the complex bromate formation mechanisms. Hofmann and Andrews (2001) reported that ammonia reacts with HOBr/OBr− most effectively at pH 9, as this is the mid-point of the pKa values for ammonium (pKa = 9.3) and the HOBr/OBr− system (pKa = 8.8). At pH values between 6 and 8, the reaction slows, allowing more bromate to form through the “indirect/direct” pathway. Hofmann et al. (2002) reported that a high initial concentration of ammonia prolonged the lag time to bromate formation, but that little additional benefit was achieved once the ammonia to bromide ratio exceeded 3:1 (as a molar ratio).
Research has also been conducted on the benefits of modifying this control strategy to a chlorine–ammonia process (Buffle et al., 2004; Neemann et al., 2004; Wert and Benotti, 2010; Benotti et al., 2011; Ikehata et al., 2013). The chlorine converts the bromide to HOBr/OBr−, and the subsequent addition of ammonia (before O3) sequesters the HOBr/OBr− as bromamines preventing bromate formation during ozonation. A patent entitled “Water Treatment Using Ozone and Having a Reduced Likelihood of Bromate Formation from Bromides Formed in the Water” (US 6,602,426,B2) was issued August 5, 2003 for this innovative approach and was placed in the public domain, where it is available for use by water utilities free of charge (Hulsey et al., 2003).
Buffle et al. (2004) observed an 86% reduction in bromate formation in a bromide-spiked water using a chlorine dose of 1.12 mg/L followed by an ammonia addition of 400 µg/L (bromide = 560 µg/L; O3 exposure = 6 mg/L·min; pH 8; temperature = 20°C). Neemann et al. (2004) reported that a combination of chlorine at 0.5 mg/L followed by ammonia at 0.1 mg/L reduced bromate formation by 75–80% (bromide = 60–120 µg/L; pH 7.5–8.2; alkalinity = 130 mg/L as CaCO3; TOC = 2.5–3.5 mg/L). The use of ammonia alone achieved similar results, but the chlorine demand required to consume the residual ammonia was very high, such that the combined chlorine–ammonia process resulted in the lowest chemical doses and operating costs. Wert and Benotti (2010) reported that the chlorine–ammonia process formed less bromate than ammonia alone. Reductions ranged from 20% to 90%, depending on chemical doses (bromide = 73–98 µg/L; O3 = 1–2 mg/L; chlorine = 0–1.5 mg/L; ammonia = 0–0.43 mg/L), with the greatest reduction occurring at the highest chlorine and ammonia doses. The authors also reported that the chemical addition sequence could be changed to ammonia–chlorine without compromising performance, although O3 disinfection appeared more efficient when dosing chlorine first. Benotti et al. (2011) reported that the chlorine–ammonia process scavenges OH• more effectively than ammonia alone, resulting in reduced bromate formation. The authors cautioned that this enhanced OH• scavenging effect could have negative impacts if OH• reactions are required to oxidize taste and odour compounds or pharmaceuticals. Ikehata et al. (2013) compared bromate formation during the ozonation of a coloured groundwater with elevated bromide using ammonia alone and a chlorine–ammonia process (bromide = 240 µg/L; pH 8.2; TOC = 4 mg/L; temperature = 24.3°C). Bromate formation was reduced by 67% and 83% using ammonia concentrations of 0.3 mg/L and 0.6 mg/L, respectively. When chlorine was added at 1.0 mg/L followed by ammonia at 0.2 mg/L, bromate formation was reduced by 68%; this increased to 92% when chlorine was added at 2.0 mg/L followed by ammonia at 0.5 mg/L. The latter was the only option that sufficiently reduced the bromate concentration to below 0.01 mg/L.
A number of concerns have been identified for water utilities considering ammonia addition for bromate control. As monobromamine is oxidized by O3 to bromide and nitrate, bromide becomes available once again to form bromate and generate an O3 demand. Hofmann and Andrews (2006) reported that ammonia addition is unlikely to promote nitrification provided the system is properly designed and water utilities avoid adding excess ammonia. The potential to form nitrogen-containing disinfection by-products should nonetheless be considered (Westerhoff, 2014). More information can be obtained from the guideline technical document for N-nitrosodimethylamine (Health Canada, 2011). In addition, the residual ammonia may be problematic for water utilities using free chlorine for secondary disinfection by exerting a chlorine demand, as reported by Neemann et al. (2004). Wert et al. (2008) investigated the potential to develop biologically active nitrifying filters following ozonation to convert residual ammonia to nitrite/nitrate. The authors concluded that dechlorinated backwash water was required to develop biologically active nitrifying filters with empty bed contact times (EBCTs) of 3.2–8.3 minutes. Nitrification performance was reduced by 60% when the filtration rate was increased from 4.8 to 14.6 m/h. Lastly, there is concern that ammonia addition can increase the pH in low-alkalinity waters. As increased pH affects disinfection targets, water utilities must consider water quality characteristics when implementing ammonia addition as a control strategy.
7.3.8 Hydrogen peroxide
Hydrogen peroxide (H2O2) accelerates the decomposition of O3 into OH•, which is an extremely powerful oxidant. As a result, the addition of H2O2 in combination with O3 is a recognized advanced oxidation process (AOP) that is used to oxidize taste and odour compounds as well as micropollutants, such as pesticides and pharmaceuticals. H2O2 addition has also been evaluated as a control strategy to minimize bromate formation (Song et al., 1997; Amy and Siddiqui, 1999; Speitel et al., 1999; Acero and von Gunten, 2001; Hofmann et al., 2002, 2006).
The following summarizes the chemical reactions that occur (Staehelin and Hoigné, 1982; Westerhoff, 1995; von Gunten and Oliveras, 1997):
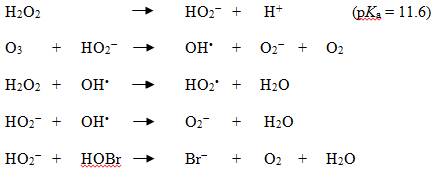
Equation 2 - Text Equivalent
The image shows five chemical reactions. The first reaction shows hydrogen peroxide dissociating into HO2– and H+ at a pKa of 11.6. The second equation shows the reaction between ozone (O3) and HO2– to yield OH•, O2– and O2. The third equation shows hydrogen peroxide reacting with OH• to form HO2• and water (H2O). The fourth equation shows HO2– reacting with OH• to yield O2– and water. The fifth equation shows HO2– reacting with hydrobromous acid (HOBr) to yield bromide (Br−), O2 and water.
The last step is the critical reaction for bromate and involves the chemical reduction of HOBr to bromide (Br−). As both hydrogen peroxide (pKa = 11.6) and bromine (pKa = 8.8) are pH dependent, there is a strong pH dependency when using H2O2 as a bromate control strategy, with the reaction being most effective at the mid-point of the pKa values (~ pH 10.2). Therefore, the interpretation of conflicting results reported in the literature may need to consider pH effects.
Song et al. (1997) reported mixed results with regard to the effect of H2O2 addition on bromate formation in four water sources (pH 7.5; O3= 6 mg/L; bromide = 400 µg/L; DOC = 3 mg/L; H2O2 = 0.35 mg/mg O3). Bromate formation increased by 30–36% in two sources, but decreased by 30–64% in the other two sources. Amy and Siddiqui (1999) observed that the addition of H2O2 increased bromate formation at pH 6.5, but decreased bromate formation at pH 8.5 (bromide = 500 µg/L; O3 = 3 mg/L; H2O2 = 0, 0.2, 0.3, 0.5 mg/L). Speitel et al. (1999) evaluated two sources with different water quality characteristics. In one source, bromate was reduced by > 80% at an O3 dose of 1 mg/mg TOC and H2O2 addition of 0.4 mg/mg O3; in the other source, no benefit was observed.
Acero and von Gunten (2001) found that the addition of H2O2 accelerated O3 decay significantly in water with low DOC and high alkalinity (DOC = 1 mg/L; alkalinity = 5.2 mM HCO3−), whereas in the presence of high DOC and low alkalinity (DOC = 3.2 mg/L; alkalinity = 3.8 mM HCO3−), the addition of H2O2 did not significantly change O3 decay patterns. This may also explain the conflicting results reported by researchers for various water sources.
Water utilities considering H2O2 addition for bromate control should be aware that it leads to rapid O3 decay and could therefore cause disinfection to be inadequate. If treatment objectives include both advanced oxidation and disinfection, H2O2 addition is not recommended (Hofmann, 2014). As with other parameters, water utilities should be aware of how their process responds so that they can make the appropriate adjustments (Amy and Siddiqui, 1999; Speitel et al., 1999).
7.4 Municipal-scale ozone treatment
7.4.1 Minimizing bromate formation
There are several steps that water utilities can take to minimize bromate formation. First, water utilities should have a good understanding of their source water characteristics (e.g., bromide, temperature, pH, alkalinity, NOM and ammonia), as well as how these change on a seasonal basis. Second, the O3 design dose should be determined relative to treatment objectives (e.g., disinfection, taste and odour control, colour removal, etc.) and seasonal source water characteristics. The location where O3 will be dosed (pre-ozonation or intermediate ozonation) should also be established as it relates to treatment objectives. Given that water quality parameters may fluctuate over the year, the O3 dose may also be varied to minimize bromate formation.
If the bromate MAC cannot be achieved by optimizing the system design and operational procedures, the most commonly used control strategies are pH depression (see Section 7.3.4) and ammonia or chlorine–ammonia addition (see Section 7.3.7). These strategies can typically achieve a 50% reduction in bromate formation on their own, or greater reduction if combined (Pinkernell and von Gunten, 2001; Hofmann et al., 2002). Water utilities must consider the trade-offs when implementing these control strategies, as outlined in Sections 7.3.4 and 7.3.7. The addition of H2O2 may also be an option for some sources, although its effectiveness varies, based on water quality characteristics; this control strategy is not recommended if O3 is being used for disinfection credits, as outlined in Section 7.3.8.
Bench- or pilot-scale testing is recommended prior to selecting ozonation to ensure it is the most appropriate solution with respect to water quality characteristics, treatment objectives and bromate formation.
7.4.2 Removal of bromate after formation
Although the recognized BAT is the control of the ozonation process to minimize bromate formation, it is technically possible to remove bromate after formation using several treatment approaches, including activated carbon, ferrous iron addition, UV irradiation, membranes and anion exchange resins. However, these methods have been evaluated primarily at bench and pilot scales, and little information is available for full-scale applications (Siddiqui et al., 1994; Amy and Siddiqui, 1999). Although it is technically feasible to remove bromate from treated water, it is unlikely to be cost effective.
7.4.2.1 Adsorption with activated carbon
Legube (1996) reported similar bromate concentrations in both the influent and effluent of granular activated carbon (GAC) filters for water utilities in Europe using O3, indicating ineffective removal of bromate at full scale (influent range ≤ 2 to 19.6 µg/L; effluent range ≤ 2 to 21.2 µg/L). Amy and Siddiqui (1999) conducted bench- and pilot-scale studies and found that bromate removal depended on the pH of the source water, the type of activated carbon and contact time; bromate concentrations generally reached 10 µg/L in less than 1000 bed volumes (BVs). Powdered activated carbon (PAC) was reported to be ineffective for a number of reasons (e.g., confounding effects from pH, NOM and sulphate, needs positively charged carbon). Asami et al. (1999) reported that new GAC could remove bromate from an influent concentration of 50 µg/L to approximately 10 µg/L for 50 days, after which performance was reduced as the filter transitioned to become biologically active; almost no removal was reported after 3 months. Bao et al. (1999) conducted bench- and pilot-scale experiments and reported that bromate removal was carbon specific, dependent on source water quality and negatively impacted by the presence of NOM and anions such as bromide, nitrate and sulphate. A pilot-scale GAC column (EBCT = 20 minutes; loading rate = 3.9m/h) using river water pretreated with prechlorination, PAC adsorption, flocculation–sedimentation and sand filtration achieved bromate removal ranging from 57% to 92% for at least 98 days (influent bromate concentrations = 30 and 109 µg/L; effluent bromate concentrations = 13 and 9 µg/L); the lowest measured bromate concentration was 6 µg/L (influent bromate concentration = 17 µg/L). Kirisits et al. (2000) reported that bromate breakthrough occurred very quickly in natural water due to the presence of NOM and other anions (e.g., chloride, sulphate, bromide and nitrate). Kirisits et al. (2001) found that biologically active carbon (BAC) could reduce an influent bromate concentration of 20 µg/L by up to 40%, but the dissolved oxygen (DO) concentration had to be less than 2 mg/L to support bromate-reducing biomass. As a result, full-scale O3-BAC plants are unlikely to observe biological bromate reduction, because the DO concentration is too high. Huang et al. (2004) found that GAC filtration could reduce the bromate concentration by 50–80% (influent bromate ranged from 18 to 163 µg/L), but only for 3 months of operation; after 9 months, almost no removal was reported.
7.4.2.2 Ferrous iron addition
Chemical reduction of bromate to bromide is possible through the use of a reducing agent such as ferrous iron (Fe2++). Amy and Siddiqui (1999) conducted bench-scale testing of Fe2++ and found that bromate concentrations could be lowered by 40–80%, depending on dose, pH and temperature; the process was almost 50% less effective at 10°C than at 20°C. The process was also dependent on alkalinity and NOM, with effectiveness decreasing as alkalinity and NOM increased. Fe2++ doses of 10–20 mg/L were required at pH levels of 7–8 before any bromate removal was achieved.
Krasner and Yates (1996) conducted pilot-scale testing to evaluate the effectiveness of Fe2++ addition to control bromate formation (bromate concentration = 15 µg/L; temperature = 19°C; pH = 6, 6.2, 6.5; Fe2++ concentration = 5, 10 mg/L). After approximately 30 minutes, bromate was removed by 4–14% and 18–41% at the low and high doses, respectively. After additional contact time (2 hours), bromate removal increased to 36–40% and 59–70% for the low and high doses, respectively. The authors reported that an Fe2++ residual of at least 1 mg/L was required to ensure good bromate removal; this Fe2++ level was considered unacceptable for treated water quality. In addition, increased particle counts were a concern. The authors concluded that the process required delicate balancing and was not practical at all temperatures.
7.4.2.3 Ultraviolet irradiation
Studies of bromate removal by UV irradiation at bench and pilot scales have shown that its effectiveness varies widely, depending on the water quality, UV fluence and light wavelength (Amy and Siddiqui, 1999; Peldszus et al., 2004; Chen et al., 2013). Amy and Siddiqui (1999) reported that medium-pressure lamps (200–600 nm) were more effective than low-pressure lamps (254 nm) in destroying bromate, owing to a higher energy input and a broader range of emitting radiation. Between 31% and 46% destruction of initial bromate concentrations was observed using medium-pressure lamps, a contact time of 6 seconds and a UV dose of 550 mJ/cm2 (initial bromate concentration = 11–19 µg/L). However, the authors noted that a low-pressure lamp with radiation at wavelengths below 200 nm was more effective than a medium-pressure lamp at similar doses. Approximately 40% of bromate was destroyed from an initial concentration of 50 µg/L using a low-pressure lamp and a dose of 250 mJ/cm2.
In contrast, pilot-scale testing conducted by Peldszus et al. (2004) using medium-pressure UV lamps demonstrated limited bromate removal (i.e., 0–19% removal). Two different water sources were spiked with bromate at 20 µg/L and irradiated with UV fluences up to 718 mJ/cm2. The source water, with 4 mg/L of nitrate-nitrogen and 4.1 mg/L of DOC, did not show any bromate removal, which was attributed to competitive absorption by nitrate and possibly DOC. The authors concluded that negligible bromate removal would occur using medium-pressure UV treatment at fluences typically used for drinking water disinfection.
7.4.2.4 Membrane technologies
Membrane technologies referenced in the literature for bromate removal include reverse osmosis, electrodialysis reversal (EDR) and anion exchange membranes. These methods have been evaluated primarily at bench and pilot scales and little information is available for full-scale applications.
Reverse osmosis
Reverse osmosis (RO) is a pressure-driven process that forces water through a semi-permeable membrane to remove organic contaminants and salts. van der Hoek et al. (1998) conducted pilot-scale experiments and reported that bromate had a rejection rate of 96% by RO membranes. Feedwater had a bromate concentration as high as 125 µg/L and achieved the target concentration of 5 µg/L in the filtrate. Membrane performance was not affected by temperature.
Electrodialysis reversal
Electrodialysis (ED) uses direct current to transfer ionic species through cell pairs of oppositely charged membranes, allowing their removal from source water. EDR is a modification of the ED process, whereby electrode polarity is reversed during the treatment process to reduce scaling and clean membrane surfaces (Watson et al., 2012). van der Hoek et al. (1998) conducted pilot-scale experiments and found EDR membranes to be less effective than RO and to have decreased performance at lower temperatures. Bromate was reported to be rejected by 64% at 2.4°C by EDR and could not achieve the target concentration of 5 µg/L in the filtrate. The authors reported that RO was preferred because it achieved multiple treatment objectives including disinfection, as well as the removal of salts, hardness and organic compounds. EDR neither removes organics nor has disinfection capacity.
Anion exchange membranes
The anion exchange membrane process is similar to ED but uses the chemical potential gradient between the feedwater and exchange solution to transfer ions across the membrane. Wiśniewski and Kabsh-Korbutowicz (2010) conducted batch tests and reported that anion exchange membranes could achieve removal efficiencies in the order of 90% when bromate was the only anion to be removed, regardless of whether the initial concentration of bromate was low (50 µg/L) or high (200 µg/L). In the presence of other anions, such as nitrate and bicarbonate, removal efficiency decreased to approximately 60%, and bromate concentrations could not be reduced below 20 µg/L. In contrast, Wiśniewski et al. (2011) reported that in natural waters spiked with bromate at 50 µg/L, 100% removal of bromate was achieved after 2 hours (sodium chloride concentration = 100 mM in exchange solution). Wiśniewski et al. (2011) also conducted continuous-flow ED tests on bromate-containing water and reported a bromate removal efficiency of 83% (effluent concentration = 8.8 µg/L). A mono-anion-selective membrane was used to increase the bromate removal efficiency to 93% (effluent concentration = 3.3 µg/L). The authors reported that the mono-anion-selective membrane exerts a favourable effect on the removal of bromate, while minimizing the exchange of associated anions, such as sulphate and bicarbonate.
7.4.2.5 Anion exchange resins
There is limited information regarding the removal of bromate from aqueous solution using anion exchange resins. Chen et al. (2014) conducted batch experiments to evaluate bromate removal performance using a macroporous strong base anion exchange resin with polystyrene matrix, quaternary amine functional groups and chloride as exchange ion. The sorption of the resin was found to be strongly pH dependent. The authors reported that bromate concentrations ranging from 200 to 600 µg/L could be reduced to < 10 µg/L between pH 4.5 and 10 and to < 5 µg/L between pH 5 and 8.5. The maximum sorption capacity of the resin was achieved at pH 7.07 (bromate concentration = 0 µg/L based on graphical interpretation). The presence of other anions, such as nitrate, sulphate and chloride, reduced resin sorption capacity by 28%, 27% and 23%, respectively.
7.4.3 Bromide removal
Several technologies, including membrane filtration, electrochemical processes and ion exchange, have been identified as potential treatment methods for removing bromide from drinking water sources to reduce bromate formation. However, these methods have been evaluated primarily at bench and pilot scales, and little information is available for full-scale applications (Amy and Siddiqui, 1999; Watson et al., 2012). In addition, although it is technically feasible to remove bromide from source waters, it is unlikely to be a cost-effective option for reducing bromate concentrations in treated water.
7.4.3.1 Reverse osmosis
A recent review of treatment technologies for bromide removal determined that RO is the most effective technology currently available. Watson et al. (2012) summarized the results of several studies of bromide removal from fresh water and seawater. The rejection capacities ranged from 90% to 100%, depending on the membrane used and operating conditions. Bartels et al. (2009) reported bromide removal of > 99% in pilot- and full-scale seawater RO plants. Initial bromide concentrations ranged between 64 and 71 mg/L, operating pressures ranged between 5065 and 6480 kPa and the flow rate was 11 000 L/min. Amy and Siddiqui (1999) reported that nanofiltration membranes with a molecular weight cut-off of 150–300 Da were capable of rejecting up to 50% of bromide. Harrison et al. (2007) conducted bench-scale tests of bromide removal using nanofiltration. A membrane with a molecular weight cut-off of 200 Da rejected between 94% and 97% of bromide with an initial concentration of 1030 mg/L. The data discussed above are from seawater desalination studies, and the use of membranes specifically for bromide removal has not been evaluated for its cost-effectiveness (Amy and Siddiqui, 1999).
7.4.3.2 Electrodialysis
ED and EDR have been reported to be effective for bromide removal. Valero and Arbos (2010) conducted pilot- and full-scale studies of the use of EDR for the control of THMs in a river water source containing bromide and other salts. A two-stage EDR system, each consisting of nine modules, with 32 stacks per module and an overall production capacity of 2.3 m3/s, effectively removed > 80% with feed water bromide concentrations up to 1.2 mg/L.
Electrochemical processes have shown promise for the removal of bromide by electrolytic volatilization. Kimbrough et al. (2013) conducted a pilot-scale study to evaluate the efficacy of using electrolysis to remove bromide from drinking water sources. The reactor was run at 10 L/min and under varying current/power conditions (0–98 A; 0–65 W·h). The cells consisted of titanium anodes and carbon cathodes with a total anode surface area of 72 310 cm2. Removals between 23% and 82% were observed for initial bromide concentrations between 0.04 and 0.21 mg/L. The authors also conducted a cost analysis and determined that the costs associated with the use of electrolysis are comparable to those of RO.
7.4.3.3 Ion exchange
Grefte et al. (2013) studied the influence of the removal of bromide and DOC using anion exchange on ozone demand and formation of bromate. The results of pilot-scale testing of a fluidized ion exchange system consisting of three strong base gel resin columns operated in parallel with a flow of 4 m3/h, an EBCT of 2.3 minutes and a runtime of 15 000 BVs demonstrated that an initial bromide concentration of 90 µg/L could be reduced by up to 60%, but it took only 1000 BVs before breakthrough occurred.
7.5 Residential scale
Municipal treatment of drinking water is designed to reduce levels of contaminants to or below their guideline values. As a result, the use of residential-scale treatment devices on municipally treated water is generally not necessary, but is based primarily on individual choice. In general, all water supplies should be disinfected. The precautions outlined in Section 7.2.2 should be followed when individual households use hypochlorite solutions as the source of chlorine to disinfect their water.
Health Canada does not recommend specific brands of drinking water treatment devices, but it strongly recommends that consumers use devices that have been certified by an accredited certification body as meeting the appropriate NSF/ANSI drinking water treatment unit standards. These standards have been designed to safeguard drinking water by helping to ensure the material safety and performance of products that come into contact with drinking water. Certification organizations provide assurance that a product conforms to applicable standards and must be accredited by the Standards Council of Canada (SCC). In Canada, the SCC is responsible for providing accreditation to organizations to certify drinking water devices and materials as meeting NSF/ANSI standards (SCC, 2016):
- CSA Group (www.csagroup.org);
- NSF International (www.nsf.org);
- Water Quality Association (www.wqa.org);
- UL LLC (www.ul.com)
- Bureau de Normalisation du Québec (www.bnq.qc.ca) [available in French only]
- International Association of Plumbing and Mechanical Officials (www.iapmo.org).
An up-to-date list of accredited certification organizations can be obtained directly from the SCC (www.scc.ca).
Based on data found in the literature, residential RO devices are expected to be effective for decreasing bromate concentrations in drinking water (van der Hoek et al., 1998; Carrasco-Turigas et al., 2013). Although there is a lack of published literature regarding the use of distillation for bromate removal from drinking water, it is expected to adequately remove bromate, because it is effective for the reduction of inorganic contaminants. However, this process requires an electrical energy input. Ion exchange may also effectively remove bromate from drinking water based on the municipal-scale results presented in Section 7.4.2.5.
Although no residential treatment devices are certified for bromate removal, it is recommended that drinking water treatment devices certified as meeting NSF/ANSI Standard 58 (Reverse Osmosis Drinking Water Treatment Systems), NSF/ANSI Standard 62 (Drinking Water Distillation Systems) or NSF/ANSI Standard 53 (Drinking Water Treatment Units – Health Effects) be used. Water that has been treated using RO or distillation may be corrosive to internal plumbing components. Therefore, these devices should be installed only at the point of use. In addition, these two types of drinking water treatment systems are intended only for point-of-use installation, as large quantities of influent water are needed to obtain the required volume of treated water, and are generally not practical for point-of-entry installation at the residential scale.
Periodic testing by an accredited laboratory should be conducted on both the water entering the treatment device and the finished water to verify that the treatment device is effective. Treatment devices may lose their removal capacity through usage and time and need to be maintained or replaced. Consumers should verify the expected longevity of the components in their treatment device according to the manufacturer's recommendations and service it when required.
8.0 Kinetics and metabolism
The kinetics and metabolism of bromate have been studied primarily in experimental animals.
8.1 Absorption
Bromate administered by stomach tube to male Wistar rats (0.625–100 mg/kg body weight [bw]) was rapidly absorbed and partially excreted unchanged in the urine, with a maximum plasma concentration reached after 15 minutes and peak urine concentrations obtained after 2 hours (Fujii et al., 1984). The authors indicated that bromate is also partly reduced to bromide.
Absorption of bromate via stomach tube in rats was measured using 18O-labelled bromate by Delker et al. (2006). The highest levels were detected in the kidney and liver, indicating uptake from the digestive system to the systemic circulation. Additional research at the National Health and Environmental Effects Research Laboratory of the U.S. EPA was summarized in a Water Research Foundation report (Cotruvo and Bull, 2012), indicating that the slope of the uptake of 18O derived from labelled bromate in the kidney changed dramatically as dose was increased from 0.5 to 5 mg/kg bw and above.
The absorption and disposition of bromate in F344 rats were studied by Bull et al. (2012), who characterized systemic bioavailability of bromate via oral exposure. Rats were exposed to bromate orally by gavage or by intravenous administration. The results were suggestive of saturation of bromate degradation at high doses, and it was proposed that at low doses (≤ 0.077 mg/kg bw), gastric and plasma degradation may reduce the systemic bioavailability of orally administered bromate (Keith et al., 2006).
8.2 Distribution
Administration of bromate to male Wistar rats at a dose of 100 mg/kg bw by oral gavage resulted in a wide distribution, as evidenced by significant increases in bromide concentrations in the kidney, pancreas, stomach, red blood cells and plasma 24 hours following administration (Fujii et al., 1984).
Bull et al. (2012) reported that peak plasma concentrations (Cmax) and the area under the plasma concentration–time curve (AUC) were linearly related to intravenous dose in F344 rats given up to 0.77 mg/kg bw. However, higher doses (1.9 and 3.8 mg/kg bw) resulted in disproportionate increases in these parameters and a large decrease in the volume of distribution. It was proposed that a larger fraction of bromate is distributed to the intracellular space of tissues at higher doses, because plasma thiols become depleted and are less readily available to reduce bromate to bromide (Bull et al., 2012). This hypothesis is consistent with the findings of Delker et al. (2006), who reported large increases in 18O concentrations in rat kidney and liver at 18O-labelled bromate doses of 10 mg/kg bw and higher following administration by gavage. A decreased ability to eliminate 18O-labelled bromate metabolites may be due to a saturation of antioxidant responses.
A linear relationship was also observed for AUC and Cmax in rats with oral bromate doses up to 15.3 mg/kg bw. At higher doses (i.e., doses that cause carcinogenicity in rats), a higher proportion of bromate may be delivered to tissues unchanged, as a result of saturation of reductants. Analysis of the peak plasma concentrations produced with intravenous or oral administration of bromate and possible implications for the delivery of bromate to target tissues are discussed in Bull et al. (2012). Differential initial loss of bromate was observed as a result of its reduction to Br−. A small fraction of the administered bromate would reach the systemic circulation at low doses; however, brominated organic compounds are produced in this dose range. By-products could potentially contribute to toxicity (Bull et al., 2012).
8.3 Metabolism
Bromate degradation was studied following its addition to fresh rat blood (Bull et al., 2012). A disproportionate, rapid initial loss of bromate (reduced to bromide) occurred at concentrations less than 320 µM, which was followed by a secondary rate loss that appeared consistent with loss observed in samples with higher initial bromate concentrations.
The time course of plasma bromate was also studied in vivo. The average terminal half-life of orally administered bromate was 37 minutes. The authors proposed that the deficit of total bromine recovery following excretion may result from the production of brominated biochemicals in vivo, which are more slowly metabolized and eliminated (Bull et al., 2012).
Fujii et al. (1984) also reported that bromate administered orally to rats was rapidly degraded within a short time, and no bromate was detected in body organs or blood 24 hours after dosing. The concentrations of bromide in several organs, plasma and urine, however, were increased after administration of bromate.
8.4 Excretion
Orally administered bromate is absorbed and partially excreted in the urine, unchanged. Some remaining bromate is reduced to bromide and also excreted in the urine or, to a lesser extent, in feces (Fujii et al., 1984). Dose-related concentrations of bromate were detected in the urine of rats following oral doses of 5 mg/kg bw and above, but not at 2.5 mg/kg bw or below.
Similarly, Bull et al. (2012) observed a chemical reduction of the bulk of bromate administered (0.077–15.3 mg/kg bw) orally (by gavage) or intravenously to rats to bromine. A dose-dependent increase in excretion of bromine was also reported. A deficit in bromine recovery was observed, as approximately 75% was recovered in male rats at all doses (less in females), and total organic bromine did not account for the loss. This could suggest a retention of brominated compounds in the body. It should be noted, however, that retention of organic bromine in tissues was not quantified, and only urinary elimination was measured. Further study would be needed to conclude that formation of by-products accounted for the deficit in bromine elimination.
The half-life of bromate in real gastric juice was determined to be 144 minutes, and the half-life in synthetic gastric juice was determined to be 90 minutes; however, it should be noted that degradation in gastric juice was determined in a static culture that did not account for the fact that absorption into the circulation would compete with the degradation process (Keith et al., 2006; Campbell, 2013). In vivo time course data published in Bull et al. (2012) indicate a rapid initial clearance of bromate from plasma in the rat and low bioavailability (Campbell, 2013).
8.5 PBPK models
Reports in the literature have highlighted the importance of the use of a physiologically based pharmacokinetic (PBPK) model for the risk assessment of bromate (Bull and Cotruvo, 2006, 2013). A preliminary model that was developed indicated that peak concentrations of bromate from drinking water in rat plasma were lower than those achieved with bolus doses given by stomach tube, owing to the fact that water consumption via drinking water was spread throughout the day (Bull and Cotruvo, 2013).
Health Canada made use of PBPK modelling in the current risk assessment to derive human equivalent concentrations that were reflective of the uptake, disposition and clearance of bromate in the rat (Campbell, 2013). The basis for the model was the previously published models for perchlorate (Clewell et al., 2003; Merrill et al., 2005) and the preliminary model for bromate (Fisher and Bull, 2006). The model included red blood cell, gastrointestinal tract, liver, skin and "rest of body" compartments. Dose routes included intravenous, oral (bolus and drinking water), dermal and inhalation. The data sets used in the model were from the female rat, which appears to more accurately reflect carcinogenic risk in humans, as published in Bull et al. (2012).
There were three phases in development of the model. In the first phase, parameters for distribution and clearance were estimated using the intravenous plasma time course data set (Bull et al., 2012). The second phase of the model was an estimation of oral uptake rates and presystemic degradation in the gut. The third phase estimated the urinary clearance based on the data reported by Bull et al. (2012) and Fujii et al. (1984). The final model was then extrapolated to humans using species-specific parameterization for physiology and standard scaling practices for rate constants, given that there are no reported data for bromate in human plasma or urine. The derived dose metrics from this model were output after the model was allowed to accumulate data for 7 days, and included the daily plasma area under the time-course curve (AUCd) and average plasma concentration (CPlavg).
The model shows a distinct linearity for plasma AUCd, Cavg and Cmax across the range of doses used (10 to 500 ppm in drinking water), even though several non-linear processes were incorporated (reaction with plasma GSH/thiol, diffusion-limited uptake into tissue compartments, clearance from plasma and clearance from the tissue compartments). The model developed was also found to be consistent with both the intravenous and oral data sets reported by Bull et al. (2012).
Human equivalent concentrations in drinking water corresponding to the bromate plasma dose metrics from the rodent bioassays were calculated based on a 1.5 L/day ingestion rate in a 70 kg human over 24 hours. Concentrations calculated based on AUC were nearly identical to those based on CPlavg. Concentrations based on AUC were used for the purpose of the present risk assessment, as they were slightly more conservative. The human equivalent concentrations used in the risk assessment corresponding to doses of 0.02, 0.1, 0.2, and 0.4 g/L in rats (from DeAngelo et al., 1998) are 54.2, 240, 493, 1088 ppm (mg/L) in drinking water, respectively.
It should be noted that the PBPK model did not address the rapid initial loss of bromate that was determined in the whole blood in vitro assay, which could indicate that very little bromate would be available for systemic distribution below a certain level. These in vitro data were not consistent with the in vivo plasma time course data. Further in vivo method development would be needed to incorporate this initial loss into the bromate model (Campbell, 2013). There is also some uncertainty in the background bromate levels measured in unexposed rats, where model prediction is below background (10 µg/L). Additional uncertainty in the model was noted, as there were no human data that could be used to validate the model for oral extrapolation from experimental animal to human. Scaling of first-order rate constants to BW−¼ was used, which gives a smaller rate in the human as well as a smaller fraction of an oral bolus absorbed.
The bromate PBPK model for rat recapitulated the in vivo data in the rat. Although the model adequately predicted plasma kinetics and urinary excretion in rats, concentrations in humans were unavailable for model validation (Campbell, 2013), which is an important limitation of the model. Because differences between rats and humans in bromate kinetics are unknown, Health Canada's assessment for bromate accounts for the uncertainty between rats and humans by maintaining the use of an allometric scaling factor (for the cancer approach) and a value of 10 for the interspecies uncertainty factor (for the non-cancer approach). In general, results from applying the PBPK model with the incorporation of an allometric scaling factor to account for interspecies differences and from the default approach using an allocation factor were nearly identical for the cancer risk assessment and varied less than threefold for the non-cancer risk assessment. The results from the application of the PBPK model are presented alongside those obtained using a default risk assessment approach (i.e., if no PBPK model were used) in Section 10.
9.0 Health effects
9.1 Effects in humans
9.1.1 Acute toxicity
Acute effects of bromate in humans have been reported following poisonings, primarily resulting from ingestion of hair products containing bromate. Estimated ingestion ranged from 12 to 50 g, with death reported in 9 of 24 adults (Kurokawa et al., 1990).
Early effects following acute oral exposure to bromate include vomiting, diarrhea and abdominal pain. Subsequently, effects can include oliguria, anuria, deafness, vertigo, hypotension, depression of the central nervous system, thrombocytopenia and renal failure (Campbell, 2006).
Ingestion of bromate has been associated with irreversible hearing loss (ototoxicity) at high doses (Campbell, 2006). The onset of ototoxicity following high-dose exposure is rapid (4–16 hours); however, the possibility of delayed or progressive hearing loss has not been explored in the literature.
9.1.2 Subchronic and chronic toxicity and carcinogenicity
No studies were available that reported the health effects in humans resulting from long-term exposure to bromate. Bromate has been classified as a possible human carcinogen (Group 2B) by the International Agency for Research on Cancer (IARC, 1999), based on insufficient evidence in humans but sufficient evidence in experimental animals.
9.1.3 Reproductive and developmental toxicity
Reproductive and developmental toxicity related to bromate exposure has not been documented in humans. However, there is some concern in the literature over the lack of a study with respect to developmental neurotoxicity of bromate (Campbell, 2006; Crofton, 2006). There exists a very wide margin of exposure between the low levels of bromate found in drinking water and the high acute doses that have caused reported ototoxicity in humans.
9.2 Effects on experimental animals
9.2.1 Acute toxicity
Oral lethal dose (LD50) values were obtained for potassium bromate by Kurokawa et al. (1990), who used a single dose via intragastric tube and observed the animals over 7 days. It was noted that values were higher in females than in males for all species tested. The authors report LD50 values of 388 mg/kg bw (males) and 460 mg/kg bw (females) for Syrian golden hamsters. The same study reported LD50 values of 280 mg/kg bw (males) and 355 mg/kg bw (females) for B6C3F1 mice and 400 mg/kg bw (males) and 495 mg/kg bw (females) for F344 rats. The authors also cited a personal communication indicating that LD50 values for Wistar rats were found to be 160–180 mg/kg bw. Oral LD50 values have also been reported to be 223–363 mg/kg bw for potassium bromate administered orally in mice (Nakajima et al., 1989). Consistent with these findings, Kawana et al. (1991) reported an oral LD50 in Wistar rats of 159 mg/kg bw.
Sodium bromate LD50 values have been reported by Sax et al. (1979) as 140 mg/kg bw (intraperitoneal) for mouse and 250 mg/kg bw (oral) for rabbit.
The reported acute effects of administration of potassium bromate in Wistar rats included hemochromatosis in the kidney, liver and spleen (Kawana et al., 1991). Male Long-Evans rats administered a single dose of potassium bromate at 0, 129, 192, 257 or 385 mg/kg bw by gavage exhibited diarrhoea and signs of sedation following a 6-hour exposure at the highest dose level (Fujie et al., 1988). In a study in which an unspecified number of rats were given a single oral dose of potassium bromate at 100 mg/kg bw and sacrificed 12–168 hours after treatment, the authors reported reversible oxidative damage to the kidney, with a maximal effect seen 48 hours following administration (Ahmad et al., 2012). A subsequent study also reported that potassium bromate induced oxidative stress in rat blood, as evidenced by increased lipid peroxidation, protein oxidation and hydrogen peroxide levels and decreases in GSH content. The authors also reported an impairment of antioxidant power (Ahmad and Mahmood, 2012).
9.2.2 Short-term exposure
A study by Dodd et al. (2013) investigated the subchronic toxicity of bromate administered to F344 rats in drinking water after 2- and 13-week exposures. Concentrations of potassium bromate in drinking water of 0, 5, 20, 100, 200 and 400 mg/L were studied, with ten rats per dose group. Hyaline droplets were observed in renal tubules of rats exposed to potassium bromate at concentrations of 200 and 400 mg/L in drinking water (no microscopic changes were found in the lung, liver, thyroid or tunica vaginalis). A no-observed-effect level (NOEL) for potassium bromate of 100 mg/L (8.1 mg/kg bw per day) was identified based on the absence of microscopic alterations in the kidney. Another study, by Umemura et al. (2004), observed significant α2u-globulin accumulation in the renal proximal tubules of male rats following 4 weeks of exposure to potassium bromate at concentrations of 125, 250 and 500 mg/L in drinking water.
Renal toxicity was also reported in male SPF-ddy mice by Kawana et al. (1991). Mice (9 per group) were administered potassium bromate in drinking water at a concentration of 0, 100, 500, 1000, 2500 or 5000 ppm (0, 10.8, 54, 108, 270 and 540 mg BrO3/kg bw per day, respectively) for 2 weeks. The high-dose group experienced an inhibition of body weight gain. Kidney, lung and liver necropsy showed significant increases in organ weights above controls; however, changes did not appear to be dose related. Levels of alkaline phosphatase, gamma-glutamyl transpeptidase and α-fetoprotein in the 270 and 540 mg/kg bw per day groups were significantly increased compared with controls. Based on these changes, a no-observed-adverse-effect level (NOAEL) for bromate in this study was 108 mg/kg bw per day.
Guo et al. (2001) assessed the toxicity of sodium bromate in female B6C3F1 mice. Mice were administered sodium bromate in drinking water at a concentration of 0, 20, 80, 400, 600 or 800 ppm over a period of 28 days. Overall, no differences were found between treated groups and controls for body weight, body weight gain or weights of the thymus, liver and lungs. An increase in spleen weight was observed. Only minimal changes were observed (a slight increase in B lymphocytes at 600 ppm and a decrease in the suppressive effect of macrophages on the proliferation of B16F10 tumour cells) out of a large number of immunological parameters tested. Overall, the authors suggested that exposure to sodium bromate through drinking water produced minimal toxicological and immunological effects at the concentrations tested.
A short-term reproductive and developmental toxicity study administered sodium bromate in drinking water (concentrations of 0, 25, 80, and 250 ppm) to Sprague-Dawley rats for 35 days. There were no observed changes in reproductive parameters for females; however, males displayed a decrease in epididymal sperm density. Sodium bromate was considered to be a selective male toxicant, and a lowest-observed-adverse-effect level (LOAEL) of 16.1 mg/kg bw per day and a NOAEL of 5.5 mg/kg bw per day were derived (NTP, 1996).
Auditory and vestibular systems were shown to be affected when guinea pigs were injected subcutaneously with potassium bromate at 20 or 50 mg/kg bw daily for 14 days (Chuu et al., 2000; Young et al., 2001). This ototoxicity was compared with effects seen in hairdressers occupationally exposed to potassium bromate in hair curling solution, suggesting the human relevance of this effect.
9.2.3 Long-term exposure and carcinogenicity
Potassium bromate has been reported to be carcinogenic in rats and mice, causing various tumours, including renal cell tumours (adenomas and adenocarcinomas), thyroid adenomas and adenocarcinomas, and mesotheliomas in the tunica vaginalis. The most sensitive animals were determined to be male rats.
Kurokawa et al. (1983) examined the carcinogenicity of potassium bromate administered to F344 rats at a concentration of 250 or 500 mg/L in drinking water for 110 weeks. The authors reported shortened mean survival times for male rats exposed to the high dose and significantly higher incidences of renal cell tumours relative to controls in males and females of both dose groups.
A subsequent study by Kurokawa et al. (1986a) examined the dose–response relationship for potassium bromate in male F344 rats. Groups of 20–24 rats were exposed to potassium bromate in drinking water at concentrations ranging from 15 to 500 ppm for 104 weeks. Renal cell tumours (combined adenomas and adenocarcinomas) and renal adenomas were found to increase over controls in groups exposed to potassium bromate at 125, 250 or 500 ppm. In addition, a significant increase in the incidence of renal dysplastic foci was reported at potassium bromate concentrations of 30 ppm and above. Peritoneal mesotheliomas were found at potassium bromate concentrations as low as 30 ppm, with the increase displaying significance at 500 ppm. The combined incidence of thyroid adenocarcinomas and follicular adenomas was also significant at 500 ppm . The authors also reported significant increases in combined renal cell tumours and renal adenomas in a separate study that exposed male and female F344 rats to potassium bromate in drinking water at a concentration of 250 or 500 ppm (Kurokawa et al., 1986b). An examination of the duration of treatment in these studies concluded that 13 weeks was sufficient to induce carcinogenicity in rats given potassium bromate in their drinking water at a concentration of 500 ppm (total dose of 4 g/kg bw) (Kurokawa et al., 1987).
The incidences of kidney tumours, thyroid tumours and mesothelioma in rats were also reported to increase with dose of potassium bromate in a study by DeAngelo et al. (1998). F344 rats (50 rats per group) were administered potassium bromate at lower-dose concentrations of 0.02, 0.1, 0.2 and 0.4 g/L in drinking water for up to 100 weeks. Based on the drinking water concentrations, equivalent doses in the rats were calculated to be 1.1, 6.1, 12.9 and 28.7 mg/kg bw per day (Campbell, 2013). All animals that survived to the end of the study underwent a complete necropsy and a macroscopic examination of all tissues. Male rats given potassium bromate in drinking water at a concentration of 0.4 g/L had an increase in renal cell tumours, primarily located in the renal cortex, but some also extended to the medulla. Renal cell tumours (combined adenomas and carcinomas) developed at concentrations of ≥ 0.1 g/L, but were significantly increased at the high dose. Although not a carcinogenic endpoint, an increased incidence of renal pelvis urothelial hyperplasia (characterized by an increase in the number of layers of urothelial cells that line the renal pelvis and papillae) in potassium bromate–treated rats was reported at a concentration of 0.1 g/L (6.1 mg/kg bw per day), with a NOAEL of 0.02 g/L (1.1 mg/kg bw per day). The authors also reported dose-dependent increases in the incidence of tumours of the thyroid and mesotheliomas arising on the tunica vaginalis of the testis in male rats at low doses, which became significant at concentrations of 0.2 g/L and 0.1 g/L, respectively (DeAngelo et al., 1998; Crosby et al., 2000). For each group of 54 animals started on the study, the authors also reported the numbers of unscheduled deaths as 19, 15, 18, 25, and 30 for the 0, 0.02, 0.1, 0.2, and 0.4 g/L groups, respectively.
The relationship between dose and time to bromate-induced tumours was investigated in male F344 rats (Wolf et al., 1998). Potassium bromate was administered to the rats via drinking water at a concentration of 0, 0.02, 0.1, 0.2 or 0.4 g/L for 12, 26, 52, 78 or 100 weeks. Renal cell tumours were present after 52 weeks of treatment only in the high-dose group. Mesotheliomas developed on the tunica vaginalis after 52 weeks of treatment and were found to be present at sites other than the testis after 78 weeks, suggesting that their origin was the tunica vaginalis of the testis. Thyroid follicular tumours were present as early as 26 weeks in the 0.1 and 0.2 g/L treatment groups.
DeAngelo et al. (1998) also investigated the effect of potassium bromate in mice given drinking water containing the compound at a concentration of 0.08, 0.4, and 0.8 g/L. The authors reported a treatment-dependent but not dose-dependent increase in the incidence of renal cell tumours in mice exposed to potassium bromate at 0.08 g/L for 100 weeks (DeAngelo et al., 1998). Mice were therefore found to be less sensitive than rats to potassium bromate–induced carcinogenicity.
Subcutaneous injection of newborn mice with a cumulative dose of 400–800 mg/kg bw of potassium bromate daily over 4 weeks resulted in an increase in the combined incidence of lymphomas and leukemias in male mice (8/20) compared with controls (1/15). No increased carcinogenicity was observed following subcutaneous injection of potassium bromate (up to 100 mg/kg bw once a week for 4 weeks) in newborn rats (Matsushima et al., 1986; IARC, 1999).
Potassium bromate appeared less potent in the male Syrian golden hamster after long-term administration via drinking water at a concentration of 0, 125, 250, 500 or 2000 mg/L for 89 weeks (equivalent to 0, 5.6, 12, 20 and 84 g/kg bw per day, respectively). The incidence of renal tubular tumours was increased in all treated groups, although results were not statistically significant, and a dose-dependent relationship was not observed (Takamura et al., 1985; IARC, 1999).
The tumour-initiating properties of potassium bromate were investigated in F344/NCr rats administered a single dose of potassium bromate of 300 mg/kg bw, reflecting the maximum tolerated dose, intragastrically. Groups of 39 rats received 4000 ppm barbital sodium (BBNa) starting 2 weeks after treatment with potassium bromate as a promoting regimen for up to 104 weeks. Subsequently, rats were observed for nephropathy. Nephropathy was not observed in rats given potassium bromate alone, without BBNa, but was reported in groups that received the promoter. The incidences and multiplicities of dysplastic renal tubular cell foci and renal tubular cell tumours observed from 31 to 104 weeks did not reveal an initiating effect of potassium bromate treatment. It was concluded that the dose of 300 mg/kg bw did not initiate renal carcinogenesis (Kurata et al., 1992).
A group of studies released by the U.S. National Toxicology Program (NTP) investigated the effects of sodium bromate on genetically modified mice. The goal of this research was to evaluate the use of Tg.AC hemizygous and p53 haploinsufficient mouse models in detecting carcinogenesis of DBPs and other environmental contaminants. Mice were administered potassium bromate dermally (64–256 mg/kg bw per day for 26 weeks; Tg.AC mice only) and in drinking water (80–800 ppm, corresponding to approximately 13–148 mg/kg bw per day for 27–48 weeks). Despite decreases in body weights of treated animals, neoplastic effects resulting from treatment were not observed. It was concluded that the mouse models were not a sensitive or rapid means of assessing potential toxicity and carcinogenicity resulting from exposure to sodium bromate (NTP, 2007).
9.2.4 Genotoxicity
Potassium bromate can cause genetic damage both in vitro and in vivo. As summarized below, studies have reported a range of effects, from point mutations to chromosomal mutations.
9.2.4.1 In vitro findings
Potassium bromate has been reported to be genotoxic, based on positive results in the Ames, chromosomal aberration and micronucleus tests. However, not all Ames tests have yielded positive results. Mutant analysis has suggested both oxidative stress and loss of heterozygocity as possible mechanisms of mutagenicity.
Positive mutagenicity results were obtained in the Ames test using Salmonella typhimurium strain TA100 at a concentration of 3 mg of potassium bromate per plate following metabolic activation (Ishidate et al., 1984; Kurokawa et al., 1990). Negative results with and without S9 were found in other S. typhimurium strains (TA98, TA1535, TA1537 and TA1538) (1–10 mg/plate), in Escherichia coli WP2try (1–10 mg/plate) and in Bacillus subtilis (2–4 mg/plate) (Kawachi et al., 1980; Kurokawa et al., 1990; Moore and Chen, 2006).
The comet assay revealed dose-dependent mutations in the Hprt gene in Chinese hamster V79 cells following exposure to potassium bromate at a concentration of 5, 10 or 20 mM. Forty percent of mutations from the treated group were large deletions, whereas no deletions were found in controls. In addition, only four of the 28 mutations were found to be point mutations (Speit et al., 1999). High-performance liquid chromatographic (HPLC) analysis revealed a significant increase in the concentration of 8-oxodeoxyguanosine (8-oxodG) in cells treated with potassium bromate. Positive results indicating deoxyribonucleic acid (DNA) breakage from the comet assay were confirmed in Chinese hamster ovary cells (2.5–10 mM) and in primary rat and human kidney cells (0.56–1.8 mM) (Robbiano et al., 1999; Plewa et al., 2002; Poul et al., 2004; Moore and Chen, 2006).
Both potassium bromate and sodium bromate were found to increase the mutation frequency of the Tk gene in mouse lymphoma cells (0.6–3 mM). Further analysis revealed loss of heterozygocity in almost all mutants, suggesting a clastogenic mechanism (Harrington-Brock et al., 2003). The effect of potassium bromate was also investigated in TK6 human lymphoblastoid cells using the Tk gene mutation assay, comet assay and micronucleus test by Platel et al. (2009, 2011). The positive results were suggestive of a threshold dose–response relationship, and no-observed-genotoxic-effect levels were reported, which varied depending on the assay performed. Positive genotoxic results were also reported in mouse lymphoma L5178Y cells for micronuclei, Tk mutations and double-strand breaks at the chromosomal level, although little DNA damage was reported following the comet assay (Priestley et al., 2010). Overall, the authors of this study proposed that factors in addition to the generation of 8-hydroxydeoxyguanosine (8-OHdG) are involved in the genotoxicity of potassium bromate in these cells, and possibly in other in vitro and in vivo systems. Similarly, positive results were obtained in a study that investigated the effects of potassium bromate on human lymphoblastoid TK6 cells using the comet assay, micronucleus test and Tk gene mutation assay (Luan et al., 2007). Double-strand breaks were reported from the comet assay, and micronuclei and Tk mutations were induced in a dose-dependent fashion. Further molecular analysis revealed that 90% of the mutations involved loss of heterozygocity at the Tk locus. It was suggested that potassium bromate–induced genotoxicity may be due to large deletions rather than to the previously proposed accumulation of 8-OHdG adducts that lead to GC to TA transversions (Ballmaier and Epe, 2006). The authors conducted an expression analysis that indicated an upregulation of genes involved in apoptosis, DNA repair and upregulation of stress.
Little evidence of GC to TA transversions at potassium bromate doses less than 500 mg/L was reported by Umemura et al. (2006).
Potassium bromate has also tested positive in chromosomal aberration assays, resulting in chromatid breaks and exchanges (Ishidate et al., 1984; Speit et al., 1999).
Numerous genotoxic effects have been reported following the exposure of human cells to potassium bromate. An examination of genotoxicity in human peripheral blood lymphocytes treated with potassium bromate at 400–550 µg/mL for 24 and 48 hours included sister chromatid exchange, chromosomal aberration and micronucleus tests (Kaya and Topaktas, 2007). Positive results were obtained in all tests; however, doses and times that resulted in statistically significant results varied.
Potassium bromate was reported to induce DNA strand breakage in cultured human cells (HL-60, HL-100) and in mouse lymphoma cells (L1210) (Ballmaier and Epe, 2006; Kawanishi and Murata, 2006). It was reported that bromide radicals formed in the presence of thiols were responsible for the DNA damage. The formation of 8-deoxyguanosine was induced.
9.2.4.2 In vivo findings
Positive results were obtained in an acute study investigating the effect of bromate on bone marrow cells in male Long-Evans rats following oral (334.0 mg/kg) or intraperitoneal (250.5 mg/kg) administration of high doses of bromate. In both cases, the number of aberrant cells increased progressively, with a maximum of 10.5% reached at 12 hours following intraperitoneal administration and 10.8% at 18 hours following oral administration (Fujie et al., 1988; Kurokawa et al., 1990).
Administration of potassium bromate to mice and rats has yielded positive results in the micronucleus test. CD-1 and Ms/Ae mice given potassium bromate intraperitoneally (18.8–150 mg/kg bw) or by gavage (37.5–300 mg/kg bw) tested positive, with dose-dependent responses in the mouse micronucleus assay using femoral bone marrow polychromatic erythrocytes (Nakajima et al., 1989). Similar results were produced in male ddY mice for both the oral gavage (above 100 mg/kg bw) and intraperitoneal (above 25 mg/kg bw) routes of exposure, as the micronucleus test yielded positive results in bone marrow erythrocytes (Hayashi et al., 1988). Similarly, the frequency of micronucleated polychromatic erythrocytes increased in a dose-dependent manner for CD-1 and MS/Ae mice (Hayashi et al., 1989). Positive results were also reported in CD-1 mice using peripheral blood reticulocytes with intraperitoneal dosing of 18.8–212 mg/kg bw (Awogi et al., 1992). Results in male F344 rats also demonstrated significantly elevated micronuclei in peripheral blood reticulocytes following intraperitoneal administration of potassium bromate at 16 mg/kg bw. This increase was inhibited by co-treatment with GSH or cysteine, and daily treatment with vitamin C also provided a protective effect (Sai et al., 1992a). These results suggest that reactive oxygen species may play an important role in bromate-induced clastogenicity.
The in vivo mutagenicity of bromate was also investigated by Allen et al. (2000), who characterized erythrocyte clastogenicity in B6C3F1 mice chronically exposed to bromate in drinking water at concentrations of 0.08, 0.4, and 0.8 g/L for 8 weeks. In addition, the authors sampled mice from the same cohort used in the tumorigenic study by DeAngelo et al. (1998) and reported levels of chromosome damage for various dose groups following 78 weeks of exposure to the same doses. Overall, the findings indicate that bromate induced formation of micronuclei in erythrocytes in a dose-dependent manner, although this dose–response relationship did not parallel that for carcinogenesis, where significant tumour incidence was observed only in the lowest dose group. Chromosome breakage and fragment loss were proposed to play a role in the mechanism, consistent with metabolism involving lipid peroxidation and radicals that attach to DNA, rather than to protein targets. The authors also examined the effect of potassium bromate on germ cells in the mice exposed to the above-mentioned doses for 8 weeks by examining spermatids using the micronucleus assay. Bromate did not appear to be clastogenic in germ cells, as no apparent effect on spermatids was observed (Allen et al., 2000).
Umemura et al. (2004) administered potassium bromate to female rats (300 mg/kg bw by single intragastric intubation or 80 mg/kg bw by single intraperitoneal injection) and measured levels of thiobarbituric acid–reactive substances (TBARS) and 8-oxodG in the kidney. Both measurements were significantly elevated relative to controls. It should be noted, however, that lower doses in drinking water (15–300 ppm) did not result in positive results for the TBARS assay, despite the presence of 8-oxodG, suggesting that oxidative stress may occur independently of lipid peroxidation.
Studies have identified an increase in mutations in the liver and kidney of mice and rats in vivo, associated with an accumulation of 8-oxodG. It was hypothesized that these mutations are likely due to (but not limited to) GC to TA transversions and deletions (Moore and Chen, 2006; Umemura et al., 2006). Expression analysis has provided additional support for 8-oxodG as a potential mechanism of bromate-induced mutagenicity (Delker et al., 2006). An increase in 8-oxodG levels, an indicator of pro-mutagenic DNA damage, was observed in kidneys of male and female rats following 4 weeks of exposure to potassium bromate in drinking water (Geter et al., 2006; Umemura et al, 2004).
An in vivo mutagenicity test was conducted in male gpt delta rats that were given potassium bromate in drinking water at a concentration of 0 or 500 ppm for 12 weeks. Subsequent kidney analysis revealed an increase in Spi− mutation frequencies relative to controls, representing deletion mutations. No modification in gpt mutation frequencies was observed following treatment with potassium bromate (Umemura and Kurokawa, 2006). Subsequently, the gpt delta rats were treated with potassium bromate in drinking water at a concentration of 0, 60, 125, 250 or 500 ppm . It was reported that mutation frequencies were increased in a dose-dependent fashion from 250 ppm, with statistical significance at 500 ppm.
The mutation spectra of male and female gpt delta rats given potassium bromate were examined by Umemura et al. (2009). Mutation analysis in rats given potassium bromate in drinking water at a concentration of 500 ppm for 9 weeks did not indicate a preference for GC to TA transversions. Rather, deletion mutations were most prevalent, as found in other studies (Harrington-Brock et al., 2003; Umemura et al., 2006; Luan et al., 2007).
Study of the male Big Blue rat suggested the presence of a no-effect level for mutagenicity (Yamaguchi et al., 2008). In one experiment, it was found that treatment with 500 ppm of potassium bromate significantly increased mutation frequencies, and the frequency of GC to TA transversions of the lacI gene in the kidney relative to control. Lower doses examined (125ppm and below) did not induce these transversions. Evidence was highlighted to indicate that this mutagenic effect was due to oxidative stress-induced 8-OHdG. The authors noted that histopathological renal changes were observed in groups exposed to concentrations of potassium bromate of 30 ppm and above in a dose-dependent manner. It was proposed that increases in cell proliferation observed in male rats at concentrations of 125 ppm and below might be attributable to cytotoxicity caused by a different mechanism, notably an accumulation of α2-microglobulin.
Although research has focused on the toxic effects of potassium bromate, it is also of interest that sodium bromate tested positive for in vivo mutagenicity in male and female Tg.AC hemizygous mice and p53 haploinsufficient mice (NTP, 2007). Mice (15 of each sex) exposed to sodium bromate in drinking water at concentrations ranging from 80 to 800 ppm for 27 weeks demonstrated a clear dose–response relationship in micronucleus tests. Similar results were obtained for dermal exposures, where mice were exposed to sodium bromate in ethanol water at a dose of 64–256 mg/kg bw per day, 5 days per week, for 26 weeks.
The promotional activity of potassium bromate was examined following its administration to rats at a concentration of 500 ppm in drinking water for 1–13 weeks, using bromodeoxyuridine (BrdU) labelling, an indicator of cell proliferation. Significant increases in BrdU labelling index were found in proximal convoluted tubules of treated male rats relative to controls throughout the experimental period. Increases in BrdU labelling index were observed following 13 weeks of exposure in females (Umemura et al., 1998). A subsequent experiment established a dose-dependent relationship between administration of bromate in drinking water at concentrations ranging from 30 to 500 ppm in male F344 rats and concentrations of 250 ppm and above in females (Umemura et al., 2004).
The enhancement effect of potassium bromate on N-ethyl-N-hydroxyethylnitrosamine (EHEN)–induced kidney carcinogenicity in Wistar rats was investigated by Wei et al. (2009). Rats were provided potassium bromate in drinking water at concentrations ranging from 0.02 ppm to 500 ppm. It was found that enhanced kidney carcinogenesis increased above 250 ppm, but not at 125 ppm and below. In addition, oxidative damage in kidneys was increased at 125 ppm and above, but not at 30 ppm and below. It was suggested that a threshold dose exists for enhancement effects of potassium bromate on carcinogenesis of the kidney.
9.2.5 Reproductive and developmental toxicity
In a short-term reproductive and developmental toxicity study, sodium bromate was administered to Sprague-Dawley rats in drinking water at 0, 25, 80 or 250 ppm (reported sodium bromate consumption was approximated at 0, 2.6, 9.0 or 25.6 mg/kg bw per day, respectively), for 35 days. Numerous endpoints were evaluated in males, including clinical pathology, organ weight, sperm analysis and histopathology. Two groups of females were exposed; the first received sodium bromate in water from study days 1 to 34 to examine effects during conception and early gestation, whereas the second was exposed from gestation day 6 to the postnatal day 1 to examine effects during late gestation and birth. Measurements included maternal body weight, the number of uterine implantations, the number of pups and the weight of pups. There were no observed changes in reproductive data for females; however, males displayed a decrease in epididymal sperm density. Sodium bromate was considered to be a selective male toxicant, and a LOAEL at a concentration of 250 ppm and a NOAEL at 80 ppm were derived (NTP, 1996).
A 2007 NTP report on the toxicity of sodium bromate summarized results from a multigenerational, continuous-breeding study in rats (NTP, 2001, 2007). Male and female Sprague-Dawley rats were given sodium bromate in drinking water at a concentration of 0, 30, 100 or 300 mg/L; the duration of exposure was not indicated in the available summary. General toxicity was observed in both sexes at 100 and 300 mg/L, as evidenced by hyaline droplets and chronic progressive nephropathy in males and renal cell proliferative changes in females. Although the authors did not report significant change in the reproductive litter data, a 16% decrease in sperm density was recorded in the F0 generation, and an 8% decrease (not significant) in the F1 generation (NTP, 2001, 2007). The 16% decrease in sperm density was consistent with the initial 18% decrease observed in a screening study, although no effects on male fertility were observed (NTP, 2007).
9.3 Modes of action
Although many mechanistic studies have been performed for bromate, the MOA of bromate toxicity has not been well elucidated. In an attempt to better synthesize the data and potentially draw conclusions from the body of mechanistic studies, Health Canada performed an MOA analysis (Health Canada, 2014) using the approaches outlined in the International Life Sciences Institute (ILSI)/International Programme on Chemical Safety (IPCS) framework (IPCS, 2007; Meek et al., 2014a), as updated by the evolved Bradford-Hill considerations (Meek et al., 2014b). The MOA analysis for each of the potential MOAs and conclusions taken based on the synthesis are summarized throughout this section. As the majority of the focus of mechanistic research has been related to cancers (primarily renal cell tumours, but also thyroid follicular cell tumours and mesotheliomas of the testicular tunica vaginalis), this was the primary focus of the MOA analysis. Moreover, as these effects were observed in rats, the majority of the analyzed data were from rats, with the incorporation of other species only for considerations of species concordance. Wherever possible, quantitative analyses of the key events were performed by estimating the lower 95% confidence limit on the exposure level at which a 10% increased incidence (over background levels) would be expected in the study population (i.e., a BMDL10 value; these values were calculated using U.S. EPA's Benchmark Dose Software, BMDS Version 2.4 R70). Unless otherwise stated, exposures discussed in this section were to concentrations of potassium bromate in drinking water to maintain consistency between this section and Section 9.2, as well as studies used in the MOA analysis.
9.3.1 Oxidative stress
Data related to the oxidative stress MOA have been investigated primarily for kidney tumours. Strong support for the MOA exists for renal tumours, with major gaps in supporting data for other cancer types. The key events in this MOA were proposed as 1) depletion of GSH and surplus of oxidative species; 2) damage to DNA, proteins and lipids; and 3) cellular proliferation, leading to the propagation of bromate-induced or spontaneous genetic mutations. These key events are hypothesized to lead to the development of tumours. The support for—or data detracting from—the weight of evidence for each of these key events is presented in Sections 9.3.1.1–9.3.1.3; quantitative analyses of the key events and synthesis of the MOA are presented in Sections 9.3.1.4 and 9.3.1.5, respectively.
9.3.1.1 Depletion of GSH and surplus of oxidative species
Oxidative stress was most commonly measured as changes in levels of 8-OHdG adducts, and increased levels of the marker in kidneys were noted at ≥ 250 mg/L in male and female rats in several studies (Umemura et al., 1998, 2004, 2006; McDorman et al., 2005; Yamaguchi et al., 2008; Cotruvo and Bull, 2012; Kolisetty et al., 2013a). When rats were co-fed antioxidants, increases in 8-OHdG levels were diminished (Umemura et al., 2009); moreover, when rats exposed via gavage were exposed to a GSH-depleting compound (diethylmaleate), increases in 8-OHdG were observed to occur at lower levels (Sai et al., 1992b). The development of eosinophilic droplets (which differed from α2u-globulin-induced hyaline droplets), an overt indication of oxidant damage, was observed at ≥ 400 mg/L in chronic studies (Kurokawa et al., 1987; DeAngelo et al., 1998); the effect appeared to be reversible, as it was not observed in rats that were kept alive after exposures were discontinued (Kurokawa et al., 1987). Although genes associated with oxidative stress were differentially expressed at levels lower than those at which the other measures of oxidation were observed (i.e., ≥ 20 mg/L) (Delker et al., 2006; Geter et al., 2006; Ahlborn et al., 2009), these results are supportive data and are not considered to be quantitatively definitive for this key event.
No data could be found for oxidative stress in the urothelium. In the thyroid, no increase in the expression of Ogg1—messenger ribonucleic acid for an enzyme that repairs DNA damaged by oxidative stress, which was upregulated in the kidney—was observed (Delker et al., 2006); no other studies of oxidative stress in the thyroid were undertaken.
The only measure of oxidative damage in mice was at very high concentrations (2000 mg/L). In the study, 8-OHdG accumulation occurred only in transgenic mice without the Ogg1 gene, and not in wild-type mice (i.e., with a functional oxidative damage repair system) (Arai et al., 2002).
9.3.1.2 Damage to DNA, proteins and lipids
The data for this key event related to DNA damage in the form of mutations, which occurred at ≥ 250 mg/L; these effects are further discussed in Section 9.3.3.2.
9.3.1.3 Cellular proliferation
Sex-related differences in cellular proliferation were observed in kidneys of rats. The effect (as measured by BrdU labelling index or proliferating cell nuclear antigen assay) was observed to occur at ≥ 30 mg/L in males (Umemura et al., 2004; Yamaguchi et al., 2008; Cotruvo and Bull, 2012; Kolisetty et al., 2013b); in females, the effect was observed at ≥ 250 mg/L in one study (Umemura et al., 2004), but not even at concentrations as high as 400 mg/L in another study (Cotruvo and Bull, 2012; Kolisetty et al., 2013b). Moreover, the effect occurred earlier in males than in females, with cell proliferation after ≥ 1 week in male rats exposed to 500 mg/L, and only after 13 weeks in females with the same dosing regimen (Umemura et al., 1993, 1998). Co-exposure to antioxidants led to decreased cell proliferation in females, but not in males (Umemura et al., 2009).
Histological evidence of renal hyperplasia was also observed in male rats co-exposed to potassium bromate at ≥ 30 mg/L and EHEN, a known tumour initiator (Kurokawa et al., 1985; Umemura et al., 1995), but not in rats exposed solely to potassium bromate at concentrations up to 500 mg/L (Umemura et al., 1995; DeAngelo et al., 1998).
Very few data on cell proliferation exist for the testicular mesothelium and thyroid. The BrdU labelling index was increased in both tissues in rats at (and above) 125 mg/L, the lowest concentration tested (Cotruvo and Bull, 2012). Urothelial hyperplasia was also observed at ≥ 100 mg/L in rats in chronic studies (Kurokawa et al., 1983; DeAngelo et al., 1998; Wolf et al., 1998); although the authors did not state whether the hyperplasia specifically affected the tunica vaginalis mesothelium, a reanalysis of tissues from one bioassay (DeAngelo et al., 1998; Wolf et al., 1998) indicated that the hyperplastic and preneoplastic lesions were observed in the mesorchium of the tunica vaginalis (Crosby et al., 2000). Only one chronic study discussed follicular cell hyperplasia (Wolf et al., 1998); in the study, hyperplasia was observed, but incidences were low (and not significant), and lower than that for follicular cell tumours.
9.3.1.4 Quantitative analysis of key events for oxidative stress MOA
The BMDL10 values for renal oxidative stress and cellular proliferation were estimated, using data from Umemura et al. (2004), to be potassium bromate concentrations of 78 mg/L and 75 mg/L, respectively. These values were calculated for female rats, with poor data fits to dose–response models in male rats. A BMDL10 of 229 mg/L for DNA damage was observed in male rats, with no studies in females (calculated using the data from Yamaguchi et al. [2008], but with results similar to those calculated using data from Umemura et al. [2006]). Although cellular proliferation appears to occur earlier and at lower doses than bromate-induced mutations, cellular proliferation will propagate any unrepaired mutation (e.g., spontaneous mutations), not only those resulting from bromate exposure. The BMDL10 values for renal tumours were all approximately 50 mg/L in male rats (Kurokawa et al., 1986a; Wolf et al., 1998). BMDL10s are lower for kidney tumours than for oxidative stress and cell proliferation; however, this observation does not necessarily provide contradictory evidence for the MOA, because quantitative assessment of kidney tumours could be performed only for males (kidney tumours in males are potentially exacerbated by α2u-globulin production).
For urothelial tumours, the only early key event that could be assessed quantitatively was urothelial hyperplasia; the BMDL10 for this key event was a potassium bromate concentration of 19.6 mg/L in male rats (using data from Wolf et al. [1998]), which was lower than that for urothelial mesothelioma (potassium bromate concentrations of 34 mg/L and 141 mg/L, using data from Wolf et al. [1998] and Kurokawa et al. [1986a], respectively). Although the authors did not state whether the hyperplasia specifically affected the tunica vaginalis mesothelium, a reanalysis of tissues from one bioassay (DeAngelo et al., 1998; Wolf et al., 1998) indicated that the hyperplastic and preneoplastic lesions were observed in the mesorchium of the tunica vaginalis (Crosby et al., 2000a). The only study to perform a direct measure of testicular mesothelial cell replication (Cotruvo and Bull, 2012) identified effects at the lowest concentration (125 mg/L) and therefore cannot be used as a quantitative indicator for the key event.
Insufficient data existed for a quantitative analysis of thyroid follicular cell tumours in rats or of any of the target tissues in species other than rats.
9.3.1.5 Synthesis of oxidative stress MOA
Strong support for the MOA exists, as oxidative stress and cell replication occur in rat kidneys at potassium bromate concentrations lower than those at which mutations occur. Moreover, the generation of oxidative adducts, cell replication and mutations tended to be reduced when co-exposure with GSH or cysteine (a GSH precursor) occurred. Likewise, studies that artificially depleted GSH levels demonstrated oxidative stress at lower levels than those at which it would normally occur. These studies, along with those that indicate a level of exposure below which no increases in 8-oxodG occur, appear to support the existence of doses at which tumour development is prevented in the relevant species.
The largest piece of evidence contradicting the hypothesis that the MOA is relevant to bromate-induced tumours is that the BMDL10 values for tumours (in males) are lower than those for oxidative stress (in males and females) or cell proliferation (in females). However, this observation might be explained by sex-related differences in α2u-globulin production. Levels of 8-oxodG are increased at similar potassium bromate concentrations in male and female rats, whereas males are more sensitive to both cellular proliferation and kidney tumour development. As cellular proliferation is associated with α2u-globulin production, which occurs with bromate exposure, the later key events are likely exacerbated in males as a result of this additional process. Because tumour incidence data that can be used for dose–response analysis exist only for males, quantitative comparisons between early key events and the outcome of renal cell tumours cannot be reliably performed.
In conclusion, the MOA of oxidative stress for renal cell tumours appears to be plausible, but further data are required for confirmation. Data for the other two tumour endpoints (tunica vaginalis mesotheliomas and thyroid tumours) are insufficient to assess the oxidative stress MOA. Although there are limited bromate-specific data on this MOA in humans, oxidative stress occurs in humans; therefore, the human relevance of this endpoint is currently assumed.
9.3.2 α2µ-globulin nephropathy
Data related to the α2u-globulin MOA are relevant only to kidney tumours. Evidence for a contributing role of the MOA exists for male rats; however, this MOA does not appear to be the main cause of renal cell tumours. The key events in this MOA were proposed as 1) accumulation of hyaline droplets in proximal tubules; 2) renal protein overload, causing renal cell injury; and 3) sustained compensatory cellular proliferation, leading to the propagation of bromate-induced or spontaneous genetic mutations. These key events are hypothesized to lead to the development of renal tumours. The support for—or data detracting from—the weight of evidence for each of these key events is presented in Sections 9.3.2.1–9.3.2.3; quantitative analyses of the key events and synthesis of the MOA are presented in Sections 9.3.2.4 and 9.3.2.5, respectively.
9.3.2.1 Accumulation of hyaline droplets in proximal tubules
Increases in renal hyaline droplets or α2u-globulin levels occurred in male rats in many drinking water studies, beginning at potassium bromate concentrations as low as 30 mg/L (Kurokawa et al., 1983; Umemura et al., 1993, 1998, 2004, 2009; NTP, 2001; Yamaguchi et al., 2008; Dodd et al., 2013). As expected, the effects in females either were non-existent (Umemura et al., 1993, 1998) or occurred to a much lower degree than in males and were not associated with bromate treatment (Umemura et al., 2004). No investigations of α2u-globulin could be found in other species, but the effect is understood to be a male rat–specific phenomenon.
9.3.2.2 Renal protein overload, causing renal cell injury
Dose-dependent degeneration was observed in proximal tubules in male rats at ≥ 60 mg/L (Kurokawa et al., 1983; Umemura et al., 2004; Yamaguchi et al., 2008); no increases were observed in females at concentrations up to 500 mg/L (Umemura et al., 2004). Indicators of impairment in renal function were also measured, with an increase in serum creatinine levels at ≥ 250 mg/L in males, but not females (Umemura et al., 2004), and a slight increase in blood urea nitrogen in both males and females at ≥ 250 mg/L (Kurokawa et al., 1983).
9.3.2.3 Cellular proliferation
As discussed in Section 9.3.1.3, renal cellular proliferation occurs after exposure to lower concentrations and for shorter durations in male rats than in female rats.
9.3.2.4 Quantitative analysis of key events for α2µ-globulin nephropathy MOA
A BMDL10 for hyaline droplet accumulation was estimated to be 7.5 mg/L in male rats (Yamaguchi et al., 2008), and a NOAEL of 60 mg/L (benchmark dose [BMD] values could not be calculated due to lack of fit of models) was observed for hepatic α2u-globulin concentrations in male rats (Umemura et al., 2004). The NOAEL for renal proximal tubule degeneration was 30 mg/L (Umemura et al., 2004). No BMD values could be calculated for cell proliferation in male rats, but the NOAEL for the effect was 15 mg/L (Umemura et al., 2004). Renal cell tumours had a BMDL10 of about 50 mg/L in two studies (Kurokawa et al., 1986a; Wolf et al., 1998). An absence of data precluded the calculation of BMD values for early key events in female rats or in other species.
9.3.2.5 Synthesis of α2u-globulin nephropathy MOA
The progression of the α2u-globulin nephropathy in renal tumours appears to be relevant for male rats. However, because this MOA has been demonstrated to be male rat specific and because renal tumours were still observed in female rats (as well as in mice and hamsters), this MOA does not appear to be the most relevant for renal tumours.
As discussed for the oxidative stress MOA, male rats are more sensitive to cell proliferation and renal tumours, whereas evidence of oxidative damage is quantitatively similar between male and female rats. Therefore, although hyaline droplet accumulation does not appear to be the responsible MOA for bromate-induced renal tumours, it does seem to play a role in the increased sensitivity of male rats, likely by enhancing increases in cellular proliferation. The incidence of renal tumours in male rats is therefore not likely to be quantitatively relevant to humans.
9.3.3 Direct-acting mutagenesis
Strong support for bromate's mutagenicity exists; however, as less evidence exists for its occurrence at tumour-relevant doses in rats, the role of the MOA in the development of tumours is questionable. The key events in this MOA were proposed as 1) direct DNA adduct formation; 2) mutagenesis (in critical genes); and 3) clonal expansion leading to preneoplastic lesions. These key events were investigated for their role in renal cell tumours, thyroid follicular cell tumours and mesothelioma of the testicular tunica vaginalis. The support for—or data detracting from—the weight of evidence for each of these key events is presented in Sections 9.3.3.1–9.3.3.3; quantitative analyses of the key events and synthesis of the MOA are presented in Sections 9.3.3.4 and 9.3.3.5, respectively.
9.3.3.1 Direct DNA adduct formation
No studies of direct DNA adduct formation after bromate exposure have been performed. The formation of 8-OHdG adducts is not relevant for the analysis of direct mutagenesis, because the adducts result from bromate-induced oxidative stress, rather than from direct-acting activities.
9.3.3.2 Mutagenesis
Only limited data existed for mutations in target tissues, all of which were on the kidney. Mutations in Spi−, gpt and Lac systems were observed in male and female rats exposed to potassium bromate only at 500 mg/L, and not at lower concentrations (Umemura et al., 2006, 2009; Yamaguchi et al., 2008). Co-exposures with antioxidants resulted in an attenuation of the mutagenicity in female, but not male, rats (Umemura et al., 2009).
In mice, no target tissue–specific data were identified, but micronucleus formation in erythrocytes was explored in two drinking water studies. Because mutagenicity is well conserved among tissues, these data were incorporated into the analysis. Dose-dependent induction of micronucleus was observed in mice; 80 mg/L was the LOAEL after an 8-week exposure (Allen et al., 2000) and the NOAEL after 78 weeks (Allen et al., 2000) or 27 weeks of exposure to sodium bromate (NTP, 2007).
Few investigations of the nature of the observed mutations have been performed in in vivo studies. Yamaguchi et al. (2008) identified a spectrum of mutagenic effects, of which only GC to TA transversions—commonly thought to be associated with oxidative (i.e., indirect) adducts—were significant (at 500 mg/L).
9.3.3.3 Clonal expansion leading to preneoplastic lesions
Cellular proliferation in kidneys, urothelium and thyroid is discussed in Section 9.3.1.3.
9.3.3.4 Quantitative analysis of key events for mutagenicity MOA
The absence of data on direct DNA adduct formation precludes the ability to perform dose–response analyses on the earliest key event in the MOA. BMDL10 values for mutagenicity in rat kidneys were approximately 230 mg/L in two different studies (Umemura et al., 2006; Yamaguchi et al., 2008). Points of departure for micronuclei in mouse erythrocytes were much lower, with a BMDL10 of 2.4 mg/L for the most conservative endpoint. Data on clonal expansion could be found only for rats; a BMDL10 of 75.1 mg/L for kidney cell proliferation in females (data could not be fit to models in males) (Umemura et al., 2004) and a BMDL10 of 19.6 mg/L for urothelial hyperplasia (Wolf et al., 1998) were identified. BMDL10 values were calculated for tumours in kidneys (approximately 50 mg/L in both Wolf et al. [1998] and Kurokawa et al. [1986a]), urothelium (34 mg/L in Wolf et al. [1998]; 141 mg/L in Kurokawa et al. [1996b]) and thyroid (79 mg/L in Wolf et al. [1998]; 137 mg/L in Kurokawa et al. [1986a]) of male rats. In male mice, data on kidney tumours were not amenable to BMD modelling, because a significant increase was observed only in the lowest exposure group (80 mg/L) (DeAngelo et al., 1998).
9.3.3.5 Synthesis of direct-acting mutagenicity MOA
Bromate has been identified to cause mutations in mice and rats in vivo and in human cells in vitro; however, mutagenicity resulting directly from bromate or its metabolites has not been studied. Although investigations of mutagenicity in tumour-relevant tissues have been performed only for the kidney in rats, the process of direct-acting mutagenicity tends to be considered consistent across tissues and species. For mutagenicity to be expected in a specific tissue, bromate would need to reach the target tissue; bromate has been shown to reach kidneys, thyroid and testes (Delker et al., 2006).
Data indicate that bromate concentrations causing renal tumours in rats are lower than those causing mutagenesis in the same species, which is evidence that detracts from this MOA's involvement in the development of bromate-induced tumours in rats. Mice appeared to be more sensitive than rats to mutagenicity (in erythrocytes; no studies of mutagenicity in tumour-relevant tissues), which also detracts from support for the direct-acting mutagenesis MOA, as rats are more sensitive to bromate-induced tumours. However, it should be noted that although tumours precede mutagenicity in the key species (i.e., rats), micronucleus formation in mouse erythrocytes occurred at doses similar to those at which renal tumours occurred (and a lower BMDL10 for micronucleus induction was calculated for one endpoint).
A critical data gap that, if filled, might help to better address the mutagenicity of bromate is the absence of in vivo mutagenicity assays in kidney tissues of mice. Moreover, further strengthening the experimental support for the oxidative stress MOA or demonstrating pharmacokinetic-related thresholds (e.g., by establishing that tumour development is prevented with co-exposures to antioxidants or GSH, respectively) might provide sufficient weight of evidence that a non-direct-acting mutagenesis MOA drives bromate-induced carcinogenicity.
In conclusion, the data tend to indicate that bromate is mutagenic; however, no in vivo studies of the earliest key event (i.e., direct-acting mutagenesis) have been performed, and mutagenesis does not appear to be a relevant MOA for bromate in the key species (i.e., rats). This MOA cannot be ruled out for the less sensitive species (i.e., mice); however, kidney tumours in this species do not occur with a consistent dose–response relationship. Although there are limited bromate-specific data on this MOA in humans, mutagenesis occurs in humans; therefore, the human relevance of this endpoint is currently assumed.
9.3.4 Other MOAs
Other potential MOAs that might contribute to bromate-induced tumours exist, but have insufficient data for analysis. These MOAs include thyroid hormone imbalance, sex hormone imbalance and immunosuppression, and a proposed key event of alterations of apoptosis. As a more detailed MOA analysis could not be performed for these MOAs, a cursory overview of each is presented.
9.3.4.1 Alterations in apoptosis
An additional key event that has recently been proposed for bromate is the alteration of apoptosis in kidney cells. The proposed key event involves an increase in apoptosis, which is followed by a compensatory suppression of apoptosis. The suppression of apoptosis allows for the survival and replication of cells with DNA damage, increasing the likelihood of renal cell tumour development (Bull and Cotruvo, 2013). Limited data related to this key event currently exist; future studies might better help to identify whether the key event should be incorporated into existing proposed MOAs, and/or into additional MOAs. The sole data relating to apoptosis was an increase in apoptosis (as measured by terminal deoxynucleotidyl transferase dUTP nick end labelling [TUNEL] staining) measured in renal proximal tubules in rats (at ≥ 15 mg/L in females and ≥ 60 mg/L in males) (Kolisetty et al., 2013a). This increase in apoptosis was accompanied by expression of proteins that suppress apoptosis, including p21 and clusterin (Kolisetty et al., 2013a, 2013b).
If apoptosis is a key event for bromate, 8-oxodG increases and micronucleus development might be secondary to apoptosis, rather than key events in other MOAs. As apoptosis-induced cellular breakdown occurs, DNA might be more exposed to generated free radicals, resulting in 8-oxodG development (Kolisetty et al., 2013a). Moreover, the development of micronuclei, the mutagenic effect observed at lowest concentrations, could be influenced by apoptosis, as apoptotic bodies appear similar to micronuclei (Bull and Cotruvo, 2013). However, as there are currently only limited data to support alterations in apoptosis, and as bromate-induced apoptosis has not been investigated in mice (the species in which micronuclei were observed in vivo), these effects must still be considered relevant for other MOAs.
9.3.4.2 Thyroid hormone imbalance
Thyroid hormone disruption might be expected to result in bromate-induced thyroid tumours in rats if bromate-related decreases in triiodothyronine (T3) or thyroxine (T4) occur, which might lead to a compensatory increase in thyroid stimulating hormone (TSH) and subsequent thyroid cell hyperplasia. The only available data on the hypothesized early key events in bromate-exposed male rats include evidence of a decrease in T3 at low doses, including those leading to thyroid tumours (DeAngelo et al., 1998; Wolf et al., 1998), and increased thyroid cell replication rates in rats exposed to bromate at levels higher than the lowest tumour-generating doses (Cotruvo and Bull, 2012). Effects counter to the MOA were observed by Dodd and colleagues (2013), including a decrease in TSH (but without a dose–response relationship) with an absence of effect in T3 and T4 at tumour-relevant doses in rats.
Studies measuring the levels of thyroid hormones, TSH and cell replication/hyperplasia at concentrations lower than those contributing to tumour development (i.e., 20 mg/L in drinking water) in male and female rats would help to further evaluate this proposed MOA. If these studies could also somehow attempt to prevent bromate-induced thyroid hormone depletion (and/or compensatory increases in TSH, if this occurs with bromate) and demonstrate the resulting impact on cell proliferation, the data would be extremely useful for further MOA analyses of bromate. If it were possible to perform studies investigating bromate exposure and impacts on thyroid hormone and TSH levels in humans in an ethical manner, these could also be relevant for the species concordance analysis.
Humans are much less sensitive than rodents to thyroid tumour development from the disruption of the hypothalamus–pituitary–adrenal axis; therefore, if this MOA were confirmed as being relevant for bromate-related thyroid tumours, the human relevance of these tumours could be excluded, based on quantitative differences between species (Meek et al., 2003; Crofton, 2008). However, as thyroid disruption can still affect neurodevelopment in rodents and humans (Crofton, 2008), further investigation of these endpoints should be performed in various species, if possible.
9.3.4.3 Sex hormone imbalance
Altered balance of sex hormones can potentially result in promotion of tumours. No studies of the effect of bromate on dopamine, prolactin, luteinizing hormone, testosterone, gonadotropin releasing hormone or other aspects of the hypothalamus–pituitary–testes axis have been identified. Some potential indirect evidence of sex hormone imbalance could be the observation of decreased epididymal sperm density in a reproductive study (NTP, 1996). Leydig cell hyperplasia could also be evidence of low testosterone, but no studies discussed this effect; Leydig cell tumours were observed in rats exposed to potassium bromate, but were also observed at high levels in control animals in the same studies.
9.3.4.4 Immunosuppression
A study that explored immunosuppression of sodium bromate in female B6C3F1 mice exposed to 80, 200, 400, 600 or 800 mg/L for 28 days (Guo et al., 2001) demonstrated an absence of immunosuppression for most endpoints; however, a decrease in the ability of macrophages to suppress melanoma cell proliferation was observed. The effect was mild and did not occur in a dose-related manner (suppression at 200 and 800 mg/L if unstimulated and at 200, 400 and 800 mg/L if stimulated by interferon-γ and lipopolysaccharides). This study might indicate that bromate exposure could suppress immunological defences against tumour cells; however, no further studies to support this potential MOA could be found.
9.3.5 Conclusions and implications of the MOA analysis
Data on bromate are currently insufficient to preclude a mutagenic MOA; likewise, the current weight of evidence is not sufficient to support any of the proposed non-mutagenic MOAs. Owing to these data limitations, low-dose linear extrapolation is required to quantitatively assess bromate cancer risks; this is performed in Section 10.1. If any new studies contribute to a sufficiently increased weight of evidence for non-cancer MOAs or against a mutagenic MOA, a threshold approach could be considered in future bromate risk assessments.
10.0 Classification and assessment
Health Canada has developed health-based values (HBVs) for cancer and non-cancer effects, as presented in Sections 10.1 and 10.2, respectively. These values are presented with and without the application of human equivalent concentrations derived from the PBPK model described in Section 8.5.
10.1 Cancer risk assessment
Potassium bromate has been classified by IARC (1999) as possibly carcinogenic to humans (Group 2B), based on sufficient evidence of carcinogenicity in experimental animals but inadequate evidence in humans.
Both the Kurokawa et al. (1986a) and the DeAngelo et al. (1998) studies were considered for assessment of the carcinogenic risk associated with the ingestion of bromate in drinking water. Both studies administered bromate in drinking water to male rats over a chronic period of exposure. DeAngelo et al. (1998) was chosen as the key study to assess the carcinogenic risk associated with the ingestion of bromate in drinking water. As described in previous sections, this study administered bromate in drinking water to male rats at various low-dose concentrations. The study used a large number of animals and included several groups with exposures at low levels. In addition, individual animal tumour data were available that could be used to better inform the risk analysis. This study also included multiple times of sacrifice, which was used to conduct time-to-tumour analysis to derive a slope factor for each cancer site, taking early deaths into account.
The results from this study report tumours occurring in the kidney, the thyroid, and mesotheliomas of the tunica vaginalis. All three tissues were considered independently in the analysis, given that each site has been reported to have different modes of action. Health Canada's approach was to consider all possible carcinogenic endpoints and use the most conservative one that may be of relevance to humans.
It should be noted that extrapolation from carcinogenicity studies in male rat kidney may not be representative of the actual risk of exposure to drinking water containing low concentrations of bromate. Given that α2u-µglobulin nephropathy is specific to the male rat and likely explains the male rat's increased sensitivity to bromate-induced tumorigenesis, studies in the female rat would more appropriately model human risk assessment. The contribution of α2-µglobulin to bromate-induced carcinogenesis may result in a greater calculated risk for carcinogenicity in the kidney by suggesting that carcinogenicity exists at lower doses than would occur in humans. Although α2-u-globulin-induced tumours are not relevant to humans, one cannot completely discount the carcinogenicity studies conducted in male rats, given that the overall carcinogenic effect results not only from α2u-µglobulin, but also from other MOAs that are relevant to humans.
Although the MOAs for bromate have yet to be fully elucidated, direct-acting mutagenic effects occurred in vivo only at concentrations that exceeded those at which cancers were regularly observed. A number of studies have proposed the existence of a threshold for the carcinogenicity of bromate in the kidney; a detailed account of the dose–response analysis and possible MOAs for bromate is found in Section 9.3. Despite the suggestion of a threshold MOA from some studies, analysis of available MOA data has not led to the conclusion that there is sufficient evidence in published literature to depart from a default linear non-threshold approach to quantify carcinogenic risk at the present time.
Although the scientific literature has focused on carcinogenic effects on the kidney and their associated mechanisms, currently published risk assessments have considered a multisite approach to include all reported carcinogenic effects (i.e., tumours of the kidney, thyroid, tunica vaginalis) (OEHHA, 2009). Health Canada's approach also considers all possible carcinogenic effects—including early key events in the most likely MOAs—by modelling risk for each tissue independently and selecting the most conservative endpoint as the basis for the cancer risk assessment.
The PBPK model described in Section 8.5 was applied to estimate the concentrations of bromate for humans that would be equivalent to the doses administered to rats in the DeAngelo et al. (1998) study. It should be noted that limitations in the model, notably lack of human pharmacokinetic data for validation, were identified. Because the differences between rats and humans in bromate kinetics are unknown, allometric scaling is applied to account for these potential differences, even though the PBPK model is used. The results of a default approach (i.e., using no PBPK model, and using an allometric scaling factor (i.e. dose per body weight scaled to the ¾ power) to extrapolate from animals to humans) are also presented for comparison.
Benchmark doses (BMD10) and their lower limits (BMDL10) for male rats were calculated for each tissue. Individual values for each tissue were determined using a time-to-tumour model to account for the occurrence of incidental and fatal tumours (data used as published in OEHHA, 2009). For the kidney and thyroid, a polynomial degree model was used for both incidental and fatal tumour analysis, which yielded the same results for incidental versus fatal modelling; a linear fit was applied for the kidney, and a quadratic fit for the thyroid. A fatal model (polynomial, second order) was chosen for the mesotheliomas, as it provided a more conservative potency estimate than analysis using incidental tumours. Analysis was performed using the U.S. EPA multistage Weibull time-to-tumor model (U.S. EPA, 2009d) and Tox Risk software programs. The BMD10 and BMDL10 values were then extrapolated to human equivalent concentrations in drinking water using PBPK modelling (Section 8.5); these values are presented in Table 6.
Table 6. Calculated human equivalent BMD10 and BMDL10 values in drinking water associated with data from DeAngelo et al. (1998)
| Tissue | BMD10 (mg/L) | BMDL10 (mg/L) |
|---|---|---|
| Kidney | 64 | 48 |
| Thyroid | 122 | 73 |
| Tunica vaginalis | 71 | 38 |
10.1.1 Threshold approach using tumours
Insufficient information exists to conclusively identify the MOA for each of the cancer endpoints. Bromate has been found to be mutagenic, but the concentrations at which it has been observed to be mutagenic in vivo are higher than those at which tumours were observed (see Section 9.3). This evidence for bromate would support a non-mutagenic mechanism for the development of tumours and a possible tolerable daily intake (TDI) approach in risk assessment. Although some evidence suggests a threshold MOA for bromate, existing evidence reported in the literature to date is not conclusive.
10.1.2 Non-threshold approach
As mutagenicity cannot be completely ruled out, and because a fully elucidated MOA has not been identified for bromate, the default linear extrapolation approach to estimate exposure levels that would result in excess cancer risk levels in the range of 10−5 to 10−6 (1 in 100 000 to 1 in 1 000 000) was applied. A linear approximation (i.e., dividing the benchmark response level of 10% by the BMDL10 value for each tissue type) was used to obtain unit risks, which were then used to calculate the concentrations of bromate in drinking water associated with excess cancer risks of 10−4, 10−5 and 10−6 (Table 7).
Table 7. Calculated concentrations of bromate in drinking water associated with excess cancer risks
| Tissue | Cancer slope factor [(mg/L)−1] |
Concentration of bromate (mg/L) | ||
|---|---|---|---|---|
| 10−4 risk | 10−5 risk | 10−6 risk | ||
| Default approach (no PBPK modelling, allometric scaling) | ||||
| Kidney | 2.2 × 10⁻³ | 0.046 | 0.004 6 | 0.000 46 |
| Thyroid | 1.3 × 10⁻³ | 0.077 | 0.007 7 | 0.000 77 |
| Tunica vaginalis | 3.0 × 10⁻³ | 0.034 | 0.003 4 | 0.000 34 |
| PBPK approach, with allometric scaling | ||||
| Kidney | 2.1 × 10⁻³ | 0.048 | 0.004 8 | 0.000 48 |
| Thyroid | 1.4 × 10⁻³ | 0.073 | 0.007 3 | 0.000 73 |
| Tunica vaginalis | 2.6 × 10⁻³ | 0.038 | 0.003 8 | 0.000 38 |
Of the three tissue types, the mesotheliomas of the tunica vaginalis provide the most conservative estimate of cancer risk and are therefore used to estimate the HBV for the carcinogenic risk assessment using the non-threshold approach. Thus, the HBV for bromate in drinking water associated with an excess lifetime cancer risk of 10−5 is determined to be 0.004 mg/L (4 µg/L) (rounded). Since drinking water represents the major source of exposure to bromate (80%), a MAC based on a target lifetime cancer risk level of 10-5 is considered appropriate (Krishnan and Carrier, 2013).
10.2 Non-cancer risk assessment
In addition to evaluating the carcinogenic potential of potassium bromate in male rats, the study by DeAngelo et al. (1998) and the work by Wolf et al. (1998) also evaluated the non-neoplastic endpoint of increases in renal pelvis urothelial hyperplasia. As previously described, F344 rats and B6C3F1 mice were given potassium bromate in drinking water at a concentration of 0, 0.02, 0.1, 0.2, or 0.4 g/L for up to 100 weeks. Urothelial hyperplasia was observed in the rats only and characterized by an increase in the number of layers of urothelial cells that line the renal pelvis and papillae. This increase was reported at a concentration of 0.1 g/L (6.1 mg/kg bw per day), with a NOAEL of 0.02 g/L (1.1 mg/kg bw per day). This study provides the lowest reported NOAEL for non-carcinogenic effects resulting from exposure to bromate and was therefore selected as the basis for derivation of an HBV.
Health Canada used the data on urothelial hyperplasia reported in the study by DeAngelo et al. (1998) and Wolf et al. (1998) to calculate BMD values using both the human equivalent concentrations from the PBPK model, described in Section 8.5, and a default approach (i.e., no PBPK model).
Using the PBPK model, a BMD10 of 92.2 mg/L was calculated, representing a 10% increased incidence in adverse effects over background rates. A lower 95% confidence limit (BMDL10) of 49.7 mg/L corresponding to the BMD10 for this endpoint was calculated. The BMD10 and BMDL10 were derived using data for animals only at final sacrifice; however, using results for all animals in the Wolf et al. (1998) study, including early and final sacrifice times, gave similar results. Analysis was performed using the U.S. EPA's BMDS (Version 2.4 R70), and a log-logistic model was chosen, given that it was the model with the best fit in the analysis (U.S. EPA, 2013).
The HBV for bromate was calculated by selecting the dose at which the critical effect was observed at low incidence (i.e., 10%) and applying uncertainty factors to reflect differences between study conditions and conditions of human environmental exposure. As the PBPK analysis reported human equivalent concentrations in milligrams per litre and as these concentrations already account for the 70 kg average body weight for an adult and 1.5 L/day drinking water ingestion rate for an adult, the HBV for bromate-induced urothelial hyperplasia can be calculated as follows:
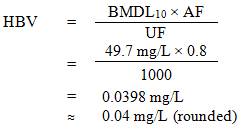
Equation 3 - Text Equivalent
The health based value (HBV) for bromate is approximately 0.04 mg/L (rounded). This is calculated by multiplying the BMDL10 ( 49.7 mg/L) times the allocation factor (AF) for drinking water of 0.8, then dividing this product by the combined uncertainty factor (UF) of 1000.
where:
- BMDL10 (49.7 mg/L) is the human-equivalent lower 95% confidence limit of the calculated benchmark dose (BMD10);
- UF is the combined uncertainty factor of ×10 for interspecies variation (given the uncertainty in the PBPK model—particularly the absence of a validated human model— the toxicokinetic portion of the default uncertainty factor was still applied), ×10 for intraspecies variation and ×10 for database deficiencies with respect to developmental toxicity (lack of a long-term study with respect to developmental neurotoxicity, lack of a developmental toxicity study in a second species, and the predominance of chronic studies in male rodents, with chronic studies in females limited to one study of rats with two dose groups [Kurokawa et al., 1983] and a complete absence of chronic studies in females of other species);
- AF is the allocation factor, the proportion of the daily intake of bromate allocated to drinking water. A value of 0.8 was used given that drinking water is the primary source of exposure to bromate (Krishnan and Carrier, 2013) and that exposure to bromate from other media (air, soil, food and consumer products) is expected to be negligible.
Therefore, an HBV of 0.04 mg/L (40 µg/L) for non-cancer effects resulting from exposure to bromate in drinking water is calculated with application of the PBPK model.
For comparison, the default approach, in which the PBPK model is not applied, was also used to determine a HBV based on the non-cancer endpoint of urothelial hyperplasia:
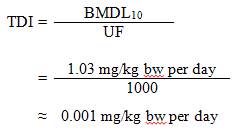
Equation 4 - Text Equivalent
The TDI for bromate is approximately 0.001 mg/kg bw per day. This is calculated by dividing the BMDL10 of 1.03 mg/kg bw per day by the uncertainty factor (UF) 1000.
where:
- BMDL10 (1.03 mg/kg bw per day) is the calculated lower 95% confidence limit of the calculated benchmark dose for bromate in rats; and
- UF is the combined uncertainty factor of ×10 for interspecies variation, ×10 for intraspecies variation and ×10 for database deficiencies with respect to developmental toxicity (lack of a long-term study with respect to developmental neurotoxicity, lack of a developmental toxicity study in a second species, and the predominance of chronic studies in male rodents, with chronic studies in females limited to one study of rats with two dose groups [Kurokawa et al., 1983] and a complete absence of chronic studies in females of other species).
From this derived TDI, the health-based value can be calculated as follows:
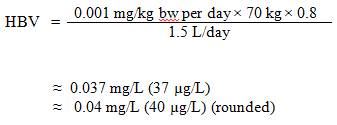
Equation 5 - Text Equivalent
The HBV for bromate using a non-PBPK approach is approximately 0.04 mg/L (rounded). This is calculated by multiplying the TDI (0.001 mg/L) by 70 kg, then by the allocation factor (AF) for drinking water of 0.8, then dividing this product by the 1.5 L/day.
where:
- 0.001 mg/kg bw per day is the TDI, as derived above;
- 70 kg is the average body weight of an adult;
- 0.8 is the proportion of the daily intake of bromate allocated to drinking water, given that drinking water is the primary source of exposure to bromate (Krishnan and Carrier, 2013) and that exposure to bromate from other media (air, soil, food and consumer products) is expected to be negligible; and
- 1.5 L/day is the daily volume of water consumed by an adult
Therefore, a HBV of 0.04 mg/L (40 µg/L) for non-cancer effects resulting from exposure to bromate in drinking water is calculated with the default approach.
10.3 Comparison of cancer and non-cancer risk assessments
In Section 10.1, the concentration of bromate associated with a lifetime excess risk of mesotheliomas of the tunica vaginalis of 10−5 was determined to be 0.004 mg/L (4 µg/L). Non-cancer risk assessments based on urothelial hyperplasia are described in Section 10.2 and yielded HBVs of 0.04 mg/L (40 µg/L), calculated using both the PBPK model and the default approach. As the cancer risk assessment resulted in a more conservative value for bromate in drinking water compared with those generated by the non-cancer approaches, the cancer risk assessment approach was determined as the most appropriate approach for developing the MAC in drinking water.
10.4 International considerations
Various organizations have assessed the risk associated with the ingestion of bromate in drinking water. Carcinogenicity has been the key endpoint of concern, and linear extrapolation using a non-threshold approach has been used in most cases. Given the low health-based values obtained using this approach, risk management has been necessary to ensure that established guidelines are achievable with respect to available treatment and analytical technology.
Most existing risk assessments are based on the study by DeAngelo et al. (1998), who reported increased kidney, thyroid and mesothelial tumour incidence in rats following exposure to bromate in drinking water. In 2005, the World Health Organization (WHO, 2005) established a provisional guideline value of 10 µg/L for bromate in drinking water, which was risk managed from a health-based value of 2 µg/L. Similarly, the U.S. EPA used this study as a basis for its 2006 drinking water standard for bromate: a maximum contaminant level goal of 0 µg/L and a maximum contaminant level of 10 µg/L were established (U.S. EPA, 2006). This study was also used by the California EPA to establish a public health goal of 0.1 µg/L in 2009; the agency adopted the U.S. EPA’s maximum contaminant level of 10 µg/L (OEHHA, 2009).
The National Health and Medical Research Council of Australia established a drinking water guideline of 0.02 mg/L for bromate in 1996 (NHMRC, 2011). The risk assessment was based on a Japanese study by Nakano et al. (1989), which used renal changes in the rat as the endpoint of concern.
11.0 Rationale for guideline
Potassium bromate is classified by IARC as a possible human carcinogen (Group 2B), based on sufficient evidence of carcinogenicity in experimental animals but inadequate evidence in humans. The toxicity of potassium bromate is associated with the bromate ion, rather than the salt itself. Bromate is not a concern in source water; it is found in drinking water as a result of water treatment. The most important sources of bromate in drinking water are its formation through the reaction of naturally occurring bromide and ozone and as a contaminant in hypochlorite solutions used to disinfect drinking water.
The effects of bromate have been studied in rodents administered bromate in drinking water at various concentrations, and tumours in the kidney, thyroid and mesothelium of the tunica vaginalis have been observed. Using PBPK modelling and allometric scaling, benchmark doses were calculated for all three endpoints. Mesotheliomas of the tunica vaginalis provided the most conservative approach, which was used to calculate a health-based value for bromate in drinking water.
A MAC of 0.01 mg/L (10 µg/L) is established for bromate in drinking water based on the following considerations:
- The concentrations representing an "essentially negligible" lifetime risk of mesotheliomas of the tunica vaginalis of 10−6 and 10−5 were determined as 0.0004 and 0.004 mg/L (0.4 and 4 µg/L), respectively. Health Canada has defined "essentially negligible" as a range from one new cancer above background levels per 100 000 people to one new cancer above background levels per 1 million people (i.e., 10−5 to 10−6). As drinking water is the single most important source of exposure to bromate, the HBV for bromate in drinking water is determined to be 0.004 mg/L (4 µg/L), based on an excess lifetime cancer risk of 10−5. This level is protective of both potential cancer and non-cancer effects resulting from exposure to bromate in drinking water.
- Based on the capacity of commercial laboratories, analytical methods are available to reliably measure bromate in drinking water to below the MAC.
- Bromate is difficult to remove from drinking water once formed. Recommended strategies for municipal systems focus on preventing its formation by controlling the ozonation process or by ensuring the quality of treatment chemicals by using products certified to the appropriate NSF/ANSI standard and minimizing handling and storage time between product manufacturing and product use. Residential treatment devices using reverse osmosis, distillation or ion exchange are expected to remove bromate to below the MAC.
- Efforts to reduce bromate concentrations must not compromise the effectiveness of disinfection.
- The MAC takes into consideration the need to ensure that the SPAC for hypochlorite solutions is achievable by manufacturers and utilities. Hypochlorite manufacturers reported during the process to update NSF/ANSI Standard 60 that achieving a SPAC lower than 0.0033 mg/L (i.e., 0.01 mg/L divided by 3 sources of exposure) would be technically difficult and result in significantly fewer certified products.
In considering both technical feasibility and the health risks associated with bromate exposure from drinking water, the Federal-Provincial-Territorial Committee on Drinking Water has established a MAC of 0.01 mg/L (10 µg/L). The estimated lifetime risk associated with ingestion of water containing bromate at the MAC is 2.5 × 10⁻⁵, which is slightly above the range that is considered to represent "essentially negligible" risk (i.e., between 10−5–10−6). The MAC is a risk-managed value based on technical feasibility related to the production of hypochlorite containing low bromate concentrations.
As part of its ongoing guideline review process, Health Canada will continue to monitor new research in this area and recommend any change to the guideline that is deemed necessary.
References
Acero, J.L. and von Gunten, U. (2001). Characterization of oxidation processes: ozonation and the AOP O3/H2O2. J. Am. Water Works Assoc., 93(10): 90–100.
AGAT Laboratories (2014). Personal communications with D. Desmarais (Burnaby, B.C.), A. Al-Sakaf (Calgary, Alberta) and P. Reyno (Dartmouth, Nova Scotia).
Ahlborn, G.J., Delker, D.A., Roop, B.C., Geter, D.R., Allen, J.W., DeAngelo, A.B. and Winnik, W.M. (2009). Early alterations in protein and gene expression in rat kidney following bromate exposure. Food Chem. Toxicol., 47: 1154–1160.
Ahmad, M.K. and Mahmood, R. (2012). Oral administration of potassium bromate, a major water disinfection by-product, induces oxidative stress and impairs the antioxidant power of rat blood. Chemosphere, 87(7): 750–756.
Ahmad, M.K., Naqshbandi, A., Fareed, M. and Mahmood, R. (2012). Oral administration of a nephrotoxic dose of potassium bromate, a food additive, alters renal redox and metabolic status and inhibits brush border membrane enzymes in rats. Food Chem., 134(2): 980–985.
Allen, J.W., Collins, B.W., Lori, A., Afshari, A.J., George, M.H., DeAngelo, A.B. and Fuscoe, J.C. (2000). Erythrocyte and spermatid micronucleus analyses in mice chronically exposed to potassium bromate in drinking water. Environ. Mol. Mutagen., 36(3): 250–253.
ALS Environmental (2014). Personal communication with L. Neimor.
Amy, G.L. and Siddiqui, M.S. (1999). Strategies to control bromate and bromide. AWWA Research Foundation and American Water Works Association, Denver, Colorado.
Amy, G., Siddiqui, M., Zhai, W., Debroux, J. and Odem, W. (1994). Survey of bromide in drinking water and impacts on DBP formation. AWWA Research Foundation and American Water Works Association, Denver, Colorado.
Amy, G.L., Westerhoff, P., Minear, R.A. and Song, R. (1997). Formation and control of brominated ozone by-products. AWWA Research Foundation and American Water Works Association, Denver, Colorado.
ANSI/AWWA (2010). ANSI/AWWA B300-10—Hypochlorites. American Water Works Association, Denver, Colorado.
Arai, T., Kelly, V.P., Minowa, O., Noda, T. and Nishimura, S. (2002). High accumulation of oxidative DNA damage, 8-hydroxyguanine, in Mmh/Ogg1 deficient mice by chronic oxidative stress. Carcinogenesis, 23(12): 2005–2010.
Asami, M., Aizawa, T., Morioka, T., Nishijima, W., Tabata, A. and Magara, Y. (1999). Bromate removal during transition from new granular activated carbon (GAC) to biological activated carbon (BAC). Water Res., 33(12): 2797–2804.
ASTM (2012). Standard test methods for bromate, bromide, chlorate, and chlorite in drinking water by suppressed ion chromatography. ASTM International, West Conshohocken, Pennsylvania.
Awogi, T., Murata, K., Uejima, M., Kuwahara, T., Asanami, S., Shimono, K. and Morita, T. (1992). Induction of micronucleated reticulocytes by potassium bromate and potassium chromate in CD-1 male mice. Mutat. Res., 278(2–3): 181–185.
Ballmaier, D. and Epe, B. (2006). DNA damage by bromate: mechanism and consequences. Toxicology, 221(2–3): 166–171.
Bao, M.L., Griffini, O., Santianni, D., Barbieri, K., Burrini, D. and Pantani, F. (1999). Removal of bromate ion from water using granular activated carbon. Water Res., 33(13): 2959–2970.
Bartels, C.R., Rybar, S., Andes, K. and Franks, R. (2009). Optimized removal of boron and other specific contaminants by SWRO membranes. In: Proceedings of the International Desalination Association World Congress, Dubai, United Arab Emirates. International Desalination Association, Topsfield, Massachusetts.
Benotti, M.J., Wert, E.C., Snyder, S.A., Owen, C. and Cheng, R. (2011). Role of bromamines on DBP formation and impact on chloramination and ozonation. Water Research Foundation, Denver, Colorado.
Bolyard, M., Snyder Fair, P. and Hautman, D.P. (1992). Occurrence of chlorate in hypochlorite solutions used for drinking water disinfection. Environ. Sci. Technol., 26(8): 1663–1665.
Bonacquisti, T.P. (2006). A drinking water utility’s perspective on bromide, bromate, and ozonation. Toxicology, 221(2-3): 145–148.
Bouland, S., Duguet, J.-P. and Montiel, A. (2005). Evaluation of bromate ions level introduced by sodium hypochlorite during post-disinfection of drinking water. Environ. Technol., 26(2): 121–125.
Boyer, T.H., Ged, E., Motz, L., Chadik, P., Frank, K. and Hill, C.P. (2013). Impact of sea-level rise on saltwater intrusion and formation of brominated disinfection byproducts. In: Water Quality Technology Conference and Exposition (WQTC) Conference Proceedings. American Water Works Association, Denver, Colorado.
Buffle, M.-O., Galli, S. and von Gunten, U. (2004). Enhanced bromate control during ozonation: the chlorine–ammonia process. Environ. Sci. Technol., 38(19): 5187–5195.
Bull, R.J. and Cotruvo, J.A. (2006). Research strategy for developing key information on bromate’s mode of action. Toxicology, 221(2–3):135–144.
Bull, R.J. and Cotruvo, J.A. (2013). Nongenotoxic mechanisms involved in bromate-induced cancer in rats. J. Am. Water Works Assoc., 105(12): E709–E720.
Bull, R.J., Kolisetty, N., Zhang, X., Muralidhara, S., Quiñones, O., Lim, K.Y., Guo, Z., Cotruvo, J.A., Fisher, J.W., Yang, X., Delker, D., Snyder, S.A. and Cummings, B.S. (2012). Absorption and disposition of bromate in F344 rats. Toxicology, 300(1–2): 83–91.
Butler, R., Godley, A., Lytton, L. and Cartmell, E. (2005). Bromate environmental contamination: review of impact and possible treatment. Crit. Rev. Environ. Sci. Technol., 35(3): 193–217.
Campbell, K.C. (2006). Bromate-induced ototoxicity. Toxicology, 221(2–3): 205–211.
Campbell, J.L., Jr. (2013). Development of a rat and human PBPK model for bromate and estimation of human equivalent concentrations. Report prepared for Health Canada.
Carrasco-Turigas, G., Villanueva, C.M., Goñi, F., Rantakokko, P. and Nieuwenhuijsen, M.J. (2013). The effect of different boiling and filtering devices on the concentration of disinfection by-products in tap water. J. Environ. Public Health, 2013: 1–8.
CFIA (2012). 2010–2011 Bromate in bottled water: executive summary [online]. Canadian Food Inspection Agency. Available at: www.inspection.gc.ca/food/chemical-residues-microbiology/chemical-residues/bromate/eng/1347981862898/1347982103854
Chao, P. and Westerhoff, P. (2003). Water quality factors affecting hydroxyl radicals and bromate formation during ozonation. In: Water Quality Technology Conference and Exposition (WQTC) Conference Proceedings. American Water Works Association, Denver, Colorado.
Chen, S., Zhu, Q., Liu, D., Cui, F., Fang, L. and Ma, D. (2013). Bromate control by UVC and UVA treatment in drinking water. Adv. Mater. Res., 807–809: 1455–1458.
Chen, R., Yang, Q., Zhong, Y., Li, X., Li, X.-M., Du, W.-X. and Zeng, G.-M. (2014). Sorption of trace levels of bromate by macroporous strong base anion exchange resin: influencing factors, equilibrium isotherms and thermodynamic studies. Desalination, 344: 306–312.
Chiang, P.C., Chang, E.E. and Liang, C.H. (2002). NOM characteristics and treatabilities of ozonation processes. Chemosphere, 46(6): 929–936.
Chlorine Institute (1999). Bromate in sodium hypochlorite solutions—a progress report. Chlorine Institute, Washington, DC.
Chuu, J.J., Hsu, C.J. and Lin-Shiau, S.Y. (2000). The detrimental effects of potassium bromate and thioglycolate on auditory brainstem response of guinea pigs. Chin. J. Physiol., 43(2): 91–96.
Clewell, R.A., Merrill, E.A., Yu, K.O., Mahle, D.A., Sterner, T.R., Fisher, J.W. and Gearhart, J.M. (2003). Predicting neonatal perchlorate dose and inhibition of iodide uptake in the rat during lactation using physiologically-based pharmacokinetic modeling. Toxicol. Sci., 74(2): 416–436.
Cooper, W.J., Zika, R.G. and Steinhauer, M.S. (1985). Bromide–oxidant interactions and THM formation: a literature review. J. Am. Water Works Assoc., 77(4): 116–121.
Cornwell, D. (2014). Impact of increased bromide in water sources on drinking water DBPs. In: American Water Works Association Annual Conference and Exposition (ACE) Conference Proceedings. American Water Works Association, Denver, CO.
Cotruvo, J., Bull, R.J., Cummings, B.S., Delker, D, Zhongxian, G., Fisher, J., Quinones, O., Snyder, S.A. and Ong, C.N. (2012). Bromate disposition and mechanisms of toxicity at high and low doses. Water Research Foundation and International Ozone Association (Web Report No. 4042).
Coulombe, L. (2016). Personal communication. Université Laval.
Coulombe, L., Legay, C., Bolduc, A., Dassylva, N., Sérodes, J-B. and Rodriguez, M.J. (2015). Contamination and management of hypochlorite solutions in small drinking water systems. In: Water Quality Technology Conference and Exposition (WQTC) Conference Proceedings. American Water Works Association, Denver, Colorado.
Crofton, K.M. (2006). Bromate: concern for developmental neurotoxicity? Toxicology, 221(2–3): 212–216.
Crofton, K.M. (2008). Thyroid disrupting chemicals: mechanisms and mixtures. Int. J. Androl., 31: 209–223.
Crosby, L.M., Morgan, K.T., Gaskill, B., Wolf, D.C. and DeAngelo, A.B. (2000). Origin and distribution of potassium bromate–induced testicular and peritoneal mesotheliomas in rats. Toxicol. Pathol., 28(2): 253–266.
Dabeka, R.W., Conacher, H.B.S., Lawrence, J.F., Newsome, W.H., McKenzie, A., Wagner, H.P., Chadha, R.K.H. and Pepper, K. (2002). Survey of bottled drinking waters sold in Canada for chlorate, bromide, bromate, lead, cadmium and other trace elements. Food Addit. Contam., 19: 721–732.
DeAngelo, A.B., George, M.H., Kilburn, S.R., Moore, T.M. and Wolf, D.C. (1998). Carcinogenicity of potassium bromate administered in the drinking water to male B6C3F1 mice and F344/N rats. Toxicol. Pathol., 26(5): 587–594.
Delker, D., Hatch, G., Allen, J., Crissman, B., George, M., Geter, D., Kilburn, S., Moore, T., Nelson, G., Roop, B., Slade, R., Swank, A., Ward, W. and DeAngelo, A. (2006). Molecular biomarkers of oxidative stress associated with bromate carcinogenicity. Toxicology, 221: 158–165.
Dodd, D.E., Layko, D.K., Cantwell, K.E., Willson, G.A. and Thomas, R.S. (2013). Subchronic toxicity evaluation of potassium bromate in Fischer 344 rats. Environ. Toxicol. Pharmacol., 36(3): 1227–1234.
Dorfman, L.M. and Adams, G.E. (1973). Reactivity of the hydroxyl radical in aqueous solutions. National Standard Reference Data System, U.S. National Bureau of Standards, U.S. Department of Commerce. Available at: http://permanent.access.gpo.gov/LPS112864/NSRDS-NBS-46.pdf
Elovitz, M.S. and von Gunten, U. (1999). Hydroxyl radical/ozone ratios during ozonation processes. I. The Rct concept. Ozone Sci. Eng., 21: 239–260.
Elovitz, M.S., von Gunten, U. and Kaiser, H.-P. (2000). Hydroxyl radical/ozone ratios during ozonation processes. II. The effect of temperature, pH, alkalinity, and DOM properties. Ozone Sci. Eng., 22: 123–150.
Environment Canada and Health Canada (2010). Screening assessment for the Challenge: Bromic acid, potassium salt (potassium bromate). Chemical Abstracts Service Registry Number 7758-01-2. Available at: www.ec.gc.ca/ese-ees/47CCC26F-88C5-40E4-8C3D-FE88049DC9C7/batch9_7758-01-2_en.pdf
Fisher, J. and Bull, R.J. (2006). Development of a rat dosimetry model for bromate. Toxicology, 221(2–3): 235–240.
Fujie, K., Shimazu, H., Matsuda, M. and Sugiyama, T. (1988). Acute cytogenetic effects of potassium bromate on rat bone marrow cells in vivo. Mutat. Res., 206(4): 455–458.
Fujii, M., Oikawa, K., Saito, H., Fukuhara, C., Onosaka, S. and Tanaka, K. (1984). Metabolism of potassium bromate in rats. 1. In vivo studies. Chemosphere, 13: 1207–1212.
Geter, D.R., Ward, W.O., Knapp, G.W., DeAngelo, A.B., Rubis, J.A., Owen, R.D., Allen, J.W. and Delker, D.A. (2006). Kidney toxicogenomics of chronic potassium bromate exposure in F344 male rats. Transl. Oncogenomics, 1: 33–52.
Gillogly, T., Najm, I., Minear, R., Mariñas, B., Urban, M., Kim, J.H., Echigo, S., Amy, G., Douville, C., Daw, B., Andrews, R., Hofmann, R. and Croué, J.-P. (2001). Bromate formation and control during ozonation of low bromide waters. AWWA Research Foundation and American Water Works Association, Denver, Colorado.
Glaze, W.H. and Weinberg, H.S. (1993). Identification and occurrence of ozonation by-products in drinking water. AWWA Research Foundation and American Water Works Association, Denver, Colorado
Glaze, W.H., Weinberg, H.S. and Cavanagh, J.E. (1993). Evaluating the formation of brominated DBPs during ozonation. J. Am. Water Works Assoc., 85(1): 96–103.
GLUMRB (2012). Recommended standards for water works. Health Education Services, Great Lakes – Upper Mississippi River Board of State and Provincial Public Health and Environmental Managers, Albany, New York.
Gordon, G. and Emmert, G.L. (1996). Bromate ion formation in water when chlorine dioxide is photolyzed in the presence of bromide ion. In: Water Quality Technology Conference and Exposition (WQTC) Conference Proceedings. American Water Works Association, Denver, Colorado.
Grefte, A., Ross, P.S., Dignum, M., Cornelissen, E.R. and Rietveld, L.C. (2013). The influence of the removal of specific NOM compounds by anion exchange on ozone demand, disinfection capacity, and bromate formation. Ozone Sci. Eng., 35(4): 283–294.
Greune, A. and Knappe, D. (2014). Uncovering the trends of increasing bromide in North Carolina’s surface waters: sources and impacts on brominated DBPs throughout the state. ACE Conference Proceedings. American Water Works Association, Denver, Colorado.
Guo, T.L., McCay, J.A., Karrow, N.A., Brown, R.D., Musgrove, D.L., Luebke, R.W., Germolec, D.R. and White, K.L., Jr. (2001). Immunotoxicity of sodium bromate in female B6C3F1 mice: a 28-day drinking water study. Drug Chem. Toxicol., 24(2): 129–149.
Haag, W.R. and Hoigné, J. (1983). Ozonation of bromide-containing waters: kinetics of formation of hypobromous acid and bromide. Environ. Sci. Technol., 17(5): 261–267.
Haag, W.R., Hoigné, J. and Bader, H. (1984). Improved ammonia oxidation by ozone in the presence of bromide ion during water treatment. Water Res., 18(9): 1125–1128.
Haidri, S.F., Adu-Sarkodie, K. and Mariñas, B.J. (2003). Strategies for bromate control in drinking water ozonation. In: Water Quality Technology Conference and Exposition (WQTC) Conference Proceedings. American Water Works Association, Denver, Colorado.
Hara, K., Osada, K., Matsunaga, K., Iwasaka, Y., Shibata, T. and Furuya, K. (2002). Atmospheric inorganic chlorine and bromine species in Arctic boundary layer of the winter/spring. J. Geophys. Res., 107(D18): 4361.
Harrington-Brock, K., Collard, D.D. and Chen, T. (2003). Bromate induces loss of heterozygosity in the thymidine kinase gene of L5178Y/Tk+/−-3.7.2C mouse lymphoma cells. Mutat. Res., 537(1): 21–28.
Harrison, C., Le Gouellec, Y., Cheng, R. and Childress, A. (2007). Bench-scale testing of nanofiltration for seawater desalination. J. Environ. Eng., 133(11): 1004–1014.
Haught, R. and Fabris, M. (2002). Inorganic monitors. In: Online Monitoring for Drinking Water Utilities. E. Hargesheimer, O. Conio and J. Papovicova (eds.). Awwa Research Foundation, Denver, Colorado. pp. 133–162.
Hayashi, M., Kishi, M., Sofuni, T. and Ishidate, M., Jr. (1988). Micronucleus tests in mice on 39 food additives and eight miscellaneous chemicals. Food Chem. Toxicol., 26(6): 487–500.
Hayashi, M., Sutou, S., Shimada, H., Sato, S., Sasaki, Y.F. and Wakata, A. (1989). Difference between intraperitoneal and oral gavage application in the micronucleus test. The 3rd collaborative study by CSGMT/JEMS.MMS. Collaborative Study Group for the Micronucleus Test/Mammalian Mutagenesis Study Group of the Environmental Mutagen Society of Japan. Mutat. Res., 223(4): 329–344.
Health Canada (1995). A national survey of chlorinated disinfection by-products in Canadian drinking water. Environmental Health Directorate, Health Protection Branch, Health Canada, Ottawa, Ontario.
Health Canada (2006). Guidelines for Canadian drinking water quality: Guideline technical document—Trihalomethanes. Water Quality and Health Bureau, Healthy Environments and Consumer Safety Branch, Health Canada, Ottawa, Ontario.
Health Canada (2008). Guidelines for Canadian drinking water quality: Guideline technical document—Haloacetic acids. Water, Air and Climate Change Bureau, Healthy Environments and Consumer Safety Branch, Health Canada, Ottawa, Ontario.
Health Canada (2011). Guidelines for Canadian drinking water quality: Guideline technical document—N-Nitrosodimethylamine (NDMA). Water, Air and Climate Change Bureau, Healthy Environments and Consumer Safety Branch, Health Canada, Ottawa, Ontario.
Health Canada (2014a). Personal communication with Anca-Maria Tugulea.
Health Canada (2014b). Mode of action and human relevance analysis for bromate — Internal report. Available upon request.
Heeb, M.B., Criquet, J., Zimmermann-Steffens, S. and von Gunten, U. (2014). Oxidative treatment of bromide-containing water: formation of bromine and its reactions with inorganic and organic compounds—A critical review. Water Res., 48(1): 15–42.
Hem, J.D. (1985). Study and interpretation of the chemical characteristics of natural water. 3rd edition. U.S. Geological Survey Water-Supply Paper 2254.
Hofmann, R. (2014). Personal communication. University of Toronto, Toronto, Ontario.
Hofmann, R. and Andrews, R. (2001). Ammoniacal bromamines: a review of their influence on bromate formation during ozonation. Water Res., 35(3): 599–604.
Hofmann, R. and Andrews, R. (2006). Impact of H2O2 and (bi)carbonate alkalinity on ammonia’s inhibition of bromate formation. Water Res., 40(18): 3343–3348.
Hofmann, R. and Andrews, R. (2007). Potential side effects of using ammonia to inhibit bromate formation during ozonation of drinking water. J. Environ. Eng. Sci., 6: 739–743.
Hofmann, R., Larcher, S. and Andrews, R. (2002). Effect of several natural water constituents on bromate formation during ozonation. Water Sci. Technol., 2(5–6): 501–507.
Hoigné, J. and Bader, H. (1994). Kinetics of reactions of chlorine dioxide (OClO) in water—I. Rate constants for inorganic and organic compounds. Water Res., 28(1): 45–55.
Howe, E., Idica, E., Venezia, T. and Trussell, R. (2013). Use of the solution ozone test to estimate ozone demand and ozone dose for treating Sacramento River water. In: Water Quality Technology Conference and Exposition (WQTC) Conference Proceedings. American Water Works Association, Denver, Colorado.
Huang, W., Peng, H., Peng, M. and Chen, L. (2004). Removal of bromate and assimilable organic carbon from drinking water using granular activated carbon. Water Sci. Technol., 50(8): 73–80.
Huck, P. and Sozański, M. (2011). 3.16 – Chemical basis for water technology. In: Treatise on water science. P. Wilderer (ed.). Oxford: Elsevier. pp. 429–469.
Hulsey, R.A., Neemann, J.J., Zegers, R.E. and Rexing, D.J. (2003). Water treatment using ozone and having a reduced likelihood of bromate formation from bromides found in the water. United States Patent, Patent No.: US 6,602,426 B2. Available at: www.freepatentsonline.com/6602426.html.
IARC (1999). Potassium bromate. International Agency for Research on Cancer. IARC Monogr. Eval. Carcinog. Risks Hum., 73: 481–496. Available at: http://monographs.iarc.fr/ENG/Monographs/vol73/mono73-22.pdf
Ikehata, K. and Gamal El-Din, M. (2006). Aqueous pesticide degradation by hydrogen peroxide/ultraviolet irradiation and Fenton-type advanced oxidation processes: a review. J. Environ. Eng. Sci., 5: 81–135.
Ikehata, K., Wang, L., Nessl, M.B., Komor, A.T., Cooper, W.J. and McVicker, R.R. (2013). Effect of ammonia and chloramine pretreatment during the ozonation of a colored groundwater with elevated bromide. Ozone Sci. Eng., 35(6): 438–447.
IPCS (2007). Part 1: IPCS framework for analysing the relevance of a cancer mode of action for humans and case-studies. Part 2: IPCS framework for analysing the relevance of a non-cancer mode of action for humans. International Programme on Chemical Safety, World Health Organization, Geneva, Switzerland (Harmonization Project Document No. 4; http://monographs.iarc.fr/ENG/Monographs/vol73/mono73-22.pdf).
Ishidate, M., Jr., Sofuni, T., Yoshikawa, K., Hayashi, M., Nohmi, T., Sawada, M. and Matsuoka, A. (1984). Primary mutagenicity screening of food additives currently used in Japan. Food Chem. Toxicol., 22(8): 623–636.
Kawachi, T., Yahagi, T., Kada, T., Tazima, Y., Ishidate, M., Sasaki, M. and Sugiyama, T. (1980). Cooperative programme on short-term assays for carcinogenicity in Japan. IARC Sci. Publ., 27: 323–330 [cited in Moore and Chen, 2006].
Kawana, K., Nakaoka, T., Horiguchi, Y., Watanabe, S. and Kawauchi, S. (1991). [Toxicological study of potassium bromate: 2. Hepatotoxic effects of the potassium bromate and benzo[a]pyrene simultaneous administration in mice.] Jpn. J. Toxicol. Environ. Health, 37(4): 266–275 (in Japanese) [cited in Environment Canada and Health Canada, 2010].
Kawanishi, S. and Murata, M. (2006). Mechanism of DNA damage induced by bromate differs from general types of oxidative stress. Toxicology, 221(2–3): 172–178.
Kaya, F.F. and Topaktaş, M. (2007). Genotoxic effects of potassium bromate on human peripheral lymphocytes in vitro. Mutat. Res., 626(1–2): 48–52.
Keith, J.D., Pacey, G.E., Cotruvo, J.A. and Gordon, G. (2006). Experimental results from the reaction of bromate ion with synthetic and real gastric juices. Toxicology, 221(2–3): 225–228.
Kimbrough, E., Boulos, L., Surawanvijit, S., Zacheis, A. and Cohen, Y. (2013). Pilot-testing of electrolysis for bromide removal from drinking water. J. Am. Water Works Assoc., 105(6): E299–E309.
Kirisits, M.J., Snoeyink, V.L. and Kruithof, J.C. (2000). The reduction of bromate by granular activated carbon. Water Res., 34(17): 4250–4260.
Kirisits, M., Snoeyink, V., Inan, H., Chee-Sanford, J., Raskin, L. and Brown, J. (2001). Water quality factors affecting bromate reduction in biologically active carbon filters. Water Res., 35(4): 891–900.
Kolisetty, N., Bull, R.J., Muralidhara, S., Costyn, L.J., Delker, D.A., Guo, Z., Cotruvo, J.A., Fisher, J.W. and Cummings, B.S. (2013a). Association of brominated proteins and changes in protein expression in the rat kidney with subcarcinogenic to carcinogenic doses of bromate. Toxicol. Appl. Pharmacol., 272(2): 391–398.
Kolisetty, N., Delker, D.A., Muralidhara, S., Bull, R.J., Cotruvo, J.A., Fisher, J.W. and Cummings, B.S. (2013b). Changes in mRNA and protein expression in the renal cortex of male and female F344 rats treated with bromate. Arch. Toxicol., 87: 1911–1925.
Krasner, S.W. and Yates, R.S. (1996). Use of ferrous and ferric coagulants to reduce bromate and particulate levels. In: Proceedings of the American Water Works Association Annual Conference, Toronto, Ontario. American Water Works Association, Denver, Colorado. pp. 287–301.
Krasner, S.W., McGuire, M.J., Jacangelo, J.G., Patania, N.L., Reagan, K.M. and Aieta, E.M. (1989). The occurrence of disinfection by-products in US drinking water. J. Am. Water Works Assoc., 81(8): 41–53.
Krasner, S.W., Gramith, J.T., Means, E.G., Patania, N.L., Najm, I.N. and Aieta, E.M. (1991). Formation and control of brominated ozone by-products. In: Proceedings of the American Water Works Association Annual Conference, Philadelphia, PA. American Water Works Association, Denver, Colorado. pp. 945–971.
Krasner, S.W., Glaze, W.H., Weinberg, H.S., Daniel, P.A. and Najm, I.N. (1993). Formation and control of bromate during ozonation of waters containing bromide. J. Am. Water Works Assoc., 85(1): 73–81.
Krasner, S.W., Sclimenti, M.J. and Means, E.G. (1994). Quality degradation: implications for DBP formation. J. Am. Water Works Assoc., 86(6): 34–47.
Krishnan, K. and Carrier, R. (2013). The use of exposure source allocation factor in the risk assessment of drinking-water contaminants. J. Toxicol. Environ. Health B Crit. Rev., 16(1): 39–51.
Kruithof, J.C. and Meijers, R.T. (1995). Bromate formation by ozonation and advanced oxidation and potential options in drinking water treatment. Water Supply, 13(2): 93–103.
Kurata, Y., Diwan, B.A. and Ward, J.M. (1992). Lack of renal tumour–initiating activity of a single dose of potassium bromate, a genotoxic renal carcinogen in male F344/NCr rats. Food Chem. Toxicol., 30(3): 251–259.
Kurokawa, Y., Hayashi, Y., Maekawa, A., Takahashi, M., Kokubo, T. and Odashima, S. (1983). Carcinogenicity of potassium bromate administered orally to F344 rats. J. Natl. Cancer Inst., 71(5): 965–972.
Kurokawa, Y., Aoki, S., Imazawa, T., Hayashi, Y., Matsushima, Y. and Takamura, N. (1985). Dose-related enhancing effect of potassium bromate on renal tumorigenesis in rats initiated with N-ethyl-N-hydroxyethyl-nitrosamine. Jpn. J. Cancer Res. (Gann), 76: 583–589.
Kurokawa, Y., Aoki, S., Matsushima, Y., Takamura, N., Imazawa, T. and Hayashi, Y. (1986a). Dose–response studies on the carcinogenicity of potassium bromate in F344 rats after long-term oral administration. J. Natl. Cancer Inst., 77(4): 977–982.
Kurokawa, Y., Takayama, S., Konishi, Y., Hiasa, Y., Asahina, S., Takahashi, M., Maekawa, A. and Hayashi, Y. (1986b). Long-term in vivo carcinogenicity tests of potassium bromate, sodium hypochlorite, and sodium chlorite conducted in Japan. Environ. Health Perspect., 69: 221–235.
Kurokawa, Y., Matsushima, Y., Takamura, N., Imazawa, T. and Hayashi, Y. (1987). Relationship between the duration of treatment and the incidence of renal cell tumors in male F344 rats administered potassium bromate. Jpn. J. Cancer Res., 78(4): 358–364.
Kurokawa, Y., Maekawa, A., Takahashi, M. and Hayashi, Y. (1990). Toxicity and carcinogenicity of potassium bromate—a new renal carcinogen. Environ. Health Perspect., 87: 309–335.
Langlois, B., Reckhow, D.A. and Brink, D.R. (eds.) (1991). Ozone in water treatment: application and engineering. A cooperative research report. American Water Works Association Research Foundation and Compagnie générale des eaux; CRC Press, Lewis Publishers, Boca Raton, FL.
Larocque, R. (1999). Ozone applications in Canada: a state of the art review. Ozone Sci. Eng., 21: 119–125.
LeChevallier, M.W., Lowry, C.D., Lee, R.G. and Gibbon, D.L. (1993). Examining the relationship between iron corrosion and the disinfection of biofilm bacteria. J. Am. Water Works Assoc., 85(7): 111–123.
Lefebvre, E., Racaud, P., Parpaillon, T. and Deguin, A. (1995). Results of bromide and bromate monitoring at several water treatment plants. Ozone Sci. Eng., 17: 311–327.
Legube, B. (1996). A survey of bromate ion in European drinking water. Ozone Sci. Eng., 18: 325–348.
Legube, B., Parinet, B., Gelinet, K., Berne, F. and Croué, J.-P. (2004). Modeling of bromate formation by ozonation of surface waters in drinking water treatment. Water Res., 38(8): 2185–2195.
Liu, C., von Gunten, U. and Croué, J.-P. (2012). Enhanced bromate formation during chlorination of bromide-containing waters in the presence of CuO: catalytic disproportionation of hypobromous acid. Environ. Sci. Technol., 46(20): 11054–11061.
Liu, C., von Gunten, U. and Croué, J.-P. (2013). Chlorination of bromide-containing waters: enhanced bromate formation in the presence of synthetic metal oxides and deposits formed in drinking water distribution systems. Water Res., 47(14): 5307–5315.
Loveland, J.P., Means, E.G., III, and Chao, P.-F. (2004). Advanced techniques for bromate reduction: pilot testing chlorine dioxide, chloramination and MIEX treatment with ozonation. In: Water Quality Technology Conference and Exposition (WQTC) Conference Proceedings. American Water Works Association, Denver, CO.
Luan, Y., Suzuki, T., Palanisamy, R., Takashima, Y., Sakamoto, H., Sakuraba, M., Koizumi, T., Saito, M., Matsufuji, H., Yamagata, K., Yamaguchi, T., Hayashi, M. and Honma, M. (2007). Potassium bromate treatment predominantly causes large deletions, but not GC>TA transversion in human cells. Mutat. Res., 619(1–2): 113–123.
Manitoba Conservation and Water Stewardship (2011). Personal communication with K. Philip.
Matsushima, Y., Takamura, N., Imazawa, T., Kurokawa, Y. and Hayashi, Y. (1986). Lack of carcinogenicity of potassium bromate after subcutaneous injection to newborn mice and newborn rats. Sci. Rep. Res. Inst. Tohoku Univ. Med., 33(1–4): 22–26.
Maxxam Analytics (2014). Personal communication with H. Varma.
McDorman, K.S., Pachkowski, B.F., Nakamura, J., Wolf, D.C. and Swenberg, J.A. (2005). Oxidative DNA damage from potassium bromate exposure in Long-Evans rats is not enhanced by a mixture of drinking water disinfection by-products. Chem. Biol. Interact., 152: 107–117.
McTigue, N.E., Cornwell, D.A., Graf, K. and Brown, R. (2014). Occurrence and consequences of increased bromide in drinking water sources. J. Am. Water Works Assoc., 106(11): E492–E508.
Meek, M.E., Bucher, J.R., Cohen, S.M., Dellarco, V., Hill, R.N., Lehman-McKeeman, L.D., Longfellow, D.G., Pastoor, T., Seed, J. and Patton, D.E. (2003). A framework for human relevance analysis of information on carcinogenic modes of action. Crit. Rev. Toxicol., 33(6): 591–653.
Meek, M.E., Boobis, A., Cote, I., Dellarco, V., Fotakis, G., Munn, S., Seed, J. and Vickers, C. (2014a). New developments in the evolution and application of the WHO/IPCS framework on mode of action/species concordance analysis. J. Appl. Toxicol., 34(1): 1–18.
Meek, M.E., Palermo, C.M., Bachman, A.N., North, C.M. and Lewis, R.J. (2014b). Mode of action human relevance (species concordance) framework: evolution of the Bradford Hill considerations and comparative analysis of weight of evidence. J. Appl. Toxicol., 34: 595–606.
Merrill EA, Clewell RA, Robinson PJ, Jarabek AM, Gearhart JM, Sterner TR, Fisher JW. (2005). PBPK model for radioactive iodide and perchlorate kinetics and perchlorate-induced inhibition of iodide uptake in humans. Toxicol Sci. 83(1):25-43.
Ministère du Développement durable, de l’Environnement et des Parcs du Québec (2011). Personal communication with C. Robert.
Ministère du Développement durable, de l’Environnement et de la Lutte contre les changements climatiques du Québec (2016). Personal communication with A. Bolduc.
Moore, M.M. and Chen, T. (2006). Mutagenicity of bromate: implications for cancer risk assessment. Toxicology, 221(2–3): 190–196.
Nakajima, M., Kitazawa, M., Oba, K., Kitagawa, Y. and Toyoda, Y. (1989). Effect of route of administration in the micronucleus test with potassium bromate. Mutat. Res., 223(4): 399–402.
Naumov, S. and von Sonntag, C. (2008). The reactions of bromide with ozone towards bromate and the hypobromite puzzle: a density functional theory study. Ozone Sci. Eng., 30: 339–343.
Neemann, J., Hulsey, R., Rexing, D. and Wert, E. (2004). Controlling bromate formation during ozonation with chlorine and ammonia. J. Am. Water Works Assoc., 96(2): 26–28.
New Brunswick Department of Health (2011). Personal communication with K. White.
Newfoundland and Labrador Department of Environment and Conservation (2011). Personal communication with H. Khan.
NHMRC (2011). Australian drinking water guidelines. National Health and Medical Research Council. Available at: www.nhmrc.gov.au/guidelines/publications/eh52
Nova Scotia Environment (2011). Personal communication with C. Mosher.
NSF/ANSI (2013). Standard 60 — Drinking water treatment chemicals – health effects. NSF International, Ann Arbor, Michigan.
NSF/ANSI (2016). Standard 60 — Drinking water treatment chemicals – health effects.. NSF International, Ann Arbor, Michigan.
NSF (2012). Occurrence of bromate in hypochlorite: summary of NSF testing experience on certified calcium hypochlorite and sodium hypochlorite under NSF/ANSI Standard 60 (2004-2011). NSF International, Ann Arbor, Michigan.
NTP (1996). National Toxicology Program (US). Sodium bromate: short term reproductive and developmental toxicity study when administered to Sprague-Dawley rats in the drinking water. Research Triangle Park (NC): US Department of Health and Human Services, National Toxicology Program. Report No.: NTP-RDGT-94-007. NIEHS Publication No. NIEHS-N01-ES-15323. Available at: http://ntp.niehs.nih.gov/index.cfm?objectid=070EAFCC-E977-3861-AC7327B175DE633C
NTP (2001). Sodium bromate: reproductive assessment by continuous breeding when administered to Sprague-Dawley rats in drinking water. Draft final report. Prepared for the National Toxicology Program by TherImmune Research Corporation, Gaithersburg, MD (Study No. 7244-209) [cited in NTP, 2007].
NTP (2007). NTP report on the toxicology studies of sodium bromate (CAS NO. 7789-38-0) in genetically modified (FVB Tg.AC hemizygous) mice (dermal and drinking water studies) and carcinogenicity studies of sodium bromate in genetically modified B6.129-Trp53tm1Brd (N5) haploinsufficient] mice (drinking water studies). National Toxicology Program, National Institutes of Health, Public Health Service, U.S. Department of Health and Human Services, Research Triangle Park, NC (NTP GMM 6; NIH Publication No. 07-4423). Available at: http://ntp.niehs.nih.gov/ntp/htdocs/gmm_rpts/gmm6.pdf
OEHHA (2009). Public health goals for chemicals in drinking water bromate. Office of Environmental Health Hazard Assessment, California Environmental Protection Agency, Sacramento, California.
Ontario Ministry of the Environment (2009). Ontario Drinking Water Surveillance Program data. Available at: www.ontario.ca/environment-and-energy/drinking-water-surveillance-program-dwsp-data
Ontario Ministry of the Environment (2011). Personal communication with S. Deshpande.
Owen, D.M., Amy, G.L. and Chowdhury, Z.K. (1993). Characterization of natural organic matter and its relationship to treatability. AWWA Research Foundation and American Water Works Association, Denver, Colorado.
Peldszus, S., Andrews, S.A., Souza, R., Smith, F., Douglas, I., Bolton, J. and Huck, P.M. (2004). Effect of medium-pressure UV irradiation on bromate concentrations in drinking water, a pilot-scale study. Water Res., 38: 211–217.
Peyton, G.R., Bell, O.J., Girin, E., LeFaivre, M.H. and Sanders, J. (1998). Effect of bicarbonate alkalinity on performance of advanced oxidation processes. AWWA Research Foundation and American Water Works Association, Denver, Colorado.
Pinkernell, U. and von Gunten, U. (2001). Bromate minimization during ozonation: mechanistic considerations. Environ. Sci. Technol., 35(12): 2525–2531.
Platel, A., Nesslany, F., Gervais, V. and Marzin, D. (2009). Study of oxidative DNA damage in TK6 human lymphoblastoid cells by use of the in vitro micronucleus test: determination of no-observed-effect levels. Mutat. Res., 678(1): 30–37.
Platel, A., Nesslany, F., Gervais, V., Claude, N. and Marzin, D. (2011). Study of oxidative DNA damage in TK6 human lymphoblastoid cells by use of the thymidine kinase gene-mutation assay and the in vitro modified comet assay: determination of no-observed-genotoxic-effect-levels. Mutat. Res., 726(2): 151–159.
Plewa, M.J., Kargalioglu, Y., Vankerk, D., Minear, R.A. and Wagner, E.D. (2002). Mammalian cell cytotoxicity and genotoxicity analysis of drinking water disinfection by-products. Environ. Mol. Mutagen., 40(2): 134–142.
Poul, J.M., Huet, S., Godard, T. and Sanders, P. (2004). Lack of genotoxicity of potassium iodate in the alkaline comet assay and in the cytokinesis-block micronucleus test. Comparison to potassium bromate. Food Chem. Toxicol., 42(2): 203–209.
Priestley, C.C., Green, R.M., Fellows, M.D., Doherty, A.T., Hodges, N.J. and O’Donovan, M.R. (2010). Anomalous genotoxic responses induced in mouse lymphoma L5178Y cells by potassium bromate. Toxicology, 267(1–3): 45–53.
Rakness, K.L., DeMers, L.D. and Blank, B.D. (1996). Ozone system fundamentals for drinking water treatment. Opflow, 22(7): 1, 4–5.
Rakness, K.L. (2005). Ozone in drinking water treatment: process design, operation, and optimization. American Water Works Association, Denver, Colorado.
Regli, S., Chen, J., Messner, M., Elovitz, M.S., Letkiewicz, F.J., Pegram, R.A., Pepping, T.J., Richardson, S.D. and Wright, J.M. (2015). Estimating potential increased bladder cancer risk due to increased bromide concentrations in sources of disinfected drinking waters. Environ. Sci. Technol., 49(22): 13094–13102.
Richardson, S.D., Fasano, F., Ellington, J.J., Crumley, F.G., Buettner, K.M., Evans, J.J., Blount, B.C., Silva, L.K., Waite, T.J., Luther, G.W., McKague, A.B., Miltner, R.J., Wagner, E.D. and Plewa, M.J. (2008). Occurrence and mammalian cell toxicity of iodinated disinfection byproducts in drinking water. Environ. Sci. Technol., 42(22): 8330–8338.
Robbiano, L., Carrozzino, R., Puglia, C.P., Corbu, C. and Brambilla, G. (1999). Correlation between induction of DNA fragmentation and micronuclei formation in kidney cells from rats and humans and tissue-specific carcinogenic activity. Toxicol. Appl. Pharmacol., 161(2): 153–159.
Sai, K., Hayashi, M., Takagi, A., Hasegawa, R., Sofuni, T. and Kurokawa, Y. (1992a). Effects of antioxidants on induction of micronuclei in rat peripheral blood reticulocytes by potassium bromate. Mutat. Res., 269(1): 113–118.
Sai, K., Umemura, T., Takagi, A., Hasegawa, R. and Kurokawa, Y. (1992b). The protective role of glutathione, cysteine and vitamin C against oxidative DNA damage induced in rat kidney by potassium bromate. Jpn. J. Cancer Res., 83: 45–51.
Saskatchewan Water Security Agency (2016). Personal communication with S. Ferris.
SCC (2016). Directory of accredited product, process and service certification bodies. Standards Council of Canada, Ottawa, Ontario. Available at: www.scc.ca/en/accreditation/product-process-and-service-certification/directory-of-accredited-clients
SGS Environmental Services (2014). Personal communication with D. Griffin.
Shen, E., Jerrett, R., Paradis, N. and Muylwyk, Q. (2015). Oxidation-reduction potential (ORP) measurement for chemical dosing optimization at water treatment plants. In: Water Quality Technology Conference and Exposition (WQTC) Conference Proceedings. American Water Works Association, Denver, Colorado.
Siddiqui, M.S. and Amy, G.L. (1993). Factors affecting DBP formation during ozone–bromide reactions. J. Am. Water Works Assoc., 85(1): 63–72.
Siddiqui, M., Amy, G.L., Ozekin, K., Zhai, W. and Westerhoff, P. (1994). Alternative strategies for removing bromate. J. Am. Water Works Assoc., 86(10): 81–96.
Siddiqui, M.S., Amy, G.L. and Rice, R.G. (1995). Bromate ion formation: a critical review. J. Am. Water Works Assoc., 87(10): 58–70.
Smeets, P.W.M.H., Medema, G.J. and Van Dijk, J.C. (2009). The Dutch secret: how to provide safe drinking water without chlorine in the Netherlands. Drink. Water Eng. Sci., 2(1):1–14.
Snyder, S., Vanderford, B., Snyder, E. and Rexing, D. (2004). Trace analysis of perchlorate, bromate, chlorate, and iodate in natural and bottled waters. In: Water Quality Technology Conference and Exposition (WQTC) Conference Proceedings. American Water Works Association, Denver, Colorado.
Snyder, S.A., Stanford, B.D., Pisarenko, A.N., Gordon, G. and Asami, M. (2009). Hypochlorite—An assessment of factors that influence the formation of perchlorate and other contaminants. American Water Works Association, Denver, Colorado.
Song, R., Donohoe, C., Minear, R., Westerhoff, P., Ozekin, K. and Amy, G. (1996). Empirical modeling of bromate formation during ozonation. Water Res., 30(5): 1161–1168.
Song, R., Westerhoff, P., Minear, R. and Amy, G. (1997). Bromate minimization during ozonation. J. Am. Water Works Assoc., 89(6): 69–78.
Speit, G., Haupter, S., Schütz, P. and Kreis, P. (1999). Comparative evaluation of the genotoxic properties of potassium bromate and potassium superoxide in V79 Chinese hamster cells. Mutat. Res., 439(2): 213–221.
Speitel, G.E., Wanielista, M.M., Symons, J.M. and Davis, J.M. (1999). Advanced oxidation and biodegradation processes for the destruction of TOC and DBP precursors. AWWA Research Foundation and American Water Works Association, Denver, Colorado.
SRC Environmental Analytical Laboratories (2014). Personal communication with R. Ortmann.
Staehelin, J. and Hoigné, J. (1982). Decomposition of ozone in water: rate of initiation by hydroxide ions and hydrogen peroxide. Environ. Sci. Technol., 16(10): 676–681.
Stanford, B.D., Pisarenko, A.N., Snyder, S.A. and Gordon, G. (2011). Perchlorate, bromate and chlorate in hypochlorite solutions: guidelines for utilities. J. Am. Water Works Assoc., 103(6): 71–83.
Stanford, B.D., Pisarenko, A.N., Dryer, D.J., Zeigler-Holady, J.C., Gamage, S., Quiñones, O., Vanderford, B.J. and Dickenson, E.R.V. (2013). Chlorate, perchlorate, and bromate in onsite-generated hypochlorite systems. J. Am. Water Works Assoc., 105(3): E92–E102.
States, S., Cyprych, G., Stoner, M., Wydra, F., Kuchta, J., Monnell, J. and Casson, L. (2013). Marcellus shale drilling and brominated THMs in Pittsburge, Pa., drinking water. J. Am. Water Works Assoc., 105(8): E432–E448.
Suzuta, K., Ogawa, S., Takeda, Y., Kaneyama, K. and Arai, K. (2012). Intermolecular disulfide cross-linked structural change induced by permanent wave treatment of human hair with thioglycolic acid. J. Cosmet. Sci., 63(3): 177–196.
Symons, J.M. and Zheng, M.C.H. (1997). Does hydroxyl radical oxidize bromide to bromate? J. Am. Water Works Assoc., 89(6): 106–109.
Symons, J.M., Krasner, S.W., Simms, LA. and Sclimenti, M. (1993). Measurement of THM and precursor concentrations revisited: The effect of bromide ion. J. Am. Water Works Assoc., 85(1): 51–62.
Symons, J.M., Bradley, L.C., Jr., and Cleveland, T.C. (2000). The drinking water dictionary. American Water Works Association, Denver, Colorado.
Takamura, N., Kurokawa, Y., Matsushima, Y., Imazawa, T., Onodera, H. and Hayashi, Y. (1985). Long-term oral administration of potassium bromate in male Syrian golden hamsters. Sci. Rep. Res. Inst. Tohoku Univ. Med., 32(1–4): 43–46 [cited in DeAngelo et al., 1998].
Thompson, C.M. and Drago, J.A. (2015). North American installed water treatment ozone systems. J. Am. Water Works Assoc., 107(10): 45–55.
Umemura, T. and Kurokawa, Y. (2006). Etiology of bromate-induced cancer and possible modes of action—studies in Japan. Toxicology, 221(2–3): 154–157.
Umemura, T., Sai, K., Takagi, A., Ryuichi, H. and Kurokawa, Y. (1993). A possible role for cell proliferation in potassium bromate (KBrO3) carcinogenesis. J. Cancer Res. Clin. Oncol., 119: 463–469.
Umemura, T., Sai, K., Takagi, A., Hasegawa, R. and Kurokawa, Y. (1995). A possible role for oxidative stress in potassium bromate (KBrO3) carcinogenesis. Carcinogenesis, 16(3): 593–597.
Umemura, T., Takagi, A., Sai, K., Hasegawa, R. and Kurokawa, Y. (1998). Oxidative DNA damage and cell proliferation in kidneys of male and female rats during 13-weeks exposure to potassium bromate (KBrO3). Arch. Toxicol., 72(5): 264–269.
Umemura, T., Kitamura, Y., Kanki, K., Maruyama, S., Okazaki, K., Imazawa, T., Nishimura, T., Hasegawa, R., Nishikawa, A. and Hirose, M. (2004). Dose-related changes of oxidative stress and cell proliferation in kidneys of male and female F344 rats exposed to potassium bromate. Cancer Sci., 95(5): 393–398.
Umemura, T., Kanki, K., Kuroiwa, Y., Ishii, Y., Okano, K., Nohmi, T., Nishikawa, A. and Hirose, M. (2006). In vivo mutagenicity and initiation following oxidative DNA lesion in the kidneys of rats given potassium bromate. Cancer Sci., 97(9): 829–835.
Umemura, T., Tasaki, M., Kijima, A., Okamura, T., Inoue, T., Ishii, Y., Suzuki, Y., Masui, N., Nohmi, T. and Nishikawa, A. (2009). Possible participation of oxidative stress in causation of cell proliferation and in vivo mutagenicity in kidneys of gpt delta rats treated with potassium bromate. Toxicology, 257(1–2): 46–52.
Underwriters Laboratories LLC (2012). Report on bromate in hypochlorite samples evaluated in accordance with NSF/ANSI 60—Drinking Water Treatment Chemicals—Health Effects: Summary of Underwriters Laboratories test results from 9/13/2006 to 12/31/2011. Underwriters Laboratories LLC, Northbrook, IL.
U.S. EPA (1997a). Method 300.1. Determination of inorganic anions in drinking water by ion chromatography. Revision 1.0. National Exposure Research Laboratory, Office of Research and Development, U.S. Environmental Protection Agency, Cincinnati, Ohio. (EPA/600/R-98-118).
U.S. EPA (1997b). Method 321.8. Determination of bromate in drinking waters by ion chromatography inductively coupled plasma – mass spectrometry. Revision 1.0. National Exposure Research Laboratory, Office of Research and Development, U.S. Environmental Protection Agency, Cincinnati, Ohio.
U.S. EPA (1998). Environmental Protection Agency, 40 CFR Parts 9, 141, and 142. National Primary Drinking Water Regulations: Disinfectants and Disinfection Byproducts; Final rule. Federal Register, 63(241): 69390-69476. Available at: www.gpo.gov/fdsys/pkg/FR-1998-12-16/pdf/98-32887.pdf.
U.S. EPA (2001a). Toxicological review of bromate. U.S. Environmental Protection Agency, Washington, DC (EPA/635/R-01-002).
U.S. EPA (2001b). Method 317.0. Determination of inorganic oxyhalide disinfection by-products in drinking water using ion chromatography with the addition of a postcolumn reagent for trace bromate analysis. Revision 2.0. Technical Support Center, Office of Ground Water and Drinking Water, U.S. Environmental Protection Agency, Cincinnati, Ohio (EPA 815-B-01-001).
U.S. EPA (2002). Method 326.0. Determination of inorganic oxyhalide disinfection by-products in drinking water using ion chromatography incorporating the addition of a suppressed acidified postcolumn reagent for trace bromate analysis. Revision 1.0. Technical Support Center, Office of Ground Water and Drinking Water, U.S. Environmental Protection Agency, Cincinnati, Ohio (EPA 815-R-03-007).
U.S. EPA (2003). Environmental Protection Agency, 40 CFR Parts 141, 142 and 143. National Primary Drinking Water Regulations: Stage 2 Disinfectants and Disinfection Byproducts Rule; National Primary and Secondary Drinking Water Regulations: Approval of Analytical Methods for Chemical Contaminants; Proposed rule. Federal Register, 68(159): 49548-49681. Available at: www.gpo.gov/fdsys/pkg/FR-2003-08-18/pdf/03-18149.pdf.
U.S. EPA (2006). National Primary Drinking Water Regulations: Stage 2 Disinfectants and Disinfection Byproducts Rule; Final rule. U.S. Environmental Protection Agency. 40 CFR Parts 9, 141, and 142. Fed. Regist., 71(2): 388–493 Available at: www.gpo.gov/fdsys/pkg/FR-2006-01-04/pdf/06-3.pdf
U.S. EPA (2009a). Method 302.0. Determination of bromate in drinking water using two-dimensional ion chromatography with suppressed conductivity detection. Technical Support Center, Office of Ground Water and Drinking Water, U.S. Environmental Protection Agency, Cincinnati, Ohio (EPA 815-B-09-014).
U.S. EPA (2009b). Method 557. Determination of haloacetic acids, bromate, and dalapon in drinking water by ion chromatography electrospray ionization tandem mass spectrometry (IC-ESI-MS/MS). Version 1.0. Technical Support Center, Office of Ground Water and Drinking Water, U.S. Environmental Protection Agency, Cincinnati, Ohio (EPA 815-B-09-012).
U.S. EPA (2009c). Analytical feasibility support document for the second six-year review of existing National Primary Drinking Water Regulations. Office of Water, U.S. Environmental Protection Agency, Cincinnati, Ohio (EPA 815-B-09-003).
U.S. EPA (2009d). MSW time to tumor and supporting documentation. U.S. Environmental Protection Agency, Washington, DC.
U.S. EPA (2013). Benchmark Dose Software (BMDS) Version 2.2 R65 [Build: 04/01/2013]. National Center for Environmental Assessment. Latest version available from: www.epa.gov/NCEA/bmds/index.html
U.S. EPA (2014). Analytical methods approved for drinking water compliance monitoring under the Disinfection Byproduct Rule. Office of Water, U.S. Environmental Protection Agency, Cincinnati, Ohio (EPA 815-B-14-004).
Valade, M.T., Becker, W.C. and Edzwald, J.K. (2009). Treatment selection guidelines for particle and NOM removal. J. Water Supply Res. Technol. Aqua, 58(6):424–432.
Valero, F. and Arbos, R. (2010). Desalination of brackish water using electrodialysis reversal control of the THMs formation in Barcelona (NE Spain) area. Desalination, 253: 170–174.
van der Hoek, J.P., Rijinbende, D.O., Lokin, C.J.A., Bonné, P.A.C., Loonen, M.T. and Hofman, J.A.M.H. (1998). Electrodialysis as an alternative for reverse osmosis in an integrated membrane system. Desalination, 117: 159–172.
von Gunten, U. (2003). Ozonation of drinking water: Part II. Disinfection and by-product formation in presence of bromide, iodide or chlorine. Water Res., 37(7): 1469–1487.
von Gunten, U. and Hoigné, J. (1992). Factors controlling the formation of bromate during ozonation of bromide-containing waters. J. Water Supply Res. Technol. Aqua, 41(5): 299–304.
von Gunten, U. and Hoigné, J. (1994). Bromate formation during ozonation of bromide-containing waters: interaction of ozone and hydroxyl radical reactions. Environ. Sci. Technol., 28(7): 1234–1242.
von Gunten, U. and Oliveras, Y. (1997). Kinetics of the reaction between hydrogen peroxide and hypobromous acid: implication on water treatment and natural systems. Water Res., 31(4): 900–906.
von Gunten, U., Hoigné, J. and Bruchet, A. (1995). Bromate formation during ozonation of bromide-containing waters. Water Supply, 13(1): 45–50.
Wang, Y. (2014). Source water quality assessment and source water characterization for drinking water protection. PhD Dissertation, Carnegie Mellon University, Pittsburgh, Pennsylvania.
Wang, D., Bolton, J.R., Andrews, S.A. and Hofmann, R. (2015). Formation of disinfection by-products in the ultraviolet/chlorine advanced oxidation process. Sci. Total Environ., 518-519:49–57.
Watson, K., Farre, M.J. and Knight, N. (2012). Strategies for the removal of halides from drinking water sources, and their applicability in disinfection by-product minimisation: a critical review. J. Environ. Manage., 110: 276–298.
Wei, M., Hamoud, A.S., Yamaguchi, T., Kakehashi, A., Morimura, K., Doi, K., Kushida, M., Kitano, M., Wanibuchi, H. and Fukushima, S. (2009). Potassium bromate enhances N-ethyl-N-hydroxyethylnitrosamine-induced kidney carcinogenesis only at high doses in Wistar rats: indication of the existence of an enhancement threshold. Toxicol. Pathol., 37(7): 983–991.
Weinberg, H.S., Delcomyn, C.A. and Unnam, V. (2003). Bromate in chlorinated drinking waters: occurrence and implications for future regulation. Environ. Sci. Technol., 37(14): 3104–3110.
Weishaar, J.L., Aiken, G.R., Bergamaschi, B.A., Fram, M.S., Fujii, R. and Mopper, K. (2003). Evaluation of specific ultraviolet absorbance as an indicator of the chemical composition and reactivity of dissolved organic carbon. Environ. Sci. Technol., 37(20): 4702–4708.
Wert, E.C. and Benotti, M. (2010). Identifying the role of bromamines in minimizing bromate formation. In: Water Quality Technology Conference and Exposition (WQTC) Conference Proceedings. American Water Works Association, Denver, CO.
Wert, E.C., Neemann, J.J., Rexing, D.J. and Zegers, R.E. (2008). Biofiltration for removal of BOM and residual ammonia following control of bromate formation. Water Res., 42(1–2): 372–378.
Westerhoff, P. (1995). Ozone oxidation of bromide and natural organic matter. PhD Dissertation, University of Colorado, Boulder, Colorado.
Westerhoff, P. (2014). Personal communication. Arizona State University, Arizona.
Westerhoff, P., Song, R., Amy, G. and Minear, R. (1998). NOM’s role in bromine and bromate formation during ozonation. J. Am. Water Works Assoc., 89(11): 82–94.
Westerhoff, P., Aiken, G., Amy, G. and Debroux, J. (1999). Relationships between the structure of natural organic matter and its reactivity towards molecular ozone and hydroxyl radicals. Water Res., 33(10): 2265–2276.
Westerhoff, P., Chao, P. and Mash, H. (2004). Reactivity of natural organic matter with aqueous chlorine and bromine. Water Res., 38(6): 1502–1513.
Westerhoff, P., Summers, R.S., Chowdhury, Z. and Kommineni, S. (2005). Ozone-enhanced biofiltration for geosmin and MIB removal. AWWA Research Foundation and American Water Works Association, Denver, Colorado.
WHO (2005). Bromate in drinking-water: background document for development of WHO guidelines for drinking-water quality. World Health Organization, Geneva, Switzerland (WHO/SDE/WSH/05.08/78; www.who.int/water_sanitation_health/dwq/chemicals/bromate260505.pdf).
WHO (2011). Guidelines for drinking-water quality. 4th edition. World Health Organization. Geneva, Switzerland. Available at: www.who.int/water_sanitation_health/publications/2011/dwq_guidelines/en/.
WHO (2012). Water safety planning for small community water supplies. World Health Organization, Geneva, Switzerland. Available at: www.who.int/water_sanitation_health/publications/2012/water_supplies/en/.
Williams, M.D., Coffey, B.M. and Krasner, S.W. (2003). Evaluation of pH and ammonia for controlling bromate. J. Am. Water Works Assoc., 95(10): 82–93.
Winid, B. (2015). Bromine and water quality – Selected aspects and future perspectives. J. Appl. Geochem., 63: 413–435.
Wiśniewski, J.A. and Kabsh-Korbutowicz, M. (2010). Bromate removal in the ion-exchange process. Desalination, 261: 197–201.
Wiśniewski, J.A., Kabsh-Korbutowicz, M. and Lakomska, S. (2011). Donnan dialysis and electrodialysis as viable options for removing bromates from natural water. Desalination, 281: 257–262.
Wolf, D.C., Crosby, L.M., George, M.H., Kilburn, S.R., Moore, T.M., Miller, R.T. and DeAngelo, A.B. (1998). Time- and dose-dependent development of potassium bromate-induced tumors in male Fischer 344 rats. Toxicol. Pathol., 26(6): 724–729.
Wu, W.W. and Chadik, P.A. (1998). Effect of bromide ion on haloacetic acid formation during chlorination of Biscayne aquifer water. J. Environ. Eng., 124(10): 932–938.
Yamaguchi, T., Wei, M., Hagihara, N., Omori, M., Wanibuchi, H. and Fukushima, S. (2008). Lack of mutagenic and toxic effects of low dose potassium bromate on kidneys in the Big Blue rat. Mutat. Res., 652(1): 1–11.
Young, Y.H., Chuu, J.J., Liu, S.H. and Lin-Shiau, S.Y. (2001). Toxic effects of potassium bromate and thioglycolate on vestibuloocular reflex systems of guinea pigs and humans. Toxicol. Appl. Pharmacol., 177(2): 103–111.
Appendix A: List of acronyms
- 8-OHdG
- 8-hydroxydeoxyguanosine
- 8-oxodG
- 8-oxodeoxyguanosine
- AF
- allocation factor
- ANSI
- American National Standards Institute
- AUC
- area under the plasma concentration–time curve
- AUCd
- daily area under the plasma concentration–time curve
- AWWA
- American Water Works Association
- BAC
- biologically active carbon
- BAT
- best available technology
- BBNa
- barbital sodium
- BMD
- benchmark dose
- BMD10
- benchmark dose for a 10% response
- BMDL10
- lower 95% confidence limit on the benchmark dose for a 10% response
- BMDS
- Benchmark Dose Software
- BrdU
- bromodeoxyuridine
- BV
- bed volume
- bw
- body weight
- BW
- body weight
- CAS
- Chemical Abstracts Service
- Cavg
- average plasma concentration
- CFIA
- Canadian Food Inspection Agency
- Cmax
- peak plasma concentration
- DBP
- disinfection by-product
- DNA
- deoxyribonucleic acid
- DO
- dissolved oxygen
- DOC
- dissolved organic carbon
- dUTP
- 2′-deoxyuridine 5′-triphosphate
- EBCT
- empty bed contact time
- ED
- electrodialysis
- EDR
- electrodialysis reversal
- EHEN
- N-ethyl-N-hydroxyethylnitrosamine
- GAC
- granular activated carbon
- GSH
- glutathione
- HAA
- haloacetic acid
- HBV
- health-based value
- IARC
- International Agency for Research on Cancer
- ILSI
- International Life Sciences Institute
- IPCS
- International Programme on Chemical Safety
- LD50
- median lethal dose
- LOAEL
- lowest-observed-adverse-effect level
- MAC
- maximum acceptable concentration
- MDL
- method detection limit
- MOA
- mode of action
- MRL
- minimum reporting level
- MUL
- maximum use level
- NOAEL
- no-observed-adverse-effect level
- NOEL
- no-observed-effect level
- NOM
- natural organic matter
- NSF
- NSF International
- NTP
- National Toxicology Program (United States)
- PAC
- powdered activated carbon
- PBPK
- physiologically based pharmacokinetic
- PCR
- post-column reagent
- pKa
- acid dissociation constant
- ppb
- parts per billion
- ppm
- parts per million
- PQL
- practical quantitation level
- RO
- reverse osmosis
- SCC
- Standards Council of Canada
- SPAC
- single product allowable concentration
- SUVA
- specific UV254 absorbance
- T3
- triiodothyronine
- T4
- thyroxine
- TBARS
- thiobarbituric acid–reactive substances
- TDI
- tolerable daily intake
- TDS
- total dissolved solids
- THM
- trihalomethane
- TOC
- total organic carbon
- TSH
- thyroid stimulating hormone
- TUNEL
- terminal deoxynucleotidyl transferase dUTP nick end labelling
- UF
- uncertainty factor
- UL
- Underwriters Laboratories
- EPA
- Environmental Protection Agency (United States)
- UV
- ultraviolet
- UV254
- ultraviolet absorbance at a wavelength of 254 nm
- UV/VIS
- ultraviolet/visible
Appendix B: Recommendations for the handling and storage of hypochlorite solutions
The information contained in this appendix is reprinted from AWWA Standard B300 by permission. Copyright © 2011 the American Water Works Association.
Several key factors have been identified that impact the formation of perchlorate, bromate, and other contaminants in hypochlorite solutions. The major factors impacting perchlorate formation parallel those that also affect the decomposition of hypochlorite: temperature, ionic strength, concentration, and pH. By using the information gathered in the study referenced below and by applying the "Predictive Model" to hypothetical liquid hypochlorite storage scenarios, several quantitative and qualitative recommendations can be made:
- Dilute stored hypochlorite solutions upon delivery: The decomposition of hypochlorite and subsequent formation of chlorate and perchlorate is dependent upon hypochlorite concentration and ionic strength. Higher ionic strength and hypochlorite concentration will drive the reaction towards a greater production of chlorate and perchlorate while also increasing the rate of decomposition of hypochlorite. By diluting a 2M hypochlorite solution by a factor of 2, the rate of perchlorate formation decreases by a factor of 7 due to the combination of concentration and ionic strength effects. A four-fold dilution of a hypochlorite solution will decrease the rate of formation by a factor of 36. A ten-fold dilution of a hypochlorite solution will decrease the rate of perchlorate formation by a factor of 270.
- Store the hypochlorite solutions at lower temperatures: Higher temperatures speed up the chemical decomposition of hypochlorite and the subsequent formation of chlorate and perchlorate. Every 5°C (9° F) reduction in storage temperature will reduce the rate of perchlorate formation by a factor of approximately 2. To minimize temperature increases, the product should be stored out of direct sunlight.
- Control the pH of stored hypochlorite solutions at pH 11−13 even after dilution: Storage of concentrated hypochlorite solutions at pH values lower than 11 is not recommended due to rapid decomposition of hypochlorite ion/hypochlorous acid and the consequent formation of chlorate even though this reduces the amount of perchlorate formed. When the pH is higher than 13, perchlorate formation is enhanced due to the ionic strength effect. As such, utilities should continue to insist that manufacturer specifications include pH control in the range of 11−13. Given the typical pH range of on-site generation (OSG) hypochlorite (pH 9−10), such solutions should be used as soon as possible after manufacture and should not be stored for more than 1−2 days.
- Control the removal of transition metal ions by purchasing filtered hypochlorite solutions and by using low-metal ion concentration feed water for the OSG systems and dilution water: The presence of transition metal ions results in an increased degradation rate of hypochlorite. While this degradation is concomitant with reduced perchlorate formation, the free available chlorine concentration is also reduced, forcing a utility to use a higher volume of a hypochlorite solution which results in higher mass loading of contaminants such as perchlorate, chlorate, and bromate.
- Use fresh hypochlorite solutions when possible: Hypochlorites will naturally decompose to produce oxygen, chlorate, and perchlorate. Less storage time will minimize the formation of these contaminants in the hypochlorite solution. Rotate stock and minimize the quantity of aged product in storage tanks prior to the delivery of new product. A fresh hypochlorite solution will also contain a higher concentration of hypochlorite, thereby reducing the amount of solution required to obtain the target chlorine residual. Again, higher hypochlorite concentration in a fresh hypochlorite solution will correspond to lower concentrations of contaminants dosed.
- For utilities using OSG hypochlorite, use a low-bromide salt to minimize the amount of bromide present in the brine: Bromate formation will occur rapidly in hypochlorite solutions in the presence of bromide. By controlling the amount of bromide in the salt and source water used for on-site generation, bromate formation can be minimized.