
Guidelines for Canadian Drinking Water Quality: Guideline Technical Document – Cadmium
Download the alternative format
(PDF format, 910 KB, 67 pages)
Organization: Health Canada
Type: Guideline
Published: 2020-07-10
Cat.: H144-13/17-2020E-PDF
ISBN: 978-0-660-34296-2
Pub.: 190620
Related Topics
Table of Contents
- Part I. Overview and Application
- Part II. Science and Technical Considerations
- 5.0 Exposure
- 6.0 Analytical methods
- 7.0 Treatment technology and distribution system considerations
- 8.0 Kinetics and metabolism
- 9.0 Health effects
- 9.2 Effects on experimental animals
- 9.3 Mode of action
- 10.0 Classification and assessment
- Rationale
- References
- Appendix A: List of acronyms
Part I. Overview and Application
1.0 Guideline
A maximum acceptable concentration (MAC) of 0.007 mg/L (7 µg/L) is established for total cadmium in drinking water, based on a sample of water taken at the tap.
2.0 Executive summary
This guideline technical document was prepared in collaboration with the Federal-Provincial-Territorial Committee on Drinking Water and assesses all information on cadmium available at the time of its development.
Cadmium is a metal that can be found in the environment either in its elemental form or in a number of different salts. It is often associated with lead, copper, and zinc ores. Cadmium may enter drinking water sources naturally (leaching from soil), as a result of human activities (as a by-product of refining or from its use in technological applications) or through leaching from some pipes and well components.
This guideline technical document reviews and assesses all identified health risks associated with cadmium in drinking water. It incorporates new studies, assessments and approaches and takes into consideration the availability of appropriate treatment technology. Based on this review, the document establishes a MAC of 0.007 mg/L (7 µg/L) for cadmium in drinking water.
2.1 Health effects
Although exposure to cadmium through inhalation is considered to be associated with cancer effects in humans, this concern has not been linked to exposure through drinking water. Oral exposure to high levels of cadmium over a long period may result in adverse effects on the kidneys or on bones. The guideline is based on adverse effects on the kidney, as they occur at low exposure levels and are well characterized.
2.2 Exposure
Canadians can be exposed to cadmium through its presence in food, water, consumer products, soil and air. Food is the main source of exposure to cadmium for Canadians, with the exception of smokers or individuals who are exposed to it in the workplace. Exposure to cadmium in drinking water is primarily due to its leaching from galvanized steel/iron used for service lines, pipes and well components and, to a lesser extent, from brass fittings and cement mortar linings. Galvanized pipes were generally installed in homes and buildings prior to the 1960s but were permitted by the National Plumbing Code until 1980. In addition, galvanized steel has been used in the production of well components such as casings and drop pipes. Cadmium levels in source water are typically very low, and exposure to cadmium from drinking water is also generally expected to be low. Intake of cadmium from drinking water is not expected through either skin contact or inhalation.
2.3 Analysis and treatment considerations
The establishment of a drinking water guideline must take into consideration the ability to measure the contaminant. There are several methods available that can reliably measure total cadmium in drinking water below the MAC.
Cadmium levels in source water are typically very low. Although there are treatment technologies that can remove cadmium efficiently at the treatment plant, municipal treatment is not generally an effective strategy. The strategy for reducing exposure to cadmium from drinking water is generally focused on removal of galvanized steel components and/or controlling corrosion using adjustments to the water quality or corrosion inhibitors. Since the presence of cadmium has been correlated with high lead concentrations, corrosion control measures should also address lead.
As the primary source of cadmium in drinking water is the leaching from galvanized steel used to make service lines, pipes and well components, drinking water treatment devices offer an effective option at the residential level, although their use should not be considered a permanent solution because the source continues to exist. There are a number of certified, residential treatment devices available that can remove cadmium from drinking water to below the MAC.
2.4 International considerations
Drinking water guidelines, standards and/or guidance from other national and international organizations may vary due to the age of the assessments as well as differing policies and approaches, including the choice of key study and the use of different consumption rates, body weights and allocation factors.
Various organizations have established values for cadmium in drinking water. The value established by Health Canada is comparable to limits established by other countries and organizations. The U.S. Environmental Protection Agency (U.S. EPA) established a maximum contaminant level of 0.005 mg/L. The Australian National Health and Medical Research Council established a guideline value of 0.002 mg/L. The World Health Organization (WHO) published a drinking-water quality guideline of 0.003 mg/L. Lastly, The European Union directive includes a parametric value of 0.005 mg/L for cadmium in drinking water.
3.0 Application of the guideline
Note: Specific guidance related to the implementation of drinking water guidelines should be obtained from the appropriate drinking water authority in the affected jurisdiction.
Primary sources of cadmium in both distribution and household plumbing systems include the deterioration of galvanized steel pipes and, to a lesser extent, leaching from brass materials and cement-mortar linings. Galvanized pipes may leach cadmium, which may result in higher concentrations at the consumer’s tap than at the treatment plant or in the distribution system. Corrosivity of the water, the amount of cadmium in the plumbing system components, the water stagnation (usage pattern) and the sampling protocol all impact cadmium levels in drinking water. The water quality factors that have the greatest effect on cadmium corrosion are pH and alkalinity.
Considering that cadmium levels at the consumer’s tap may be higher than levels at the treatment plant or in the distribution system, strategies to reduce exposure to cadmium will need to focus on controlling corrosion within the distribution and plumbing systems and on removing galvanized steel pipes and components from these systems. As such, cadmium should be analyzed as part of a corrosion control monitoring program. Although it is recognized that a utility’s responsibility does not generally include residential plumbing systems, most of the established guidelines are intended to apply at the consumer’s tap. Cadmium monitoring should focus on areas known or likely to have galvanized steel service lines, pipes or components. It should also include zones supplied by potentially corrosive water (e.g., low pH) and consecutive systems (i.e., public water systems whose drinking water supply is from another public water system).
Any exceedance of the MAC should be investigated and followed by the appropriate corrective actions, if required. If necessary, actions taken should be based on the cause of the elevated cadmium concentration to ensure that they do not result in unintended consequences (e.g., water quality change, etc.). Corrective actions can include, but are not limited to, resampling, removal of galvanized steel components, public education and corrosion control measures that include addressing any lead release. Private residential drinking water treatment devices are an option for reducing cadmium concentrations in drinking water at the tap.
Discoloration (coloured water) episodes are likely to be accompanied by the release of accumulated contaminants, including cadmium, because dissolved cadmium is adsorbed onto the iron in the steel and manganese deposits in the distribution and plumbing systems. Therefore, discolored water events should not be considered only an aesthetic issue; they should trigger sampling for metals and possibly distribution system maintenance.
3.1 Monitoring
Sampling protocols will differ depending on the desired objective (i.e., identifying sources of cadmium, controlling corrosion, assessing compliance, estimating exposure to cadmium). As monitoring of cadmium at the tap can be done using different sampling protocols, it is important that the selected protocol be appropriate to meet the desired objective. Galvanized steel pipes can be a source of both cadmium and lead, especially for systems without corrosion control. Therefore, in areas/zones with galvanized steel pipe, the sampling sites and protocols for cadmium should be the same as those for lead. Information on sampling sites and protocols can be found in the guideline technical document for lead (Health Canada, 2019).
The objective of the sampling protocols in this document is to monitor for typical community exposure to total cadmium to determine whether there are concerns related to human health. Compliance monitoring should be conducted at the consumer’s tap and focus on areas known or likely to have galvanized steel pipes or components. It should include areas or zones (geographical areas within which the quality of drinking water is considered approximately uniform) supplied by potentially corrosive water (e.g., low pH, low alkalinity). Specifically, priority should be given to sites known to have galvanized steel service lines or plumbing or when the water supply has a pH of <7.
Sampling should be conducted at least once per year, with the number of monitoring sites being determined based on the size of the drinking water system. The frequency may be reduced if no failures have occurred in a defined period, as determined by the regulator, or if water quality conditions are not corrosive to cadmium.
If cadmium is present in the source water and treatment is in place, annual monitoring of the treated water is recommended. Samples should be collected after treatment prior to distribution (i.e., at the entry point to the distribution system). Paired samples of source and treated water should be taken to confirm the efficacy of the treatment.
Part II. Science and Technical Considerations
4.0 Identity, use and sources in the environment
Cadmium (Cd), (CAS Registry No. 7440-43-9) is a soft silver-white metal with a valence state of +2. It is often associated with lead, copper, and zinc ores and occurs in a number of different salts, many of which are water soluble (including cadmium chloride and cadmium sulphate). Cadmium can also exist in its elemental form (ATSDR, 2012). Cadmium compounds are naturally occurring, and are distributed in the earth’s crust (0.1–0.5 ppm). The physicochemical properties of some of these are presented in Table 1.
| Substance |
Chemical formula | Physical description | Molecular weight (g/mol) | Vapour pressure (mm Hg) | Solubility in water at 20°C |
|---|---|---|---|---|---|
| Cadmium | Cd | Silver-white metal | 112.41 | 7.5 × 10⁻³ at 257°C | insoluble |
| Cadmium carbonate | CdCO3 | White powder or leaflets | 172.42 | No data | insoluble |
| Cadmium chloride | CdCl2 | White crystals | 183.32 | 10 at 656°C | soluble |
| Cadmium oxide | CdO | Dark brown powder or crystals | 128.41 | 1 at 1000°C | insoluble |
| Cadmium sulphate | CdSO4 | Colourless crystals | 208.47 | No data | soluble |
| Cadmium sulphide | CdS | Light yellow, orange, or brown cubic or hexagonal structure | 144.48 | No data | soluble at 1.3 mg/L at 18°C |
Cadmium is often a by-product of refining and is used in many technological applications. It is considered a non-essential element and has no known biological function (EFSA, 2009b; Health Canada, 2018a).
4.1 Environmental fate
Cadmium can adsorb to soil, although to a lesser extent than other heavy metals (Jalali and Moradi, 2013; HSDB, 2017). Adsorption to soil increases with organic content and pH, and leaching into groundwater is more likely to occur in acidic, sandy soils. The extent of divalent cations in soil will also positively influence cadmium’s adsorption, by providing opportunities for cation exchange and the formation of cadmium complexes.
Cadmium entering water from industrial sources adsorbs to particulate matter and settles. Various forms of cadmium can be found in water, including inorganic and organic metal complexes (see Table 1). In freshwater, hydrates and the ionic form of cadmium are the most important species found, and the predicted cadmium compounds are Cd+2, Cd(OH)+, Cd(HCO3)+, and Cd(OH)2, based on stability constants (see Section 1, Figure 1) (HSDB, 2017).
5.0 Exposure
Below is a summary of the contributions from various sources of exposure to cadmium. Overall, food represents the major source of total exposure to cadmium, and drinking water appears to be a minor contributor to total exposure.
5.1 Water
Cadmium levels in drinking water can vary greatly depending on geological formations surrounding the source water and on environmental factors affecting cadmium mobility. Cadmium may be released to water by natural weathering processes, discharge from industrial facilities or sewage treatment plants, atmospheric deposition, leaching from landfills or soil, or phosphate fertilizers (ATSDR, 2012). Drinking water materials used in both distribution and household plumbing systems may present another source of cadmium exposure. Primary sources of cadmium include the deterioration of galvanized steel pipes and well components and, to a lesser extent, leaching from brass materials and cement-mortar linings. A summary of Canadian data on cadmium in drinking water or source (raw) water is presented in Table 2, including the number of samples above detection limit (DL), the minimum and maximum values detected, and the mean and median of values above DL. No samples were provided from Nunavut and North-West Territories.
| Jurisdiction | Type of water | % of samples above DL (total no. of samples) | Min–max (µg/L) | Mean (median) of values above DL (µg/L) | Sampling years |
|---|---|---|---|---|---|
| NewfoundlandTable 2 Footnote 1 | Tap | 3.5 (4,858) | 0.01–0.35 | 0.034 (0.02) | 2011–2016 |
| NewfoundlandTable 2 Footnote 2 | Source | 3.5 (782) | 0.01–3.5 | 0.40 (0.02) | 2011–2016 |
| Nova ScotiaTable 2 Footnote 3 | Raw | 16.0 (489) | 0.01–4.0 | 0.19 (0.02) | 2002–2016 |
| Nova ScotiaTable 2 Footnote 4 | Treated, distributed | 12.0 (595) | 0.01–0.54 | 0.06 (0.02) | 2002–2016 |
| New BrunswickTable 2 Footnote 5 | Raw | 13.0 (2,551) | 0.01–2.9 | 0.12 (0.02) | 2007–2017 |
| New BrunswickTable 2 Footnote 6 | Treated, distributed | 3.6 (3,002) | 0.01–3.5 | 0.16 (0.03) | 2007–2017 |
| QuebecTable 2 Footnote 6 | Distributed | 4.2 (14,483) | 0.002–3.4 | 0.20 (0.01) | 2013–2017 |
| OntarioTable 2 Footnote 7 | Raw | 14.0 (1,132) | 0.003–5.0 | 0.09 (0.01) | 2013-2019 |
| OntarioTable 2 Footnote 8 | Treated, distributed | 15.0 (8,251) | 0.003–10.0 | 0.16 (0.10) | 2013-2019 |
| ManitobaTable 2 Footnote 9 | Raw | 29.0 (1,495) | 0.01–1.0 | 0.04 (0.02) | 2009–2017 |
| ManitobaTable 2 Footnote 10 | Treated, distributed | 19.0 (2,071) | 0.01–1.0 | 0.04 (0.02) | 2009–2017 |
| SaskatchewanTable 2 Footnote 11 | Raw, treated, distributed | 14.0 (4,083) | 0.01–5.9 | 0.07 (0.02) | 2007–2017 |
| AlbertaTable 2 Footnote 12 | Raw | 19.0 (273) | 0.10–2.0 | 1.20 (1.00) | 2007–2017 |
| AlbertaTable 2 Footnote 13 | Distribution system | 2.0 (807) | 0.01–0.3 | 0.03 (0.01) | 2007–2017 |
| AlbertaTable 2 Footnote 14 | Well | 0.30 (1,686) | 1.0–31 | 13.4 (15.0) | 2012–2017 |
| BC Interior HealthTable 2 Footnote 15 | Raw and treated | 97.0 (1,180) | 0.005–100.0 | 0.56 (0.02) | 2007–2017 |
| BC Northern HealthTable 2 Footnote 16 | Raw | 39.0 (1067) | 0.005–5.0 | 0.06 (0.02) | 2007–2017 |
| YukonTable 2 Footnote 17 | Raw and treated | 32.0 (370) | 0.003–3.41 | 0.08 (0.03) | 2009–2017 |
| Prince Edward IslandTable 2 Footnote 18 | Tap water, distribution system | 0.3 (2,917) | 2.0-6.0 | 3.4 (3.0) | 2013-2015 |
| CanadaTable 2 Footnote 19 | Raw | 85.6 (18,998) | 0.001–95.4 | 0.07 (0.01) | 2000–2016 |
|
|||||
5.2 Food
Based on the detailed health risk assessment of dietary exposure to cadmium (Health Canada, 2018a), diet is the primary source of cadmium exposure for the general, non-smoking population in Canada. Cadmium in foods is estimated to account for the majority of the total exposure in Canadians, with the exception of smokers or individuals who are occupationally exposed. Leafy vegetables, potatoes, cereals/grains, nuts and pulses are all identified sources of cadmium in the diet. Cadmium exposure is also possible through consumption of terrestrial animals and shellfish (EFSA, 2009a; JECFA, 2011). Estimated dietary cadmium intakes for Canadians were calculated (Health Canada, 2017a) based on various sources of occurrence data from foods sold in Canada between 2009 and 2015. Median dietary exposure estimates for cadmium ranged from 0.30 µg/kg body weight (bw) per day in males aged 51–71+ to 0.83 µg/kg bw per day in both sexes aged 4–8.
5.3 Air
Non-occupational exposure to cadmium from air is generally low. Data from the National Air Pollution Monitoring Surveillance program indicate that levels of cadmium in ambient outdoor air (measured from particulate matter 2.5 samples) ranged from 0.02 ng/m3 to 14.89 ng/m3 (median 0.04 ng/m3) for seven monitoring stations across Canada (Abbotsford, Edmonton, Halifax, Ottawa, Saint John, Vancouver and Windsor) from 2012 to 2016 (Environment and Climate Change Canada, 2017; Health Canada, 2017b). Indoor air quality values in Edmonton were ranged from 0.005 ng/m3 to 1.30 ng/m3 (median 0.03 ng/m3), as measured in the Edmonton Indoor Air Quality Study (Bari et al., 2015; Health Canada, 2017b).
In Canada, the cadmium emissions in air due to human-related activities totalled 7.6 tonnes in 2016. The country’s largest source of cadmium in air in 2014 was reported to be non-ferrous smelting and refining, which represented a total of 60% of emissions. This was followed by other industries (16%) and fuel for electricity and heating (14%) (Environment and Climate Change Canada, 2016).
5.4 Consumer products
Smokers are exposed to very high levels of cadmium from tobacco, and smoking is known to increase the body burden of cadmium. It has been estimated that blood levels of cadmium are four to five times higher in smokers than in non-smokers (Jarup et al., 1998; Adams and Newcomb, 2014). Many occupational exposures via inhalation have been reported, as cadmium is used in industrial work, including smelting and the production of cadmium alloys and compounds (ATSDR, 2016; HSDB, 2017). Cadmium is also used in the manufacture of pigments, cadmium plating, polyvinyl chloride (PVC), and batteries (HSDB, 2017). Canada has developed a regulation for cadmium in children’s jewellery given the potential of children’s exposure from ingestion of cadmium-containing jewellery (CCPSA, 2018).
5.5 Soil
Levels of cadmium in soil are generally low, but they vary with geology and soil type. The concentrations of cadmium in Canadian soil vary from below the DL to 8.1 mg/kg (CCME, 1996), depending on anthropogenic activity and geological composition. The 98th percentiles of cadmium in surface soils not affected by point-source pollution in Ontario have been reported as 0.71 mg·kg-1 and 0.84 mg·kg-1 for rural and old urban parkland soils, respectively (CCME, 1996).
Metal ions such as cadmium can form complexes with other organic or inorganic ligands, which affect their mobility and adsorption in soil. Formation of cadmium complexes with inorganic ions such as Cl- is reported to hinder adsorption and facilitate mobility in soil. Soil pH is also a factor that influences cadmium mobility, and more movement has been reported under acidic conditions (McLean and Bledsoe, 1992).
5.6 Biomonitoring
5.6.1 Biomarkers of exposure
In order to most accurately account for cadmium exposures, epidemiological studies typically make use of biomarkers. Blood cadmium measures (BCd) reflect recent exposures, whereas levels of urinary cadmium (UCd) are indicative of cumulative dose and body burden, especially the accumulation of cadmium in the kidney (EFSA, 2009a). It should be noted, however, that UCd levels can vary with a number of factors, including renal damage and efficiency. Renal function must therefore be considered when interpreting UCd values, as the values will increase with renal tubular damage (Health Canada, 2018a).
5.6.2 Biomonitoring data
As part of the Canadian Health Measures Survey (CHMS), biomonitoring of exposure to cadmium throughout the population was assessed by measurements of cadmium in blood samples. Cadmium was measured in the whole blood of all participants of the CHMS aged 6–79 in cycle 1 (2007–2009), and aged 3–79 in cycle 2 (2009–2011) and cycle 3 (2012–2013) (Health Canada, 2015). Cadmium was also measured in the urine of all participants in CHMS cycles 1 and 2 (Health Canada, 2013).
The geometric mean (GM) concentrations of blood cadmium in cycles 1, 2 and 3 for participants aged 6–79 were 0.34 µg/L (95% confidence interval (CI) 0.31–0.37, n = 5,319), 0.30 µg/L (95% CI = 0.27–0.33, n = 5,575) and 0.34 µg/L (95% CI = 0.31–0.37, n = 5,067), respectively. Blood cadmium concentrations were generally higher in females than in males (GM: 0.38, 0.33, and 0.39 µg/L in females versus 0.30, 0.27, and 0.31 µg/L in males, in cycles 1, 2 and 3, respectively) (Garner and Levallois, 2016). One potential explanation for this difference could be a difference in absorption between sexes. A national report by the Centers for Disease Control (CDC) noted that the average gastrointestinal absorption of dietary cadmium is estimated at 5% in adult men and 10% or higher in women (CDC, 2009). Blood cadmium concentrations increased with age in all three cycles (Health Canada, 2015). Some of the age-dependent increases were statistically significant. Combined analyses of cycle one and cycle two datasets by Garner and Levallois (2016) showed significantly higher blood cadmium concentrations in the group aged 40–59 (GM, 0.44 µg/L) than in the group aged 20–39 (GM, 0.31 µg/L). An analysis of cycle three data by Statistics Canada (2015) showed significantly higher blood cadmium concentrations (GM, 0.42 µg/L) in adults aged 20–79 than in the younger participants, aged 3–19 (GM, 0.12 µg/L) (Statistics Canada, 2015).
The GM concentrations of urinary cadmium in participants aged 6–79 were 0.34 µg/L (95% CI = 0.31–0.38, n = 5,491) for cycle 1 and 0.40 µg/L (95% CI = 0.36–0.44, n = 5,738) for cycle 2. After adjusting for creatinine, urinary cadmium concentrations were 0.42 µg/g creatinine (95% CI = 0.40–0.44, n = 5,478) for cycle 1 and 0.37 µg/g creatinine (95% CI = 0.34–0.41, n = 5,719) for cycle two. Similar to blood cadmium, concentrations of urinary cadmium were higher in females than in males, but only after adjusting for urinary creatinine. A combined analysis of cycle one and cycle two data (Garner and Levallois, 2016) for adult Canadians aged 20–79 showed significantly higher concentrations of creatinine-adjusted urinary cadmium in women (0.53 µg/g creatinine) than in men (0.35 µg/g creatinine). As noted for blood cadmium, urinary cadmium concentrations also increased with age. For both creatinine-adjusted and unadjusted urinary cadmium concentrations, significant age-dependent increases (ages 60-79 > 40-59 > 20-39) were reported by Garner and Levallois (2016).
5.7 Multi-route exposure through drinking water
Cadmium can be absorbed via the inhalation route; however, exposure to cadmium vapours while showering or bathing is not expected to occur given that cadmium is not volatile, as evidenced by its low vapour pressure (Table 1). Dermal absorption of cadmium during showering or bathing is considered negligible since the low skin permeability constant of 1 × 10⁻³ cm/h suggests that the dermal route of exposure would contribute less than 10% of the drinking water consumption level (U.S. EPA, 2004; Krishnan and Carrier, 2008). Therefore, the inhalation and dermal routes during showering and bathing are unlikely to contribute significantly to the total exposure.
6.0 Analytical methods
Standardized methods available for the analysis of total cadmium in drinking water and their respective method detection limits (MDLs) are summarized in Table 3. MDLs are dependent on the sample matrix, instrumentation, and selected operating conditions and will vary between individual laboratories. It is important that analyses be undertaken by an accredited laboratory to ensure accurate results and appropriate quality assurance and quality control and that method reporting limits (MRLs) are low enough to ensure accurate monitoring at concentrations below the MAC.
The current U.S. EPA practical quantitation limit (PQL) of 2 µg/L for cadmium is based on the capability of laboratories to measure cadmium within reasonable limits of precision and accuracy (U.S. EPA, 2009). In the second six-year review of existing National Primary Drinking Water Regulations, the U.S. EPA (2009) reported that performance evaluation data do not support further reduction of the PQL for cadmium.
| Method (Reference) | Methodology | MDL (µg/L) | Interferences/Comments |
|---|---|---|---|
| EPA 200.5 Rev. 4.2 (U.S. EPA, 2003) | Axially viewed inductively coupled plasma atomic emission spectrometry (AVICP-AES) | 0.1 | Subject to spectral, physical, chemical and memory interferences. Matrix interferences: Ca, Mg and Na >125 mg/L and SiO2 >250 mg/L |
| EPA 200.7 Rev. 4.4 (U.S EPA, 1994Table 3 Footnote a) | Inductively coupled plasma atomic emission spectrometry (ICP-AES) | 1.0 | Subject to spectral, physical, chemical and memory interferences. Matrix interferences: TDSc >0.2% (w/v) |
| EPA 200.8 Rev. 5.4 (U.S. EPA, 1994Table 3 Footnote b) | Inductively coupled plasma mass spectrometry (ICP-MS) | 0.03Table 3 Footnote a–0.5Table 3 Footnote b | Subject to isobaric elemental and polyatomic ion and physical interferences. Matrix interferences: TDS >0.2% (w/v) |
| EPA 200.9 Rev. 2.2 (U.S. EPA, 1994Table 3 Footnote c) | Stabilized temperature graphite furnace atomic absorption spectrometry | 0.05 | Subject to spectral, matrix and memory interferences; the HCl present from the digestion procedure can influence the sensitivity. |
| SM 3113B (APHA et al.,2017) | Electrothermal atomic absorption spectrometry | 0.05 | Subject to molecular absorption, chemical and matrix interferences |
|
|||
6.1 Sample preservation and preparation
Operational considerations for the analysis of cadmium in drinking water (e.g., sample collection, preservation, storage) can be found in the references listed in Table 3. Accurate quantification of dissolved, particulate (suspended), and total cadmium in samples is dependent on the proper sample preservation and preparation steps. Standard Method (SM) 3030B provides guidance on filtration and preservation procedures for the determination of dissolved or particulate metals (APHA et al., 2017).
EPA methods 200.7 and 200.8 and SM 3113B do not require hot acid digestion for total recoverable metals, unless turbidity of the sample is greater than one nephelometric turbidity unit. However, research conducted on other metals (e.g., lead, chromium) has found that this does not accurately quantify the total metal concentration in a drinking water sample; when particulate cadmium is present, this approach may underestimate total cadmium in drinking water. Analytical requirements under the U.S. EPA’s third Unregulated Contaminant Monitoring Rule include solubilizing the acid-preserved sample by gentle heating using nitric acid regardless of the sample turbidity or the method used (U.S. EPA, 2012). Detection of both the particulate and dissolved fractions of cadmium is considered a best practice for cadmium determination. Hot acid digestion is described in EPA methods 200.7 and 200.8 (U.S. EPA, 1994a, 1994b). Microwave-assisted digestion, outlined in method SM 3030 K (APHA et al., 2017), can also be used for analysis of total recoverable metals for methods that are based on ICP-MS.
7.0 Treatment technology and distribution system considerations
The chemistry of cadmium in the water is complex. It is determined by the pH of the water and the presence of other organic and inorganic ions in solution (Gardiner, 1974a; Yeats and Brewers, 1982; McComish and Ong, 1988; Stephenson and Mackie, 1988; Powell et al., 2011; Crea et al., 2013).
In water, cadmium typically exists in divalent form as free cadmium cation (Cd2+) or one of its hydrated forms (e.g., hexahydrate). It may form mineral precipitates with an oxide, hydroxide, carbonate or phosphate and may also form complexes with various ligands, such as humic acid. Even when cadmium is undersaturated with respect to a precipitate phase, it may associate with solid particles due to the charged nature of the cadmium cations and cadmium complexes. The solubility of cadmium is influenced by the acidity of the water (Gardiner, 1974b; Crea et al., 2013). Acidic environments may cause the dissolution of suspended or sediment-bound cadmium (Evans et al., 1983; Stephenson and Mackie, 1988). Both precipitation/dissolution and adsorption/desorption reactions control cadmium concentrations in water (Rei, 1984; Smedley and Kinniburgh, 2002; Friedman et al., 2010).
Figure 1. Cadmium speciation as a function of pH in solution containing chloride (100 mg/L), sulfate (100 mg/L), and inorganic carbon (100 mg/L). Total cadmium is equal to 1 mg/L (Ford et al., 2007).
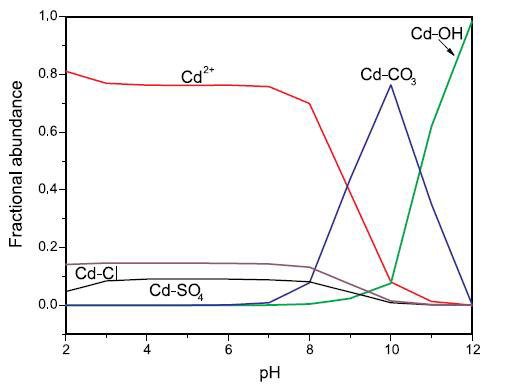
Legend:
Cd-Cl includes CdCl+ and CdCl20
Cd-SO4 includes CdSO40 and Cd(SO4)22-
Cd-CO3 includes CdCO30, CdHCO3+, and Cd(CO3)22‑
Cd-OH includes CdOH+, Cd(OH)20, and Cd(OH)3-
Text Description
A line graph showing the fractional abundance of cadmium as a function of pH, with the vertical axis showing concentrations ranging from 0.0 to 1.0 mg/L and the horizontal axis showing pH ranging from 2 to 12.
From a pH of 2 to a pH of 7; Cd2+ is the predominant species at a concentration remaining consistently near 0.8 mg/L; Cd-Cl remains constant at a concentration near 0.15 mg/L; Cd-SO4 starts at a concentration of 0.05 mg/L at a pH of 2, increasing slightly to 0.1 mg/L at a pH of 3 and remaining constant as pH increases within this range, and; Cd-CO3 and Cd-OH both remain constant at a concentration of 0.0 mg/L within this range.
From a pH of 7 to a pH of 12; Cd2+ decreases in concentration to 0.7 mg/L at a pH of 8, then decreases sharply to a concentration of 0.1 mg/L at a pH of 10, further decreasing to nearly 0.0 at a pH of 11 and remaining at 0.0 mg/L to a pH of 12; Cd-Cl concentration decreases very slightly approaching a pH of 8, then decreases steadily to 0.0 mg/L at a pH of 10, which continues to a pH of 12; Cd-SO4 concentration begins to decrease after a pH of 7, reaches 0.0 mg/L at a pH of 10 which remains constant through a pH of 12; Cd-CO3 concentration begins to increase beyond a pH of 7, reaching about 0.08 mg/L at a pH of 8, then further increases steadily to a maximum of nearly 0.8 mg/L at a pH of 10, then decreases sharply to a concentration of 0.0 mg/L at a pH of 12; Cd-OH concentration begins to increase slightly from 0.0 mg/L at a pH of 8, reaching approximately 0.05 mg/L at a pH of 10, then increases sharply to a concentration of nearly 1.0 mg/L at a pH of 12.
Laboratory experiments have shown that, in the presence of phosphate, cadmium phosphate precipitates mainly as Cd5H2(PO4)4.4H2O, regardless of phosphate concentrations in a solution (Ayati et al., 2000). However, no literature was found on the ability of this cadmium phosphate species to form protective scales in the distribution system.
7.1 Municipal scale
The U.S. EPA (1998) identifies coagulation/filtration, lime softening, ion exchange, and reverse osmosis (RO) as the most effective treatment processes for the removal of cadmium in drinking water.
The selection and effectiveness of each treatment strategy are driven by several factors, including source water chemistry, cadmium concentration, existing treatment processes, operational conditions of a specific treatment method, utility treatment goals, and residual handling concerns and costs.
7.1.1 Conventional coagulation
The principal sources of information on conventional coagulation and lime softening treatments are early jar-test and pilot-scale studies conducted by Sorg et al. (1978). The studies indicated that conventional treatment is pH dependent, with cadmium removal increasing with pH in a pH range of 7.0–9.0. Although both alum and ferric sulphate coagulants exhibited similar removal trends, ferric sulphate produced higher removals than alum at the same pH. A pilot-scale test, using a low alkalinity surface water (50–60 mg/L as CaCO3) treated with a ferric sulphate dose of 30 mg/L and influent cadmium concentrations of 0.028 mg/L and 0.048 mg/L, achieved cadmium removals of 99% (pH 8.8) and 96% (pH 8.7), respectively. When pH was decreased to <7.0, removal rates were reduced to 30% and 25%, respectively. At pHs 8.0, 7.9 and 6.9, an alum dose of 30 mg/L was capable of reducing an average cadmium concentration of 0.04 mg/L by 73%, 65%, and 36%, respectively.
Jar tests indicated that increasing the alum doses linearly increased cadmium removal. At a pH of 8.3, increasing the alum dose from 20 mg/L to 60 mg/L increased cadmium removal from approximately 20% to a maximum of approximately 60%. However, increasing the ferric sulphate dose produced only a slight increase in cadmium removal. The jar tests also indicated that an alum dose of 30 mg/L was capable of achieving a cadmium concentration of 0.01 mg/L in treated surface water when the initial cadmium concentration was approximately 0.02 mg/L or less. Ferric sulphate was more effective than alum, with a dose of 20 mg/L being capable of decreasing an initial cadmium concentration of 0.1 mg/L to 0.01 mg/L at pH 8.7 (Sorg et al., 1978). In a bench-scale study, Najm et al. (2017) reported that an influent cadmium concentration of 2.3 µg/L decreased to below 0.4 µg/L using a ferric chloride dose of 5 mg/L at pH 9.0 and indicated that cadmium removal was not feasible at low pH levels.
7.1.2 Precipitation
Precipitation, followed by settling and filtration processes, is used for treating metals in water. Patterson et al. (1977) determined and compared the minimum solubility of cadmium hydroxide and cadmium carbonate precipitates in a pH range of 6.0–13.0. Data indicated that the residual soluble cadmium concentrations were 126 mg/L and 0.2 mg/L at pHs 8.6 and 10.4, respectively, for a cadmium hydroxide precipitation system. Low soluble cadmium concentrations of 1.2 mg/L and 0.25 mg/L were measured at pHs 8.4 and 10.8, respectively, for a carbonate system with a total carbonate concentration of 10-1.2 mol/L. In another carbonate system (total carbonate concentration of 10-2.7 mol/L), a residual soluble cadmium concentration of 0.6 mg/L was measured at pH 9.5. However, a cadmium hydroxide system had a residual cadmium concentration of 0.2 mg/L at pH 10.4. The authors concluded that the cadmium carbonate precipitation system at a pH of 9.5 provided approximately equal results to the cadmium hydroxide precipitation system at a pH of 10.5.
Early pilot-scale tests indicated that cadmium was effectively removed by lime and excess lime softening. Approximately 0.03 mg/L of cadmium in spiked groundwater was reduced by >93% and >95% at pHs 9.5 and 11.3, respectively. Jar tests achieved an approximately 100% reduction of initial cadmium concentrations of 0.03–10.0 mg/L at pH 11.3 with a high magnesium concentration (21 mg/L). It was suggested that adsorption of cadmium precipitates onto calcium carbonate and magnesium hydroxide flocs was a factor for this high cadmium removal (Sorg et al., 1978). The process is relatively expensive and may be impractical to use for cadmium removal unless hardness reduction is a concurrent treatment goal.
7.1.3 Ion exchange
Although a general review of the literature showed no studies on the use of an ion exchange process for cadmium removal in drinking water, several authors indicated that strong-acid cation (SAC) resins might be effective (Linstedt et al., 1971; Calmon, 1974; Kocaoba, 2003; Dabrowski et al., 2004; Demirbas et al., 2005; Kocaoba and Akcin, 2005; Pehlivan et al., 2006). Calmon (1974) reported the selectivity of SAC (hydrogen form) resin for cadmium to be higher than that for copper, zinc and magnesium and below its selectivity for calcium, silver and barium. Similarly, Demirbas et al. (2005) reported the adsorption capacity of an SAC (hydrogen form) resin for cadmium to be higher than that for copper and lead. The cadmium distribution coefficient, defined as the ratio of the concentration of cadmium ions on the resin to that in aqueous solution, increased for the pH range of 4.0–9.0. Pehlivan et al. (2006) used an SAC resin for metal recovery from aqueous solution and found that the maximum cadmium distribution coefficient (97% recovery) was observed in the pH range of 8.0–9.0. The maximum capacity of the resin for cadmium was calculated as 4.7 meq/g dry resin (264 mg/g).
Weak base anion resins in their non-protonated form exhibit a high selectivity for heavy metals. The nitrogen atoms of the amino functional groups are not protonated at neutral pH and are able to form coordination bonds by donating free electron pairs to the heavy metals (Höll et al., 2002; Zhao et al., 2002). A laboratory-scale weak base anion resin column was capable of reducing an influent cadmium concentration of approximately 92.0 µg/L in spiked tap water to below 1.0 µg/L for 6,000 bed volumes, approaching 5 µg/L at 7,000 bed volumes (Zhao et al., 2002). Testing of ion exchange resins for cadmium removal at pilot-scale level is an important step for utilities when considering this treatment process.
7.1.4 Membrane filtration
Cadmium removal by RO has not been widely studied. An early study reported the results from U.S. EPA pilot plant experiments involving the rejection of cadmium by several RO membranes. The membranes were operated with recovery ranging from 9.8% to 59% and feed pressures of 191–283 lb/sq in. The study found that cadmium removal by various membranes (cellulose acetate, cellulose triacetate, modified cellulose acetate, and thin film composite) ranged between 96% and 99% with a feed concentration ranging from 0.18 mg/L to 3.7 mg/L (Clifford and Sorg, 1986).
Limitations of the RO process include possible membrane scaling, fouling, and failure, as well as higher energy use and capital costs. Calcium, barium, and silica can cause scaling and decrease membrane efficiency. The product water pH must be adjusted to avoid corrosion issues in the distribution system (Schock and Lytle, 2011).
7.1.5 Other technologies
Other drinking water treatment technologies capable of removing cadmium have been developed. Utilities that undertake testing of any technology should determine the efficiency of the selected process for cadmium removal based on their specific water quality.
7.1.5.1 Adsorption
Titanium dioxide: Titanium-dioxide-based granular adsorptive media, used for arsenic removal from drinking water, has also been proven effective for other heavy metals, including cadmium (Swaim et al., 2017; Graver Technologies, 2015).
Activated alumina: In a laboratory study, Naiya et al. (2009) reported a 97% reduction of an initial cadmium concentration of 10 mg/L by a fresh activated alumina at a pH range of 5.0–6.0 and achieved a maximum adsorption capacity of 35 mg Cd2+/g adsorbent. Cadmium hydroxide started to precipitate at pH >7.0. Greater than 90% of cadmium removal was reported using three regeneration cycles.
Iron-coated filter media: Iron-coated sand was investigated for adsorption of metal ions and natural organic matter from water (Edwards and Benjamin, 1989; Ahmedzeki, 2013). Edwards and Benjamin (1989), using a laboratory column packed with Fe-coated sand, reported 89% removal of an initial cadmium concentration of 2.8 mg/L at pH 8.5. Similarly, Ahmedzeki (2013) observed 97% removal of a 15 mg/L cadmium concentration at pH 9.0 in batch experiments.
Additional treatment technologies under evaluation or being researched include zeolites (Sheta et al., 2003; Baker et al., 2009; Batjargal et al., 2011); polyelectrolyte-enhanced ultrafiltration (Ennigrou et al., 2015) and chelating ion-exchange resins (Kawamura et al., 1993; Kosaoba et al., 2003; Fernández et al., 2005; Amara-Rekkab and Didi, 2015).
7.1.6 Distribution system considerations
Primary sources of cadmium in both distribution and household plumbing systems include the deterioration of galvanized steel pipes and, to a lesser extent, leaching from cement-mortar lining and brass materials (Sharrett et al., 1982; Benjamin et al., 1996; Guo et al., 1998; Berend and Trouborst, 1999; Viraraghavan et al., 2000; Barton, 2005; Friedman et al., 2010). Galvanized pipe was generally used in plumbing until the 1960s (Trussell and Wagner, 1996). The National Plumbing Code permitted the use of galvanized steel for pipes in distribution and plumbing systems until 1980 (NRC, 2010). All provinces and territories use the National Plumbing Code as the basis for their plumbing regulations.
The accumulation of trace inorganic contaminants in the drinking water distribution system is a complex function of numerous factors, including the contaminant concentration in the treated water, the pH, and the redox conditions in the distribution system and pipe material. Metal cations (e.g., barium, lead, cadmium) accumulate in the distribution system by adsorption/co-precipitation mechanisms. The accumulation is enhanced at elevated pH levels and when potentially competitive cations (e.g., calcium, magnesium) are present at low concentrations. In particular, cadmium has a strong affinity for hydrous manganese oxides and hydrous iron oxides (Zasoski and Burau, 1988; Grey et al., 1999; Friedman et al., 2010; Hill et al., 2010; Peng et al., 2012). Phosphate, a key component of many corrosion-control programs, is also known to precipitate with metals including cadmium (Ayati and Lundager Madsen, 2000; Snoeyink et al., 2003). Aluminum oxides and alumino-silicates have also been shown to have a significant ability to sorb trace metals, radionuclides, anions, and oxyanions (Kim et al., 2003; Bell and Saunders, 2005). All these oxides, hydroxides, oxyhydroxides, phosphates, and aluminosilicates are sinks for trace inorganic contaminant accumulation in the distribution system and are considered major factors in trace metal partitioning and solubility control (Chao, 1976; Bunn et al., 2002; Schock, M., 2005). Physical or hydraulic disturbances or unstable water chemistry in the distribution system can remobilize contaminants such as cadmium into the bulk water.
In a study of scale and sediment samples collected from the distribution systems of 20 U.S. drinking water utilities supplied by groundwater, surface water and blended water sources, cadmium was found to be the ninth most concentrated of the 12 inorganics analyzed (Friedman et al., 2010; Peng et al., 2012). These authors both reported that cadmium was found in all solids but that its concentration was significantly lower than other metals. The median cadmium concentration of all scale deposits and sediment samples combined was 0.26 µg/g (2.6 × 10-05 weight %), with 10th and 90th percentiles of 0.06 µg/g (6.0 × 10-06 weight %) and 2.8 µg/g (2.8 × 10-04 weight %), respectively. The median cadmium concentrations in scale deposits and hydrant-flush solids were 0.5 µg/g and 0.17 µg/g (5.0 × 10-05 weight % and 1.7 × 10-05 weight %), respectively. Six of the deposit samples with high cadmium concentrations (>3 µg/g) also had a high level of co-occurring manganese (0.3–23.2 weight %). Manganese has been shown to be extremely effective at adsorbing cationic species similar to cadmium (Zasoski and Burau, 1988; Friedman et al., 2010). Friedman et al. (2016) reported low cadmium concentrations in solids collected from hydrant flush samples. Total cadmium measured in these solids ranged from 44.9 µg to 704 µg (from 3.0 × 10-04 to 0.01 weight %). Friedman et al. (2010) reported an estimated cadmium mass of 0.17 lb accumulated on a 100-mile pipe length (based on a 12-in. diameter pipe). The authors noted that, theoretically, 16–26% of the scale deposit would need to be released to exceed 0.005 mg/L of cadmium. Based on these results, the accumulation of cadmium (and its potential release) in distribution systems is not considered significant relative to other inorganic contaminants.
Schock et al. (2008) reported that the lead pipe scales also act as a sink for cadmium. Scale samples collected from 91 pipe specimens of lead and lead-lined service lines from 26 different water distribution systems in the U.S. had an average cadmium concentration of 6.4 µg/g (6.4 × 10-04 weight %) and ranged from 2.0 µg/g (2 × 10-04 weight %) to 308.0 µg/g (3.08 × 10-02 weight %).
Cement-based materials: Cadmium may also enter the distribution system water through leaching from cement-based materials and linings. Guo et al. (1998) conducted laboratory tests to determine the extent of leaching from ductile iron pipes lined in situ with Portland cement (type I) mortar. The pipes were lined, cured and subsequently disinfected in accordance with American National Standards Institute (ANSI)/American Water Works Association (AWWA) standards (AWWA, 2016). The tests were performed using tap water from a New Jersey water distribution system. Under static conditions, the cadmium concentration increased gradually up to 1.1 µg/L during the first five days of the water stagnation period, even though the cement used contained a lower amount of metal than most commercially available cements.
Full-scale tests reported that the leaching of cadmium after an application of cement mortar lining inside of a 615-m water main was low (below 1.0 µg/L). The samples were taken 0.5–11 hours after the pipe was put in use (Zielina et al., 2015). Mlynska and Zielina (2017) reported a low level of cadmium leaching from two pipe specimens coated with different cement linings: prefabricated pipe cement coating and coating prepared on site during a pipe renovation. Both pipe specimens were filled with water collected from the outflow of a water treatment plant (cadmium concentration not reported). Parallel water samples were collected from each pipe specimen following specific periods up to 56 days. Water in the pipes was replaced with fresh water after each analysis. All water samples exposed to both cement coatings had cadmium concentrations ten times lower than 5 µg/L.
7.1.6.1 Premise plumbing consideration
As noted, potential sources of cadmium in drinking water include the deterioration of galvanized pipe and brass materials. The corrosivity of the water, the amount of cadmium in the plumbing materials and the water usage pattern will impact observed cadmium levels in drinking water.
Galvanized pipes: Galvanized steel is an alloy commonly used in plumbing pipes to make them resistant to corrosion by adding a zinc steel (galvanic) coating. The eventual dissolution of zinc from the inner coating of galvanized pipes is a potential source of lead and cadmium since they are present as an impurity in the zinc ore (Hill et al., 2010; AWWA, 2011; Pawlowski et al., 2014). The pH, low alkalinity and water flow are the most influential properties relative to the corrosion of the galvanized pipes (Benjamin et al., 1996; Hill et al., 2010). Studies illustrate how pH could influence the corrosion of the galvanized pipes and potentially release trace metals, such as cadmium, in drinking water distribution system. Kodama et al. (1980) measured corrosion rates of galvanized pipes exposed to Tokyo municipal water and found that the solubility of the zinc carbonate and zinc silicate scales formed on the inner pipe surfaces was minimal at a pH greater than 8.0. A 10-year test program on the corrosion of galvanized steel pipes exposed to Berlin drinking water indicated that the pH of the water influenced the lifetime of zinc coating applied to the pipe’s inner surface. A total loss of zinc coating was observed within 2 years at a pH of 7.0, while the zinc coating was still present after 10 years at a pH of 8.0 (Ruckert and Sturzbecher, 1988). Alkalinity has been found to impede the corrosion of metals, because of the stronger capacity of water systems to minimize the localized pH changes at the metal surface. In laboratory experiments, corrosion rates of galvanized steel coupons exposed to deionized water (negligible alkalinity) were higher than those exposed to water with an alkalinity of 56 mg/L as CaCO3 (Pisigan and Singley, 1985). A high TDS concentration can also have an impact on galvanic corrosion (Hill and Giani, 2011).
Sharrett et al. (1982) reported that water samples collected from homes with galvanized steel pipes had cadmium concentrations at least 10 times higher than samples collected from homes with copper pipes. The reported 50th percentiles of cadmium concentrations in the overnight stagnant water samples from homes with galvanized and copper pipes were 0.63 µg/L and 0.06 µg/L, respectively. Although the ages of the plumbing systems were not identified, median cadmium concentrations were higher (0.8 µg/L) in stagnant water samples from older galvanized pipes than from the newer pipes (0.51 µg/L).
El-Rahaili and Misbahuddin (1995) collected water samples from 40 homes in different locations, representing different plumbing materials and ages. The water supplied to the houses was from a deep aquifer with high hardness and total dissolved solids. It was treated by lime softening followed by RO desalination. The distribution system consisted of ductile iron feeders, PVC distribution mains and high-density polyethylene service connections. The cadmium concentration in all water supplies was below the DL (not provided). The plumbing materials were galvanized steel pipes (88%), PVC pipes (10%) and copper pipes (2%). Four water samples were collected from each home following a specific sampling protocol. For all homes with galvanized plumbing systems, average cadmium concentrations of 1.4 µg/L, 0.8 µg/L, 0.6 µg/L, and 1.2 µg/L were measured, respectively, in (1) a 250 mL sample collected from the kitchen cold water tap in the early morning, (2) a 250 mL sample collected immediately thereafter, (3) a 500 mL sample collected after water was flushed for 5 min, and (4) a sample collected from the garden tap. The authors concluded that elevated levels of cadmium were the result of corrosion and leaching from plumbing systems.
Pieper (2015) analyzed 2,144 first draw samples (i.e., a 250 mL sample collected after 6+hoursof stagnation) submitted by private system homeowners with a variety of materials in their plumbing systems (e.g., brass, solder) and well components (e.g., galvanized iron, brass). The author found that mean, median and 90th percentile cadmium concentrations were all below the DL (<0.1 µg/L) and that only 0.6% of the submitted samples contained cadmium concentrations above 5 μg/L.
Water samples collected at a school with galvanized steel pipes and fittings installed between 1950 and 2008 were separated into two groups based on the MDL for cadmium (0.1 µg/L) (Clark et al., 2015). The authors found that samples (n = 44) with cadmium concentrations greater than 0.1 µg/L also had an average lead concentration of 194 µg/L, while samples with no detected cadmium (n = 48) had an average lead concentration of 18 µg/L. The results imply that the presence of cadmium may serve as an indicator of galvanized steel pipes being a source of lead.
A recent study reported average cadmium concentrations of 434 mg/kg (0.04 weight %) and 299 mg/kg (0.03 weight %) in scale deposits collected from one copper plumbing system (single home) and from four galvanized plumbing systems connected to brass fittings, respectively. The single home originally had a galvanized plumbing system (installed ca. 1923) that was replaced with copper piping in 1965. Both samples also had high average lead concentrations of 2,549 mg/kg (0.25 weight %) and 3,901 mg/kg (0.4 weight %) (Maynard and Wasserstrom, 2017).
Lead pipes: Deshommes et al. (2010) used two sampling protocols to assess the source, parameters and correlation of the release of dissolved and particulate lead and other metals, including cadmium, from 45 homes with lead service lines in the presence of various premise plumbing materials (copper, n = 42; galvanized, n = 1; mix of lead and copper, n = 2). The authors found that, regardless of sampling protocol, they were not able to calculate the average and median concentrations for both particulate (n = 135) and dissolved (n = 45) cadmium species, as the vast majority of the samples were below the DL (0.03 µg/L).
Copper pipes: A study by Viraraghavan et al. (2000) investigated the effect of plumbing materials on the drinking water quality in Regina, Saskatchewan. The City of Regina was divided into five areas and the residences were categorized by age, type of dwelling, and plumbing material (copper and plastic). Three samples were collected from each residence during three rounds of sampling in each of three consecutive months (November to January). The first sample (125 mL) represented the overnight stagnant water in the faucet; the second sample (500 mL) represented the overnight stagnant water in the plumbing system; and the third sample (125 mL) represented the water from the distribution main. The mean cadmium concentration was greater than 5 µg/L in the first round and below 5 µg/L in the next two rounds. Specifically, in samples taken during the first round from all dwellings with copper plumbing, cadmium concentrations ranged from below DL (not provided) to 171 µg/L, below DL to 39 µg/L, and below DL to 102 µg/L in the first, second, and third samples, respectively. Maximum concentrations of 133 µg/L and 101 µg/L were measured in the second and the third rounds, respectively. Cadmium concentrations of 8–38 µg/L were measured in the first samples taken during the first round in the dwellings with plastic plumbing. The concentrations were below 10 µg/L in all water samples taken during the second and third rounds. Most of the samples with cadmium concentrations greater than 5 µg/L were observed during the first sampling of each round, representing leaching from the faucet. The authors observed that the mean cadmium concentration was greater than 5 µg/L in copper plumbing systems less than 5 years old. Cadmium concentrations above 5 µg/L were also observed for plumbing systems more than 40 years old (Viraraghavan et al., 2000).
7.1.6.2 Brass
Plumbing component materials such as brass and bronze found in valves, meters, solders, and other fittings used in distribution and plumbing systems are important factors that affect drinking water quality (Viraraghavan et al., 1999). Brasses are particularly vulnerable to dezincification in low-alkalinity, high-chloride water (Sarver et al., 2011). Several studies assessed the corrosion of brass materials (Samuels and Meranger, 1984; Neff et al., 1987; Schock and Neff, 1988; Gardels and Sorg, 1989) and non-lead-containing solders (Subramanian et al., 1991) as a potential source of cadmium in drinking water. Eight new commercially available chrome-plated brass faucets were tested for leaching of heavy metals, including cadmium. Each faucet was tested with raw surface water before treatment (pH of 7.4), filtered water (pH of 6.3), treated water (pH of 8.6), groundwater (pH of 8.1), and an aqueous fulvic acid solution (pH of 6.2). Cadmium concentrations of <0.05–10 µg/L and of <0.05–4 µg/L were measured in all water samples drawn after a first 24-hour and a second 24-hour period of stagnation, respectively. The highest cadmium concentration of 10 µg/L was observed from a faucet filled with treated water. The authors concluded that the metal concentration in drinking water may increase in new buildings or when new faucets are installed (Samuels and Meranger, 1984). Similarly, a two-week laboratory study was conducted with six new chrome-plated brass faucets. Three of the faucets were filled with municipally treated water (pHs of 8.1–9.1, alkalinities of 82–126 mg CaCO3/L), while the other three were filled with deionized water. Samples were analyzed on alternate days. A cadmium concentration of approximately 3.0 µg/L was measured in the first samples (second day of the test) from the faucets containing municipally treated water, but no cadmium was detected in subsequent samples. Cadmium concentrations were still detected in all deionized water samples at the end of the testing period (DL = 2.0 µg/L). Although a low level of cadmium was detected, the authors concluded that chrome-plated brass faucets could be a source of heavy metals in drinking water, particularly when the water was stagnant in the pipe (Schock and Neff, 1988).
A pilot-scale study assessed the leaching of metals from copper pipes with non-lead-based solder joints (tin/antimony, tin/silver and tin/copper/silver). Water samples were collected after 0.17, 0.5, 1, 3, 5, 7, and 24 hours, and 3, 7, 28, and 90 days. After each exposure period, the water was drained and the pipes were refilled. The study reported that the cadmium concentrations were below the MDL of 0.03 µg/L in all water samples for up to 28 days (Subramanian et al., 1991).
7.1.7 Mitigation strategy for distribution and plumbing systems
As discoloration (red water) episodes can be accompanied by the release of accumulated contaminants (i.e., metals), these events should trigger maintenance actions, such as systematic unidirectional flushing of the distribution system, to ensure that all particles are flushed out before the water reaches the consumer (Vreeburg, 2010; Friedman et al., 2016). However, unidirectional flushing may not be effective in pipe types such as cement-lined iron and plastic pipes because thin films and cohesive, manganese-based layers are formed rather than scales. In these cases, more aggressive cleaning techniques may be warranted (Friedman et al., 2016).
Friedman et al. (2010) identified several key water quality conditions that should be controlled in order to maintain water stability for deposited trace inorganic contaminants. These include the pH, the oxidation-reduction potential and the corrosion-control measures. It is also important to avoid the uncontrolled blending of surface water with groundwater and of chlorinated water with chloraminated water. Maintaining stability of the drinking water in the distribution system and implementing of an appropriate cleaning network program should lead to reduce discoloration episodes and metal levels, and provide a high water quality to the consumers.
Generally, the level of trace metals increases upon stagnation of the water but may vary according to water quality. As such, flushing the water present in the plumbing system can reduce the levels of metals and, therefore, is considered a mitigation strategy. Extensive flushing following long stagnation periods (vacation periods, weekends) may therefore be advisable to provide suitable water quality.
Additionally, if galvanized steel or brass materials contribute to cadmium in drinking water, replacement with materials that have been certified by an accredited certification body as meeting the appropriate NSF International (NSF)/ANSI is recommended (discussed in Section 7.2).
7.2 Residential scale
Health Canada does not recommend specific brands of drinking water treatment devices, but it strongly recommends that consumers use devices that have been certified by an accredited certification body as meeting the appropriate NSF/ANSI standards. These standards have been designed to safeguard drinking water by helping to ensure the material safety and performance of products that come into contact with drinking water. Certification organizations provide assurance that a product conforms to applicable standards and must be accredited by the Standards Council of Canada (SCC). In Canada, the following organizations have been accredited by the SCC to certify drinking water devices and materials as meeting NSF/ANSI standards (SCC, 2020):
- CSA Group;
- NSF International;
- Water Quality Association;
- UL LLC;
- Bureau de normalisation du Québec (available in French only);
- Truesdail Laboratories; and
- International Association of Plumbing and Mechanical Officials.
An up-to-date list of accredited certification organizations can be obtained from the SCC.
Water treatment technologies able to be certified to NSF standards for reduction of cadmium include adsorption, RO and distillation. Applicable standards are NSF/ANSI Standards 53 (NSF/ANSI, 2016a), NSF/ANSI Standards 58 (NSF/ANSI, 2017a), NSF/ANSI Standards 62 (NSF/ANSI, 2016b). These standards require testing of a device for the reduction of total cadmium from an average influent of 0.03 mg/L to a maximum effluent of 0.005 mg/L.
A consideration for limiting exposure to cadmium is to specify that drinking water materials (components and treatment chemicals) meet health-based standards. These standards ensure that materials meet health-based requirements and are safe for use in potable water applications. NSF/ANSI Standards 61 (NSF/ANSI, 2017b) and 60 (NSF/ANSI, 2017c) require that the concentration of cadmium not exceed the single product allowable concentration of 0.0005 mg/L in components and treatment chemicals, respectively.
8.0 Kinetics and metabolism
8.1 Absorption
The absorption of radioactive cadmium following ingestion has been studied in human subjects, and reports of absorption range from approximately 4.6% to 10.6% (Nordberg et al., 2007). The absorption of cadmium from ingestion has been recently reviewed in Health Canada’s risk assessment of cadmium in foods (2018a). The bioavailability of cadmium from drinking water has been reported to be similar to that of food (Ruoff et al., 1994). It has been noted the bioavailability of cadmium through foods is generally slightly lower in experimental animals (0.5–3.0%) than in humans (1–10%) (JECFA, 2011). According to animal studies, absorption of ingested cadmium is dependent on a number of factors, including type of cadmium compound, dose, frequency of exposure, levels of other dietary components, and age of animal. Absorption of cadmium may be more elevated if levels of other metals in the body (calcium, iron, and/or zinc) are low (Reeves and Chaney, 2008; Nawrot et al., 2010; ATSDR, 2012). In addition, diet composition and status of the digestive tract are likely to have a greater influence on bioavailability than the exposure medium for cadmium (Ruoff et al., 1994).
After ingestion, the absorption of cadmium follows a two-step process, whereby cadmium is first absorbed from the gastrointestinal tract (resulting in a rapid accumulation of cadmium in the mucosa), and subsequently slowly transferred to the systemic circulation system (Zalups and Ahmad, 2003).
8.2 Distribution
Following absorption, a number of different mechanisms have been proposed for the subsequent transport of cadmium in the body, including metal transport proteins, calcium ion channels, and amino-acid transporters. Endocytosis of Cd-metallothionein (Cd-MT) complexes is also possible (Zalups and Ahmad, 2003). Cadmium is first transported to the liver, where it is taken up into hepatocytes and induces metallothionein (MT) synthesis. Subsequently, much of the Cd-MT is distributed to the kidney, where it is filtered through the nephron’s glomerular membrane and is rapidly and almost completely taken up by the cells of the proximal tubules (Nordberg et al., 2007). Although cadmium is distributed throughout the body, examination through autopsies has revealed that the majority of the cadmium body burden is in the kidney, followed by the liver and muscle (JECFA, 2011). Although the cadmium burden in the kidney nears zero at birth, the concentration has been shown to increase in a linear fashion and peak near age 50 or 60 (ASTDR, 2012).
8.3 Metabolism
Cadmium is not metabolized by the human body. The divalent ion is not subject to changes in oxidation state. Cadmium can, however, bind anionic groups (including albumin and metallothionein), which enables transport in plasma (Roberts and Clark, 1988; ASTDR, 2012).
8.4 Excretion
Cadmium is excreted in both urine and feces. Excretion of cadmium via the urine is proportional to the body burden of cadmium, which increases with age (Nordberg et al., 2007). The individual variation in excretion via the urine can be large, depending on the existence of renal damage. Given that cadmium is poorly absorbed, fecal excretion nears the ingested dose of cadmium. Further, slow excretion of absorbed cadmium is reported to result in a long biological half-life. The half-life of cadmium in humans was estimated to range from 10 to 30 years, with significant accumulation occurring in the kidney (Nordberg et al., 2007).
8.5 Physiologically based pharmacokinetic models
A number of models have been created to describe the toxicokinetics of cadmium in mammals (ATSDR, 2012). The Nordberg-Kjellström model is most widely used for human health risk assessment, as it is based on data from humans, whereas other models describe toxicokinetics in laboratory animals (Nordberg and Kjellström, 1979). This linear, multi-compartmental model describes the toxicokinetics of cadmium in humans via the oral and inhalation routes of exposure and presumes the kidney and liver to be the primary organs for cadmium accumulation. As indicated in a detailed summary by ATSDR (2012), many variations on this model have been developed.
In 2011, the Joint FAO/WHO Expert Committee on Food Additives (JECFA) used a one-compartment toxicokinetic model based on Amzal et al. (2009) to estimate the dietary exposure of cadmium (dose rate) that would translate to a concentration of urinary cadmium associated with the breakpoint for renal tubular dysfunction (JECFA, 2011; Health Canada, 2018a). JECFA used a modified version of the Nordberg-Kjellström model and quantified the interindividual variability of the cadmium half-life within the population. Two-dimensional Monte Carlo simulations were run to establish the 95th percentile CIs. A sensitivity analysis was performed to demonstrate the robustness of the simplified, one-compartment model for cadmium risk assessment (Amzal et al., 2009).
9.0 Health effects
The health effects of cadmium from the oral route of exposure have been reviewed in other assessments (EFSA, 2009a; JECFA, 2011; ATSDR, 2012; Health Canada, 2018a). Health Canada (2018a) has recently conducted a hazard assessment for cadmium in foods; the reader is referred to this document as a complementary resource to the present assessment for cadmium in drinking water. For this 2018 hazard assessment, available data including comprehensive risk assessments and supplemental analyses (EFSA, 2009a, 2009b, 2011; JECFA, 2011; ATSDR, 2012), and published primary sources were reviewed. More specifically, studies concerning metabolic fate, toxic endpoints assessed in feeding studies conducted in experimental animals and in vitro systems (including effects on the kidney, effects on bone and calcium metabolism, carcinogenicity and genotoxicity) and human studies investigating associations between exposure to cadmium and effects on the kidney, bone and calcium metabolism, and development of cancer were considered. As described below, the kidney and bones appear to be the most sensitive targets of cadmium-induced toxicity.
9.1 Effects in humans
9.1.1 Acute toxicity
Acute gastroenteritis was reported following high oral exposures to cadmium used in the plating of cooking utensils and containers (Nordberg et al., 2007). Bernard and Lauwerys (1984) reported that lethal doses of cadmium were 350–8,900 mg/person.
9.1.2 Sub-chronic and chronic toxicity and carcinogenicity
9.1.2.1 Renal effects
The development of renal toxicity following oral exposure to cadmium has been extensively studied and reviewed in the primary literature, and has been noted as a sensitive and key health endpoint for the oral route of exposure in numerous published risk assessments (EFSA, 2009a, 2011; JECFA, 2011; Health Canada, 2018a). These risk assessments are based on a large group of epidemiological studies that have been published and summarized in a meta-analysis (EFSA, 2009a).
Cadmium exposure is well known to result in damage of the nephron’s proximal tubule, causing impaired reabsorption of low molecular weight proteins and enzymes by the kidney (EFSA, 2009a). Under normal circumstances, proteins are filtered by the nephron’s glomerulus, and are reabsorbed by the proximal tubule. Early signs of cadmium-induced renal toxicity can be measured by the presence of low molecular weight proteins such as β2-microglobulin (B2M) and retinol binding protein (RBP) in the urine, which reflect impaired reabsorption by the proximal tubule (EFSA, 2009a; Health Canada, 2018a). It is worth noting that the European Food Safety Authority (EFSA) (EFSA, 2009a) considered B2M to be the most sensitive and reliable biomarker of renal dysfunction. Increased urinary excretion of these proteins (above 300 µg/g creatinine of B2M) is indicative of kidney damage and is considered an adverse effect in health risk assessments (EFSA, 2009a; JECFA, 2011).
Another biomarker that has been used as a reliable indicator of injury is N-acetyl-β-D-glucosaminidase (NAG). NAG is a lysosomal enzyme that is frequently used to assess tubular cell damage induced by cadmium (Prozialeck and Edwards, 2010). NAG is present in high concentrations in the proximal tubule. Its presence in urine is indicative of leakage of intracellular contents.
Existing epidemiological studies on renal effects resulting from oral exposure to cadmium have been comprehensively summarized and analyzed by the JECFA and the EFSA. Oral exposure to cadmium is reported to result in the presence of low molecular weight proteins in the urine. A number of epidemiological studies look to the urinary concentration of cadmium (UCd) and low molecular weight proteins such as B2M as biomarkers of interest in evaluating potential harm following exposure to cadmium (EFSA, 2009a; JECFA, 2011). Analyses of these epidemiological studies are extensively reviewed, compared, and analyzed in the risk assessment of cadmium in foods (Health Canada, 2018a).
In 2011, JECFA reviewed the epidemiological evidence concerning health effects from cadmium exposure, and concluded that a meta-analysis conducted by EFSA was most appropriate in identifying a range of biomarkers that are associated with renal dysfunction (EFSA, 2009a; JECFA, 2011). In both reports, the epidemiological evidence was examined to determine associations between biomarkers of exposure (UCd) and effect (B2M for tubular proteinuria, and NAG for cellular damage). A toxicokinetic model was then used to predict the relationship between UCd and dietary intake (Amzal et al., 2009; EFSA, 2009a; JECFA, 2011).
The EFSA report consisted of a comprehensive systematic review of the literature pertaining to epidemiological and clinical studies that examined the relationship between cadmium in urine (adjusted for creatinine) and biomarkers of effect that are indicative of renal toxicity. A total of 35 epidemiological studies were identified from this review. Data was compiled into an aggregate data set of 165 matched pairs of group means for UCd and B2M using Cochrane methodology. Of the more than 30,000 individuals included in the dataset, most were females of Asian descent, with an age distribution centered around 50 years (EFSA, 2009a; Health Canada, 2018a). Analysis of the group mean data was conducted using the Hill model, and a lower 95% confidence limit on the benchmark dose (BMD) for a 5% response (BMDL05) for urinary cadmium concentration of 4.0 µg/g creatinine was identified based on a cut-off point of 300 µg/g creatinine for B2M (EFSA, 2009a).
Despite the fact that the group means used accounted for some interindividual and inter-study variability in B2M and UCd levels, EFSA concluded that there was some additional variability in UCd that remained unaccounted for because group means were used in the calculation of ranges rather than individual data points. For this reason, EFSA applied an adjustment factor of 3.9, which was derived using WHO guidance (WHO, 2005). Finally, the BMDL05 was divided by the adjustment factor to establish a reference value of 1 µg/g creatinine, which could be used as a health-based value (EFSA, 2009b).
In its 2011 assessment, JECFA used a different approach from EFSA to analyze the epidemiological data from the meta-analysis. Given that individual data were not used, it was thought that the reported variation in B2M could be attributed to the variation of UCd within a group, and that the BMD approach used was not appropriate to model the variation in the cause-effect relationship. A biexponential model was used to show the breakpoint for increased slope for B2M and UCd. The breakpoint, characterized by a sharp increase in B2M, was considered representative of the onset of pathological changes reflective of damage to renal tubules. This breakpoint was reported as 5.24 µg/g (4.95 µg/g and 5.57 µg/g for the 5th and 95th percentiles, respectively) creatinine for the population aged 50 and above (JECFA, 2011).
In order to convert the UCd concentration associated with effect into a dose, both JECFA and EFSA used toxicokinetic modelling. A one-compartment model developed by Amzal et al. (2009) (see Section 8.5) was used to this end (EFSA, 2009a; JECFA, 2011). JECFA also used Monte Carlo simulation to estimate the 5th and 95th CIs at the identified breakpoint. In order to account for the interindividual variability in toxic response to cadmium in the kidney (i.e., the variation in B2M in urine), JECFA introduced a toxicodynamic variable of 3 into the toxicokinetic model. A dietary exposure of 1.2 µg/kg bw per day (0.8 µg/kg bw per day for the 5th percentile) was calculated to correspond to a UCd concentration of 5.24 µg/g creatinine. It was recognized that this value could be represented as a tolerable monthly intake of 25 µg/kg bw per month (JECFA, 2011).
Health Canada’s assessment of both the EFSA (2009a) approach and the JECFA (2011) approach recommended the adoption of the tolerable monthly intake of 25 µg/kg bw per month established by JECFA (Health Canada, 2018a). Although these approaches were similar, the difference between them was deemed primarily due to the way in which the assessments accounted for the use of summary data from the meta-analysis. An independent sensitivity analysis using the conventional uncertainty factor for interindividual variability was conducted by Health Canada (2018a). A reference value similar to the value used by JECFA to establish its toxic reference value was obtained.
Overall, Health Canada selected the JECFA toxic reference value as it used the methodological approach which best reflects the available data. It was noted, however, that the outputs of either method are statistically very similar and within the range (approximately 2-fold) that may be considered negligible in light of other uncertainties already introduced into the analyses (Health Canada, 2018a, 2018b).
9.1.2.2 Bone effects
Cadmium exposure has long been associated with reduced bone mineral density, osteoporosis and fractures. Early reports of this effect came from epidemiological studies conducted in Japan, in areas along the cadmium-polluted Jinzu River. Several women were reported to have developed Itai-itai disease, which is manifested as both renal injury (impaired tubular and glomerular function) and bone injury (osteomalacia and osteoporosis) (Nordberg, 2009). A number of epidemiological studies have since reported associations between chronic exposure to low levels of cadmium and effects such as osteoporosis, risk of fracture, and reduced bone mineral density. Health Canada (2018a) reviewed these studies and found their results to be inconsistent. Given the complexity of assessing osteoporotic fracture risk and accurately determining cadmium exposures in the older population based on urinary cadmium alone, it was deemed premature to base a risk assessment on such effects (Health Canada, 2018a).
Similarly, EFSA (2009c) concluded that although exposure to cadmium has the potential to result in altered bone mineralization and increased risk of osteoporosis, the dose-response relationships are difficult to characterize. For this reason, EFSA did not include these effects in its meta-analysis of epidemiological studies.
Studies subsequent to EFSA’s 2009 meta-analysis were surveyed. Although associations were reported, the studies did not justify the use of bone effects as a key endpoint for the purpose of risk assessment (Health Canada, 2018a). Chen et al. (2013) reported a BMDL05 value for UCd of 2.14µg/g creatinine in Chinese women with decreased bone density, indicative of increased risk of osteoporosis. In contrast, an investigation in Japan of 429 women above age 39 did not report a significant correlation between the parameters of ultrasonic bone evaluation and mean UCd levels of 1.93 µg/g creatinine (Osada et al., 2011). An investigation by Suwazono et al. (2010) examined bone-related effects in a group of 794 Swedish women aged 53–64. The study reported a number of BMDLs (lower 95% confidence limit on the benchmark dose), the lowest of which was 1.0 µg/g creatinine for UCd, established for risk of low bone mineral density. More recently, a longitudinal study of children in Bangladesh reported an association of cadmium exposure with several bone-related biomarkers, although this study did not measure bone density to determine whether this would result in functional changes in bone health (Malin et al., 2019). The authors indicated that more research is needed to in other populations to characterize the generalizability of the results.
Despite the inconsistency in epidemiological findings, and the limitations that preclude the use of bone effects as a key endpoint in this risk assessment, it should be noted that the effects reported in studies finding a positive association between cadmium exposure and effects on bone were associated with exposures in a range similar to exposures associated with renal effects. Although effects on bone from chronic low-level exposure to cadmium have been reported to occur at lower doses than kidney dysfunction in animal studies, the results from epidemiological studies are inconsistent (Health Canada, 2018a). Levels of UCd associated with potential bone effects from epidemiological studies ranged from approximately 0.5 µg/g creatinine to approximately 2 µg/g creatinine, although some studies also reported no observed effects at these levels (Health Canada, 2012).
9.1.2.3 Carcinogenicity
Cadmium and cadmium compounds have been classified as Group 1, “carcinogenic to humans,” by the International Agency for Research on Cancer (IARC, 2012). This classification was based on sufficient evidence of carcinogenicity in humans (lung, kidney and prostate cancers in workers exposed occupationally by inhalation) and sufficient evidence of carcinogenicity in animals. Despite this classification of cadmium, which focuses on the inhalation route of exposure, epidemiological evidence linking oral cadmium exposure to cancer is limited. To date, the epidemiological evidence linking dietary exposure to low levels of cadmium with human cancers is preliminary. The dose-response data are not considered a sufficient basis for a quantitative risk assessment. Further research is needed to clarify the contribution of dietary exposure to cadmium with the overall cancer risk associated with cadmium (Health Canada, 2018a). Although studies explicitly investigating exposure to cadmium via the oral route were not conducted, there have been some environmental studies from polluted areas that measured biomarkers of cadmium exposure in blood and/or urine. In some cases, these studies were reflective of exposure from combined inhalation and ingestion, and thus conclusions are not necessarily reflective of toxicity from oral exposure alone.
Studies examining prostate cancer risk have proved inconclusive, as noted by the IARC. Although environmental exposure to cadmium has been reported to be associated with increased incidence of prostate cancer (Zeng et al., 2004; Vinceti et al., 2007), these studies did not exclusively measure or quantify oral exposures or address causality. Other studies failed to find associations between environmental exposure to cadmium and prostate cancer risk (Platz et al., 2002; Chen et al., 2009). An evaluation of prostate-specific antigen levels for 1,320 men over age 40 in the U.S. National Health and Nutrition Examination Survey (NHANES) study found little evidence for an association with elevated cadmium levels (van Wijngaarden et al., 2008).
Additional studies have reported increased incidences or risks of bladder, pancreatic and endometrial cancer with elevated levels of blood or urinary cadmium (Kriegel et al., 2006; Kellen et al., 2007; Akesson et al., 2008). Epidemiological studies that examined associations between environmental exposure to cadmium and cancer have been reviewed (Satarug et al., 2010). Studies in polluted areas in Japan found a higher risk of cancer mortality in individuals with urinary B2M levels ≥1000 µg/g creatinine, although this increase in B2M was not necessarily associated with increased cancer incidence. The study authors indicated that increased investigation is required before drawing a conclusion for an association between cancer risk and environmental exposure to cadmium (Nishijo et al., 2006; Arisawa et al., 2007). A study examining NHANES participants found an association between cadmium exposure and lung cancer, non-Hodgkin lymphoma, and pancreatic cancer mortality in men but not in women (Adams et al., 2012). It should be noted that the geometric mean for UCd for the NHANES study was reported as 0.252 µg/g creatinine in men and 0.352 µg/g creatinine in women.
9.1.2.4 Other effects
JECFA did not consider any other non-renal effects to be as sensitive as the renal endpoint for cadmium-induced toxicity. Health Canada (2018a) considered the sensitivity of bone effects following exposure to elevated levels of cadmium in food. Besides the decreased bone mineral density and increased osteoporosis, and the carcinogenicity reported in previous sections, other effects that have been reported in epidemiological studies include diabetes, neurotoxicity, cardiovascular disease, and hypertension (JECFA, 2004, 2011; EFSA 2009a; Health Canada, 2018a). In its 2009 meta-analysis of epidemiological effects, EFSA (2009c) noted that the results of these studies were too preliminary to serve as the basis of its evaluation.
A number of these other health effects have been reviewed in Satarug et al. (2010). Increased risk of pre-diabetes and diabetes was reported in individuals with urinary cadmium levels of >2µg/g creatinine as compared to individuals with levels of <1µg/g creatinine (Schwartz et al., 2003). Another study that investigated tubular nephrosis in Chinese patients with diabetes reported an increased risk in tubular impairment for individuals with UCd levels of ≥1 µg/g creatinine compared with those whose levels were below 1 µg/g creatinine (Chen et al., 2006). Elevated cadmium exposure has also been associated with increased cardiovascular toxicity (Satarug et al., 2010). In a polluted area of Japan, significant increased risk of mortality for cerebral infarction in men was reported for UCd levels of ≥1000 µg/g creatinine (Nishijo et al., 2006). Smoking is an important confounder in measuring the effect of cadmium on the cardiovascular system given that cadmium levels are especially high in tobacco smoke. Epidemiological studies that have investigated this possible effect have reported conflicting findings (ATSDR, 2012).
9.1.3 Developmental and reproductive toxicity
Data available on the developmental and reproductive effects in humans resulting from exposure to cadmium are limited. Some studies have investigated the relationship between exposure to cadmium and decreased birthweight, but most have not found a significant association (ATSDR, 2012). No association was reported between background cadmium concentrations in blood (average of 0.21 µg/L) and neurodevelopmental endpoints in two-year-old children (Cao et al., 2009).
Epidemiological studies have revealed the possibility of altered hormone levels and sperm quality in men with high exposures to cadmium. In women, one study reported an association between high blood cadmium levels (0.5–8.5 µg/L) and increased incidence of endometriosis, while another did not report an association (ATSDR, 2012). However, results of these studies are inconsistent and have a number of confounding factors, and levels of exposure associated with these effects far exceed doses associated with renal dysfunction.
9.2 Effects on experimental animals
9.2.1 Acute toxicity
JECFA (2001) reported oral lethal dose 50 (LD50) values of 100–300 mg/kg for cadmium exposure in rats and mice. High oral exposures resulted in epithelial desquamation and necrosis of the intestinal and gastric mucosa, in addition to effects on the kidney, liver, and heart (ATSDR, 2012). Very young animals are reported to have lower LD50 values than adults, presumably because developing organisms have greater fractional absorption; LD50 values for 2-week-old rats and 54-week-old rats were reported to be 47 mg/kg bw and 109 mg/kg bw, respectively (ATSDR, 2012).
9.2.2 Short-term exposure
Sub-chronic oral exposure studies in animals have primarily reported renal toxicity and bone effects to be the most sensitive endpoints of cadmium toxicity. Other effects from shorter exposure that have not resulted in lethality include developmental effects (decreased growth and pup/fetal bw), reproductive effects (testicular atrophy, altered hormone levels), liver hemorrhages, intestinal tract and stomach irritation, and immunological, neurological and hematological effects (ATSDR, 2012).
9.2.3 Long-term exposure and carcinogenicity
9.2.3.1 Kidney effects
The kidney is considered a critical organ for cadmium toxicity, and renal effects have been reported in a number of species, including mice, rats, rabbits, dogs, and monkeys (WHO, 1992; ATSDR, 2012). The first sign of kidney toxicity induced by cadmium is the presence in the urine of low molecular weight proteins such as B2M and enzymes. This endpoint, known as proteinuria, is reflective of impaired tubular reabsorption and renal damage (Prozialeck and Edwards, 2010; ATSDR, 2012; Health Canada, 2018a). Studies in a number of animals orally exposed to cadmium through drinking water or diet have reported an increase in cadmium in the renal cortex over time. Examination of the induced damage was characterized by tubular injury. Reported ranges for no-observed-adverse-effect levels (NOAELs) and lowest-observed-adverse-effect levels (LOAELs) for renal effects of cadmium chloride administered to various animals in drinking water were 0.4–2.6 mg/kg bw per day and 1.5–15 mg/kg bw per day, respectively (JECFA, 2011). It was noted that effects in animals were generally found when levels of cadmium in the renal cortex were of 200–300 µg/kg wet weight, and that such concentrations resulted from exposures of 1–10 mg/kg bw per day (JECFA, 2011).
Exposure of female Sprague–Dawley rats to 200 ppm cadmium in drinking water for a period of 11 months resulted in proteinuria, as measured by the presence of high molecular weight proteins in the urine (Bernard et al., 1981). The observed effect coincided with the levelling off of cadmium concentrations in the renal cortex of the kidney and the liver. Hypercalciurea following cadmium exposure has also been reported as an indicator of impaired renal reabsorptive capacity (Prozialeck and Edwards, 2010).
Glomerular filtration becomes impaired with additional/subsequent exposure to cadmium, resulting in increases in serum creatinine and blood urea nitrogen concentrations. Sclerosis of the glomeruli has been reported, in addition to various changes to the cells of the proximal tubule (JECFA, 2011; Health Canada, 2018a). It should be noted that the reported changes in kidney function following exposure to cadmium have been accompanied by morphological changes in nephron structure (interstitial fibrosis and thickening of the basement membrane of the proximal tubular cells, sclerosis of glomeruli) (JECFA, 2011).
9.2.3.2 Bone effects
The effect of cadmium on bone has been reported as a sensitive endpoint for toxicity. Studies have reported effects occurring in the dose range where renal toxicity is observed, and at lower doses (Jarup et al., 1998; JECFA, 2011; Health Canada, 2018a). Cadmium is known to directly affect bone mineralization by causing abnormal calcium homeostasis (Jarup et al., 1998; Yokota and Tonami, 2008). Cadmium can also indirectly affect bone strength by impeding calcium absorption through vitamin D hydroxylation (Jarup et al., 1998). An increase in urinary excretion of calcium has been noted to occur before the onset of kidney damage in rats, which can result in decreased bone density, osteopenia and osteoporosis in females over time (Brzóska and Moniuszko-Jakoniuk, 2005; Brzóska et al., 2005; Bhattacharyya, 2009).
Rats exposed to 1 µg/mL of cadmium in drinking water (intakes of 0.059–0.219 mg/kg bw per day) from weaning to 24 months of age were reported to have demineralized vertebrae with decreased strength. Bone mineral density was lower in females, and calcium excretion increased approximately two-fold over a 3-month period (Bhattacharyya, 2009). Age is also reported to be a factor that can influence the severity of effects observed in animals. Skeletal damage resulting from cadmium exposure in rats was significantly greater when exposure was during the rapid growth phase rather than in adulthood (Brzóska et al., 2005; Bhattacharyya, 2009).
Cadmium exposure has been shown to result in a reduction in bone formation activity, and changes in bone demineralization have been demonstrated in organ culture. Increased calcium excretion in rats has also been reported within hours of exposure (Bhattacharyya, 2009).
9.2.3.3 Carcinogenicity
Most available toxicological information stems from inhalation exposures and information regarding carcinogenicity via the oral route is limited. Oral studies in rats have indicated an increase in the incidence of tumours in the prostate at high doses. Increased incidence of leukemia, prostate and testicular tumours were reported in rats who were exposed to approximately 1.75–14 mg Cd/kg bw per day (25–200 ppm in diet) for 77 days, although no clear dose-response relationship was observed (Waalkes and Rehm, 1992). Tumours of the prostate were reported at doses not known to cause testicular toxicity or when this toxicity was prevented with co-administration of zinc. It was postulated that a reduction in androgen production may be responsible for the lower incidence of prostate tumours observed at higher doses of cadmium, as prostate tumours are often testosterone dependent (Jarup et al., 1998). However, the relevance of this endpoint in humans was questioned in other assessments, given the anatomical differences between the rat and human prostates (JECFA, 2011).
9.2.3.4 Other effects
Oral exposure to cadmium has also been associated with a number of other less sensitive endpoints in laboratory animals, including effects on the immune, cardiovascular, and nervous systems (WHO, 1992). Reproductive and developmental effects were observed in a number of studies; they are summarized in Section 9.2.5.
9.2.4 Genotoxicity
9.2.4.1 In vitro findings
Investigations using bacterial assays and standard mammalian assays have indicated that cadmium is generally not mutagenic and that any effects observed are weak or have been restricted to high-exposure concentrations. Rather than direct genotoxicity, other secondary mechanisms are postulated to be responsible for cadmium’s reported carcinogenic effects (EFSA 2009a; Hartwig, 2010; JECFA, 2011). Studies investigating the in vitro genotoxicity of cadmium in animal assays have been summarized to indicate evidence for clastogenic effects, including micronuclei and chromosomal aberrations, sister chromatid exchange, and induction of DNA damage in various human and animal cell types (Waalkes, 2003; Joseph, 2009; ATSDR, 2012).
9.2.4.2 In vivo findings
In vivo investigations of occupationally exposed humans, mice, rats, and hamsters all have similarly suggested evidence for clastogenicity. Though not always consistent, reports have generally revealed positive results for chromosomal and micronuclei aberrations and for sister chromatid exchange (ATSDR, 2012).
9.2.5 Reproductive and developmental toxicity
A range of developmental effects has been reported in experimental animals. These effects include decreased fetal weight, increased fetal mortality, and skeletal malformations, which occur at doses that cause maternal toxicity. Developmental neurobehavioural effects have been reported at levels where maternal toxicity has not been observed, indicating that these represent a sensitive endpoint (JECFA, 2004). Neurodevelopmental effects that have been reported in the literature include reduced locomotor exploratory activity, neurobehavioural function, and neurochemical alterations (ATSDR, 2012). These effects were generally reported in rats at doses higher than the doses at which effects are reported in the kidney.
9.3 Mode of action
9.3.1 Kidney effects
The kidney is a sensitive target of cadmium-induced toxicity via the oral route of exposure. Cadmium accumulates in the cells of the proximal tubule in the renal cortex, resulting in morphological and functional changes in the kidney. Reabsorption of low molecular weight proteins and enzymes is impaired, as evidenced by their presence in urine (Prozialeck and Edwards, 2010).
The precise mechanism by which cadmium induces nephrotoxicity remains to be elucidated, although metal-binding proteins known as MTs are thought to play an important role in modulating the toxicity. Cadmium toxicity in the kidney occurs when a certain threshold level of cadmium is reached in the renal cortex. It is postulated that endogenous MTs retain cadmium in the tubular cell, but once the ability of the kidney to neutralize intracellular cadmium with MT is exceeded (beyond a critical concentration of cadmium), free cadmium ion levels increase and damage occurs (Sabolić et al., 2010). The resulting damage has been reported to include disruption of ion transport homeostasis, impaired control of biological cations, and disruption of cell signalling pathways. In the mitochondria, cadmium inhibits the respiratory chain and reactive oxygen species are generated, inducing oxidative stress (Cuypers et al., 2010).
9.3.2 Bone effects
Exposure to cadmium has also been associated with osteomalacia, which is a condition of defective bone mineralization. Following high levels of cadmium exposure, this condition was originally thought to be secondary to the observed renal effects, including reduced generation of vitamin D and calcium reabsorption. Animal studies, however, have demonstrated increased bone loss prior to the development of renal dysfunction. This finding raises the possibility that cadmium may affect bone mineralization directly, and uncertainty remains regarding the mechanisms by which cadmium induces bone effects (Bharracharyya, 2009; Health Canada, 2018a). More recently, it has been demonstrated that cadmium chloride suppresses the osteogenesis of bone marrow mesenchymal stem cells by inhibiting the Wnt/β-catenin pathway, indicating another possible mechanism for cadmium-induced bone injury (Wu et al., 2019).
10.0 Classification and assessment
Cadmium has been classified as Group 1, “carcinogenic to humans,” by the IARC, based on sufficient evidence of carcinogenicity in animals and in humans (lung, kidney and prostate cancer in workers exposed occupationally by inhalation). This classification focuses on the inhalation route of exposure, and epidemiological evidence linking oral cadmium exposure to cancer is limited (Health Canada, 2018a). As outlined in Health Canada’s recent assessment, current epidemiological evidence linking dietary exposure to low levels of cadmium with human cancers is only preliminary. The available dose-response data is not considered an adequate basis for a quantitative risk assessment. Further research is needed to determine whether dietary exposure to cadmium contributes to the overall risk (Health Canada, 2018a). Although there are deficiencies in the data for carcinogenicity via the oral route, data in animals and humans suggest that cadmium is not a direct-acting genotoxin, and a threshold may therefore exist.
At present, renal toxicity is the best-characterized sensitive endpoint of concern for oral cadmium exposure. Exposure to high levels of cadmium has been reported to result in bone effects, including osteomalacia and osteoporosis. However, some of these effects may be secondary to the effects of cadmium on the kidney (including reduced conversion of vitamin D and reduced reabsorption of calcium by the proximal tubule), and there remains uncertainty with respect to the mechanism by which cadmium induces these effects. Bone effects following exposure to cadmium have been reported at lower doses than those associated with renal effects in animal studies, although results from epidemiological studies have been inconsistent. A number of challenges in interpreting the results of these cross-sectional epidemiological studies have been identified, including the timing of the typical loss of bone density. Bone density loss occurs with increasing age, which coincides with the time that UCd levels increase with the body burden of chronic low-dose cadmium exposure (Health Canada, 2018a). It is premature to consider these effects as the critical effect for setting a toxicological reference dose for cadmium, given the complexity of assessing fracture risk and the challenges of determining cadmium exposures from urine alone in the older population (Health Canada, 2018a, 2018b).
Renal toxicity has been selected as the critical effect for a number of risk assessments (EFSA, 2009a; JECFA, 2011; Health Canada, 2018a). This dose-response relationship has been extensively studied and analyzed in epidemiological and toxicological studies. Health Canada (2018a) reviewed the available information and concluded that the JECFA (2011) assessment was the most appropriate to use in establishing a reference value for cadmium. This assessment made use of a large meta-analysis of epidemiological studies that measured the dose-response relationship between urinary biomarkers: UCd (as a biomarker of exposure) and B2M (as a biomarker of effect). A urinary concentration of cadmium (i.e., breakpoint) was identified below which no corresponding increase in B2M was observed. The dietary exposure that would result in a cadmium concentration at the breakpoint was determined using a toxicokinetic model (JECFA, 2011). This analysis resulted in the establishment of a dietary cadmium exposure dose as a tolerable monthly intake of 25 µg/kg bw. A corresponding intake of 0.8 µg/kg bw per day can be adopted as a tolerable daily intake (TDI) for the purpose of deriving a health-based value (HBV) for cadmium in drinking water.
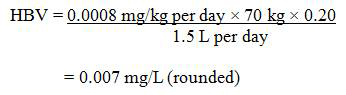
Text Description
The HBV for cadmium in drinking water is 0.007 mg/L (rounded). This is calculated by multiplying the TDI for cadmium (0.0008 mg/kg bw per day) by the average body weight for an adult (70 kg) then by the allocation factor for water (0.2). This product is then divided by the daily volume of water consumed by an adult (1.5 L/day).
Where:
- 0.0008 mg/kg per day is the TDI, as noted above;
- 70 kg is the average body weight for an adult (Health Canada, 1994);
- 0.2 is the default allocation factor for drinking water, used as a "floor value," since food represents the main source of exposure, and drinking water is a minor contributor to the total exposure from cadmium (Krishnan and Carrier, 2013); and
- 1.5 L per day is the drinking water intake rate for an adult.
10.1 International considerations
Drinking water guidelines, standards and/or guidance from other national and international organizations may vary due to the age of the assessments as well as differing policies and approaches, including the choice of key study and the use of different consumption rates, body weights and allocation factors.
Various organizations have established values for cadmium in drinking water based on renal toxicity. The value established by Health Canada is comparable to limits established by other countries and organizations. The U.S. EPA (1991) established a maximum contaminant level of 0.005 mg/L, based on kidney effects. The Australian drinking water guideline (NHMRC, 2011) of 0.002 mg/L for cadmium, endorsed in 1996, is based on JECFA (2000). The WHO (2011) retained a drinking-water quality guideline of 0.003 mg/L, based on kidney effects in the JECFA (2000) assessment, as the JECFA (2011) assessment did not change the guideline value calculation. The European Union (1998) directive includes a parametric value of 0.005 mg/L for cadmium in drinking water. Variation in these values can be attributed to default assumptions used by each organization in the calculation of risk.
11.0 Rationale
Food is the main source of cadmium intake in the general population. Small amounts of naturally occurring cadmium are released from rocks and soils into water. Cadmium can also enter the environment as a result of human activities. Exposure to cadmium from drinking water is generally low and limited to the ingestion route.
Although the IARC has classified cadmium as a Group 1 carcinogen, this classification focuses on the inhalation route of exposure, and evidence in humans linking oral cadmium exposure to cancer is limited.
An HBV of 0.007 mg/L (7 µg/L) for cadmium in drinking water was derived based on kidney effects in humans.
A MAC of 0.007 mg/L (7 µg/L) is established for cadmium in drinking water. The MAC is protective of potential health effects, can be reliably measured by available analytical methods, and is achievable by municipal and residential scale treatment technologies.
As part of its ongoing guideline review process, Health Canada will continue to monitor new research in this area and recommend any change to this guideline technical document that it deems necessary.
12.0 References
Adams, S.V. and Newcomb, P.A. (2014). Cadmium blood and urine concentrations as measures of exposure: NHANES 1999–2010. J. Expo. Sci. Environ. Epidemiol., 24(2): 163–70.
Adams, S.V., Passarelli, M.N. and Newcomb, P.A. (2012). Cadmium exposure and cancer mortality in the Third National Health and Nutrition Examination Survey cohort. Occup. Environ. Med., 69(2): 153–6.
Ahmedzeki, N.S. (2013). Adsorption filtration technology using iron-coated sand for the removal of lead and cadmium ions from aquatic solutions. Desal. Water Treat., 51(28–30): 5559–5565.
Akesson, A., Julin, B. and Wolk, A. (2008). Long-term dietary cadmium intake and postmenopausal endometrial cancer incidence: a population-based prospective cohort study. Cancer Res., 68(15): 6435–6441.
Alberta Environment and Parks (2017). Personal communication with D. Reid, Operations Division.
Amara-Rekkab, A. and Didi, M.A. (2015). Removal of Cd(II) and Hg(II) by chelating resin chelex-100. Orient. J. Chem., 31(1): 205.
Amzal, B., Julin, B., Vahter, M., Wolk, A., Johanson, G. and Akesson, A. (2009). Population toxicokinetic modeling of cadmium for health risk assessment. Environ. Health Perspect., 117(8): 1293–1301.
APHA, American Water Works Association and Water Environment Federation (2017). Standard methods for the examination of water and wastewater, 23nd edition. American Public Health Association, Washington, DC.
Arisawa, K., Uemura, H., Hiyoshi, M., Dakeshita, S., Kitayama, A., Saito, H. and Soda, M. (2007). Cause-specific mortality and cancer incidence rates in relation to urinary beta2-microglobulin: 23-year follow-up study in a cadmium-polluted area. Toxicol. Lett., 173(3): 168–174.
ATSDR (2012) Toxicological profile for cadmium. Agency for Toxic Substances and Disease Registry. Public Health Service, U.S. Department of Health and Human Services, Atlanta, Georgia.
AWWA, (2011). Internal corrosion control in water distribution systems. Manual of Water Supply Practices – M58. American Water Works Association, Denver, Colorado
AWWA (2016). Cement-mortar lining for ductile-iron pipe and fittings ANSI/AWWA Standard C104/A21.4-16. American Water Works Association, Denver, Colorado.
Ayati, M. and Lundager Madsen, H.E. (2000). Crystallization of some heavy-metal phosphates alone and in the presence of calcium ion. J. Cryst. Growth, 208(1): 579–591.
Baker, H.M., Massadeh, A.M. and Younes, H.A. (2009). Natural Jordanian zeolite: Removal of heavy metal ions from water samples using column and batch methods. Environ. Monit. Assess., 157(1): 319–330.
Bari, M.A, Kindzierski, W.B., Wallace, L.A., Wheeler, A.J., MacNeill, M. and Héroux, M.È. (2015). Indoor and outdoor levels and sources of submicron particles (PM1) at homes in Edmonton, Canada. Environ. Sci. Technol., 49(11): 6419–6429.
Barton, H. (2005). Predicted intake of trace elements and minerals via household drinking water by 6-year-old children from Kraków, Poland. Part 2: Cadmium, 1997–2001. Food Addit. Contam., 22(9): 816–828.
Batjargal, T., Yang, J., Kim, D. and Baek, K. (2011). Removal characteristics of Cd(II), Cu(II), Pb(II), and Zn(II) by natural Mongolian zeolite through batch and column experiments. Sep. Sci. Technol., 46(8): 1313–1320.
Bell, R.R. and Saunders, G.C. (2005). Cadmium adsorption on hydrous aluminium (III) oxide: Effect of adsorbed polyelectrolyte. Appl. Geochem., 20(3): 529–536.
Benjamin, M., Sontheimer, H. and Leroy, P. (1996). Corrosion of iron and steel. Chapter 2 in: Internal corrosion of water distribution systems, 2nd edition. American Water Works Association Research Foundation, Denver, Colorado.
Berend, K. and Trouwborst, T. (1999). Cement-mortar pipes as a source of aluminum. J. Am. Water Works Assoc., 91(7): 91–100.
Bernard, A., Lauwerys, R. and Gengoux, P. (1982). Characterization of the proteinuria induced by prolonged oral administration of cadmium in female rats. Toxicology, 20(4): 345–357.
Bhattacharyya, M.H. (2009). Cadmium osteotoxicity in experimental animals: mechanisms and relationship to human exposures. Toxicol. Appl. Pharmacol., 238(3): 258–265.
British Columbia Ministry of Health (2017). Personal communication with D. Fishwick.
Brzóska, M.M. and Moniuszko-Jakoniuk, J. (2005). Bone metabolism of male rats chronically exposed to cadmium. Toxicol. Appl. Pharmacol., 207(3): 195–211.
Brzóska, M.M., Majewska, K. and Moniuszko-Jakoniuk, J. (2005). Bone mineral density, chemical composition and biomechanical properties of the tibia of female rats exposed to cadmium since weaning up to skeletal maturity. Food Chem. Toxicol., 43(10): 1507–1519.
Bunn, R.A., Magelky, R.D., Ryan, J.N. and Elimelech, M. (2002). Mobilization of natural colloids from an iron oxide-coated sand aquifer: Effect of pH and ionic strength. Environ. Sci. Technol., 36(3): 314–322.
Calmon, C. (1974). Trace heavy metals in water: removal processes by ion-exchange. Chapter 1 in Traces of heavy metals in water removal processes and monitoring. Sabadell, J.E., (ed.) Proceedings of a symposium conducted by the Center for Environmental Studies and the Water Resources Program, Princeton University, in cooperation with the U.S. EPA and the American Institute of Chemical Engineers. (EPA Report No. EPA–902/9–74–001).
Cao, Y., Chen, A., Radcliffe, J., Dietrich, K.N., Jones, R.L., Caldwell, K. and Rogan, W.J. (2009). Postnatal cadmium exposure, neurodevelopment, and blood pressure in children at 2, 5, and 7 years of age. Environ. Health Perspect., 17(10): 1580–1586.
CCME (1996). Canadian soil quality guidelines for the protection of environmental and human health: cadmium. Canadian Council of Ministers of the Environment. Available at: www.ccme.ca/files/ceqg/en/backup/261.pdf.
CCPSA (2018). Canada Consumer Product Safety Act, Children’s Jewellery Regulations. SOR/2018-82. Available at: https://laws-lois.justice.gc.ca/eng/regulations/SOR-2018-82/index.html.
CDC (Centers for Disease Control and Prevention). (2009). Fourth national report on human exposure to environmental chemicals. Department of Health and Human Services, Atlanta, GA. Retrieved July 11, 2011, available from www.cdc.gov/exposurereport/ .
Chao, T.T. (1976). The significance of secondary iron and manganese oxides in geochemical exploration. Econ. Geol. Bull. Soc. Econ. Geol., 71(8): 1560–1569.
Chen, L., Lei, L., Jin, T., Nordberg, M. and Nordberg, G.F. (2006). Plasma metallothionein antibody, urinary cadmium, and renal dysfunction in a Chinese type 2 diabetic population. Diabetes Care, 29(12): 2682–2687.
Chen, Y.C., Pu, Y.S., Wu, H.C., Wu, T.T., Lai, M.K., Yang, C.Y. and Sung, F.C. (2009). Cadmium burden and the risk and phenotype of prostate cancer. BMC Cancer, 9: 429.
Chen, X., Gan, C., Zhu, G. and Jin, T. (2013). Benchmark dose for estimation of cadmium reference level for osteoporosis in a Chinese female population. Food Chem. Toxicol., 55: 592–595.
Clark, B.N., Masters, S.V. and Edwards, M.A. (2015). Lead release to drinking water from galvanized steel pipe coatings. Environ. Eng. Sci., 32(8): 713–721.
Clifford, D. and Sorg, T.J. (1986). Removing dissolved inorganic contaminants from water. Environ. Sci. Technol., 30(11): 1072–1080.
Crea, F., Foti, C., Milea, D. and Sammartano, S. (2013). Speciation of cadmium in the environment. Chapter 3 in: Cadmium: From toxicity to essentiality. Sigel, H. (ed.). Met. Ions Life. Sci., 11: 63–83.
Cuypers, A., Plusquin, M., Remans, T., Jozefczak, M., Keunen, E., Gielen, H., Opdenakker, K., Nair, A.R., Munters, E., Artois, T.J., Nawrot, T., Vangronsveld, J. and Smeets, K. (2010). Cadmium stress: an oxidative challenge. Biometals, 23(5): 927–940.
Dabrowski, A., Hubicki, Z., Podkoscielny, P. and Robens, E. (2004). Selective removal of the heavy metal ions from waters and industrial wastewaters by ion-exchange method. Chemosphere, 56(2): 91–106.
Demirbas, A., Pehlivan, E., Gode, F., Altun, T. and Arslan, G. (2005). Adsorption of Cu(II), Zn(II), Ni(II), Pb(II), and Cd(II) from aqueous solution on Amberlite IR-120 synthetic resin. J. Colloid Interf. Sci., 282(1): 20–25.
Deshommes, E., Laroche, L., Nour, S., Cartier, C. and Prévost, M. (2010). Source and occurrence of particulate lead in tap water. Water Res., 44(12): 3734–3744.
Edwards, M. and Benjamin, M.M. (1989). Adsorptive filtration using coated sand: A new approach for treatment of metal-bearing wastes. Res. J. Water Pollut. Control Fed., 61(9): 1523–1533.
EFSA (2009a). Technical report of EFSA prepared by the Assessment Methodology Unit on meta-analysis of dose–effect relationship of cadmium for benchmark dose evaluation. European Food Safety Authority. EFSA Scientific Report, 254: 1–62.
EFSA (2009b). Scientific opinion of the Panel on Contaminants in the Food Chain on request from the European Commission on cadmium in food. European Food Safety Authority. EFSA Journal, 980: 1–139. Available at: www.efsa.europa.eu/sites/default/files/scientific_output/files/main_documents/980.pdf.
EFSA (2009c). Meta-analysis of dose–effect relationship of cadmium for benchmark dose evaluation. European Food Safety Authority. EFSA Scientific Report, 254: 1–162. Available at: www.efsa.europa.eu/en/efsajournal/pub/rn-254.
EFSA (2011). Comparison of the approaches taken by EFSA and JECFA to establish a HBGV for cadmium. European Food Safety Authority. EFSA Journal, 9(2): 2006. Available at: http://onlinelibrary.wiley.com/doi/10.2903/j.efsa.2011.2006/abstract.
El-Rahaili, A. and Misbahuddin, M. (1995). Levels of trace metals in Riyadh drinking water at the consumer taps. J. King Saud Univ. – Eng. Sci., 7(1): 1.
Ennigrou, D.J., Sik Ali, M.B., Dhahbi, M. and Ferid, M. (2015). Removal of heavy metals from aqueous solution by polyacrylic acid enhanced ultrafiltration. Desal. Water Treat., 56(10): 2682–2688.
Environment and Climate Change Canada (2016). Releases of harmful substances to the environment. Canadian environmental sustainability indicators. Available at: www.ec.gc.ca/indicateurs-indicators/default.asp?lang =en&n=3C4C1124-1.
Environment and Climate Change Canada (2017). National long-term water quality monitoring data. Available at: http://donnees.ec.gc.ca/data/substances/monitor/national-long-term-water-quality-monitoring-data/ .
Environment and Climate Change Canada (2017). Data from the National Air Pollution Survey Program (NAPS). Available at: www.canada.ca/en/environment-climate-change/services/air-pollution/monitoring-networks-data/national-air-pollution-program.html.
Evans, H.E., Smith, P.J. and Dillon, P.J. (1983). Anthropogenic zinc and cadmium burdens in sediments of selected southern Ontario lakes. Can. J. Fish. Aquat. Sci., 40(5): 570–579.
Ford, R., Wilkin, R., and Puls, R. (2007). Monitored natural attenuation of inorganic contaminants in ground water. Volume 2. Assessment for non-radionuclides including arsenic, cadmium, chromium, copper, lead, nickel, nitrate, perchlorate and selenium. EPA/600/R-07/140.
Friedman, M.J., Hill, A.S., Reiber, S.H., Valentine, R.L., Larsen, G., Young, A., Korshin, G.V. and Peng, C-Y. (2010). Assessment of inorganics accumulation in drinking water system scales and sediments. Report No.3118. Water Research Foundation, Denver, Colorado.
Friedman, M., Hill, A., Booth, S., Hallett, M., McNeill, L., McLean, J., Stevens, D., Sorensen, D., Hammer, T., Kent, W., De Haan, M., MacArthur, U. and Mitchell, K. (2016). Metals accumulation and release within the distribution system: Evaluation and mitigation. Report No.4509. Water Research Foundation, Denver, Colorado.
Gardels, M.C. and Sorg, T.J. (1989). A laboratory study of the leaching of lead from water faucets. J. Am. Water Works Assoc., 81(7): 101–113.
Gardiner, J. (1974a). The chemistry of cadmium in natural water—I. A study of cadmium complex formation using the cadmium specific-ion electrode. Water Res., 8(1): 23–30.
Gardiner, J. (1974b). The chemistry of cadmium in natural water—II. The adsorption of cadmium on river muds and naturally occurring solids. Water Res., 8(3): 157–164.
Garner, R. and Levallois, P. (2016). Cadmium levels and sources of exposure among Canadian adults. Health Rep., 27(2): 10–18.
Graver Technologies (2015). Technical fact sheet. MetSorb®. Arsenic, lead and heavy metal adsorption media. Available at: www.gravertech.com/product-lines/adsorbents/metsorb/heavy-metal-removal-granules.
Grey, C.W., McLaren, R.G., Roberts, A.H. and Condron, L.M. (1999). Solubility, sorption and desorption of native and added cadmium in relation to properties of soils in New Zealand. Europ. J. Soil Sci., 50: 127–137.
Guo, Q., Toomuluri, P. and Eckert, J. (1998). Leachability of regulated metals from cement-mortar linings. J. Am. Water Works Assoc., 90(3): 62–73.
Hahne, H.C.H. and Kroontje, W. (1973). Significance of pH and chloride concentration on behavior of heavy metal pollutants: Mercury(II), Cadmium(II), Zinc(II), and Lead(II)1. J. Environ. Qual., 2(4): 444–450.
Hartwig, A. (2010). Mechanisms in cadmium-induced carcinogenicity: recent insights. Biometals, 23(5): 951–960.
Health Canada (1994). Human health risk assessment for priority substances. Canadian Environmental Protection Act. Human health risk assessment for priority substances. Minister of Supply and Services Canada, Ottawa, Ontario.
Health Canada (2011). Draft proposal for cadmium guidelines in children's jewellery. Consumer Product Safety Directorate, Healthy Environments and Consumer Safety Branch, Health Canada, Ottawa, Ontario. Available at: www.canada.ca/content/dam/hc-sc/migration/hc-sc/cps-spc/alt_formats/hecs-sesc/pdf/legislation/consultation/_2011cadmium/cadmium-eng.pdf. Accessed on November 28, 2017.
Health Canada (2012). Updated hazard characterization for cadmium. Personal communication from Health Products and Food Branch, Health Canada, Ottawa, Ontario.
Health Canada (2013). Second report on human biomonitoring of environmental chemicals in Canada. Results of the Canadian Health Measures Survey Cycle 2 (2009–2011). Available at: www.canada.ca/en/health-canada/services/environmental-workplace-health/reports-publications/environmental-contaminants/second-report-human-biomonitoring-environmental-chemicals-canada-health-canada-2013.html.
Health Canada (2015). Third report on human biomonitoring of environmental chemicals in Canada. Results of the Canadian Health Measures Survey Cycle 3 (2012–2013). Available at: www.canada.ca/en/health-canada/services/environmental-workplace-health/reports-publications/environmental-contaminants/third-report-human-biomonitoring-environmental-chemicals-canada.html.
Health Canada (2017a). Usual dietary cadmium exposure estimates for various age–gender groups in Canada (2016). Health Products and Food Branch, Health Canada, Ottawa, Ontario.
Health Canada (2017b). Aggregated statistics for cadmium in indoor and outdoor air from the National Pollution Monitoring Surveillance Program and the Edmonton Indoor Air Quality Study. Personal communication from T. Shin, Healthy Environments and Consumer Safety Branch, Ottawa, Ontario.
Health Canada (2018a). Health risk assessment of dietary exposure to cadmium. Health Products and Food Branch, Ottawa, Ontario.
Health Canada (2018b). Personal communication, Health Products and Food Branch, Ottawa, Ontario.
Health Canada (2019). Guidelines for Canadian Drinking Water Quality: Guideline Technical Document – Lead. Water and Air Quality Bureau, Healthy Environments and Consumer Safety Branch, Health Canada, Ottawa, Ontario. Available at: https://www.canada.ca/en/health-canada/services/publications/healthy-living/guidelines-canadian-drinking-water-quality-guideline-technical-document-lead/guidance-document.html
Hem, J.D. (1972). Chemistry and occurrence of cadmium and zinc in surface water and groundwater. Water Resour. Res., 8(3): 661–679.
Hill, C. and Giani, R. (2011). Water quality monitoring and assessment of internal corrosion and increased metals concentrations. In: Internal corrosion control in water distribution systems. American Water Works Association. Manual of water supply practices. Manual 58, 1st edition. Denver, Colorado.
Hill, A., Friedman, M., Reiber, S., Korshin, G. and Valentine, R. (2010). Behavior of trace inorganic contaminants in drinking water distribution systems. J. Am. Water Works Assoc., 102(7): 107–118.
Höll, W.H., Bartosch, C., Zhao, X. and He, S. (2002). Elimination of trace heavy metals from drinking water by means of weakly basic anion exchangers. J. Water Supply Res. Technol. Aqua, 51(3): 165–172.
HSDB (2017). Cadmium compounds. Hazardous Substances Data Bank, U.S. National Library of Medicine. Available at: https://toxnet.nlm.nih.gov/cgi-bin/sis/search2/r?dbs+hsdb:@term+@DOCNO+6922.
IARC (2012). IARC monographs on the evaluation of carcinogenic risks to humans. Cadmium and cadmium compounds. Monograph 100C. International Agency for Research on Cancer, Lyon, France. Available at: http://monographs.iarc.fr/ENG/Monographs/vol100C/mono100C-8.pdf.
Jalali, M. and Moradi, F. (2013). Competitive sorption of Cd, Cu, Mn, Ni, Pb and Zn in polluted and unpolluted calcareous soils. Environ. Monit. Assess., 185(11): 8831–8846.
Järup, L., Berglund, M., Elinder, C.G., Nordberg, G. and Vahter, M. (1998). Health effects of cadmium exposure—a review of the literature and a risk estimate. Scand. J. Work Environ. Health, 24 (Suppl 1): 1–51.
JECFA (2000). Evaluation of certain food additives and contaminants. Fifty-third report of the Joint FAO/WHO Expert Committee on Food Additives. WHO Technical Report Series, No. 896. World Health Organization, Geneva, Switzerland.
JECFA (2004). Safety evaluation of certain food additives and contaminants. Report of the sixty-first meeting of the Joint FAO/WHO Expert Committee on Food Additives (JECFA). WHO Food Additive Series, 52: 505–563. Available at: http://apps.who.int/iris/bitstream/10665/42849/1/WHO_TRS_922.pdf.
JECFA (2011). Safety evaluation of certain food additives and contaminants. Report of the seventy-third meeting of the Joint FAO/WHO Expert Committee on Food Additives (JECFA). WHO Food Additive Series, 64: 305–380.
Joseph, P. (2009). Mechanisms of cadmium carcinogenesis. Toxicol. Appl. Pharmacol., 238(3): 272–279.
Kawamura, Y., Mitsuhashi, M., Tanibe, H. and Yoshida, H. (1993). Adsorption of metal ions on polyaminated highly porous chitosan chelating resin. Int. Eng. Chem. Res., 32(2): 386–391.
Kellen, E., Zeegers, M.P., Hond, E.D. and Buntinx, F. (2007). Blood cadmium may be associated with bladder carcinogenesis: the Belgian case–control study on bladder cancer. Cancer Detect. Prev., 31(1): 77–82.
Kim, M.A., Panak, P.J., Yun, J.I., Kim, J.I., Klenze, R. and Kohler, K. (2003). Interaction of actinides with aluminosilicate colloids in statu nascendi. Part I: Generation and characterization of actinide (III)/pseudocolloids. Colloids Surf, A: Physicochem. Eng. Aspects, 216(1): 97–108.
Kocaoba, S. (2003). Behaviour of cadmium (II) ions on cation-exchange resins. Adsorp. Sci. Tech., 21(9): 831–840.
Kocaoba, S.A. and Akcin, G. (2005). Removal of chromium (III) and cadmium (II) from aqueous solutions. Desalination, 180: 151–156.
Kodama, T., Fujii, T. and Baba, H. (1980). Effect of water quality on the zinc products and corrosion rate of galvanized layer in fresh waters. Boshoku Gijutsu, 29(11): 551–557.
Kriegel, A.M., Soliman, A.S., Zhang, Q., El-Ghawalby, N., Ezzat, F., Soultan, A., Abdel-Wahab, M., Fathy, O., Ebidi, G., Bassiouni, N., Hamilton, S.R., Abbruzzese, J.L., Lacey, M.R. and Blake, D.A. (2006). Serum cadmium levels in pancreatic cancer patients from the East Nile Delta region of Egypt. Environ. Health Perspect., 114(1): 113–119.
Krishnan, K. and Carrier, R. (2008). Approaches for evaluating the relevance of multiroute exposures in establishing guideline values for drinking water contaminants. J. Environ. Sci. Health, C, 26: 300–316.
Krishnan, K. and Carrier, R. (2013). The use of exposure source allocation factor in the risk assessment of drinking-water contaminants. J. Toxicol. Environ. Health B Crit. Rev., 16(1): 39–51.
Linstedt, K.D., Houck, C.P. and O'Connor, J.T. (1971). Trace element removals in advanced wastewater treatment processes. Wat. Poll. Control Fed., 43(7): 1507–1513.
Malin Igra, A., Vahter, M., Raqib, R., Kippler, M. (2019). Early-Life Cadmium Exposure and Bone-Related Biomarkers: A Longitudinal Study in Children. Environ Health Perspect. 127(3):37003.
Manitoba Sustainable Development (2017). Personal communication with K. Philip, Office of Drinking Water.
Maynard, B. and Wasserstrom, L. (2017). Premise plumbing scales that can release lead after a lead service line replacement. Proceedings of the American Water Works Association Annual Conference and Exposition. June 11–14, 2017, Philadelphia, Pennsylvania. American Water Works Association, Denver, Colorado.
McComish, M.F. and Ong, J.H. (1988). Trace metals. Chapter 7 in: Environmental inorganic chemistry. Bodek, I., Lyman, W.J., Reehl, W.F. and Rosenblatt, D.H. (eds.). Pergamon, Amsterdam, pp. 71-7.15-11.
McLean, J.E. and Bledsoe, B.E. (1992). Behavior of metals in soils, ground water issue. Report No. EPA/540/S-92/018. United States Environmental Protection Agency, Washington, DC. Available at: https://nepis.epa.gov.
Ministère du Développement durable, de l’Environnement et de la Lutte contre les changements climatiques (2017). Personal communication with C. Robert, Direction de l'eau potable et des eaux souterraines.
Mlynska, A. and Zielina, M. (2017). The influence of prefabricated pipe cement coatings and those made during pipe renovation on drinking water quality. Proceedings of the 9th Conference on Interdisciplinary Problems in
Environmental Protection and Engineering EKO-DOK 2017, April 23–25, 2017. Boguszów-Gorce, Poland. E3S Web Conf.17: 00061.
Naiya, T.K., Bhattacharya, A.K. and Das, S.K. (2009). Adsorption of Cd(II) and Pb(II) from aqueous solutions on activated alumina. J. Colloid Interface Sci., 333(1): 14–26.
Najm, I., Romero, O., Gallagher, B., DeHaan, M. and Busch, C. (2017). Removal of heavy metals to ultra-low levels with conventional treatment technologies: A bench scale study. Proceedings of the American Water Works Association Annual Conference and Exposition, June 11–14, 2017, Philadelphia, Pennsylvania. American Water Works Association, Denver, Colorado.
Nawrot, T.S., Staessen, J.A., Roels, H.A., Munters, E., Cuypers, A., Richart, T., Ruttens, A., Smeets, K., Clijsters, H. and Vangronsveld, J. (2010). Cadmium exposure in the population: from health risks to strategies of prevention. Biometals, 23(5): 769–782.
Neff, C., Schock, M. and Marden, J. (1987). Relationship between water quality and corrosion materials in buildings. Volume I, Galvanized steel and copper plumbing systems. Illinois state water survey division. Aquatic chemistry section at the University of Illinois. SMS contract report 416-I.
New Brunswick Department of Environment and Local Government (2017). Personal communication with K. Gould, Healthy Environment Branch.
Newfoundland and Labrador Department of Municipal Affairs and Environment (2017). Personal communication with H. Khan, Water Resources Management Division.
NHMRC (2011). Australian drinking water guidelines. National Health and Medical Research Council: 442–443. Available at: www.nhmrc.gov.au/_files_nhmrc/file/publications/nhmrc_adwg_6_version_3.4_final.pdf.
Nishijo, M., Morikawa, Y., Nakagawa, H., Tawara, K., Miura, K., Kido, T., Ikawa, A., Kobayashi, E. and Nogawa, K.(2006). Causes of death and renal tubular dysfunction in residents exposed to cadmium in the environment. Occup. Environ. Med., 63(8): 545–550.
Nordberg, G.F. (2009). Historical perspectives on cadmium toxicology. Toxicol. Appl. Pharmacol., 238(3): 192–200.
Nordberg, G.F. and Kjellström, T. (1979). Metabolic model for cadmium in man. Environ. Health Perspect., 28: 211–217.
Nordberg, G.F., Nogawa, K., Nordberg, M. and Friberg, L. (2007). Cadmium. Chapter 23. In: Handbook on the toxicology of metals, 3rd edition. Academic Press/Elsevier, Cambridge, Massachusetts. pp. 446–486.
Nova Scotia Environment (2017). Personal communication with A. Polegato, Drinking Water Management Unit.
NSF/ANSI (2016a). Standard 53: Drinking water treatment units—health effects. NSF International/American National Standards Institute, Ann Arbor, Michigan.
NSF/ANSI (2016b). Standard 62: Drinking water distillation systems. NSF International/American National Standards Institute, Ann Arbor, Michigan.
NSF/ANSI (2017a). Standard 58: Reverse osmosis drinking water treatment systems. NSF International/American National Standards Institute, Ann Arbor, Michigan.
NSF/ANSI (2017b). Standard 61: Drinking water system components—health effects. NSF International/American National Standards Institute, Ann Arbor, Michigan
NSF/ANSI (2017c). Standard 60: Drinking water treatment chemicals—health effects. NSF International/American National Standards Institute, Ann Arbor, Michigan.
NRC (2010). National Plumbing Code. National Research Council, Ottawa, Ontario.
Ontario Ministry of the Environment, Conservation and Parks (2019). Personal communication with S. Deshpande, Standards Development Branch.
Osada, M., Izuno, T., Kobayashi, M. and Sugita, M. (2011). Relationship between environmental exposure to cadmium and bone metabolism in a non-polluted area of Japan. Environ. Health Prev. Med., 16(6): 341–349.
Patterson, J.W., Allen, H.E. and Scala, J.J. (1977). Carbonate precipitation for heavy metals pollutants. J. Water Pollut. Control Fed., 49(12): 2397–2410.
Pawlowski, B. Krawczyk, J. Bala, P. (2014). The premature deterioration of Zinc‐coated steel pipes in water distribution system. International Journal of Material and Mechanical Engineering (IJMME), 2(4): 43-47.
Pehlivan, E. and Altun, T. (2006). The study of various parameters affecting the ion exchange of Cu2+, Zn2+, Ni2+, Cd2+, and Pb2+ from aqueous solution on Dowex 50W synthetic resin. J. Hazard. Mater, 134(1-3): 149–156.
PEI Department of Communities, Land and Environment (2020). Personal communication with G. Somers.
Peng, C.Y., Hill, A.S., Friedman, M.J., Valentine, R.L., Larson, G.S., Romero, A.M.Y., Reiber, S.H. and Korshin, G.V. (2012). Occurrence of trace inorganic contaminants in drinking water distribution systems. J. Am. Water Works Assoc., 104(3): 53–54.
Pieper, K. J. (2015). Characterizing waterborne lead in private water systems: PhD Dissertation, Virginia Polytechnic Institute and State University, Blacksburg, Virgina. Available at: https://vtechworks.lib.vt.edu/bitstream/handle/10919/74273/Pieper_KJ_D_2015.pdf?sequence=1&isAllowed=y .
Pisigan Jr., R.A. and Singley, J.E. (1985). Effects of water quality parameters on the corrosion of galvanized steel. J. Am. Water Works Assoc., 77(11): 76–82.
Platz, E.A., Helzlsouer, K.J., Hoffman, S.C., Morris, J.S., Baskett, C.K. and Comstock, G.W. (2002). Prediagnostic toenail cadmium and zinc and subsequent prostate cancer risk. Prostate, 52(4): 288–296.
Powell, K., Brown, P., Byrne, R., Gajda, T., Hefter, G., Leuz, A-K., Sjoberg, S. and Wanner, H. (2011). Chemical speciation of environmentally significant metals with inorganic ligands. Part 4: The Cd2+ + OH–, Cl–, CO32–, SO42–, and PO4 3– systems (IUPAC technical report). Pure Appl. Chem., 83(5): 1163–1214.
Prozialeck, W.C. and Edwards, J.R. (2010). Early biomarkers of cadmium exposure and nephrotoxicity. Biometals, 23(5): 793–809.
Reeves, P.G. and Chaney, R.L. (2008). Bioavailability as an issue in risk assessment and management of food cadmium: a review. Sci. Total Environ., 398(1-3): 13–19.
Rei, D., Zahara, J., Schwab, A., Schmidt, R., Girvin, D. and Rogers, J. (1984). Chemical attenuation rates, coefficients and constants in leachate migration. Vol I: A critical review. Pacific Northwest Laboratories, Richland, Washington.
Roberts, C.A. and Clark, J.M. (1988). In vivo depression of reserve albumin binding capacity by cadmium: a preliminary evaluation. Life Sci., 42(14): 1369–1373.
Ruoff, W.L., Diamond, G.L., Velazquez, S.F., Stiteler, W.M. and Gefell, D.J. (1994). Bioavailability of cadmium in food and water: a case study on the derivation of relative bioavailability factors for inorganics and their relevance to the reference dose. Regul. Toxicol. Pharmacol., 20(2): 139–160.
Sabolić, I., Breljak, D., Skarica, M. and Herak-Kramberger, C.M. (2010). Role of metallothionein in cadmium traffic and toxicity in kidneys and other mammalian organs. Biometals, 23(5): 897–926.
Samuels, E.R. and Méranger, J.C. (1984). Preliminary studies on the leaching of some trace metals from kitchen faucets. Water Res., 18(1): 75–80.
Saskatchewan Water Security Agency (2017). Personal communication with S. Ferris, Environmental and Municipal Management Services Division.
Satarug, S., Garrett, S.H., Sens, M.A. and Sens, D.A. (2010). Cadmium, environmental exposure, and health outcomes. Environ. Health Perspect., 118(2): 182–190.
SCC (2020). Directory of accredited product, process and service certification bodies. Standards Council of Canada, Ottawa, Ontario. Available at: www.scc.ca/en/accreditation/product-process-and-service-certification/directory-of-accredited-clients.
Schock, M. and Neff, C. (1988). Trace metal contamination from brass fittings. J. Am. Water Works Assoc., 80(11): 47–56.
Schock, M. (2005). Chapter 6: Distribution system as reservoirs and reactors for inorganic contaminants. In: Distribution system water quality challenges in the 21st century: A strategic guide. 5th edition. M. J. MacPhee (ed.). American Water Works Association, Denver, Colorado.
Schock, M. Hyland, R. and Welch, M. (2008). Occurrence of contaminant accumulation in lead pipe scales from domestic drinking-water distribution systems. Environ. Sci. Technol., 42(12): 4285–4291.
Schock, M. and Lytle, D. (2011). Chapter 20: Internal corrosion and deposition control. In: Water quality and treatment: a handbook on drinking water, 6th edition. J.K. Edzwald (ed.). McGraw Hill and American Water Works Association, Denver, Colorado.
Sharrett, A.R., Carter, A.P., Orheimt, R.M. and Feinleib, M. (1982). Daily intake of lead, cadmium, copper, and zinc from drinking water: The Seattle study of trace metal exposure. Environ. Res., 28(2): 456–475.
Sheta, A.S., Falatah, A.M., Al-Sewailem, M.S., Khaled, E.M. and Sallam, A.S.H. (2003). Sorption characteristics of zinc and iron by natural zeolite and bentonite. Microporous and mesoporous materials. Micropor. Mesopor. Mater., 61(1-3): 127–136.
Smedley, P.L. and Kinniburgh, D.G. (2002). A review of the source, behaviour and distribution of arsenic in natural waters. Appl. Geochem., 17(5): 517–568.
Snoeyink, V.L., Schock, M.R., Sarin, P., Wang, L., Chen, A.S. and Harmon, S.M. (2003). Aluminium-containing scales in water distribution systems: Prevalence and composition. J. Water Supply Res. Technol. Aqua, 52(7): 455–74.
Sorg, T.J., Csanady, M. and Logsdon, G.S. (1978). Treatment technology to meet the interim primary drinking water regulations for inorganics —3. J. Am. Water Works Assoc., 70(12): 680–691.
Statistics Canada (2015). Fact sheet on lead, mercury and cadmium concentrations in Canadians, 2012 and 2013. Available at: www.statcan.gc.ca/pub/82-625-x/2015001/article/14209-eng.htm.
Stephenson, M. and Mackie, G.L. (1988). Total cadmium concentrations in the water and littoral sediments of central Ontario lakes. Water, air, and soil pollution. Water Air Soil Pollut., 38(1-2): 121–136.
Subramanian, K.S., Connor, J.W. and Meranger, J.C. (1991). Leaching of antimony, cadmium, copper, lead, silver, tin and zinc from copper piping with non-lead-based soldered joints. J. Environ. Sci. Health A, 26(6): 911–929.
Suwazono, Y., Sand, S., Vahter, M., Skerfving, S., Lidfeldt, J. and Akesson, A. (2010). Benchmark dose for cadmium-induced osteoporosis in women. Toxicol. Lett., 197(2): 123–127.
Swaim, P., Busch, C. and De Haan, M. (2017). Removal of heavy metals to ultra-low levels with conventional treatment technologies: Pilot scale demonstration. Proceedings of the American Water Works Association Annual Conference and Exposition, June 11–14, 2017, Philadelphia, Pennsylvania. American Water Works Association, Denver, Colorado.
Trussell, R.R. and Wagner, I. (1996). Corrosion of galvanized pipe. In: Internal corrosion of water distribution systems, 2nd edition. American Water Works Association Research Foundation and DVGW Technologiezentrum Wasser, Denver, Colorado.
U.S. EPA (1991). National primary drinking water regulations; Final rule. Fed. Register, 56: 3526–3597.
U.S. EPA (1994a). Method 200.7 Revision 4.4. Determination of metals and trace elements in water and wastes by inductively coupled plasma-atomic emission spectrometry. Environment monitoring systems laboratories. Office of Research and Development, U.S. Environmental Protection Agency, Cincinnati, Ohio.
U.S. EPA (1994b). Method 200.8 Revision 5.4. Determination of trace elements in waters and wastes by inductively coupled plasma-mass spectrometry. Environment monitoring systems laboratories. Office of Research and Development, U.S. Environmental Protection Agency, Cincinnati, Ohio.
U.S. EPA (1994c). Method 200.9 Revision 2.2. Determination of trace elements by stabilized temperature graphite furnace atomic absorption. Environment monitoring systems laboratories. Office of Research and Development, U.S. Environmental Protection Agency, Cincinnati, Ohio.
U.S. EPA (1998). Small system compliance technology list for the non-microbial contaminants regulated before 1996. Report No. EPA 815-R-98-002. Office of Water, U.S. Environmental Protection Agency, Washington, DC.
U.S. EPA (2003). Method 200.5 Revision 4.2. Determination of trace elements in drinking water by axially viewed inductively coupled plasma - atomic emission spectrometry. Report No. EPA 600-R-06-115. National Exposure Research Laboratory, Office of Research and Development, U.S. Environmental Protection Agency, Cincinnati, Ohio.
U.S. EPA (2004). Risk assessment guidance for superfund. Volume I: Human health evaluation manual (Part E, Supplemental guidance for dermal risk assessment). Report No. EPA/540/R/99/005. Office of Superfund Remediation and Technology Innovation, U.S. Environmental Protection Agency, Washington, DC.
U.S. EPA (2009). Analytical feasibility support document for the second six-year review of existing national primary drinking water regulations. Report No. EPA 815-B-09-003. Office of Water, U.S. Environmental Protection Agency, Washington, DC. Available at: www.epa.gov/sites/production/files/2014-12/documents/815b09003.pdf
U.S. EPA (2012). Federal Register. Part II. Revisions of the unregulated contaminant monitoring regulation (UCMR 3) for public water systems; final rule. Vol 77, No 85. May 2, 2012. U.S. Environmental Protection Agency, Washington, DC.
U.S. EPA (2016). Analytical methods approved for drinking water compliance. Monitoring of inorganic contaminants and other inorganic constituents. Report No. EPA 815-B-16-014. Office of Water, U.S. Environmental Protection Agency Washington, DC.
van Wijngaarden, E., Singer, E.A. and Palapattu, G.S. (2008). Prostate-specific antigen levels in relation to cadmium exposure and zinc intake: results from the 2001–2002 National Health and Nutrition Examination Survey. Prostate, 68(2): 122–128.
Viraraghavan, T., Subramanian, K.S. and Rao, B.V. (1999). Impact of household plumbing fixtures on drinking water quality—A review. Inter. J. Environ. Studies, (56): 717–743.
Viraraghavan, T., Subramanian, K.S. and Tanjore, S. (2000). Impact of household plumbing materials on trace metal levels in drinking water in Regina, Canada. Proceedings of the National Conference on Environmental and Pipeline Engineering. July 23–26, 2000, Kansas City, Missouri. American Society of Civil Engineers. Reston, Virgina. pp. 561–570.
Vreeburg, J. (2010). Discolouration in drinking water systems: the role of particles clarified. IWA Publishing, London, U.K.
Vinceti, M., Venturelli, M., Sighinolfi, C., Trerotoli, P., Bonvicini, F., Ferrari, A., Bianchi, G., Serio, G., Bergomi, M. and Vivoli, G. (2007). Case–control study of toenail cadmium and prostate cancer risk in Italy. Sci. Total Environ., 373(1): 77–81.
Waalkes, M.P. and Rehm, S. (1992). Carcinogenicity of oral cadmium in the male Wistar (WF/NCr) rat: effect of chronic dietary zinc deficiency. Fundam. Appl. Toxicol., 19(4): 512–520.
Waalkes, M.P. (2003). Cadmium carcinogenesis. Mutat Res. 533(1-2): 107–120.
WHO (1992). Environmental health criteria No. 134. Cadmium. International Programme on Chemical Safety, World Health Organization. Geneva, Switzerland. Available at: www.inchem.org/documents/ehc/ehc/ehc134.htm
WHO (2011). Cadmium in drinking-water. Background document for development of WHO guidelines for drinking water quality. World Health Organization, Geneva, Switzerland. Available at: www.who.int/water_sanitation_health/dwq/chemicals/cadmium.pdf
Wu, L., Wei, Q., Lv, Y., Xue, J., Zhang, B., Sun, Q., Xiao, T., Huang, R., Wang, P., Dai, X., Xia, H., Li, J., Yang, X., Liu, Q. (2019). Wnt/β-Catenin Pathway Is Involved in Cadmium-Induced Inhibition of Osteoblast Differentiation of Bone Marrow Mesenchymal Stem Cells. Int J Mol Sci., 20(6).
Yeats, P.A. and Bewers, J.M. (1982). Discharge of metals from the St. Lawrence River. Canadian J. Earth Sci., 19(5): 982–992.
Yokota, H. and Tonami, H. (2008). Experimental studies on the bone metabolism of male rats chronically exposed to cadmium intoxication using dual-energy X-ray absorptiometry. Toxicol. Ind. Health, 24(3): 161–170.
Yukon Health and Social Services (2017). Personal communication with P. Brooks, Health and Social Services.
Zalups, R.K. and Ahmad, S. (2003). Molecular handling of cadmium in transporting epithelia. Toxicol. Appl. Pharmacol., 186(3): 163–188.
Zasoski, R.J. and Burau, R.G. (1988). Sorption and sorptive interaction of cadmium and zinc on hydrous manganese oxide. Soil Sci. Soc. Am. J., 52(1): 81–87.
Zeng, X., Jin, T., Jiang, X., Kong, Q., Ye, T. and Nordberg, G.F. (2004). Effects on the prostate of environmental cadmium exposure—a cross-sectional population study in China. Biometals, 17(5): 559–565.
Zhao, X., Höll, W.H. and Yun, G. (2002). Elimination of cadmium trace contaminations from drinking water. Water Res., 36(4): 851–858.
Zielina, M., Mlynska, A. and Zaba, T. (2015). Experimental research on deterioration of drinking water quality after cement mortar pipe lining. Tech. Trans., (28): Civil Engineering. 4-B: 145–152.
Appendix A: List of acronyms
- ANSI
- American National Standards Institute
- AWWA
- American Water Works Association
- bw
- body weight
- B2M
- β2-microglobulin
- BMD
- benchmark dose
- BMDL
- lower 95% confidence limit on the benchmark dose
- BMDL05
- lower 95% confidence limit on the benchmark dose for a 5% response
- Cd
- cadmium
- Cd-MT
- Cd-metallothionein
- CI
- confidence interval
- DL
- etection limit
- EFSA
- European Food Safety Authority
- FAO
- Food and Agriculture Organization of the United Nations
- GM
- geometric mean
- HBV
- health-based value
- IARC
- International Agency for Research on Cancer
- ICP-MS
- Inductively coupled plasma mass spectrometry
- JECFA
- Joint FAO/WHO Expert Committee on Food Additives
- MAC
- maximum acceptable concentration
- MDL
- method detection limit
- MT
- metallothionein
- NHANES
- National Health and Nutrition Examination Survey
- NSF
- NSF International
- PVC
- polyvinyl chloride
- RO
- reverse osmosis
- SAC
- strong-acid cation
- SCC
- Standards Council of Canada
- SM
- Standard Method
- TDS
- total dissolved solids
- UCd
- urinary cadmium
- U.S. EPA
- United States Environmental Protection Agency
- WHO
- World Health Organization