
Page 8: Guidelines for Canadian Drinking Water Quality: Guideline Technical Document - Enteric Protozoa: Giardia and Cryptosporidium
Partie II. Science et considérations techniques
The adoption of a risk-based approach, such as a multi-barrier approach, is essential to the effective management of drinking water systems (CCME, 2004). This approach should include assessment of the entire drinking water system, from the watershed/aquifer and intake through the treatment and distribution chain to the consumer, to assess potential impacts on drinking water quality and public health.
Current drinking water quality guidelines encourage the adoption of a multi-barrier approach to produce clean, safe and reliable drinking water. Various indicators, such as indicator microorganisms, turbidity and disinfectant residuals, are used as part of the multi-barrier approach to determine the quality of the treated drinking water. For example, E. coli and total coliforms are bacteriological indicators that are routinely used to verify the microbiological quality of drinking water. Although indicators are an important aspect of a multi-barrier approach, they do not provide any quantitative information on pathogens or the potential disease burden in the population that would be associated with drinking water of a given quality. It is important to note that even water of an acceptable quality carries some risk of illness, although it is extremely low.
Quantitative microbial risk assessment (QMRA) is gaining acceptance as part of a multi-barrier approach. QMRA is a process that uses source water quality data, treatment barrier information and pathogen-specific characteristics to estimate the burden of disease associated with exposure to pathogenic microorganisms in a drinking water source. The benefit of using a QMRA approach is that assessments can be carried out by each water system to provide site-specific information:
- to understand how changes in the source water quality can have an impact on the microbiological quality of the drinking water being produced;
- to look at the adequacy of existing control measures, given site-specific variations;
- to investigate potential improvements in microbiological drinking water quality with additional treatment barriers or optimization of existing treatment barriers; and
- to help establish limits for critical control points in the treatment system.
Site-specific variations should include the potential impact of hazardous events, such as storms, contamination events or the failure of a treatment barrier. When interpreting the results from a QMRA, the following should be considered:
- The quality of the data obtained from a QMRA is dependent on the quality of the input data.
- There can be a high level of uncertainty associated with some data (e.g., source water quality data and pathogen removals by treatment systems).
- Assumptions are made in QMRA that may not accurately reflect the condition of the water system and/or individual exposure to pathogens at every point in time (see Section 9.3.4).
- Because of these limitations, QMRA should not be used to try to estimate levels of illness in a population resulting from a particular water system. Rather, the disease burden estimates produced from a QMRA are useful for site-specific system evaluations as part of a multi-barrier approach to safe drinking water.
Health-based targets are the "goalposts" or "benchmarks" that have to be met to ensure the safety of drinking water. In Canada, microbiological hazards are commonly addressed by two forms of health-based targets: water quality targets and treatment goals. An example of a water quality target is the bacteriological guideline for E. coli, which sets a maximum acceptable concentration of this organism in drinking water (Health Canada, 2006a). Treatment goals describe the reduction in risk to be provided by measures such as treatment processes aimed at reducing the viability or presence of pathogens. Treatment goals assist in the selection of treatment barriers and should be defined in relation to source water quality. They need to take into account not only normal operating conditions, but also the potential for variations in water quality and/or treatment performance. For example, short periods of poor source water quality following a storm or a decrease in treatment effectiveness due to a process failure may in fact embody most of the risk in a drinking water system. The wide array of microbiological pathogens makes it impractical to measure all of the potential hazards; thus, treatment goals are generally framed in terms of categories of organisms (e.g., bacteria, viruses and protozoa) rather than individual pathogens. The health-based treatment goal for Giardia and Cryptosporidium is a minimum 3 log reduction and/or inactivation of (oo)cysts. Many source waters may require a greater log reduction and/or inactivation to maintain an acceptable level of risk.
The burden of disease estimates calculated during a risk assessment should be compared with a reference level of risk--that is, a level of risk that is deemed tolerable or acceptable. This comparison is needed to understand the public health implications of the disease burden estimate and is needed to set health-based treatment goals.
Risk levels have been expressed in several ways. WHO's Guidelines for Drinking-water Quality (WHO, 2011) use DALYs as a unit of measure for risk. The basic principle of the DALY is to calculate a value that considers both the probability of experiencing an illness or injury and the impact of the associated health effects (Murray and Lopez, 1996a; Havelaar and Melse, 2003). The WHO (2011) guidelines adopt 10−6 DALY/person per year as a health target. The Australian National Guidelines for Water Recycling (NRMMC-EPHC, 2006) also cite this target. In contrast, other agencies set acceptable microbial risk levels based on the risk of infection and do not consider the probability or severity of associated health outcomes. For example, the U.S. EPA has used a health-based target of an annual risk of infection of less than 1/10 000 (10−4) persons (Regli et al., 1991).
For comparison, the reference level of 10−6 DALY/person per year is approximately equivalent to an annual risk of illness for an individual of 1/1000 (10−3) for a diarrhoea-causing pathogen with a low fatality rate. For an illness with more severe health outcomes, such as a cancer, 10−6 DALY/person per year is approximately equivalent to a lifetime additional risk of cancer over background of 10−5 (i.e., 1 excess case of cancer over background levels per 100 000 people ingesting 1.5 L of drinking water containing the substance at the guideline value per day over a 70-year life span). QMRA is a useful tool in estimating whether a drinking water system can meet this health target, as current disease surveillance systems in developed nations such as Canada are not able to detect illness at such a low level.
The risk assessment in this guideline technical document estimates the disease burden in DALYs. There are several advantages to using this metric. DALYs take into account both the number of years lost due to mortality and the number of years lived with a disability (compared with the average healthy individual for the region) to determine the health impact associated with a single type of pathogenic organism. The use of DALYs also allows for comparison of health impacts between different pathogens and potentially between microbiological and some chemical hazards. Although no common health metric has been accepted internationally, DALYs have been used by numerous groups, and published, peer-reviewed information is available. The WHO (2011) reference level of 10−6 DALY/person per year is used in this risk assessment as an acceptable level of risk.
QMRA uses mathematical modelling and relevant information from selected pathogens to derive disease burden estimates. It follows a common approach in risk assessment, which includes four components: hazard identification, exposure assessment, dose-response assessment and risk characterization.
The first step of QMRA is hazard identification, a qualitative process of identifying hazards to the drinking water system or to human health, such as microorganisms or toxic chemicals. The enteric protozoa of most concern as human health hazards in Canadian drinking water sources are Giardia and Cryptosporidium. These organisms can cause serious illness in immunocompetent and immunocompromised individuals. Illness caused by Cryptosporidium is more serious because it is capable of causing death, particularly in immunocompromised individuals, and extraintestinal (i.e., lungs, pancreas, etc.) damage can occur.
The presence and types of Giardia and Cryptosporidium in a given drinking water source are variable. Therefore, it is important to identify all potential sources and events, regardless of whether they are under the control of the drinking water supplier, that could lead to Giardia and Cryptosporidium being present at concentrations exceeding baseline levels, on a site-specific basis. Faeces from humans and other animals are the main sources of enteric protozoa and may originate from point sources of pollution, such as municipal sewage discharges, or non-point sources, such as septic tanks and urban or livestock runoff. In addition to the potential sources of contamination, it is necessary to consider whether the presence of protozoa is continuous or intermittent or has seasonal pollution patterns and how rare events, such as droughts or floods, will influence the Giardia and Cryptosporidium concentrations in the source water.
Although all enteric protozoa of concern need to be identified, risk assessments do not usually consider each individual enteric protozoan. Instead, the risk assessment includes only specific enteric protozoa whose characteristics make them a good representative of all similar pathogenic protozoa. It is assumed that if the reference protozoan is controlled, this would ensure control of all other similar protozoa of concern. Ideally, a reference protozoa will represent a worst-case combination of high occurrence, high concentration and long survival time in source water, low removal and/or inactivation during treatment and a high pathogenicity for all age groups. Cryptosporidium parvum and Giardia lamblia have been selected as the reference protozoa for this risk assessment because of their high prevalence rates, potential to cause widespread disease, resistance to chlorine disinfection and the availability of a dose-response model for each organism.
Exposure assessments provide an estimate (with associated uncertainty) of the occurrence and level of a contaminant in a specified volume of water at the time of the exposure event (ingestion, inhalation and/or dermal absorption). The principal route of exposure considered in this risk assessment is consumption of drinking water. To determine exposure, the concentration of Cryptosporidium or Giardia and the volume of water ingested need to be known or estimated. Exposure can be determined as a single dose of pathogens ingested by a consumer at one time.
Drinking water is not usually monitored for protozoans. Therefore, to determine exposure, the concentrations of the reference protozoa in the source water need to be measured or estimated. Measurements, as opposed to estimates, will result in the highest-quality risk assessment. Short-term peaks in Cryptosporidium or Giardia concentrations may increase disease risks considerably and even trigger outbreaks of waterborne disease; thus, seasonal variation and peak events such as storms should be included in the measurements or estimates. Some of the factors that should be taken into consideration when determining concentrations in drinking water are the recovery efficiencies of Cryptosporidium and Giardia concentration and detection methods, which are much less than 100%, the variability around treatment removal and inactivation, and the viability or infectivity of the pathogen in the finished water. A variety of methods can be used to assess (oo)cyst viability and infectivity (see Section 6.6). In this risk assessment, the (oo)cysts reported in the source water are assumed to be viable and infectious. Once the source water concentrations are determined, treatment reductions are calculated to determine the concentration in the finished drinking water. This risk assessment assumes that any (oo)cysts that were not removed or inactivated during treatment are still capable of causing infection and illness.
For the volume of water ingested, it is important to consider only the unboiled amount of tap water consumed, as boiling the water inactivates pathogens and will overestimate exposure (Gale, 1996; Payment et al., 1997; WHO, 2011). In Canada, approximately 1.5 L of tap water are consumed per person per day. However, approximately 35% is consumed in the form of coffee or tea (Health and Welfare Canada, 1981). The elevated temperatures (boiling or near boiling) used for making coffee and tea would inactivate any enteric pathogens present. Therefore, for estimating risk from pathogenic organisms, the risk assessment uses an average consumption of 1 L of water per person per day for determining exposure. This estimate is similar to consumption patterns in other developed nations (Westrell et al., 2006; Mons et al., 2007). WHO, in its Guidelines for Drinking-water Quality, also suggests using an estimate of 1 L for consumption of unboiled tap water (WHO, 2011).
The dose-response assessment uses dose-response models to estimate the probability of infection and the risk of illness after exposure to (oo)cysts. The probability of infection (Pinfection) for this risk assessment is calculated using dose-response models for C. parvum and G. lamblia. These dose-response data are best explained by the exponential model (Haas et al., 1999):
This exponential model describes mathematically the distribution of the individual probabilities of any one organism to survive and start infection, where V is the single volume of liquid ingested, µ is the number of organisms per litre in the ingested volume and r is the fraction of ingested organisms that survive to initiate infection. The r parameter is different for Cryptosporidium and Giardia. In the case of C. parvum, r = 0.018 (Messner et al., 2001), whereas for G. lamblia, r = 0.0199 (Rose and Gerba, 1991). The r parameter is derived from dose-response studies of healthy volunteers and may not adequately represent effects on sensitive subgroups, such as immunocompromised persons, young children or the elderly.
An individual's daily dose of organisms is estimated using the information from the exposure assessment. An individual's yearly probability of infection is estimated using equation 2. For this risk assessment, it is assumed that there is no secondary spread of infection.
Not all infected individuals will develop a clinical illness. The risk of illness per year for an individual is estimated using equation 3:
where:
Pinfection/year = the probability of infection obtained from the beta-Poisson model
S = the proportion of the population susceptible to infection
I = the proportion of individuals who develop symptomatic illness after infection
The risk assessment is based on I values of 0.70 and 0.24 for Cryptosporidium (Okhuysen et al., 1998) and Giardia (Macler and Regli, 1993), respectively. S is assumed to be 1.
To translate the risk of illness per year for an individual to a disease burden per person, the DALY is used as a common unit of risk. The key advantage of the DALY as a measure of public health is cited as its aggregate nature, combining life years lost (LYL) with years lived with disability (YLD) to calculate the disease burden. DALYs can be calculated as follows:
where:
YLD = the sum of the [(outcome fraction) × (duration) × (severity weight)] for each health outcome contributing to morbidity
LYL = [(life expectancy) - (age at death)] × severity weight
For Giardia and Cryptosporidium, the health effects vary in severity from mild diarrhoea to more severe diarrhoea and potentially death. It is important to note that, as no published mortality information is available for Giardia, this risk assessment assumes that the risk of death is the same as that for Cryptosporidium. The health burden of gastroenteritis resulting from infection with Giardia and Cryptosporidium in drinking water is 1.70 DALYs/1000 cases (1.70 × 10⁻³ DALY/case) (Table 10).
| Health outcome | Outcome fractionTable 1 Footnote a | Duration of illnessTable 1 Footnote b | Severity weightTable 1 Footnote c | DALY/case | |
|---|---|---|---|---|---|
Table 1 Footnotes
|
|||||
| Morbidity (YLD) | Mild diarrhoea | 0.99999 | 0.01918 year (7 days) | 0.067 | 1.29 × 10⁻³ |
| Mortality (LYL) | Death | 0.00001 | Life expectancyTable 1 Footnote d; age at deathTable 1 Footnote e | 1 | 4.15 × 10⁻⁴ |
| Health burden | 1.70 × 10⁻³ | ||||
Using this health burden and the risk of illness per year in an individual, the disease burden in DALYs/person per year can be estimated:
where
Risk of illness = the value calculated from equation 3
Health burden = 1.70 × 10⁻³ DALY/case
Risk characterization brings together the data collected or estimated on pathogen occurrence in source water, pathogen removal or inactivation through treatment barriers, consumption patterns to estimate exposure and pathogen dose-response relationships to estimate the burden of disease. Using this information, the potential disease burden associated with the specified drinking water system can be calculated. Example disease burden calculations are provided in Figures 1 and 3. These calculations have been presented using point estimates; however, when mathematical models are used for QMRA, the calculations generally include probability functions with associated uncertainties (Appendix D). The calculated disease burden can then be compared with the acceptable risk level to determine if the drinking water being produced is of an acceptable quality. If the disease burden estimate associated with the drinking water does not meet the acceptable risk level, QMRA can then be used to calculate the level of treatment that would be required to meet the acceptable health risk target (10-6 DALY/person per year).
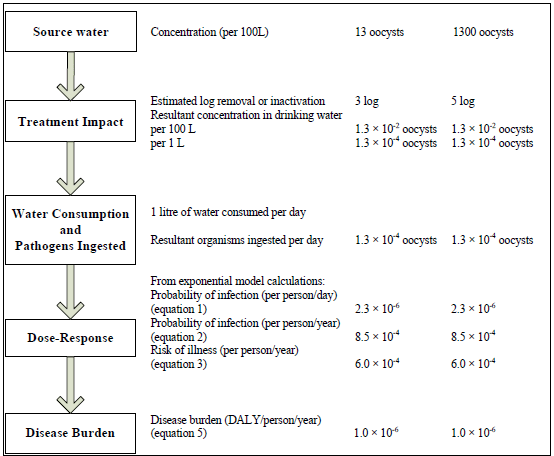
Figure 1 - Text description
The steps in a quantitative microbial risk assessment for Cryptosporidium are presented as a flow chart along with an example risk assessment calculation. On the left side of the flowchart, in boxes, are the 5 steps; on the right side, parallel to each box, is the corresponding information from the example calculation. For step 1), source water, the example uses two different concentrations: 13 and 1300 oocysts per 100 litres of water. For step 2), treatment impact, the example calculations estimate a log removal and/or inactivation of 3 and 5 logs, respectively, and therefore, the resultant concentration of Cryptosporidium in drinking water would be 1.3 × 10⁻² oocysts per 100 litres, or 1.3 × 10⁻² oocysts per per litre. For step 3), water consumption and pathogens ingested, the example calculation includes the assumption that 1 litre of water is consumed daily, therefore the number of oocysts ingested per day would be 1.3 × 10⁻⁴. For step 4), dose-response, the information from step 3 and equations 1, 2 and 3 from the text, are used to calculate the probability of infection per person per day, the probability of infection per person per year, and the risk of illness per person per year which correspond to 2.3 × 10-, 8.5 × 10⁻⁴, and 6.0 × 10⁻⁴, respectively. For step 5), disease burden, equation 5 from the text is used to calculate a disease burden, which for this example is 1.0x10⁻⁶ disability adjusted life years per person per year.
Note: The volume of water ingested is estimated at 1 L/person per day, as it considers only the unboiled amount of tap water consumed (see Gale, 1996; WHO, 2011).
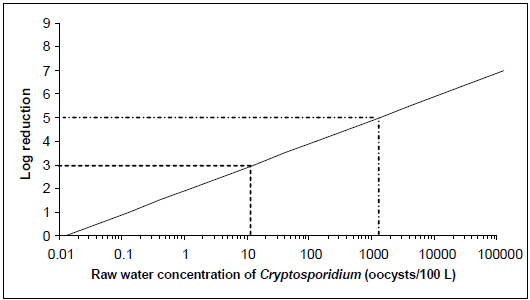
Figure 2 - Text description
The level of treatment required to meet an acceptable level of risk based on 1 L consumption for Cryptosporidium concentrations ranging from 13 oocysts per 100 litres to 1300 oocysts per 100 litres in raw water is presented graphically. The x-axis of the graph is the raw water concentrations of oocysts per 100 litres using a log scale. The y-axis of the graph is the log removal using a linear scale. The relationship between the values on the x-axis and the values on the y-axis for the risk level of 10-6 DALY per person per year creates a diagonal line. Two examples of treatment requirements are illustrated on the graph using dotted lines. The first example draws a horizontal dotted line from the y-axis at 3 log removal. This dotted line intersects the diagonal line at 13 oocysts per 100 litres of raw water. The second example draws a horizontal dotted line from the y-axis at 5 log removal. This dotted line intersects the diagonal line at 1300 oocysts per 100 litres of raw water.
For example, as shown in Figures 1 and 2, when source waters have a concentration of 13 oocysts/100 L and the treatment plant consistently achieves at least a 3-log reduction in oocyst concentration, the burden of disease in the population would meet the reference level of 10-6 DALY/person per year (less than 1 case/1000 people per year). Although this source water oocyst concentration falls within the range of oocyst concentrations that would typically be found in Canadian source waters, many surface water sources will have higher Cryptosporidium concentrations (see Section 5.0). These higher levels would require a greater log reduction to meet the acceptable health burden. For example, when source waters have a concentration of 1300 oocyst/100 L, a 5-log reduction in oocyst concentration would have to be achieved in order to meet the disease burden target.
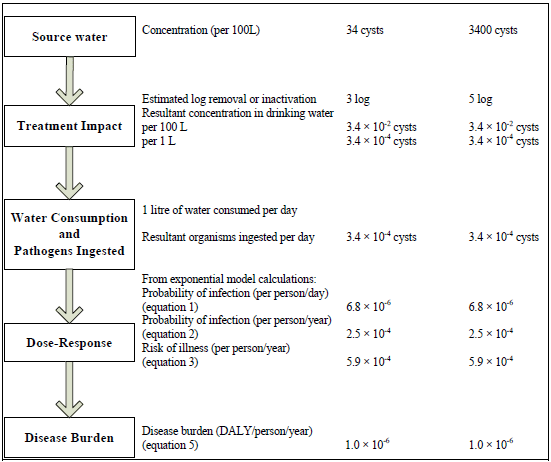
Figure 3 - Text description
The steps in a quantitative microbial risk assessment for Giardia are presented as a flow chart along with an example risk assessment calculation. On the left side of the flowchart, in boxes, are the 5 steps; on the right side, parallel to each box, is the corresponding information from the example calculation. For step 1), source water, the example uses two different concentrations: 34 and 3400 cysts per 100 litres of water. For step 2), treatment impact, the example calculations estimate a log removal and/or inactivation of 3 and 5 logs, respectively, and therefore, the resultant concentration of Giardia in drinking water would be 3.4 × 10⁻² cysts per 100 litres, or 3.4 × 10⁻⁴ cysts per per litre. For step 3), water consumption and pathogens ingested, the example calculation includes the assumption that 1 litre of water is consumed daily, therefore the number of cysts ingested per day would be 3.4 × 10⁻⁴. For step 4), dose-response, the information from step 3 and equations 1, 2 and 3 from the text, are used to calculate the probability of infection per person per day, the probability of infection per person per year, and the risk of illness per person per year which correspond to 6.8 × 10⁻⁶, 2.5 × 10⁻⁴, and 5.9 × 10⁻⁴, respectively. For step 5), disease burden, equation 5 from the text is used to calculate a disease burden, which for this example is 1.0x10⁻⁶ disability adjusted life years per person per year.
Note: The volume of water ingested is estimated at 1 L/person per day, as it considers only the unboiled amount of tap water consumed (see Gale, 1996; WHO, 2008).
Figures 3 and 4 show that a source water with a concentration of 34 cysts/100 L of water would require the treatment plant to consistently achieve at least a 3-log reduction in cyst concentration in order to meet the acceptable reference level of risk. In contrast, a concentration of 3400 cysts/100 L of water would require the treatment plant to consistently achieve at least a 5-log reduction in cyst concentration in order to meet the acceptable reference level of risk. Consequently, the health-based treatment goal of a 3-log reduction of Giardia and Cryptosporidium is a minimum requirement. A site-specific assessment should be done to determine what level of (oo)cyst reduction is needed for any given source water. Monitoring, as opposed to estimating, source water Cryptosporidium and Giardia concentrations will result in the highest-quality risk assessment. However, if measurements are not possible, estimated concentrations may be based on perceived source water quality. Information obtained from sanitary surveys, vulnerability assessments and information on other water quality parameters can be used to help estimate the risk and/or level of faecal contamination in the source water. It is important to consider, as part of the site-specific assessment, events that can significantly change source water quality, such as hazardous spills or storm events. These will have an important impact on the treatment required, and including variations in source water quality will provide the best estimate of the risk in a system. Understanding and planning for the variations that occur in source water quality create a more robust system that can include safety margins. It is also important to take into consideration the level of uncertainty that is inherent in carrying out a QMRA, to ensure that the treatment in place is producing water of an acceptable quality. A sensitivity analysis using a QMRA model such as the one described in Appendix D can also help identify critical control points and their limits.
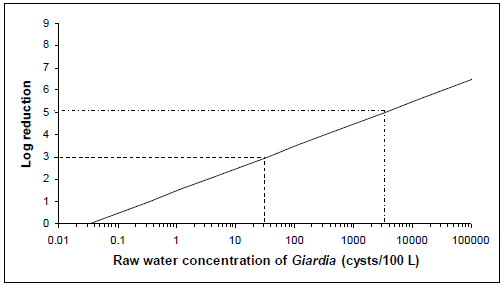
Figure 4 - Text description
The level of treatment required to meet an acceptable level of risk based on 1 L consumption for Giardia concentrations ranging from 34 cysts per 100 litres to 3400 cysts per 100 litres in raw water is presented graphically. The x-axis of the graph is the raw water concentrations of cysts per 100 litres using a log scale. The y-axis of the graph is the log removal using a linear scale. The relationship between the values on the x-axis and the values on the y-axis for the risk level of 10-6 DALY per person per year creates a diagonal line. Two examples of treatment requirements are illustrated on the graph using dotted lines. The first example draws a horizontal dotted line from the y-axis at 3 log removal. This dotted line intersects the diagonal line at 34 cysts per 100 litres of raw water. The second example draws a horizontal dotted line from the y-axis at 5 log removal. This dotted line intersects the diagonal line at 3400 cysts per 100 litres of raw water.
In order to illustrate the use of QMRA for a water treatment application, a number of test scenarios were analysed using treatment plant data from a selected city. This process is detailed in Appendix F.
QMRA is increasingly being applied by international agencies and governments at all levels as the foundation for informed decision-making surrounding the health risks from pathogens in drinking water. WHO, the European Commission, the Netherlands, Australia and the United States have all made important advances in QMRA validation and methodology (Staatscourant, 2001; Medema et al., 2006; NRMMC-EPHC, 2006; U.S. EPA, 2006a,b; WHO, 2011). With the exception of the U.S. EPA, these agencies and governments have adopted an approach that takes full advantage of the potential of QMRA to inform the development of health targets (i.e., acceptable levels of risk or disease) and site-specific risk management (e.g., water safety plans, as described in WHO, 2011). Building on the WHO work, the European Commission's MicroRisk project has published an extensive guidance document that establishes methods and a strong science basis for QMRA of drinking water (Medema et al., 2006).
The Netherlands and the U.S. EPA provide two examples of QMRA-based regulatory approaches. In the Netherlands, consistent with the WHO approach, water suppliers must conduct a site-specific QMRA on all surface water supplies to determine if the system can meet a specified level of risk. Dutch authorities can also require a QMRA of vulnerable groundwater supplies. In contrast, recent regulatory activity in the United States has seen the U.S. EPA assess the health risks from waterborne pathogens through QMRA and apply this information to set nationwide obligatory treatment performance requirements (U.S. EPA, 2006a,b). In general, drinking water systems must achieve a 3 log removal or inactivation of Giardia (U.S. EPA, 1989). To address risk from Cryptosporidium, drinking water systems must monitor their source water, calculate an average Cryptosporidium concentration and use those results to determine whether their source is vulnerable to contamination and requires additional treatment. Water systems are classified into categories ("bins") based on whether they are filtered or unfiltered systems; these bins specify additional removal or inactivation requirements for Cryptosporidium spp. (U.S. EPA, 2006a).
Health Canada and the Federal-Provincial-Territorial Committee on Drinking Water have chosen the same approach as WHO (2011), providing QMRA-based performance targets as minimum requirements, but also recommending the use of a site-specific QMRA as part of a multi-barrier source-to-tap approach.This QMRA approach offers a number of advantages, including 1) the ability to compare the risk from representative groups of pathogens (e.g., viruses, protozoa, bacteria) in an overall assessment; 2) the transparency of assumptions; 3) the potential to account for variability and uncertainty in estimates; 4) the removal of hidden safety factors (these can be applied as a conscious choice by regulatory authorities at the end of the process, if desired); 5) the site-specific identification of critical control points and limits through sensitivity analysis; and 6) the clear implications of system management on a public health outcome.