
Page 4: Guidelines for Canadian Drinking Water Quality: Guideline Technical Document - Nitrate and Nitrite
9.1 Effects in humans
9.1.1 Acute toxicity
A broad range of oral lethal nitrate and nitrite doses to humans have been reported, likely due to the wide variability in individual sensitivity. For nitrate, human oral lethal doses range from 4 to 50 g (Mirvish, 1991) and from 67 to 833 mg/kg bw (Boink et al., 1999). For nitrite, the estimated oral lethal dose for humans ranges from 1.6 to 9.5 g (Gowans, 1990; Mirvish, 1991) and from 33 to 250 mg/kg bw, the lower doses applying to children, the elderly and people with a deficiency in reduced nicotinamide adenine dinucleotide (NADH)-cytochrome b5-methaemoglobin reductase (Boink et al., 1999).
Methaemoglobinaemiais the most widely reported adverse effect associated with human exposure to nitrate or nitrite. Groups especially susceptible to methaemoglobin formation include the foetus, infants less than 6 months of age and individuals genetically deficient in NADH-cytochrome b5-methaemoglobin reductase (see Section 9.4 for mode of action).
Reviews of the literature in the United States from 1941 to 1995 (Walton, 1951; Fan et al., 1987; Fan and Steinberg, 1996) revealed cases of methaemoglobinaemia resulting from consumption of drinking water containing nitrate-nitrogen concentrations above 10 ppm (equivalent to 45 mg/L as nitrate). In spite of limitations in clinical diagnosis and determination of exact nitrate concentrations in the drinking water, nitrate concentrations above 45 mg/L were implicated in cases of methaemoglobinaemia, mostly in infants. Notably, cases of methaemoglobinaemia were observed in infants less than 6 months of age fed formula reconstituted with drinking water containing high levels of nitrate. Of the 214 clinical cases for which data were available, none occurred at nitrate levels less than 45 mg/L, and only 2% of cases occurred at nitrate levels ranging from 49 to 88 mg/L in drinking water. In fact, the majority (80%) of cases were exposed to nitrate at concentrations greater than 220 mg/L. Although infants who are breastfed may be exposed to nitrite/nitrate in breast milk, clinical methaemoglobinaemia usually occurs when infant formula and other infant foods are prepared with water contaminated with nitrate or nitrite. Young children do not appear to be as sensitive as infants. In the United States, 64 children aged 1-8 years who consumed well water containing nitrate at concentrations of 22-111 mg/L as nitrate-nitrogen (97-491 mg/L nitrate) did not have elevated methaemoglobin concentrations, compared with 38 children consuming well water containing less than 10 mg/L as nitrate-nitrogen (44.3 mg/L nitrate; Craun et al., 1981).
Since the Fan and Steinberg (1996) review, additional reports have supported the role of elevated levels of nitrate in cases of methaemoglobinaemia. An epidemiological study investigated the prevalence of methaemoglobinaemia in five areas in India with average nitrate concentrations of 26, 45, 95, 222 and 495 mg/L in drinking water (Gupta et al., 1999). In total, 178 people (approximately 30 per dose and representing about 10% of the total population from each of the five areas) were matched for age and weight. After examination of histories and percent methaemoglobin in blood samples, it was found that high nitrate concentration correlated with (significance level not provided) methaemoglobinaemia in all groups, especially in individuals less than 1 year and greater than 18 years of age; the highest levels of methaemoglobin were measured in infants less than 1 year of age. High levels of methaemoglobin were observed in all age groups and at all nitrate concentrations in drinking water. Maximum methaemoglobin levels (7-27%) were observed at nitrate levels of 45-95 mg/L in all age groups. Maximum adaptation of NADH-cytochrome b5-methaemoglobin reductase activity occurred at a nitrate concentration of 95 mg/L in drinking water and decreased to baseline at a nitrate concentration of 200 mg/L. In children up to 8 years of age, the main symptom was cyanosis, but recurrent respiratory infections (40-82% of children), stomatitis (17-24% of children) and diarrhoea (33-55% of children) were also reported (Gupta et al., 1999).
A retrospective nested case-control study of 71 Romanian children found an association between nitrate exposure from drinking water and clinical methaemoglobinaemia (Zeman et al., 2002). Mean nitrate levels were 103.6 and 11.2 mg/kg bw/day for cases and controls, respectively. Methaemoglobinaemia was most strongly associated with nitrate exposure through the dietary route via infant formula reconstituted with water containing nitrate at concentrations of 253 mg/L compared with 28 mg/L (P = 0.0318). It was found that breast feeding protects infants younger than 6 months of age (P = 0.0244). Diarrhoeal disease was also associated with the development of methaemoglobinaemia, with a likelihood ratio of 4.323 (P = 0.0376). This association is not as highly significant as the association between methaemoglobinaemia and nitrate exposure (likelihood ratio 29.7, P = 0.0001). Although more cases than controls experienced recurring diarrhoea, cases overwhelmingly indicated that diarrhoea episodes were not associated with cyanosis (Zeman et al., 2002). However, exposure levels were measured years after clinical incidence, and no measures of methaemoglobin levels, a true measure of methaemoglobinaemia, were reported.
Some cases of illnesses due to accidental ingestion of nitrate/nitrite were also reported. The U.S. Centers for Disease Control and Prevention (CDC, 1997) reported two events. In the first event, methaemoglobinaemia was diagnosed in 29 of 49 students who consumed leftover soup containing nitrite at 459 mg/L; in 14 students, the methaemoglobin levels were above 20% (range 3-47%). Manifestations included cyanosis, nausea, abdominal pain, vomiting and dizziness. In the second event, four out of six office workers showed elevated methaemoglobin levels (6-16%) after drinking leftover coffee containing nitrite at 300 mg/L; no estimates of nitrite intake were made. In both events, the nitrite originated from contaminated tap water. Other case reports include life-threatening methaemoglobinaemia associated with consumption of sodium nitrite crystals in tea at concentrations of 5100 mg/L, 5000 mg/L and 4900 mg/L (equivalent to 3401.7, 3335 or 3268.3 mg nitrite/L) in twin 4-year-old boys and their 2-year-old sister (Finan et al., 1998); intense cyanosis, fainting, abdominal pain and diarrhoea with levels of methaemoglobin above 10% after a 23-year-old woman ingested an unknown amount of ammonium nitrate from an ice pack (Brunato et al., 2003); and illness after two infants consumed formula reconstituted with well water containing nitrate-nitrogen at 22.9 mg/L (~101.4 mg/L nitrate; no bacterial contamination found) or 27.4 mg/L ( 121.4 mg/L nitrate; Escherichia coli contamination detected), resulting in less than 2% and 91% methaemoglobin concentrations in the two infants (Knobeloch et al., 2000). Kortboyer et al. (1998) reported that a single intravenous dose of 0.12 mmol sodium nitrite per millimole haemoglobin induced 10.8% methaemoglobin in the blood of three healthy volunteers; this dose was considered the maximum safe dose. Healthy volunteers were then given 0.04, 0.08 or 0.12 mmol sodium nitrite, and effects of mild intensity were reported, including lower blood pressure accompanied by a compensatory increase in heart rate at all doses (Kortboyer et al., 1998). Conversely, Shuval and Gruener (1972) found no differences between mean methaemoglobin levels in 1702 (1- to 90-day-old) infants with nitrate at 50-90 mg/L in their water supply compared with 758 infants with nitrate at 5 mg/L in their water supply.
Limitations in the above studies make it difficult to interpret the association between nitrate/nitrite intake and methaemoglobinaemia. Specifically, exposure data are often obtained weeks or months after acute illness, and water consumed by affected infants in most studies had microbial contamination, which may increase endogenous nitrite formation and methaemoglobin levels. The Fan and Steinberg (1996) review also reported the possibility that methaemoglobinaemia may be associated with both the presence of nitrate and bacterial contamination of drinking water, favouring the conversion of nitrate to nitrite and the occurrence of diarrhoea, which, in infants, could increase the risk of developing methaemoglobinaemia.
Enteric infections, potentially caused by faecal bacterial contamination in wells, may lead to the endogenous production of nitrite, as evidenced by numerous published reports of infants with diarrhoea and methaemoglobinaemia but no apparent exposure to exogenous methaemoglobin-forming agents. In a study of infants (1 week to 1.5 years old) consuming low levels of nitrate plus nitrite (30-110 µmol), the blood nitrate level was higher in 58 infants with acute diarrhoea than in 60 controls without gastrointestinal disturbances: 71-604 µmol/L versus 37.1 ± 19.4 µmol/L, respectively (Hegesh and Shiloah, 1982). Generally, the higher nitrate concentrations correlated with diarrhoea severity and higher percentage of total haemoglobin as methaemoglobin (0.4 to > 8% in cases compared with 0.6% in controls). Furthermore, in the infants with diarrhoea, the daily excretion of nitrate was several times higher than the daily intake of nitrate. The authors suggested that diarrhoea results in endogenous de novo synthesis of nitrite, and this is the principal cause of infantile methaemoglobinaemia (Hegesh and Shiloah, 1982). Additional support comes from Terblanche (1991), who reported cases of methaemoglobinaemia in infants due to feeding with various brands of regular powdered milk containing spores of Bacillus subtilis, a nitrate-reducing bacterium. Acidified milk powders, often prepared by fermentation, did not cause methaemoglobinaemia (Terblanche, 1991). More support comes from a prospective evaluation of 45 patients (< 3 months of age) admitted to hospital for gastroenteritis and methaemoglobinaemia; although only 22% of infants had a positive stool culture, the authors reported suggestive evidence of bacterial aetiology of methaemoglobinaemia (Hanukoglu and Danon, 1996).
A review of research and historical cases has integrated multiple pieces of evidence to support endogenous nitrite formation due to bacterial-contaminated water as the cause of many cases of methaemoglobinaemia (Avery, 1999):
- because diarrhoea was a prominent symptom in the majority of drinking water-linked methaemoglobinaemia cases, the evidence suggests that diarrhoea, gastrointestinal infection and inflammation are the principal causative factors in infantile methaemoglobinaemia (not only the ingested nitrates). Diarrhoea and vomiting are not symptoms that typically accompany cyanosis, methaemoglobinaemia due to oxidant drug exposure or genetic abnormalities in haemoglobin;
- in studies reporting infants suffering from diarrhoea and methaemoglobinaemia without excess exogenous exposure to nitrite, nitrate excretion is 10 times higher than the amount ingested;
- protein intolerance accompanied by diarrhoea or vomiting has also been reported to cause methaemoglobinaemia in infants less than 6 months of age without excessive intake of nitrate through food and water;
- over 90% of nitrate exposure comes from food, and the only methaemoglobinaemia cases linked to food have involved very high levels of nitrate contamination. For example, seven infants were diagnosed with methaemoglobinaemia linked to consumption of silver beets (mean nitrate concentration 3200 mg/kg); infants had 10-58% methaemoglobin levels and consumed water containing a nitrate concentration of 3-6 mg/L (Sanchez-Echaniz et al., 2001); and
- cases of methaemoglobinaemia resulting from bacterial infections (e.g., urinary tract infections) have been reported in the absence of nitrate consumption.
Avery (1999) proposed that the correlation between nitrate in drinking water and methaemoglobinaemia incidence may be explained by: (1) nitrate contamination being an indicator of bacterial contamination; or (2) exogenous nitrate exacerbating the formation of nitrite (under conditions of gastrointestinal inflammation or infection) while inhibiting the conversion of nitrite to ammonia (non-harmful). The enzyme that converts nitrite to ammonia is inhibited by elevated nitrate concentrations. The author further stated that this may explain the wide variability in susceptibility to methaemoglobinaemia and suggested that the current allowable nitrate/nitrite limits in drinking water that are based solely on infantile methaemoglobinaemia may be unnecessarily strict.
In support of Avery's (1999) proposal, Charmandari et al. (2001) reported that plasma nitrate concentrations, and hence endogenous nitric oxide production, could discriminate between acute and chronic diarrhoea in children 4 months to 2 years of age. Patients with infectious diarrhoea had significantly higher endogenous nitric oxide production and significantly (P < 0.5) higher plasma nitrate levels (405 ± 281 µmol/L in 14 cases) compared with chronic diarrhoea cases (134.7 ± 77 µmol/L in 13 cases) or controls (54.1 ± 20 µmol/L in 14 controls).
In a literature review conducted for the World Health Organization (WHO), no exposure-response relationships between levels of nitrate in drinking water and methaemoglobinaemia were found (Fewtrell, 2004).
Acquired methaemoglobinaemia can result from exposure to some chemicals (e.g., sulphate, chlorite, chloramines, chlorate) and pharmaceuticals (e.g., lidocaine, benzocaine, sulphonamides, dapsone, nitroglycerine) (Bruning-Fann and Kaneene, 1993; Sanchez-Echaniz et al., 2001).
9.1.2 Subchronic toxicity
9.1.2.1 Thyroid effects
Several studies suggest that nitrate exposure alters human thyroid gland function by competitively inhibiting thyroidal iodide uptake, leading to decreased thyroid hormone secretion (triiodothyronine [T3], thyroxine [T4]) and increased levels of thyroid stimulating hormone (TSH). Hyperstimulation by TSH, in turn, can result in thyroid gland enlargement or goitre (see Section 9.4.1 for mode of action). Thyroid hormones are essential for normal biological function and critical for neurological development, skeletal growth, metabolism and the cardiovascular system. Urinary iodide measurements are used globally to indicate and monitor iodide sufficiency in populations. If no initial iodine deficiencies are reported, there is an increased possibility that the observed effects on thyroid gland function are due to nitrate exposure. However, the lack of iodine deficiency does not exclude the possibility that the observed effects are due to the presence of other chemicals in the drinking water that inhibit iodine uptake.
In the Netherlands, a cross-sectional study (Van Maanen et al., 1994) examined two groups of women exposed to low (estimated at 0.02 mg/L, n = 24) and medium (17.5 mg/L, n = 27) nitrate concentrations in tap water and two groups exposed to medium (< 50 mg/L, n = 19) and high (> 50 mg/L, n = 12) concentrations of nitrate in well water. Urinary and salivary nitrate concentrations were related, in a dose-dependent manner, to the consumption of water containing nitrate. No iodide deficiencies were observed in any nitrate-exposed groups. A dose-dependent increase in thyroid volume measured by ultrasound was observed among the group exposed to high levels of nitrate relative to the two medium and low exposed groups. Although the authors omitted many outliers, they found that hypertrophy of the thyroid was associated, paradoxically, with significantly lower TSH levels and significantly higher T4 levels in the high exposed group compared to the medium exposed groups. For the entire population, linear regression analysis showed significant correlations between thyroid volume and nitrate concentrations in drinking water, as well as between thyroid volume and thyroglobulin levels. Thus, an effect on thyroid was observed in drinking water at nitrate concentrations exceeding 50 mg/L.
The effects of nitrate in drinking water on thyroid function were also studied in children in Slovakia (Tajtakova et al., 2006; Radikova et al., 2008). Thyroid function was compared between 324 children (aged 10-13 years) from a community with nitrate concentrations of 51-274 mg/L in their drinking water and 168 children of the same age living in communities with nitrate concentrations below 2 mg/L in their drinking water. Urinary iodide levels were similar and within normal range (approximately 100-150 µg/L in both areas). The nitrate-exposed children presented with larger thyroid glands and an increased frequency of signs of thyroid disorder (13.7% vs. 4.7% hypoechogenicity, P < 0.01; 4% vs. 0% increased TSH levels; 2.5% vs. 0% positive thyroperoxidase antibodies). The increased TSH levels were in the range of subclinical hypothyroidism (> 4.0 mIU/L). However, there were no differences in concentrations of total T4 or free T3 between the two groups. The increase in thyroid gland size and slight increase in the number of children with TSH concentrations above the clinical range suggest that in the nitrate-exposed children, the hypothalamic-pituitary-thyroid (HPT) axis is hyperstimulated, supporting an antithyroid mode of action. However, the authors did not control for effects of other potential endocrine disruptors.
In Bulgaria between 1990 and 1994, a 40.9% increase in the incidence of goitre was found in 181 children (6-14 years) exposed to nitrate concentrations of 78-112 mg/L in drinking water compared with 178 children of the same age exposed to nitrate at 28-48 mg/L (Gatseva and Dimitrov, 1997; Gatseva et al., 1998). In later studies, 156 children (7-14 years) from villages where, in 2006, an average nitrate concentration of 75 mg/L was found in their drinking water were compared with 163 children from villages found to have a nitrate concentration of 8 mg/L in their drinking water. The population was iodine sufficient overall. The children from the higher-nitrate villages had a significant increased prevalence of goitre relative to children from reference villages (odds ratio [OR] = 3.0; 95% confidence interval [CI] = 1.3-7.0; P = 0.01) (Gatseva and Argirova, 2008a). However, the study did not account for the possibility of iodine deficiency in the minority of participants with the largest goiters and the lowest urine iodine concentrations. In addition, thyroid function was not evaluated, there was no biomarker of nitrate exposure and other endocrine disruptors were not evaluated.
In contrast, for younger children (3-6 years) exposed to a nitrate concentration of 93 mg/L (n = 50), there was no significant alteration in prevalence of thyroid dysfunction or goitre compared with that found in children of similar age consuming drinking water containing a nitrate concentration of 8 mg/L (n = 49) (OR = 2.3; 95% CI = 0.85-6.4; P = 0.14) (Gatseva and Argirova, 2008b). In these children, urinary iodine concentrations were lower in nitrate-exposed than in non-exposed children. The same study found a significant increase in the relative risk of thyroid disorders for pregnant women (17-37 years) living in the village with a nitrate concentration of 93 mg/L in the drinking water (n = 26) compared with women (n = 22) living in areas with a nitrate concentration of 8 mg/L in the drinking water (OR = 5.29; 95% CI = 1.003-27.94; P = 0.0454). Significant differences were also found between goitre rate in exposed and non-exposed pregnant women. However, mean and median urinary iodide concentrations were significantly decreased in nitrate-exposed versus non-exposed pregnant women (P < 0.0001). In addition, a small (exact number not reported) percentage of the study population was iodide deficient. Strong conclusions from this study could not be drawn because of these iodide deficiencies as well as the lack of measurements of thyroid hormone levels, biomarker of nitrate exposure and other endocrine disruptors.
Overall, these studies suggest that exposure to high levels of nitrate in drinking water (> 50 mg/L) may be associated with increased thyroid volume. The effects of nitrate on thyroid function were inconsistent across studies. High nitrate exposure was associated with lower serum TSH in adult women in the study by van Maanen et al. (1994), but was associated with higher rates of subclinical hypothyroidism (TSH elevation) in children in the Slovakian study (Tajtakova et al., 2006; Radikova et al., 2008).
In Germany, Hampel et al. (2003) examined the correlation between urinary nitrate levels and the prevalence of goitre or nodules (corrected for urinary iodide levels) in 3059 clinically healthy adults (18-70 years; both sexes). Urinary nitrate level (55.2 mg nitrate per gram creatinine, average of 61.5 mg nitrate per gram creatinine for men and 51.5 mg nitrate per gram creatinine for women; P < 0.03) was not correlated with thyroid size or nodules. However, the authors reported a weak correlation between nitrate level in urine and thyroid size (r = 0.18, P < 0.05) in 71 adults with decreased iodide in urine (< 50 µg/g creatinine). Further, there was a weak correlation between urinary nitrate concentrations above 60 mg nitrate per gram creatinine in 1166 adults and thyroid size (r = 0.18; P < 0.01). Subsequently, Below et al. (2008) conducted a cross-sectional survey of 3772 adults (20-79 years old; men and women) in a previously iodine-deficient area. The analysed nitrate content in the publicly supplied drinking water was 2.5-10 mg/L. Since 80-90% of nitrate intake is renally eliminated, the study measured mean urinary nitrate concentrations as an estimate of nitrate exposure. For the entire population the mean urinary nitrate concentration was 53 mg/L and the 75th percentile was 69 mg/L, indicating a significant dietary nitrate exposure. No association with increased thyroid volume (P = 0.47) or risk of goitre (P = 0.69) was found when comparing the individuals with high urine nitrate (115 ± 2.2 mg/L) with individuals with lower nitrate in their urine (32 ± 0.2 mg/L). Although the authors stated that the study population had sufficient iodide intake, no measures were reported; in addition, no measurements of thyroid hormone concentrations were made.
Most recently, in the United States, Ward et al. (2010) found a 24% higher prevalence of hypothyroidism among women in the highest dietary nitrate intake quartile (> 41.1 mg/L per day as NO3-N; >182 mg/L as NO3¯) compared with those in the lowest dietary intake quartile (< 17.4 mg/L per day as NO3-N or < 77 mg/L as NO3¯; OR = 1.2; 95% CI = 1.1-1.4), but reported no association between the prevalence of hypothyroidism and nitrate concentration in drinking water. The large study population of 21 977 older women was limited in that it relied on self-report measures, lacked individual exposure assessment, did not control for iodide intake levels and did not measure thyroid hormone levels.
In addition, subchronic exposure to sodium nitrate at 15 mg/kg bw (equivalent to 10.9 mg NO3¯/kg bw) daily in 200 mL of drinking water did not cause changes in thyroid gland function in a healthy population (Hunault et al., 2007). In this study, conducted in the Netherlands, 10 adults randomly received sodium nitrate at 15 mg/kg bw (equivalent to 10.9 mg NO3¯/kg bw), whereas 10 adults received 200 mL distilled water once a day for 28 days. Both groups followed an iodide-restricted and low-nitrate diet prior to and during the study period; compliance was measured by urinary iodide and plasma nitrate levels. The plasma nitrate concentrations differed by 2.7 mg/kg between the treated and control groups on day 28. At day 29, no significant effects on thyroidal iodine uptake and thyroid hormone (T3, T4 and TSH) plasma concentrations were observed. The study demonstrated no significant effects on thyroidal iodine uptake and thyroid hormone plasma concentrations in humans following subchronic exposure to sodium nitrate at 15 mg/kg bw/day (equivalent to 10.9 mg NO3¯/kg bw/day). Also, no elevation of the percentage of methaemoglobin was observed after the 4-week exposure to nitrate. Except for the low number of subjects, the study had no major limitations.
Blount et al. (2009) measured three sodium/iodide symporter (NIS) inhibitors (perchlorate, thiocyanate and nitrate) and iodide in maternal and foetal fluids collected during caesarean section on 150 American women. With mean urinary nitrate levels of 47 900 µg/L and urinary iodide levels of 1420 µg/L (indicating excess levels of maternal iodide), the study found sufficient iodide levels in the foetus and no association between cord levels of three NIS inhibitors and newborn weight, length or head circumference, which are potential downstream effects of altered thyroid function (see mode of action in Section 9.4.1 for details).
Other factors may confound thyroid hormone function, including iodine insufficiency, age and pregnancy. Iodine insufficiency of the population due to lack of iodine in the diet or from other dietary exposures (e.g., thiocyanates in tobacco or brassica vegetables) (Vanderpas, 2006) or pollutant goitrogens (e.g., perchlorate) (Blount et al., 2006) may increase susceptibility to effects of increased nitrate. In addition, the effects on thyroid hormone synthesis can be more profound during pregnancy and for newborns (see mode of action in Section 9.4.1 for details).
9.1.2.2 Insulin-dependent type 1 diabetes mellitus
Together, the data suggest some association between intake of nitrogen-containing compounds and risk of insulin-dependent type 1 diabetes mellitus (IDDM). However, the data are limited and inconsistent; more accurate estimation of the total intake of nitrate, nitrite or nitrosamines at an individual level may be necessary for a conclusive assessment of their relationship with IDDM.
Positive associations between nitrate levels in drinking water and the incidence of IDDM in children (0-18 years) were reported in two ecological studies: in Colorado, U.S. (Kostraba et al., 1992), children exposed to nitrate concentrations of 0.77-8.2 mg/L vs. 0.0-0.084 mg/L were at increased risk of IDDM (correlation = 0.29; P = 0.02; 1280 cases, 1979-1988); in Yorkshire, England (Parslow et al., 1997; McKinney et al., 1999), the rate of IDDM was 15% higher among water supply zones with average nitrate levels of 14.9-41.0 mg/L vs. < 3.2 mg/L (relative risk [RR] = 1.3; P < 0.05; 1797 cases, 1978-1994); however, exposure measurements were obtained from 1990 to 1995. Conversely, no significant risks were identified for childhood diabetes from exposure to nitrate in drinking water in 594 water supply zones in Scotland and Central England (Paediatric Epidemiology Group, 1999). The study included 886 English and 1376 Scottish children (<15 years old) diagnosed with IDDM between 1990 and 1986 and estimates of population exposure were mean monthly nitrate levels of 22.94 and 2.07 mg/L, respectively, for the same time period.
Associations between dietary intake of nitrate, nitrite or nitrosamines and the incidence of IDDM in children (0-14 years) were positive for exposure to high nitrogen-containing foods from Sweden (OR = 2.4; P < 0.05; 339 cases and 528 controls; Dahlquist et al., 1990) and for medium- and high-nitrate food exposure groups from Finland (OR = 1.5 and 2.3, respectively; P < 0.05; 471 cases and 452 controls; Virtanen et al., 1994). However, nitrate exposure was poorly reported.
No associations were reported between the incidence of IDDM in children (0-18 years) and exposure in drinking water to 7 mg/L nitrate or 0.01 mg/L nitrite in Finland (471 cases and 452 controls between 1986 and 1989; Virtanen et al., 1994), 0.25-2.1, 2.1-6.4 or 6.4-41 mg/L nitrate in the Netherlands (1104 cases between 1991 and 1995; Van Maanen et al., 2000), less than 18 mg/L nitrate in Italy (1142 cases between 1989 and 1998; Casu et al., 2000), 0.49-31.9 mg/L nitrate in England (570 cases between 1975 and 1996; Zhao et al., 2001) or 6.6 mg/L nitrate in Finland (3564 cases between 1987 and 1996; Moltchanova et al., 2004).
9.1.2.3 Balkan endemic nephropathy (BEN)
Two cross-sectional studies did not find any association of nitrate or nitrite in drinking water with BEN, a form of interstitial nephritis.In Niagolova et al. (2005), 65 water samples from 27 Bulgarian villages classified as "ever had a recorded case of BEN" versus "never" had nitrate plus nitrite concentrations of 1.6-47.4 mg/L versus 1.2-22 mg/L for spring-fed water samples and 7.7-103 mg/L versus 14.9-75.7 mg/L for well water samples, respectively; no significant differences in mean concentrations were observed between BEN and non-BEN samples from each source. In Yugoslavia (Radovanovic and Stevanovic, 1988), levels of nitrate and nitrite did not significantly differ between 10 study wells used by people with the highest proportion of β2-microglobulin (earliest and most specific indication of BEN) in the urine compared with 10 control wells used by people without hyper-β2-microglobulin-urea. Of the 112 people examined, 60 used the study wells and 52 used the control wells. At study wells, the mean nitrate levels were 8.97 (0.42-23.73) mg/L as nitrate-nitrogen, and mean nitrite levels were 0.81 (0.00-2.38) mg/L as nitrite-nitrogen. At the control wells, the mean nitrate levels were 9.85 (2.80-22.40) mg/L as nitrate-nitrogen, and mean nitrite levels were 0.70 (0.00-1.82) mg/L as nitrite-nitrogen. Both studies concluded that nitrogen compounds alone are not likely to directly cause BEN.
9.1.3 Long-term exposure and carcinogenicity
The major concern associated with long-term exposure to nitrate and nitrite is the formation of N-nitroso compounds (NOCs), many of which are carcinogenic. Numerous epidemiological studies have been undertaken on the relationship between ingested nitrate and nitrite and human cancer
The number of well-designed epidemiological studies with individual exposure data and information on nitrosation inhibitors and precursors are few for any single cancer site, limiting the ability to draw conclusions about cancer risk. Moreover, studied populations had exposures mostly below 45 mg NO3¯/L and the small numbers of cases with high water nitrate exposure limited the ability to evaluate risk among subgroups likely to have endogenous nitrosation. Most of the studies lacked information on cancer risk factors (e.g., Helicobacter pylori in gastric cancer), which are important effect modifiers for carcinogenic NOC exposure.
High intake of certain vegetables (or fruits), although an important source of nitrate, seems to be associated with a lower risk of most of the cancers. Protective factors such as dietary antioxidants (e.g., vitamin C), which are simultaneously present in these foods, may play an important role (Gangolli et al., 1994). For this reason, dietary nitrate may result in less endogenous formation of the carcinogenic NOCs compared with nitrate in drinking water.
Considering the limitations of the studies (design flaws such as limited data on nitrate concentrations, inability to account for potential confounders and use of cancer mortality rates rather than incidence rates), the focus of this evaluation is on studies with individual exposure data (historical monitoring data, individual estimates of exposure and information on potential confounders).
9.1.3.1 Gastrointestinal tract tumours
Several case-control and cohort studies evaluated the relationship between nitrate or nitrite intake (drinking water and dietary) and risk of cancer of the gastrointestinal tract. Overall, the results from these studies were ambiguous; no clear association could be drawn from these studies.
Nitrate
Epidemiological studies that assessed the relationship between nitrate in drinking water and cancer have primarily focused on stomach cancer. Results from these studies were mixed, with some studies showing positive associations (Morales-Suarez-Varela et al., 1995; Sandor et al., 2001), others showing no association (Joossens et al., 1996; Barrett et al., 1998; Van Leeuwen et al., 1999) and a few showing inverse associations (Beresford, 1985; Barrett et al., 1998). Some studies conducted in Slovakia, Spain and Hungary found positive correlations between stomach cancer incidence or mortality and historical measurements of drinking water nitrate concentrations near or above 10 mg NO3-N/L - equivalent to 44 mg NO3¯/L (Morales-Suarez-Varela et al., 1995; Sandor et al., 2001; Gulis et al., 2002).
In a matched case-control study, Yang et al. (1998) investigated the association between gastric cancer mortality and nitrate levels in municipal supplies in Taiwan. The odds ratios adjusted (ORadj) for possible confounders were significantly higher in the two highest tertiles of nitrate exposure [highest tertile ≥ 0.45 mg NO3-N/L (equivalent to 2 mg NO3¯/L), ORadj = 1.10, 95% CI = 1.00-1.20; medium tertile 0.23-0.44 mg NO3-N/L (equivalent to 1-1.9 mg NO3¯/L), ORadj = 1.14, 95% CI = 0.04-1.25]. Overall, the study showed a significant positive association between drinking water nitrate exposure and gastric cancer mortality. In contrast, Rademacher et al. (1992) found no association between gastric cancer mortality and higher nitrate levels [range: > 0.5 to > 10 mg NO3-N/L (equivalent to > 2.2 to > 44 mg NO3¯/L)] from U.S. public municipal and private water sources.
In the Netherlands, Van Loon et al. (1998) also did not find an association between nitrate intake from drinking water and gastric cancer in a cohort of men and women, after 6.3-years of follow-up. This study also found no significant association between dietary nitrate and the incidence of gastric cancer. A further analysis of the effect modification of vitamin C intake did not reveal a positive association.
In a recent population-based case-control study in Nebraska, U.S., Ward et al. (2008) did not observe an association between intake of nitrate from public water supplies and stomach or oesophagus cancer.
Yang et al. (2007) did not find an association between colon cancer mortality and exposure to nitrate through drinking water, even after adjusting for confounding factors. However in another series of studies by the same author, the risk for development of rectal cancer was statistically significantly increased only for individuals with the highest nitrate exposure [≥ 0.45 mg NO3-N/L (equivalent to 2 mg NO3¯/L)]. In contrast, Weyer et al. (2001) found an inverse association between drinking water nitrate exposure and rectal cancer that was mainly restricted to the highest quartile [> 2.46 mg NO3-N/L (equivalent to 11 mg NO3¯/L)] of exposure in a large U.S. prospective cohort study in women. The authors also reported no evidence of a clear and consistent association with colon cancer; this pattern did not change after multivariate adjustment.
In a case-control study, De Roos et al. (2003) also showed no overall association between colon or rectal cancers and levels of public drinking water nitrate in Iowa (USA) towns [average nitrate levels ranged up to > 5 mg NO3-N/L (equivalent to 22 mg NO3¯/L)]. However, exposure to nitrate concentrations above 5 mg NO3-N/L for more than 10 years was associated with increased colon cancer risk among subgroups with low vitamin C intake (OR = 2.0, 95% CI = 1.2-3.3) and high meat intake (OR = 2.2, 95% CI = 1.4-3.6). These patterns were not observed for rectal cancer.
An overall colorectal cancer risk was not observed, even after adjustment for confounding factors, in a population-based case-control study in women in the U.S. (McElroy et al., 2008). However, when stratified by area in the colon (proximal and transverse colon, distal colon and rectal), an increased risk was observed for proximal colon cancer for women in the highest category [≥ 10.0 mg NO3-N/L (equivalent to 44 mg NO3¯/L), ORadj = 2.91; 95% CI = 1.52-5.56] compared with women in the lowest exposure category [< 0.5 mg NO3-N/L (equivalent to < 2 mg NO3¯/L)], in the age-adjusted model. These ORs did not change after adjustment for known and suspected colorectal cancer risk factors.
Nitrites
Evidence from case-control studies supported an association between nitrite and nitrosamine intake and gastric cancer risk, but was insufficient regarding oesophageal cancer risk (Jakszyn et al. 2006b). Van Loon et al. (1998) found that the association between dietary nitrite intake and gastric cancer risk was not clear after 6.3 years of follow-up and was still ambiguous even after adjustment for confounding factors. Neither the relative risks nor the trend (p-trend = 0.24) were significant. However, it is important to note that the follow-up time in this study (6.3 years) is relatively short compared to the latency period of gastric cancer,which may be decades, and that dietary nitrite intake had likely greatly decreased many years before study (Van Loon et al., 1998). Knekt et al. (1999) reported no association between nitrite intake and the incidence of stomach or colorectal tumours in a cohort study with a 24-year follow-up. However, these last two studies failed to evaluate effect modification between nitrite and dietary antioxidants.
In case-control studies in Italy, Palli et al. (2001) found that the highest risk of gastric cancer was among those with a higher nitrite and a lower antioxidant intake, subgroups of the population that would be expected to have higher rates of endogenous nitrosation.
A positive association between oesophagal and/or stomach cancer with nitrite intake in the diet as well as a significant interaction with vitamin C were seen in two case-control studies (Mayne et al., 2001; Rogers et al., 1995).
De Roos et al. (2003) found that dietary nitrite intake was positively associated with colon and rectum cancers, with 50% to 70% increased risk at levels in the highest quartile; this increased risk was associated primarily with nitrite intake from animal sources rather than vegetables.
9.1.3.2 Non-Hodgkin's lymphoma (NHL)
Overall, most of studies showed reduced or no association between NHL and drinking water nitrate levels. Nitrite failed to show an association between dietary nitrite and NHL.
Nitrates
In a study conducted in Slovakia, the incidence of NHL and colorectal cancer was significantly elevated among men and women exposed to public water supplies with nitrate levels of 4.5-11.3 mg NO3-N/L (equivalent to 20-50 mg NO3¯/L) (Gulis et al., 2002); the same study reported no association with bladder and kidney cancer incidence. In contrast, negative results were found with NHL in the U.K. (Law et al., 1999), whereas in Sardinia, Italy, there was limited evidence among men, but not women, of an association between NHL incidence and nitrate concentrations in community water supplies (Cocco et al., 2003).
In two population-based case-control studies of NHL conducted in the United States, no association between nitrate levels in community water supplies and NHL were observed (Freedman et al. 2000; Ward, et al., 2006). Chang et al. (2010) also found no association between drinking water nitrate levels up to 2.86 mg NO3-N/L (equivalent to 13 mg NO3¯/L) and increased risk of death from NHL in his combined case-control and ecological study conducted within a Taiwanese population.
Weyer et al. (2001) in analyzing the incidence of NHL in a cohort of women in the USA found a weak inverse association (i.e. reduced risk) between drinking water nitrate levels up to > 2.46 mg NO3-N/L (equivalent to 11 mg NO3¯/L) and risk of NHL; after adjustment for confounders, this association strengthened. This study also observed no association between NHL and dietary nitrate.
Different results were obtained in a U.S. case-control study conducted with both sexes by Ward et al. (1996). The average drinking water nitrate levels ranged up to ≥ 4 mg NO3-N/L (equivalent to 18 mg NO3¯/L). There was a dose-response relationship with a 2-fold increased risk of NHL associated with exposure in the highest quartile of nitrate in drinking water. This relationship was not changed after adjustment for dietary nitrate, vitamin C intake or carotene intake. The authors concluded that long-term exposure to elevated nitrate levels in drinking water may contribute to NHL risk. As part of the same study, the authors found that nitrate levels in private wells were not associated with the risk of NHL after adjusting for pesticide use on the farm (Ward et al., 1996).
An inverse association was observed between NHL and dietary nitrate as part of the same study by Ward et al. (1996). After adjusting for the intake of vitamin C and carotenes, the dietary nitrate relationship was attenuated.
Nitrites
Ward et al. (2010) found no association between processed meat intake and an increased risk of NHL, but rather found an association with plant based sources (baked good and cereals) which could not be explained. No association was seen in an earlier dietary study by Ward et al. (1996).
9.1.3.3 Brain tumours
In general, the potential association between ingested nitrate or nitrite and tumours of the central nervous system (mainly the brain) have been investigated in adults and children separately. When considering nitrate or nitrite levels from either the diet or drinking water, results were mixed; no clear association can be made between brain tumours and nitrate/nitrite.
Nitrates
Studies in adults
Two case-control studies, one in the U.S. (Ward et al., 2005a), and another in Germany (Steindorf et al., 1994), found no association between nitrate levels in public water supplies and adult brain cancer. Mean nitrate exposures were up to > 25.2 mg NO3-N/L (equivalent to 111 mg NO3¯/L; Steindorf et al., 1994) and up to > 4.32 mg/ NO3-N/L (equivalent to 19 mg NO3¯/L; Ward et al., 2005). No evidence of interaction was seen between drinking water nitrate, dietary vitamin C intake and smoking status. No association was found between increasing tertiles of nitrate level in water from private wells and glioma risk (Ward et al., 2005).
In another U.S. case-control study, Chen et al. (2002) found no association between dietary sources of preformed nitrosamines or high-nitrate vegetables and glioma. After adjusting for potential confounders, an inverse association was observed between the risk of glioma and intakes of dark yellow vegetables and beans.
In a study conducted in Yorkshire, England, the incidence of brain and central nervous system cancers was found to be higher in areas with higher nitrate levels in the drinking water (Barrett et al., 1998).
Studies in children
In a U.S. population-based case-control study conducted by Mueller et al. (2001), childhood brain tumours were not associated with nitrate levels in water supplies; however, women in one of the three study centres, who used private wells as their drinking water source during the pregnancy, had a significantly increased risk of brain cancer in their offspring (Mueller et al., 2001).
However, in an international collaborative case-control study, Mueller et al. (2004) found no significant association between childhood brain tumours (based on 836 childhood cases) and drinking water, although the risk for astroglial tumours showed a non-significant, 2-fold increase for the highest category of nitrate exposure (≥ 50 mg NO3¯/L)
Nitrites
Studies in adults
In adults, mostly negative results were seen in a review by IARC (2010), as well as in a meta-analysis of 9 studies (Huncharek et al., 2003). Murphy et al. (1998) observed that trends in the incidence of brain tumours and consumption of cured meat in the both age groups (children and adults) do not support an association. Other studies examined the possible interaction between consumption of cured meat and intake of vitamins (e.g., vitamin C), fruit or vegetables. The greatest cancer risk was observed in those having a high intake of cured meats and low intake of antioxidants (Bunin et al., 1994; Preston-Martin et al., 1996; Blowers et al., 1997).
Studies in children
Only one case control study investigated the association between childhood brain tumours and nitrate in drinking water based on data from 4 countries (Mueller et al. 2004). The risk of childhood brain tumours associated with the presence of detectable nitrite at levels of 1 to <5 mg NO2-N/L (equivalent to 3.3 to < 16 mg NO2¯/L) were modestly, but not significantly, increased. This association was stronger among children who had astrocytoma who were exposed to 1 to <5 and ≥5 mg NO2-N/L (equivalent to 3.3 to < 16, and ≥16 mg NO2¯/L, respectively).
In dietary studies, several case control studies suggested an association between childhood brain tumours and consumption of cured meats by mothers during pregnancy and/or by the children themselves (Preston-Martin et al., 1996; Pogoda and Preston-Martin, 2001). A meta-analysis which included some of these studies also suggested a limited association between consumption of cured meat and the occurrence of childhood brain tumours (Huncharek and Kupelnick, 2004). In contrast, a prospective cohort study conducted by Michaud et al. (2009) did not suggest an association.
9.1.3.4 Urinary tract tumours
Mixed results were seen with regards to urinary tract tumours and the exposure to nitrate or nitrites.
Nitrates
A positive association was observed between bladder cancer mortality and nitrate in drinking water nitrate in a case control study by Chiu et al. (2007) at levels ≤ 2.86 mg NO3-N/L (equivalent to 13 mg NO3¯/L), and in a cohort study by Weyer et al. (2001) at levels > 2.46 mg NO3-N/L (equivalent to 11 mg NO3¯/L) in drinking water. However, no association was seen between bladder cancer mortality and nitrate in drinking water in a case-control study conducted by Ward et al. (2003) or in a cohort study by Zeegers et al. (2006). Nitrate levels were higher in these two studies than in the earlier studies that showed a positive association. Dietary intake of vitamin C had no significant impact on the results of both latter studies. Vitamin E and cigarette smoking were not found to influence the results from the Zeegers et al. (2006) study.
Ward et al. (2007) found no association of renal cell carcinoma with nitrate levels up to 2.78 mg NO3-N/L (equivalent to 12 mg NO3¯/L) in public water supplies. However, higher nitrate exposure [> 5 mg NO3-N/L (equivalent to > 22 mg NO3¯/L) for 10+ years] was associated with an increased risk among subgroups with red meat intake above the median (OR = 1.91; 95% CI = 1.04 - 3.51), or vitamin C intake below the median (OR = 1.90; 95% CI = 1.01-3.56).
Volkmer et al. (2005) evaluated the effect of nitrate levels in drinking water on the incidence of urological malignancies in two groups in Germany exposed to different nitrate levels (i.e., 10 and 60 mg NO3¯/L). For the highly exposed group, they found an association with urothelial cancer in both sexes, with an inverse correlation with testicular tumours and no correlation with renal, penile and prostatic tumours.
Nitrites
In a population-based case-control study, Ward et al. (2003) found no association between urinary tract tumours and dietary sources of nitrite in both women and men; animal and plant sources of nitrite were evaluated separately. Among men, the highest quartile of nitrite from plant sources was associated with a modest elevated risk (OR = 1.3; 95% CI = 1.0-1.6) but no trend was seen as intake increased.
9.1.3.5 Other tumour sites (upper aerodigestive tract, pancreas, thyroid gland)
Nitrates
Ward et al. (2010) investigated the association between nitrate intake from public water supplies and diet and the risk of thyroid cancer (incidence) and self-reported hypothyroidism and hyperthyroidism (prevalence) in a cohort of 21,977 older women in Iowa (U.S.), who had used the same water supply for more than 10 years. They estimated nitrate ingestion from drinking water using a public database of nitrate measurements. Dietary intake was estimated using a food frequency questionnaire and levels from the published literature. They found an increased risk of thyroid cancer with exposure to public water supplies containing nitrate concentrations exceeding 5 mg NO3-N/L (equivalent to 22.1 mg NO3¯/L) for more than 5 years (RR = 2.6; 95% CI = 1.1-6.2). Increasing intake of dietary nitrate was associated with an increased risk of thyroid cancer (highest versus lowest quartile, RR = 2.9; 95% CI = 1.0-8.1; P for trend = 0.046). The authors concluded that nitrate may play a role in the aetiology of thyroid cancer and warrants further study.
No association was reported between drinking water nitrate and risk of pancreatic cancer (Weyer et al., 2001; Coss et al., 2004). A cohort study conducted by Knekt et al. (1999) found no association between dietary nitrate and head and neck cancers, however, a case-control study by Rogers et al. (1995) found a significant inverse association between dietary nitrate intake and oral and laryngeal cancer.
Negative associations were reported between exposure to nitrate in drinking water and risk of pancreatic cancer (Weyer et al., 2001; Coss et al., 2004). No association was reported between dietary nitrate and head and neck cancers (cohort study: Knekt et al., 1999). However, a significant inverse association has been reported between dietary nitrate intake and oral and laryngeal cancer (case-control study: Rogers et al., 1995).
Nitrites
Coss et al. (2004) observed a slightly elevated risk of pancreatic cancer for the high quartile of consumption of dietary nitrite. However, when animal sources of nitrite were evaluated separately, risks were higher and statistically significant.
No association of nasopharyngeal cancer with nitrite intake was seen in Taiwanese adults, but a positive association was found in children based on recall data from the mothers (Ward et al., 2000).
No association was found between dietary nitrite intake and cancers of the head and neck in a cohort study (Knekt et al., 1999) and oral and laryngeal cancers in a case-control study (Rogers et al., 1995).
9.1.4 Reproductive and developmental toxicity
Evidence suggests that nitrate concentrations greater than 45 mg/L in drinking water are associated with methaemoglobinaemia (see section 9.1.1), but evidence of any association with foetal mortality, growth restriction or birth defects is weak. However, there are critical data gaps in individual exposure assessment, co-exposure to other contaminants and exposure to nitrate from food sources, which is likely more relevant than exposure from drinking water.
Reviews of the reproductive and developmental effects of exposure to nitrate/nitrite in drinking water are provided by Manassaram et al. (2006) and a publication from a symposium sponsored by the International Society for Environmental Epidemiology (Ward et al., 2005a). Manassaram et al. (2006) concluded that the current literature does not provide sufficient evidence of a causal relationship between exposure to nitrate in drinking water and adverse reproductive and developmental effects; epidemiological evidence is sparse and suggestive at best. However, findings of excess birth defects in some of the studies reviewed suggest the need for further studies. Ward et al. (2005a) concluded that the results of a few published studies regarding water nitrate and reproductive outcomes have been inconsistent, but elevated risks for neural tube defects have been observed after intake of nitrate. The Manassaram et al. (2006) and Ward et al. (2005a) conclusions were based on reviews of foetal mortality, growth restriction and birth defects. From these reviews, no significant increased risk of foetal mortality (spontaneous abortions and stillbirths) was associated with drinking water nitrate levels of ≤ 55 and 43-123 mg/L (Gelperin et al., 1975; Super et al., 1981; Aschengrau et al., 1989, 1993); however, an increased risk was reported between 5 and 45 mg/L (Scragg et al., 1982; CDC, 1996). In addition, three cases of spontaneous abortion were reported with nitrate levels of 19.0, 26 and 19.2 mg/L as nitrate-nitrogen in wells serving the homes of the pregnant women; however, other causative factors and occurrence by chance could not be ruled out (CDC, 1996). Growth restriction (prematurity, intrauterine growth restriction and decreased birth weight) was associated with nitrate levels of ≥ 3.1 and 8-54 mg/L (Tabacova et al., 1997, 1998; Bukowski et al., 2001), but not with levels of > 20 mg/L (Super et al., 1981). Reports of birth defects (central nervous system and cardiac) were not significantly associated with drinking water nitrate levels of 0.2-4.5,>2, > 3.5, 5, 26 and > 45 mg/L (Arbuckle et al., 1988; Ericson et al., 1988; Aschengrau et al., 1993; Croen et al., 2001; Cedergren et al., 2002; Brender et al., 2004). However, an increased risk of anencephaly was associated with nitrate level above 45 mg/L (Croen et al., 2001), and risk of any malformation was greater with > 5 mg/L water nitrate (Dorsch et al., 1984).
Since the publication of the above reviews, one relevant study has been published. A potential correlation between maximal nitrate concentrations in drinking water and incidence of sudden infant death syndrome was reported (George et al., 2001); however, many limitations preclude a conclusion being drawn from this study.
9.2 Effects on experimental animals
9.2.1 Acute toxicity
The acute oral toxicity of nitrate in experimental animals is generally low, with median lethal dose (LD50) values above 3100 mg/kg bw/day. Nitrite is more toxic, with an LD50 of 120 mg/kg bw/day (Boink et al., 1999). Thus, values for acute oral nitrite toxicity in experimental animals are within the range reported for humans (33-250 mg/kg bw/day, reported in Section 9.1.1).
9.2.2 Short-term exposure
9.2.2.1 Methaemoglobinaemia
It is important to remember that rats are 10-100 times more resistant to acute methaemoglobinemia than humans, as rats have limited conversion of nitrate to nitrite (Boink et al., 1999). Consequently, nitrite studies are more appropriate than nitrate studies in rats for evaluating methaemoglobinemia. Shuval and Gruener (1972) reported elevated levels of methaemoglobin (5%, 12% and 22%) in rats (< 3 months old; eight per treatment) exposed to sodium nitrite at 1000, 2000 and 3000 mg/L (equivalent to 667, 1334 or 2001 mg NO2¯/L) for 24 months, respectively, but no elevated levels in rats exposed to sodium nitrite at 100 mg/L (equivalent to 66.7 mg NO2¯/L). In a dose range-finding study (Maekawa et al., 1982) using a total of 240 F344 rats of both sexes, the maximum tolerated sodium nitrite dose was 0.25% in drinking water and 5% nitrate in feed for 6 weeks. Of the rats (10 male and 10 female per dose) given 20 mL drinking water with 0.06%, 0.125%, 0.25%, 0.5% or 1% sodium nitrite, four female rats in the 1% group died, while one male and one female in the 0.5% group died. Of the rats (10 male and 10 female per dose) given 1.25%, 2.5%, 5%, 10% or 20% sodium nitrate in feed, all female rats and seven male rats given 20% sodium nitrate died. Abnormal colour in the blood and spleen due to methaemoglobin was marked in rats of the two highest dose groups from both studies.
Increased methaemoglobin levels were also measured by Til et al. (1988). Weanling Wistar rats (10 of each sex per dose) were administered potassium nitrite at 0, 1, 100, 300, 1000 or 3000 mg/L (equivalent to 0, 0.5, 54, 162.3, 541 or 1623 mg NO2¯/L) in drinking water for 13 weeks. The percentage of haemoglobin that was methylated was increased in rats exposed to 3000 mg/L (females, P < 0.05; males, P < 0.01). Subsequently, Til et al. (1997) report significantly elevated methaemoglobin concentrations in weanling Wistar rats (10 of each sex per dose) given 100 or 3000 mg potassium nitrite/L (equivalent to 54 or 1623 mg NO2¯/L) but not in rats given 0, 12.5, 25, 50 mg potassium nitrite/L (equivalent to 0, 6.8, 13.5 or 27 mg NO2¯/L) in drinking water for 13 weeks.
In a 14-week study (NTP, 2001), 10 male and 10 female rat pairs were exposed to sodium nitrite at 0, 375, 750, 1500, 3000 or 5000 mg/L in drinking water (equivalent to 0, 250, 500, 1000, 2001 or 3335 mg NO2¯/L). One female exposed to 3000 mg/L (equivalent to 2001 mg NO2¯/L) died before the end of the study. Clinical findings included brown discoloration in eyes and cyanosis of mouth, tongue, ears and feet of males at the two highest doses and of females at the three highest doses. Methaemoglobin concentrations were significantly elevated in all exposed groups of females and at 750 mg/L (500 mg NO2¯/L) and higher in males throughout the 14-week study; effects occurred by day 5 and continued throughout the study (NTP, 2001). However, brownish discoloration and cyanosis were not observed in mice exposed to the same dose regimen as in the above rat study, possibly due to higher erythrocyte methaemoglobin reductase activity in mice than in rats (NTP, 2001). Blood samples from rats drinking water with nitrite at 20 mmol/L showed little methaemoglobinaemia, whereas a 5-fold increase in methaemoglobinaemia was observed in rats that drank water containing nitrite at 36 mmol/L. Upon subsequent prolongation of exposure, methaemoglobin levels were reduced remarkably, suggesting metabolic adaptation to prolonged high nitrite exposure (Boink et al., 1999).
Based on the above studies, the nitrate concentrations tested in animals were high and the lowest nitrite concentration that significantly elevated methaemoglobin levels was 250 mg/L.
9.2.2.2 Thyroid effects
There is evidence thatnitrate exposure alters the thyroid in experimental animals. Groups of 10 female Wistar rats (3 months old) received sodium nitrate in their drinking water at 0, 50, 100, 250 or 500 mg/L over a 30-week period (equivalent to 0, 36.5, 72.9, 182.3 or 364.5 mg NO3¯/L; Eskiocak et al., 2005). The weight of the thyroid gland was significantly increased in all treatment groups relative to controls, whereas uptake of radiolabelled iodine by the thyroid was decreased in the 50 mg/L group but was not significantly different from control levels until doses were increased to 250 or 500 mg/L, at which uptake was increased, perhaps as a compensatory mechanism (P < 0.05 and P < 0.01, respectively). Effects on serum hormone levels varied with dose (as low as 50 mg/L), but consistent effects indicative of clear hypothyroidism were seen at 250 and 500 mg/L (i.e., reduced serum total T3 [P < 0.01 and P < 0.05, respectively], reduced free T3 [both P < 0.01] and reduced free T4 [P < 0.01 and P < 0.05, respectively]). Histopathological changes were also seen at the two highest doses. Although the study did not account for iodide intake or measure nitrate levels in control water, these findings suggest that nitrate impairs thyroid function involving the HPT axis.
Similarly, altered thyroid hormone levels, histological modifications and increased thyroid weights were reported by Zaki et al. (2004). Male Wistar rats (12 per group) received potassium nitrate in tap water at 13.55 (control), 50, 100, 150 or 500 mg/L (equivalent to 8.3, 30.7,61.4, 92.1 or 307 mg NO3¯/L) for 5 months ad libitum. Potassium nitrate at 150 mg/L reduced plasma T3 levels by 34% (P < 0.05) and T4 levels by 12% (but reductions were not statistically significant). Exposure to potassium nitrate at 500 mg/L reduced levels of T3 and T4 by 44% and 30%, respectively (P < 0.05). Exposure to potassium nitrate at 100, 150 and 500 mg/L dose-dependently increased thyroid weights (21%, 45% and 77%; P < 0.05). Histological examination revealed vacuolization and an increase in thyroid follicle size in rats exposed to potassium nitrate at 150 or 500 mg/L. A negative correlation between thyroid weight and plasma T3 levels (r = −0.31; P < 0.05) was observed, as well as between thyroid weight and plasma T4 levels (r = −0.37; P < 0.05). The study attempted to control for iodide intake by feeding a controlled diet. The observed effects further support nitrate's impairment of thyroidal function through the HPT axis.
A study from India (Mukhopadhyay et al., 2005) found that rats fed diet containing 3% potassium nitrate for 4 weeks exhibited increased thyroid gland weight (P < 0.001), TSH levels (P < 0.001) and slightly elevated iodide excretion (P < 0.001) compared with controls. In contrast, thyroid peroxidase activity (P < 0.01), serum T4 levels (P < 0.01) and serum T3 levels (P < 0.001) were all reduced. This study provides further support for the role of nitrates in altering the function of the thyroid. Decreased thyroidal iodine uptake as well as T3 and T4 concentrations were also reported after rats were fed a diet containing 3% potassium nitrate for 6 weeks (Jahreis et al., 1991). However, no significant differences in thyroidal function (measured by T3 and T4 levels) were observed in any adult Beagle dogs after receiving sodium nitrate in drinking water at 0, 300, 600 or 1000 mg/L (equivalent to 0, 218.7, 437.4 or 729 mg NO3¯/L) for 1 year or in any puppies from the dams receiving the above doses (Kelley et al., 1974).
Despite some deficiencies in these studies (e.g., thyroid gland histology--generally the most definitive measure of thyroid disruption--was poorly done), they provide support for the role of nitrates in altering the function of the thyroid through the HPT axis.
9.2.2.3 Effects on the vascular system and adrenals
Evidence supports the role of nitrite in induction of hypertrophy of the adrenal zona glomerulosa by reducing blood pressure and stimulating the renin-angiotensin axis. Shuval and Gruener (1972) found evidence of pulmonary and coronary effects when exposing rats (< 3 months old; eight per treatment) for 24 months to drinking water containing sodium nitrite at 1000-2000 mg/L (equivalent to 667-1334 mg NO2¯/L). Further study revealed that nitrite exposure leads to vasodilatation, relaxation of smooth muscle, lowering of blood pressure (Gangolli et al., 1994) and transient hypotension in rats (Boink et al., 1999). In two freely moving Wistar rats, potassium nitrite decreased the mean arterial pressure and increased the heart rate; potassium chloride had no effect (Vleeming et al., 1997). Intravenous administration of nitrite to anaesthetized rats induced an immediate, dose-dependent decrease in blood pressure, which preceded an increase in methaemoglobin concentration, suggesting that hypotension is the primary effect of nitrite; a single dose of 30 µmol/kg bw caused a 10-20% decrease in blood pressure (Vleeming et al., 1997). However, lowering of blood pressure is not necessarily adverse, but can actually be beneficial (Lundberg et al., 2004, 2008).
The adrenals regulate blood pressure via the renin-angiotensin-aldosterone axis. Both sexes of weanling Wistar rats (10 of each sex per dose) exposed to potassium nitrite in drinking water at 1, 100, 300, 1000 or 3000 mg/L (equivalent to 0.5, 54, 162, 541 or 1623 mg NO2¯/L) for 13 weeks experienced hypertrophy of the adrenal zona glomerulosa at all dose levels (Til et al., 1988). The incidence and severity of hypertrophy of the adrenal zona glomerulosa increased as levels of nitrite in drinking water increased. Adrenal changes are thought to relate to the well-known vasodilating properties of nitrite and to dilatation and thinning of blood vessels following nitrite administration. Vasodilatation lowers blood pressure, which stimulates the renin-angiotensin-aldosterone axis, resulting in increased aldosterone production by the adrenal zona glomerulosa (Til et al., 1988). Other rodent studies have found treatment-related hypertrophy of the adrenal zona glomerulosa occurring as an indirect effect of nitrite exposure, as corresponding changes in plasma nitrite or kidney function were not observed (Til et al., 1997). A later study suggested that the mild hypertrophy was a physiological adaptation to nitrite-induced vasodilatation rather than a harmful lesion (Boink et al., 1999). Inhibition of angiotensin-converting enzyme indicates that the effects were produced indirectly via stimulation of the renin-angiotensin axis (Vleeming et al., 1997; Boink et al., 1999). Thus, administration of nitrite to rats in drinking water likely causes repeated decreases in blood pressure, thus repeatedly activating the renin-angiotensin-aldosterone axis, which may have caused hypertrophy of the adrenal zona glomerulosa.
9.2.2.4 Effects on kidneys
Weanling Wistar rats (10 of each sex per dose) were administered potassium nitrite in their drinking water at 1, 100, 300, 1000 or 3000 mg/L (equivalent to 0.5, 54, 162, 541 or 1623 mg NO2¯/L) for 13 weeks. Absolute and relative weights of spleen and kidneys in females and relative weight of kidneys in males increased at the highest exposure. However, increases in relative kidney weights were not accompanied by treatment-related histopathological renal changes (Til et al., 1988). In a follow-up study by Til et al. (1997), weanling Wistar rats (10 of each sex per dose) were given 0, 12.5, 25, 50, 100 or 3000 mg potassium nitrite/L (equivalent to 0, 6.8, 13.5, 27, 54 or 1623 mg NO2¯/L) in drinking water for 13 weeks. As in the previous study, relative kidney weights were significantly increased in both high-dose groups (Til et al., 1997).
9.2.3 Long-term exposure and carcinogenicity
9.2.3.1 Ingested nitrate
The studies in which sodium nitrate was administered either in drinking water or in diet to rodents showed that nitrate has a low chronic toxicity.
In an 18-month study, female NMRI mice (100 per group) received calcium nitrate at 0, 100 or 1000 mg/L (equivalent to 0, 61 or 608 mg NO3¯/L) daily in drinking water (equivalent to 0, 30 or 300 mg/kg bw/day as calcium nitrate, or 0, 18 or 182 mg NO3¯/kg bw/day). The mice in the high-dose group lost weight and died prematurely. There was no increase in tumour incidence in the nitrate-treated groups (Mascher and Marth, 1993).
In a 2-year carcinogenicity study, F344 rats (50 of each sex per group) were given diets containing 0%, 2.5% or 5% (0, 25 or 50 g/L) sodium nitrate ad libitum (equivalent to 0, 1250 or 2500 mg/kg bw/day or 0, 910 or 1820 mg/kg bw/day expressed as nitrate ion). The survival rate of nitrate-dosed animals was significantly higher (P < 0.05) than that of the controls. At 2500 mg/kg bw/day, slight to moderate reduced body weight gain was observed. No significant difference in tumour incidence was observed in this study, in which the animals showed a high incidence of spontaneous tumours. The only significant result was a reduction of the incidence of mononuclear cell leukaemias (P < 0.01) in the experimental groups (Maekawa et al., 1982).
Other studies conducted in rats (Lijinsky et al., 1973a) and mice (Greenblatt and Mirvish, 1973; Sugiyama et al., 1979) demonstrated that nitrate has no carcinogenic activity.
9.2.3.2 Ingested nitrite
Rat feeding studies
Aoyagi et al. (1980) reported a significant increase in liver tumours (P < 0.05) in male non-inbred Wistar rats given sodium nitrite at a concentration of 1600 ppm in pelleted feed for about 20 months. However, the NOCs (NDMA and N-nitrosopyrrolidine [NPYR]) found in the pellets at levels that were correlated with those of the added sodium nitrite were suspected as the cause of these positive results.
In another study, significant increased incidences of liver neoplasms were observed only in female F344 rats receiving sodium nitrite in feed at 2000 mg/kg (equivalent to 1334 mg NO2¯/kg) for 2 years (Lijinsky et al., 1983; Lijinsky, 1984). In addition to the liver neoplasms, Lijinsky et al. (1983) also observed a reduced incidence of monocytic leukaemia in rats of both sexes for each of the nitrite-treated groups. However, an IARC (2010) work group noted that this study lacked data for life parameters, including growth curve and feed consumption as well as intake of sodium nitrite; thus, the effect of nutritional condition on the reduction of leukaemia incidence could not be measured.
In a long-term feeding study carried out in F344 rats (50 per group) exposed to either 0.2% or 0.5% by weight (w/w) sodium nitrite for up to 115 weeks, there was no evidence of carcinogenic activity of sodium nitrite. Rather, there was a dose-related reduction in the incidence of lymphomas, leukaemia and testicular interstitial cell tumours (Grant and Butler, 1989).
In a large-scale study sponsored by the U.S. Food and Drug Administration (Newberne, 1979), pregnant Sprague-Dawley rats were administered sodium nitrite at concentrations of 0, 250, 500, 1000 or 2000 mg/kg in an agar gel casein diet; 0, 1000 or 2000 mg/L in drinking water; 0, 1000 or 2000 mg/kg in a commercial chow; and 1000 mg/kg in the dry form of the agar gel casein diet. Exposure began 5 days before the dams gave birth and continued for the lifetime (up to 26 months) of the dams and pups. Malignant lymphoma was increased in all groups fed nitrite (the overall combined incidence was 10.2% vs. 5.4% in control rats). The feed samples were analysed for the presence of nitrosamines, but none were detected; thus, it seemed unlikely that preformed nitrosamines were responsible for the observed effect on the lymphatic system. Similar results (27% of tumours in the lymphoreticular system vs. 6% in controls) had been reported as an incidental observation by Shank and Newberne (1976) in a study in which F1 and F2 generations of rats of the same strain had been exposed from conception until death to a dietary sodium nitrite concentration of 1000 mg/kg. However, a governmental interagency working group (FDA, 1980a, 1980b) drew different conclusions from those of Newberne (1979), based upon examination of the same histological preparations. The working group diagnosed only a small number of lesions as lymphomas and assessed an incidence of approximately 1% in both treated and control groups. This discrepancy concerned the differentiation between the lymphomas diagnosed by Newberne (1979) and the extramedullar haemotopoiesis, plasmacytosis or histiocytic sarcomas diagnosed by the working group. These latter tumours have no known human counterpart. The incidence of other types of tumours was not increased.
Rat drinking water studies
Male Wistar rats exposed to 0.2% (2 g/L) sodium nitrite in drinking water for 9 months showed increased activities of the following enzymes: liver microsomal lipoperoxidase, liver lysosomal phosphatase and cathepsin, and cytosolic superoxide dismutase (Darad et al., 1983). In this study, the activities of both the lysosomal and cytosolic enzymes were indicative of free radical-mediated damage to the cellular and subcellular membranes in rats.
Chow et al. (1980) administered sodium nitrite at a concentration of 2 g/L in drinking water (equivalent to 1.33 g NO2¯/to male Sprague-Dawley rats for 14 months. In addition to decreased liver weights, the animals also showed increased lung weights and a higher incidence of pulmonary lesions. The measurement of some blood parameters showed decreased plasma vitamin E and higher levels of reduced glutathione in red blood cells.
In a carcinogenicity study, F344 rats (50 of each sex per group) received sodium nitrite in drinking water at concentrations of 0, 1250 or 2500 mg/L (equivalent to 0, 834 or 1667 mg NO2¯/L) for 2 years (Maekawa et al., 1982). In the female high-dose group, the mean body weight was decreased by more than 10% compared with controls after 40 weeks. The survival after 100 weeks was significantly higher in the male groups. No carcinogenic effects were observed in this study, in which the animals showed a high incidence of spontaneous tumours. However, a significant decrease in incidence of mononuclear cell leukaemias (a very common spontaneous neoplasm in F344 rats) was found in the experimental groups compared with controls. A similar decrease in incidence of monocytic leukaemia was later reported in F344 rats of both sexes exposed to sodium nitrite at either 2 g/L in drinking water (1.33 g NO2¯/L) or 2 g/kg in diet (1.33 g NO2¯/ kg) (Lijinsky et al., 1983) and only in male F344 rats (50 per group) exposed to dietary sodium nitrite concentrations of 2000 or 5000 mg/kg (1334 or 3335 mg NO2¯/kg) for up to 115 weeks (Grant and Butler, 1989).
More recently, a 2-year carcinogenicity study for sodium nitrite was conducted under the National Toxicology Program (NTP, 2001) in F344/N rats. In this study, F344/N rats (50 of each sex per group) were given drinking water containing sodium nitrite at concentrations of 0, 750, 1500 or 3000 mg/L, equal to average doses of 0, 35, 70 and 130 mg/kg bw/day for males (equivalent to 0, 23, 47 and 87 mg NO2¯/kg bw/day) and 0, 40, 80 and 150 mg/kg bw/day for females (equivalent to 0, 27, 53 and 100 mg NO2¯/kg bw/day), for 2 years. The survival of treated groups was similar to that of controls. Decreased mean body weight and water consumption were seen in the highest-dose male and female rats, and the water consumption of the other treated groups was generally lower only after week 14. The incidences of fibroadenoma were increased in different organs in females, particularly the mammary glands. However, these fibroadenomas occur at a high background incidence, and no increase was seen at the highest dose. The incidences of hyperplasia of the forestomach epithelium in males and females at the highest dose were significantly higher than in controls. The NTP (2001) concluded that there was no evidence of carcinogenicity of sodium nitrite under the conditions of the study.
Significant increased incidences (18% vs. 2% in control group started 11 months earlier, P < 0.002) of forestomach squamous papillomas were also observed in MRC Wistar rats of both sexes exposed to one high dose level of sodium nitrite at 3000 mg/L in drinking water for at least 1 year and observed for life (Mirvish et al., 1980).
Lijinsky (1984) observed significant increased incidences of liver neoplasms in female (not male) F344 rats receiving sodium nitrite in drinking water at 2000 mg/L (1334 mg NO2¯/L) for 2 years. Interestingly, there was no increase in tumour incidence in Sprague-Dawley rats also exposed to sodium nitrite at 2000 mg/L (1334 mg NO2¯/L) for the same duration (Taylor and Lijinsky, 1975).
Mouse gavage and feeding study
Outbred ICR mice of both sexes (30 of each sex) administered sodium nitrite at 70 mg/kg bw (47 mg NO2¯/kg) once a week by gavage for 10 weeks and allowed to live without treatment for up to 18 months did not show significant increases in tumour (lymphomas, lung, liver) incidences (Yoshida et al., 1993). Similarly, in a feeding study in which male and female C57BL/6 mice were given sodium nitrite (5000 mg/kg or 3335 mg NO2¯/kg) in feed for 1 year, the animals did not exhibit higher tumour incidence compared with the controls (Krishna Murthy et al., 1979). No 2-year dosed feed studies in mice have been reported.
Mouse drinking water study
Swiss mice (40 of each sex) exposed 5 days/week for 28 weeks to sodium nitrite in drinking water at 1000 mg/L (the chronic maximum tolerated dose in this study) (667 mg NO2¯/L) and then returned to tap water until 40 weeks did not exhibit lung tumours (Greenblatt et al., 1971). Negative results were also reported for male strain A mice (40 per group) exposed to sodium nitrite in drinking water at 1000 or 2000 mg/L (667 or 1334 mg NO2¯/L), 5 days/week for 20-25 weeks, and killed 10-13 weeks later (Greenblatt and Mirvish, 1973).
Lifetime exposure of VM strain mice (known for their susceptibility to spontaneous glioma formation) to sodium nitrite in their drinking water at 2000 mg/L both in utero and throughout their lifespan did not increase the incidence of cerebral glioma (Hawkes et al., 1992).
Lifetime exposure of female C57BL/6 mice (before and during pregnancy, during lactation and until natural death) and female (C57BL/6 × BALB/c)F1 mice (hereafter B6CF1) progeny to sodium nitrite in drinking water at 184 or 1840 mg/L (equivalent to 30.7 or 310 mg/kg bw/day; 20.5 or 205 mg NO2¯/kg bw/day) did not show any increase in tumour incidence (Anderson et al., 1985). However, significant increases in lymphomas (P = 0.029) and lung tumours (P < 0.05) were observed only in the male B6CF1 mice exposed from conception to the lower dose of 184 mg/L, but not to 1840 mg/L, the higher dose.
In order to ascertain the possible tumorigenicity of sodium nitrite, a chronic toxicity study was conducted in ICR mice (50 of each sex per group), which received for more than 18 months drinking water containing sodium nitrite at 0, 1250, 2500 or 5000 mg/L (highest dose being the maximum tolerated dose) (equivalent to 0, 834, 1667 or 3335 mg NO2¯/L) (Inai et al., 1979). No differences in tumour incidence, development time of each histologically classified tumour or tumour type were observed between exposed groups and controls.
In a 2-year carcinogenicity study (NTP, 2001), B6C3F1 mice (50 of each sex per group) were exposed daily to drinking water containing sodium nitrite at concentrations of 0, 750, 1500 or 3000 mg/L (equal to average doses of 0, 60, 120 and 220 mg/kg bw/day [0, 40, 80 and 147 mg NO2¯/kg bw/day] for males and 0, 45, 90 and 165 mg/kg bw/day [0, 30, 60 and 110 mg NO2¯/kg bw/day] for females). Overall, there was no difference in survival between exposed groups compared with controls, although mean body weights were lower in females treated with the highest dose. Exposed groups generally consumed less water than the control groups. The incidences of squamous cell papilloma or carcinoma (combined) in the forestomach of female mice occurred with a "positive dose-related trend" (not statistically significant) with respective frequencies of 1/50, 0/50, 1/50 and 5/50 at 0, 45, 90 and 165 mg/kg bw/day (equivalent to 0, 30, 60 and 110 mg NO2¯/kg bw/day). The incidence of hyperplasia of the glandular stomach epithelium was significantly higher in males treated at the highest dose. From the overall results of the study, the NTP (2001) concluded that there was equivocal evidence of carcinogenic activity on the basis of the positive trend in the incidence of squamous cell papilloma and carcinoma (combined) of the forestomach.
Cancer promotion
The role of nitrite in cancer promotion was studied. In a multi-organ model in which F344 rats (15 per group) were initiated with various carcinogens, a high dose of sodium nitrite in drinking water (3000 mg/L, equivalent to 2000 mg NO2¯/L) strongly enhanced the development of forestomach lesions but inhibited the development of glandular stomach lesions when these animals were given the phenolic antioxidants catechol, 3-methoxycatechol or butylated hydroxyanisole, with or without prior carcinogen exposure. Moreover, the carcinogenesis-promoting effects of catechol in this study were evident only in combination with sodium nitrite (Hirose et al., 1993). The promotion of forestomach carcinogenesis by sodium nitrite was also observed in a study in which male Fischer rats pretreated with N-methyl-N′-nitro-N-nitrosoguanidine were exposed to 0.3% sodium nitrite in their drinking water (Yoshida et al., 1994).
Exposure of Balb/c mice to lower doses of sodium nitrite in drinking water (0, 5, 50, 500 and 2000 mg/L, equivalent to 0, 3, 33, 333 and 1334 mg NO2¯/L) also accelerated leukaemia development induced by the Rauscher, Mazurenko, and Gross leukaemia viruses (Ilnitsky and Kolpakova, 1997).
Conclusion
Overall, in most of the studies in which sodium nitrite has been tested for tumorigenicity (also transplacental carcinogenesis experiments) in rats (Newberne, 1979; Mirvish et al., 1980; Maekawa et al., 1982; Lijinsky et al., 1983) or mice (Inai et al., 1979; Hawkes et al., 1992), there were no significant increased incidences of tumours compared with untreated controls. The results of the studies have not provided consistent evidence for carcinogenicity of nitrite per se, because the tumours reported in the lymphatic tissue (Shank and Newberne, 1976; Newberne, 1979), forestomach (Mirvish et al., 1980; NTP, 2001) and liver (Aoyagi et al., 1980; Lijinsky et al., 1983; Lijinsky, 1984) have not been confirmed in other studies (Inai et al., 1979; Maekawa et al., 1982; Lijinsky et al., 1983; Grant and Butler, 1989). Therefore, the carcinogenicity of sodium nitrite in rodents still appears to be controversial.
9.2.4 Concurrent administration of nitrate/nitrite with nitrosatable compounds
Nitrate and nitrite per se were not carcinogenic in experimental animals in most of the studies in which they were administered alone (Mirvish et al., 1980; Lijinsky et al., 1983; WHO, 2007). However, when nitrite was co-administered with N-nitrosatable compounds (hereafter nitrosatable compounds), which are amines or amides, tumours, mutagenicity or other toxic effects similar to those induced by the carcinogenic NOCs (nitrosamines and nitrosamides) were seen, suggesting their endogenous formation. This was not the case for the co-administration of nitrate and nitrosatable compounds to rodents.
A wide range of toxicity, mutagenicity and carcinogenicity assays have been performed to assess the biological effects of the co-administration of nitrosatable compounds with either nitrate or nitrite.
The co-administration of nitrate and nitrosatable compounds to rodents showed negative results (Greenblatt and Mirvish, 1973; Friedman and Staub, 1976). However, there is strong evidence that nitrate must be initially reduced to nitrite, one of the precursors of the endogenous nitrosation reaction, in order to take part in this process (IARC, 2010). It has also been reported that rodents (rats and mice) have fewer bacteria in their mouths than humans and are unable to reduce oral nitrate to nitrite (Mirvish, 1994). Indeed, when Fong et al. (1980) exposed Sprague-Dawley rats (50 males per group) chronically infected with known strains of E. coli to fixed doses of nitrate (1000 mg/L) and aminopyrine (1000 mg/L) in drinking water for 1.5 years, they found tumours that were not seen in uninfected rats. The authors suggested that bacterial infections are important in subsequent tumour induction in animals whose diet contains high concentrations of nitrate and amines. Thus, the reduction of nitrate to nitrite by E. coli infecting the rats would explain the positive results from the above study.
The co-administration of nitrite and nitrosatable compounds in drinking water or feed to hamsters, mice and rats leads to toxic effects characteristic of the related NOCs (nitrosamines or nitrosamides). These effects included systemic effects, modification of the genetic material (reduction of deoxyribonucleic acid [DNA] synthesis, methylation of the nucleic acids) and increase in tumour incidence. Nitrite and nitrosatable compounds are both known precursors for NOC formation. In contrast, the administration of the NOC precursors alone did not cause such effects (Asahina et al., 1971; Lijinsky and Greenblatt, 1972; Astill and Mulligan, 1977). Among the nitrosatable compounds studied are drugs, pesticides and dietary compounds (foodstuffs).
After oral administration of nitrosatable precursors (e.g., secondary amines [DMA, methylbenzylamine] or tertiary amines [aminopyrine]) together with high doses of sodium nitrite (in feed or drinking water, or in one of their combinations), toxic effects characteristic of the related NOCs were observed in mice, rats and hamsters. These effects included progressive inertia, anorexia, ascites, weight loss, mortality and hepatic necrosis. However, the administration of sodium nitrite or the nitrosatable precursor alone did not cause such effects (Asahina et al., 1971; Lijinsky et al., 1973b; Astill and Mulligan, 1977; Lin and Ho, 1992).
It has been suggested that nitrite may react in vivo with nitrosatable substances to form carcinogenic NOCs, the formation of which could increase the risk of cancer (Lijinsky and Taylor, 1977; Lijinsky, 1984). As the stomach is well known to be a site of the nitrosation reaction, the NOCs were assumed, in most of the studies, to have been formed within it and not in the diet, although chemical analyses for NOCs in the diet were not performed. Numerous environmental nitrosatable compounds, including dietary components, drugs, and agricultural and industrial chemicals, have been shown to induce tumours through the endogenous formation of NOCswhen fed to experimental animals simultaneously with nitrite (Yamamoto et al., 1989). In a number of long-term toxicity studies, oral administration of sodium nitrite in drinking water together with specific nitrosatable compounds in feed (or vice versa) or both substances either in drinking water or in feed induced a variety of tumours in rats, mice and hamsters. Both precursors (sodium nitrite and the nitrosatable substance) were usually given separately or mixed just before administration to animals, in order to avoid any chemical reaction before ingestion. Most of these combinations resulted in increased tumour incidences, regardless of the duration of the exposure (see Tables 2 and 3 below).
As reviewed by Mirvish (1975b), amines and amides causing increases in tumour incidence include n-dibutylamine, dimethylurea, n-methylaniline, piperazine, morpholine, butylurea, ethylurea, ethylthiourea, methylurea, aminopyrine, bis(2-hydroxypropyl)amine, diphenylamine, heptamethyleneamine, N-methylbenzylamine, N-methylaniline, imidazolidinone and various environmental chemicals and drugs, including oxytetracycline, disulfiram, dimethyldodecylamine-N-oxide, diphenylhydramine hydrochloride, N-methylcyclohexylamine, imidazoline, N-methyl-N′-nitroguanidine and N6-methyladenosine. No tumours were induced by feeding nitrite plus the strongly basic amines diethylamine, DMA and piperidine or nitrite plus the amides N-methylacetamide, N-methylurethane, N-ethylurethane, phenylurea, 1-methyl-3-acetylurea or hydantoin, although the corresponding nitroso derivatives are known carcinogens.
In some instances, food extracts were used as the sources of nitrosatable precursors, a condition that is closer to actual human exposure.
The target organs for cancer were also diversified, including liver, lungs, lymphatic system, forestomach, urinary bladder and uterus (see Tables 2 and 3 below). Most of the time, the tumours developed were reported as being characteristically the same as those induced by the presumed nitroso derivatives of the nitrosatable compounds, suggesting their endogenous formation.
9.2.4.1 Short-term exposure leading to cancer
Some of the studies in which the co-administration of nitrite and amines or amides to experimental animals, for less than 1 year (usually 10-28 weeks), led to cancer induction are summarized in Table 2. The details are described below.
| NC | NC concentration | Nitrite concentration | Strain, number per sex | Exposure duration (weeks) | Results | ||
|---|---|---|---|---|---|---|---|
| DW (mg/L) | Feed (mg/kg) | DW (mg/L) | Feed (mg/kg) | ||||
| Rats | |||||||
| AMP | 0, 250, 1000 | 0, 250, 1000 | SD, F and M | 30-50 | Liver malignant tumoursA | ||
| DSF | 0, 1000 | 0, 2000 | F344, 20/sex | 78 | Oesophagus, tongue, squamous stomach and nasal cavity tumoursB | ||
| HMI | 0, 2000 | 0, 2000 | SD, 15/sex | 28 | Gastroesophageal, tongue, oropharynx, lung and nasal cavity tumoursA, C | ||
| Mice | |||||||
| DMA | 5900 | 1000 | Sw, 20-40/sex | 28 | No tumourD | ||
| EU | 0, 1000 | Sw, 31-144 A | 28 | Lung adenomasE | |||
| MAni | 1950 | 1000 | Sw, 20-40/sex | 28 | Lung adenomasD | ||
| Mor | 0, 6250, 6330 | 500-2000 | Sw, 20-40/sex | 10-28 | Lung adenomaD, F | ||
| MU | 0, 2680, 5360 | 500- 2000 | Sw, 31-144 A | 10-28 | Lung tumoursE, F | ||
| Pip | 690-18 750 | 50-2000 | Strain A, 40 M | 20-25 | Liver tumoursG | ||
| Pip | 0-6330 | 500-2000 | Sw, 20-40/sex | 10-28 | Lung tumoursD, F | ||
Abbreviations: A, animals; AMP, aminopyrine; DMA, dimethylamine hydrochloride; DSF, disulfiram; DW, drinking water; EU, ethylurea; F, female; HMI, heptamethyleneimine; M, male; MAni, methylaniline; MU, methylurea; Mor, morpholine; NC, nitrosatable compound; Pip, piperazine; SD, Sprague-Dawley; Sw, Swiss. References: A, Lijinsky et al. (1973b); B, Greenblatt et al. (1971); C, Lijinsky and Reuber (1980); D, Mirvish et al. (1972); E, Taylor and Lijinsky (1975); F, Mirvish et al. (1975); G, Greenblatt et al. (1973). |
|||||||
2-Acetyl aminofluorene (AAF) is one of the most intensively used model compounds in studying the metabolism and carcinogenesis of arylamides and amines. In a long-term study, Hsu et al. (1997) investigated the effect of sodium nitrite on the tumorigenicity of AAF in Wistar rats fed with AAF and sodium nitrite for 12 weeks. Rats were divided into five groups: group I served as control; group II was treated with 0.3% sodium nitrite; group III was given 0.02% AAF alone; and groups IV and V received both AAF and sodium nitrite (0.2% and 0.3%, respectively) in their diet. At the end of the experiment, all rats in groups III, IV and V developed early-stage phenomena of hepatocellular carcinoma, including hepatomegaly with variable-sized foci and neoplastic nodules. Severe damage was observed in the rats treated with AAF and sodium nitrite. Feeding of AAF for 3 months elevated the levels of c-Fos, c-Jun and c-Myc proteins in the rat livers; these elevations were significantly magnified (P < 0.001) by sodium nitrite.
The effect of ingestion of seafood--specifically, the popular squid that contains high levels of naturally occurring amines, such as DMA, trimethylamine (TMA) and trimethylamine-N-oxide (TMAO)--on cancer induction was also investigated. Rats fed 10% squid (corresponding to 0.19% DMA) with or without 0.3% sodium nitrite for 10 months became languorous and showed marked reduced body and liver weights. At the end of this experiment, a significant elevation of serum levels of the liver enzyme gamma-glutamate transferase was observed in groups co-administered sodium nitrite and a nitrosatable species (squid or pure DMA), with or without vitamin C (0.01 < P < 0.02). Two of 12 (16%) rats fed 10% squid alone developed liver cancer. Simultaneous feeding of 10% squid and 0.3% sodium nitrite elevated the incidence of liver cancer to 33% (4/12); splenomegaly was also observed. Adding 0.3% vitamin C to rat feed reduced cancer incidence to 18% (2/11). However, 0.19% DMA given alone or co-administered with sodium nitrite did not induce tumours in rats. The authors concluded that some components of squid other than DMA might be involved in the process of carcinogenesis. Indeed, further tests revealed that in addition to DMA (0.19-0.2%), squid purchased from various sources in this experiment contained extraordinarily high concentrations of TMAO (4%), which can also interact in vivo to form the carcinogenic NDMA (Lin and Ho, 1992).
Ethylenethiourea (ETU) is a principal impurity as well as a degradation and metabolic product of ethylene bisdithiocarbamate fungicides used for global treatment of vegetables, crops and fruits. To investigate its biotransformation in the stomach and the resultant increase in tumour occurrence, Yoshida et al. (1993) gave 10 weekly oral administrations of concurrent doses of ETU (25, 50 and 100 mg/kg bw) and sodium nitrite (17.5, 35 and 70 mg/kg bw) by gavage to ICR mice (30 of each sex per group), which were then allowed to live without treatment for up to 18 months after the first administration. Afterwards, they studied tumorigenicity of selected target tissues. These treatments caused earlier development of tumours or dose-dependent increases in the incidences of tumours in the lymphatic tissue, lung, forestomach, Harderian gland and uterus, whereas treatment with either ETU or sodium nitrite alone failed to show carcinogenic activity.
In their quantitative study, Greenblatt and Mirvish (1973) found that the number of lung adenomas per mouse was approximately proportional to the concentration of piperazine in food and the square of the drinking water nitrite concentration. Thus, in this study, the tumorigenic effect was very dependent on dose; for example, if the dose of both reactants was lowered 10 times, mononitrosopiperazine production should drop 1000 times.
However, the effect of the concurrent administration of nitrite with amino acids to rats and mice (Garcia and Lijinsky, 1973; Greenblatt et al., 1973) or with trimethylamine to rats (Mirvish, 1975b; Mirvish et al., 1975) was not significant.
In all of the above studies, feeding experimental animals with nitrite, amines or amides alone did not induce tumours.
9.2.4.2 Long-term exposure leading to cancer
Some of the studies reviewed are summarized in Table 3.
| NC | NC concentration | Nitrite concentration | Species, strain, sex |
Exposure duration | Results | ||
|---|---|---|---|---|---|---|---|
| DW | Feed | DW | Feed | ||||
| Synthetic compounds | |||||||
| Aln, CPM, DPH |
0.2 g/L | 0.2 g/L | F344 rats, 20-24 M | Lifetime | Liver neoplasms (hepatocellular carcinomas and neoplastic nodules)A | ||
| DDAO | 2 g/L | 2 g/L | |||||
| BHPA | 10 000 mg/kg | 0, 1500, 3000 mg/L | Wistar rats, 20 M |
Lifetime | Nasal cavity, lung, oesophagus, liver and bladder tumoursB | ||
| Cim | B6CF1Table 1 footnote a mice, 40-80 M |
Lifetime | Lung and haematopoietic systemC | ||||
| DEA | 0, 2000, 4000 mg/L | 0, 400, 800 mg/L | Guinea pigs, 20 M | 2.5 years | No tumoursD | ||
| EU, MU |
0.01%, 0.03% | 0.3% | SD rats, 10/sex | 2 years | Neurogenic and lymphoid neoplasmsE | ||
| Mor | 1000 mg/kg | 1000 mg/kg | SD rats, 94-172/sex |
125 weeks | Hepatocellular carcinomaF | ||
| Mor | 0, 3000 mg/L | 0, 3000 mg/L | Wistar rats, 40 M |
2 years | Liver tumoursG | ||
| Mor | 10 000 mg/kg | 2 g/L | Wistar rats, 40 M |
Lifetime | Hepatocellular carcinomaH | ||
| Mor | 1000 mg/kg | 1000 mg/kg | SG hamsters, 24-55/sex | 110 weeks | Liver carcinomasF | ||
| Food extracts | |||||||
| Fish | 8%, 32%, 64% | 0.12% | F344 rats, 50/sex | 104 weeks | Adenomas and renal cell carcinomas in dose-dependent mannerI | ||
| Meat | 40% | 200, 5000 mg/kg | Wistar rats, 30/sex | Lifetime | No tumoursJ | ||
| Meat | 45% | 200-4000 mg/kg | No tumoursK | ||||
Abbreviations: Aln, allantoin; BHPA, bis(2-hydroxypropyl)amine; CPM, chlorpheniramine maleate; Cim, cimetidine; DDAO, N,N-dimethyldodecylamine-N-oxide; DEA, diethylamine; DPH, diphenhydramine hydrochloride; DW, drinking water; EU, ethylurea; M, male; MU, methylurea; Mor, morpholine; NC, nitrosatable compound; SD, Sprague-Dawley; SG, Syrian Golden. References: A, Lijinsky (1984); B, Yamamoto et al. (1989); C, Anderson et al. (1985); D, Sen et al. (1975); E, Koestner and Denlinger (1975); F, Shank and Newberne (1976); G, Mirvish et al. (1976); H, Mirvish et al. (1983); I, Furukawa et al. (2000); J, van Logten et al. (1972); K, Olsen et al. (1984). |
|||||||
9.2.4.3 Studies on interactions with antioxidants
Some studies demonstrated that tumour incidence is lowered by certain dietary substances, such as vitamin C (Mirvish et al., 1975, 1976, 1983; Chan and Fong, 1977; Mokhtar et al., 1988), gallic acid (Mirvish et al., 1975), soya bean (Mokhtar et al., 1988) or tea extract (Xu and Chi, 1990). The capacity of these various substances to reduce tumours would depend on factors such as the administered dose, the time of administration (null efficiency if the NOC is already formed), as well as the presence of other substances during administration.
9.2.4.4 Conclusion
In most of the foregoing studies, unrealistically high doses of nitrite and amines or amides were used, which bears little resemblance to normal human exposure conditions (Lijinsky, 1984; Bartsch et al., 1988); few investigations have been carried out using low doses (Mirvish, 1975b). In addition, the results indicate that the target organ of tumours depends not only on the species and strain of the test animal, but also on the nature of the studied nitrosatable compound and probably on its dose. Furthermore, one of the most important features regarding combined exposure of nitrite and nitrosatable compounds is the wide spectrum of target organs (Tables 1 and 2).
The results of these studies are suggestive of a role for endogenous nitrosation in tumorigenesis, because the authors sometimes noted that the tumours observed were characteristically similar to those induced by the nitroso derivatives of the nitrosatable compounds tested (Yamamoto et al., 1989).
9.2.5 Genotoxicity of the concurrent administration of nitrite and nitrosatable compounds
9.2.5.1 In vivo
Concurrently administered nitrite and nitrosatable compounds were shown to be mutagenic, inducing genetic modifications either by reduction of DNA synthesis or by methylation of nucleic acids (Montesano and Magee, 1971; Friedman and Staub, 1976).
After gavage administration of [14C]methylurea plus nitrite to rats, 7-[14C]methylguanine was detected in the nucleic acids of the stomach, intestine and liver, which was attributed to [14C]methylnitrosourea formation (Montesano and Magee, 1971). Likewise, after gavage administration of DMA plus nitrite to mice, 7-methylation of guanine (7-[14C]methylguanine) and an inhibition of ribonucleic acid (RNA) and protein synthesis were observed in the liver and attributed to NDMA formation (Friedman et al., 1972). Gombar et al. (1983) were also able to detect 7-[14C]methylguanine in urine of male Wistar rats gavaged with very low doses of [14C]aminopyrine and sodium nitrite: 0.3 and 0.053 mg/kg bw (equivalent to 0.035 mg NO2¯/kg bw), respectively.
Friedman and Staub (1976) evaluated the mutagenic action of combined oral administration of methylurea (2000 mg/kg bw) and sodium nitrite (0, 100 or 150 mg/kg bw, equivalent to 0, 67 or 100 mg NO2¯/kg bw) in drinking water through the uptake of [3H]thymidine into testicular DNA of male Swiss mice (testicular DNA synthesis). DNA synthesis was quantified 3.5 hours after drug administration as uptake into DNA of a 30-minute pulse of 0.37 MBq of [3H]thymidine. Combinations of methylurea at 2000 mg/kg bw and sodium nitrite at 150 mg/kg bw (equivalent to 100 mg NO2¯/kg bw) administered orally to male Swiss mice (four per group) resulted in gastric synthesis of nitrosomethylurea and inhibited testicular DNA synthesis by 83%. Combinations of methylurea at 1000 mg/kg bw and sodium nitrite at 100 mg/kg bw (equivalent to 67 mg NO2¯/kg bw) inhibited DNA synthesis by 75%. With DMA and sodium nitrite, a combination that results in gastric synthesis of NDMA, inhibitions of 65% and 57% were observed with DMA at 2000 mg/kg bw together with sodium nitrite at 150 mg/kg bw (equivalent to 100 mg NO2¯/kg bw) and with DMA at 1000 mg/kg bw in combination with sodium nitrite at 100 mg/kg bw (equivalent to 67 mg NO2¯/kg bw), respectively. In separate experiments, NDMA (50 mg/kg bw, orally) and N-nitrosodiethylamine (100 mg/kg bw, intraperitoneally) inhibited thymidine uptake by 30% and 89%, respectively.
Unscheduled DNA synthesis (UDS) was significantly increased in leukocytes from six of 10 subjects after a variety of meals consisting of cured meat or fish and vegetables (containing varying amounts of nitrate, nitrite and nitrosamines), although no correlation could be found with dietary nitrate, nitrite or nitrosamine levels or with blood nitrosamine levels (Kowalski et al., 1980). In another study, Miller (1984) found that ingested nitrite (from salad) had no effect on the level of UDS in circulating leukocytes after consumption of an amine-containing meal by human subjects (10 males, 10 females). It was concluded from their study that although the UDS sometimes observed after a meal may be associated with DNA damage induced by NOCs formed in vivo, dietary nitrite per se is not directly implicated.
9.2.5.2 In vitro
In intra-sanguineous host-mediated assays with mice, combined administration of nitrite and DMA, morpholine or aminopyrine induced mutagenic activity in the test organisms Salmonella typhimurium in the case of DMA and morpholine and Schizosaccharomyces pombe in the case of aminopyrine (Edwards et al., 1979; Whong and Ong, 1979; Whong et al., 1979; Barale et al., 1981).
Inui et al. (1978, 1980) treated Syrian hamsters with various doses of sodium nitrite and morpholine or amidopyrine in utero by its oral administration to the mothers. Gene mutations, as evidenced by micronucleus formation and morphological or malignant transformation of the cells, were found in cultured embryonic cells, most probably due to transplacental activity of the nitrosamines endogenously formed in the mothers. There was no increase in chromosomal aberrations.
Gatehouse and Tweats (1982) conducted the nitrosation assay procedure test by adding 40 mmol sodium nitrite per litre to normal fasting human gastric juice from healthy untreated volunteers. The data clearly demonstrate that such treatment results in the formation of derivatives with specific mutagenic activity for S. typhimurium TA1537 (the strain recommended for use in the nitrosation assay procedure test), but not for S. typhimurium TA1535 or TA98. Such activity may have resulted from the nitrosation of phenols, carbazoles and indoles, which occur naturally in gastric juice. However, the formation of detectable levels of mutagenic species within fasting gastric juice in the present experiments was manifest only at nitrite concentrations that were in excess of 2000 times those normally expected in vivo and 300 times those obtained after a nitrite-rich meal.
Treatment of some food products (fish, beans, borscht) with sodium nitrite (1000 and 5000 mg/kg, equivalent to 667 and 3334 mg NO2¯/kg) at pH 3.0 led to the development of mutagenic activity in S. typhimurium in the presence and absence of a metabolic activation system. Mutagenic activities of nitrosation products of Japanese foodstuffs (after treatment with nitrite at pH 4.2) were also detected in S. typhimurium, with and without metabolic activation (Marquardt et al., 1977; Weisburger et al., 1980).
The potential of amine-containing drugs to yield mutagenic NOCs through nitrosation has received considerable attention in the scientific press. Indeed, most NOCs formed by nitrosatable drugs gave a positive response in one or more short-term genotoxicity assays (Brambilla and Martelli, 2005, 2007). Andrews et al. (1980) showed that nitrosation products of several drugs (by treatment with sodium nitrite in acid medium) possessed mutagenic activity in a bacterial assay with S. typhimurium. In a review, Brambilla (1985) noted that nitrosation products of several drugs (after treatment with nitrite in acidic medium) caused DNA fragmentation in Chinese hamster ovary cells in vitro.
In an extensive review, Brambilla and Martelli (2007) found that 173 of 182 (95%) drugs examined in various experimental conditions for their ability to react with nitrite formed NOCs or other reactive species. Moreover, 112 of 136 (82.4%) drugs examined in short-term genotoxicity tests or in long-term carcinogenesis assays, either in combination with nitrite or using their nitrosation product, to establish whether they produce genotoxic and carcinogenic effects were found to give at least one positive response. For the N-nitroso derivatives of 26 drugs, it was possible to calculate the corresponding genotoxic potencies from the results of studies on their ability to induce DNA fragmentation in cultured Chinese hamster ovary cells or in primary cultures of rats and human hepatocytes. The estimated DNA-damaging potencies reported in this review indicated that 12 of 23 drugs (52%) form NOCs that are more potent than methylnitrosourea in damaging the DNA of Chinese hamster ovary cells, and six of eight drugs (75%) form NOCs that are more potent than NDMA in damaging the DNA of primary rat hepatocytes. Thus, it is evident that, at least in the assays considered, the NOCs formed by some drugs are characterized by a genotoxic potency higher than those of NOCs that have been classified by IARC (1987) as probably carcinogenic to humans (i.e., NDMA, N-nitrosodiethylamine and methylnitrosourea.
9.2.6 Genotoxicity of nitrate and nitrite
The mutagenicity and genotoxicity of nitrate and nitrite have been extensively reviewed in other work (IARC, 2010). In general, results are mixed for nitrate, but evidence for the genotoxicity of nitrite is mostly positive.
9.2.6.1 In vivo
Nitrate
Examination of embryonic cells from Syrian golden hamsters for micronucleus formation, chromosomal aberrations, morphological/malignant cell transformation and drug-resistant mutation did not reveal any abnormalities (Tsuda et al., 1976). Sodium nitrate given to mice by gastric intubation yielded negative results for UDS in early to mid-spermatids and did not appear to produce any sperm abnormality (Alavantić et al., 1988).
Conversely, when rats were treated intragastrically with sodium nitrate, increases in the frequency of chromosomal aberrations in bone marrow were reported. These results were weaker in mice (Alavantić et al., 1988).
Nitrite
Morphological transformation of hamster embryonic cells in utero was reported following exposure to nitrite (Inui et al., 1979). Negative results were obtained for rats orally exposed to sodium nitrite when the pyloric mucosa was examined for single-strand breaks or unscheduled DNA synthesis. However, it should be noted that sperm head abnormality was detected after treatment (Alavantić et al., 1988; Ohshima et al., 1989).
Positive results were reported for chromosomal aberration in rat, mouse and chinchilla bone marrow cells following nitrite exposure (El Nahas et al., 1984; Luca et al., 1987; Alavantić, 1988; Ohshima et al., 1989) and in liver cells from embryos after exposure of pregnant rats (El Nahas et al., 1984). Contrarily, negative results were reported for chromosomal aberrations following in utero exposure in the hamster (Inui et al., 1979).
9.2.6.2 In vitro
Nitrate
Tests for the mutagenicity of sodium and potassium nitrate using the Ames assay were negative in S. typhimurium (Ishidate et al., 1984).
Tests for chromosomal aberrations were mixed for sodium nitrate, as it did not induce single strand breaks in the DNA of Chinese hamster V79 cells (Gorsdorf et al., 1990), but positive results were obtained in Chinese hamster fibroblasts (Ishidate et al., 1984). It should, however, be noted that potassium nitrate (and sodium chloride) gave negative results in the same study, suggesting that the observed effects were due to changes in osmolarity (IARC 2010).
Nitrite
Both sodium and potassium nitrite yielded positive results for the Ames test in various strains of S. typhimurium (Ishidate et al., 1984; Brams et al., 1987; Prival et al., 1991; Zeiger et al., 1992; Balimandawa et al., 1994). Sodium nitrite also gave weakly positive results in the umu test (Nakamura et al., 1987). Positive results were reported for this compound in the SOS chromotest (IARC, 2010).
Although DNA single-strand breaks were not observed in cultured cells (mouse mammary carcinoma or Chinese hamster V79) treated with sodium nitrite, sodium nitrite did induce chromosomal abnormalities in a number of cell lines in different species, including Chinese hamster V79 cells, Chinese hamster fibroblasts, C3H mouse mammary carcinoma cells, Syrian hamster embryo cells and African green monkey foetal liver cells (Kodama et al., 1976; Tsuda and Kato, 1977; Ishidate et al., 1984; Budayová, 1985; Luca et al., 1987). Sodium nitrite also induced 6-thioguanine-resistant and 8-azaguanine-resistant mutants in V79 hamster cells and mouse mammary carcinoma cells, respectively (Tsuda et al., 1976; Tsuda and Hasegawa, 1990). Positive tests were reported for aneuploidy in Syrian hamster embryo cells (Tsuda et al., 1976).
9.2.7 Reproductive and developmental toxicity
9.2.7.1 Reproductive effects
No treatment-related effects on parameters of fertility were observed in pair-based animal studies of sodium nitrite and potassium nitrate, although no studies were conducted under a standard multigenerational reproductive study protocol. These studies evaluated mated-pair exposure to nitrate/nitrite prior to mating through to weaning in CD-1 mice (sodium nitrite in drinking water at 0, 125, 260 and 425 mg/kg bw/day, equivalent to 0, 83.4, 173.4 or 283.5 mg NO2¯/kg bw/day; NTP, 1990); CD-1 mice and Sprague-Dawley rats (mixture of 1×, 10× and 100× the median concentration of ammonium nitrate determined in ground water surveys; Heindel et al., 1994); C57BL/6 mice (sodium nitrite in drinking water at 0, 30.7 or 310 mg/kg bw/day, equivalent to 0, 20.5, 206.8 mg NO2¯/kg bw/day; Anderson et al., 1985); SD rats (sodium nitrite in diet at 0%, 0.0125%, 0.025% or 0.05% w/w; Vorhees et al., 1984); and Wistar rats (sodium nitrite in diet at 0, 5, 25 or 100 mg/kg bw, equivalent to 0, 3.3, 16.7 or 66.7 mg NO2¯/kg bw/day; Olsen et al., 1984). Parameters examined in these studies included mean number of litters per pair, days to deliver litter, mean litter size, pup viability, post-delivery estrous cycle, gestation length, sex ratio of offspring, external malformations, timing of vaginal opening in female offspring, mean pup weight and pup survival.
However, the estrous cycles of female mice was significantly longer in mice exposed to sodium nitrite at 1500 and 5000 mg/L (equivalent to 1000 and 3334 mg NO2¯/L) but was not altered in mice exposed to 375 or 750 mg sodium nitrite/L (equivalent to 250 or 500 mg NO2¯/L) in drinking water for 14 weeks; no significant differences in vaginal cytology parameters after 14 weeks of exposure and no notable histopathological changes in reproductive organs after 2 years of exposure were reported (NTP, 2001).
At high levels of sodium nitrite and sodium nitrate exposure, there was evidence for and against testicular degeneration and reduced sperm motility in male rats and mice. Significantly reduced sperm motility was observed in male rats and mice exposed to sodium nitrite at 5000 mg/L (3334 mg nitrite/L) and testicular degeneration in male mice exposed to sodium nitrite at 3000 or 5000 mg/L (2000 or 3334 mg NO2¯/L) in drinking water for 14 weeks; no notable histopathological changes in reproductive organs were reported in either species exposed for 2 years in drinking water (NTP, 2001). Sperm count and motility as well as activity of enzymatic markers of spermatogenesis were significantly decreased after male Swiss albino rats (n = 6 per group) were exposed orally to sodium nitrate at 50, 100 or 200 mg/kg bw/day (equivalent to 36.45, 72.9 or 145.8 mg NO3¯/kg bw/day) for 60 days, compared with controls; decreased testicular weight and histopathological changes were significant only at the two highest doses (Aly et al., 2010). Decreased sperm count and motility in mice exposed to potassium nitrate at 225-270 mg/kg bw/day (equivalent to 138-165.8 mg NO3¯/kg bw/day) for 35 days have also been reported, with no effects at 175-210 mg/kg bw/day (equivalent to 107.45-128.9 mg NO3¯/kg bw/day) in testis, epididymal or accessory organ weight (Pant and Srivastava, 2002). Grant and Butler (1989) reported testicular cell hyperplasia to increase with sodium nitrite dose (0.2% or 0.5% w/w; 50-F344 rats per dose) compared with controls (n = 20) after 115 weeks of exposure in diet; however, results were not statistically significant and the authors suggested that the results were confounded by hormonal imbalances in the geriatric rats.
9.2.7.2 Developmental effects
In utero exposure of mice to sodium nitrite at doses ranging from 20 to 243 mg/kg bw/day (equivalent to 13.3 to 162 mg NO2¯/kg bw/day) did not provide clear or consistent evidence of adverse effects on measures of foetal viability, weight, sex ratio or frequency of external or internal malformations (Globus and Samuel, 1978; Shimada, 1989). Significant changes in hepatic erythropoiesis were observed, but no sustained alterations of mature red blood cells were evident; hence, the functional consequences of these findings are unclear (Globus and Samuel, 1978). All three studies covered a major part of organogenesis (gestation days 6-18) and used oral exposure (gavage or drinking water).
In utero exposure of guinea pigs to sodium nitrite at 45, 50, 60 or 70 mg/kg bw (equivalent to 30, 33.3, 40, 46.7 mg NO2¯/kg bw) by subcutaneous injection resulted in spontaneous abortion of litters; co-administration of methylene blue, a methaemoglobin antagonist, had a protective effect on foetuses (Kociba and Sleight, 1970; Sinha and Sleight, 1971). In addition, neither sodium nitrite (45 or 50 mg/kg) in the presence of ascorbic acid nor ascorbic acid deficiency alone was associated with excess abortions; however, together they resulted in 83% mortality (Kociba and Sleight, 1970). No gross abnormalities were noted in any living or aborted fetuses. Prenatal exposure to 300 to 10,000 mg potassium nitrite/L (equivalent to 162 to 5,410 mg NO2¯/L) in maternal drinking water resulted in 3 to 100% foetal loss at all doses, which increased with increasing dose compared with controls (Sleight and Atallah, 1968).
In a series of studies in which pregnant rats were exposed to sodium nitrite in drinking water at 2000 mg/L (equivalent to 1334 mg NO2¯/L) from gestation day 13 through to birth, alterations of neurobehavioural parameters were found (Nyakas et al., 1990, 1994a, 1994b). Affected parameters included impaired discriminate learning and long-term retention of passive avoidance, open field activity, hyper-reactivity to foot shock, prolonged stress response and ingrowth of nerve fibres; effects were prevented or alleviated by nimodipine (neuroprotective, antihypoxic) administration. In other studies in which sodium nitrite was administered to pregnant and lactating rats, no effects on birth weight were observed, but a lower mean litter size was reported after pregnant rats were exposed to sodium nitrite in drinking water at 2000 or 3000 mg/L (equivalent to 1334 or 2000 mg NO2¯/L); however, no statistics were provided (Shuval and Gruener, 1972). Prenatal and postnatal exposure to sodium nitrite in drinking water at concentrations of 0, 0.5, 1.0, 2.0 or 3.0 g/L (equivalent to 0, 0.22, 0.67, 1.33 or 2 g NO2¯/L) had no effects on prenatal pup weight, but there were reports of adverse effects on postnatal pup growth, increased mortality and decreased haematological parameters (haemoglobin content, red blood cell counts and maximum corpuscular volume values) (Roth et al., 1987; Roth and Smith, 1988). The authors suggested that these adverse effects resulted from severe iron deficiency, which can be mitigated or eliminated by iron supplementation (Roth and Smith, 1988). No adverse effects on pup weights, increase in morphological malformations or increased mortality was observed in rats fed 0, 6, 47 or 580 mg sodium nitrite (equivalent to 0, 4, 31, 387 mg NO2¯) per kg of meat in diet (Olsen et al., 1984). In addition, no external malformations or post-weaning pup mortality was observed after rats were fed sodium nitrite (0%, 0.0125%, 0.025% or 0.05% w/w) 14 days prior to mating through to lactation; however, treatment was associated with increases in pre-weaning pup mortality and decreases in open-field locomotor activity at the highest dose (Vorhees et al., 1984).
An early review of experimental animal studies (Fan et al., 1987) did not find evidence of teratogenic effects attributable to nitrate or nitrite ingestion. Adverse reproductive and developmental effects occurred at doses that were estimated to be 1000 times greater than the estimated human intake. The effects of sodium and potassium nitrate and nitrite were tested in rats, mice, rabbits, guinea pigs and hamsters. In a review of animal studies, Manassaram et al. (2006) concluded that adverse reproductive and development effects result from high doses of nitrate or nitrite.
9.3 Endogenous formation of N-nitroso compounds
Nitrosating agents (NAs; NxOy form) can react under certain conditions with nitrosatable compounds (NCs) to form N-nitrosamines and N-nitrosamides (hereafter nitrosamines and nitrosamides), collectively called N-nitroso compounds (NOCs):
NAs + NCs → NOCs
This reaction is called N-nitrosation or simply nitrosation. Human beings are exposed to various types of nitrosating agents through diet, drinking water and tobacco smoke. These substances can also be synthesised endogenously from ingested nitrate and nitrite (Bartsch et al., 1988; Brambilla and Martelli, 2005).
For about 300 NOCs tested for carcinogenicity, 85% of the 209 nitrosamines and 92% of the 86 nitrosamides assayed have been shown to induce cancer (Montesano and Bartsch, 1976). In various studies with different NOCs, carcinogenicity has been demonstrated in 36 different species of fish, reptiles, birds and mammals, including five species of primate (Montesano and Bartsch, 1976; Gangolli et al., 1994; Brown, 1999; Vermeer and Van Maanen, 2001). In rodents, nitrosamines principally induce tumours of the liver, kidney, oesophagus, oral and nasal cavities, lung, trachea, urinary bladder, pancreas and thyroid, whereas nitrosamides induce tumours of the lymphatic (acute myelocytic leukaemia and T and B cell lymphoma) and nervous systems (when given orally), glandular stomach, small intestine, bone and skin (Mirvish, 1991, 1995). NOCs therefore constitute a versatile class of carcinogens (NAS, 1981; Shephard et al., 1987; Bartsch et al., 1988), as no other carcinogen group induces such a wide variety of tumours (Mirvish, 1995).
As reviewed by Mirvish (1975b) and Shephard et al. (1987), nitrosamines can be formed from different amino compounds, including secondary amines (dialkyl, alkylaryl, diaryl or cyclic secondary amines), and nitrosamides can be formed from secondary and tertiary amides (N-substituted ureas, N-alkylureas, N-alkylcarbamates, urethanes and simple N-alkylamides). In the nitrosation reaction, all these amino compounds act as nitrosatable compounds.
Secondary amines are major substrates for NOC, as they occur abundantly in food. Fish, for example, contain relatively large amounts of the secondary amine DMA. Like TMA, DMA is a common degradation product of TMAO, an end product of nitrogen metabolism in fish (Zeisel et al., 1985). Secondary amines can also form in the stomach following the digestion of alkylamine-containing foods such as meat or other protein (Addiscott and Benjamin, 2004). Moreover, as is the case for tertiary amines, several secondary amines are used as drugs and pesticides.
Tertiary amines may also undergo nitrosation in mildly acidic conditions such as those prevailing in the mammalian stomach during digestion of a meal (Mirvish, 1975b; Lijinsky and Reuber, 1980; Lijinsky, 1984; Bartsch et al., 1988). Mirvish (1975b) has indicated that this in vivo nitrosation of simple tertiary amines will probably not prove to be important biologically, as their reaction rate is usually lower. Nevertheless, in terms of quantity alone, they could still represent a significant source of nitrosamines, because many drugs are tertiary amines (Lijinsky and Reuber, 1980). Consequently, tertiary amines are of special interest.
Nitrosation of ureas and carbamates may also be important, as many of these compounds are used as drugs and as insecticides (Mirvish, 1975b).
Certain primary amines, such as tyramine (found in cheese), have also been reported to undergo reaction with nitrite to yield diazo compounds, which have been shown to be mutagenic and carcinogenic (Bartsch et al., 1988).
Other possible nitrosatable compounds, and sources of NOCs, are amidines, cyanamides, guanidines, hydroxylamines, hydrazines, hydrazones and hydrazides (Crespi and Ramazzotti, 1991).
Amino compounds that may interact with nitrosating agents to form NOCs are found ubiquitously in the human environment. Foods, drugs, cosmetics, pesticides and tobacco products are all significant sources of nitrosatable amino compounds (Kamm et al., 1975; Montesano and Bartsch, 1976; Brambilla and Martelli, 2005). In addition to exogenous sources, some nitrosatable species (e.g., DMA, piperidine, pyrrolidine) are synthesized in the body (Montesano and Bartsch, 1976; Tannenbaum et al., 1991). Humans are therefore ubiquitously exposed (exogenously and endogenously) to a variety of amino-containing compounds, which can potentially react with nitrosating agents to give NOCs (Shephard et al., 1987; Bartsch et al., 1988).
People can be exposed either to (exogenous) preformed NOCs or to endogenous NOCs (via endogenous nitrosation) (Crespi and Ramazzotti, 1991). Human exposure to preformed NOCs usually occurs through diet (preserved meats and fish, beer), certain occupational settings and the use of consumer and tobacco products (Brambilla and Martelli, 2005; Ward et al., 2005a). Preformed NOC is not covered in this document.
Endogenous nitrosation may occur through several mechanisms, including acid-catalysed (particularly in the acidic stomach) and cell-mediated (bacteria and immune cell; at neutral pH) formation (Ohshima and Bartsch, 1994; Mirvish, 1995; IARC, 2010).
Thus, NOC formation can take place under several conditions in food products or within the body. However, only endogenous nitrosation, by reaction of nitrite with nitrosatable compounds, is discussed in the present document.
9.3.1 Chemistry of endogenous N-nitrosation
Although the relative contribution of endogenous nitrosation (acid-catalysed and cell-mediated) to total exposure to NOCs is still not clear, the endogenous synthesis of NOCs was suggested as the largest source of exposure to NOCs for the general population (Shephard et al., 1987; Bartsch et al., 1988; Crespi and Ramazzotti, 1991; NRC, 1995; Fristachi and Rice, 2007). Two mechanisms of endogenous nitrosation account for an estimated 40-75% of the total human exposure to NOCs, even though most of the factors involved have not yet been well characterized (Crespi and Ramazzotti, 1991; Tricker, 1997; Jakszyn et al., 2006).
9.3.1.1 Acid-catalysed nitrosation
The chemistry of NOC formation has been extensively studied, and a number of reviews have been published (Mirvish, 1975b; Shephard et al., 1987; Bartsch et al., 1988). It has been suggested that interaction of nitrosatable compounds (also called nitrosatable precursors) with nitrite in the human stomach could give rise to carcinogenic NOCs, formation of which could increase the risk of cancer (Lijinsky, 1984).
For nitrosation to occur in healthy humans, nitrite swallowed with saliva is usually first converted to nitrous acid (HNO2, pKa 3.37) under acidic conditions in the stomach (Mirvish, 1975b; Brambilla and Martelli, 2007). Therefore, acid-catalysed nitrosation in the stomach, which is a non-enzymatic reaction, has generally been considered to be the most important route for endogenous formation of NOCs (Leaf et al., 1989).
Nitrous acid is unstable and spontaneously converted to the active nitrosating species nitrous anhydride (N2O3). Nitrous anhydride, formed from two molecules of nitrous acid, is a powerful nitrosating agent capable of donating NO+ to secondary and tertiary amines to form nitrosamines (Mirvish, 1975b; Leaf et al., 1989). This subsequent nitrosation reaction occurs especially rapidly with weakly basic secondary amines (e.g., morpholine, piperazine, N-methylaniline; Mirvish, 1975b).
Certain nitrosatable compounds (e.g., amides, guanidines, carbamates, alkylureas, ureas) are too unreactive to be readily nitrosated by nitrous anhydride. Alternatively, nitrous acid can be protonated to nitrous acidium ion (H2NO2+, protonated nitrous acid), which reacts directly with the neutral amides to form nitrosamides. Usually these reactions are quite slow at pH greater than 3 but become progressively faster with increasing acidity (Mirvish, 1975b). For most amides, the reaction rate increases about 10-fold for each 1-unit drop in pH from 3 to 1. The rate of nitrosamide formation is then proportional to the concentrations of amide and H2NO2+, the latter being proportional to nitrite concentrations (Mirvish, 1975b).
In addition to intragastric pH (i.e., acidification in the stomach), nitrosation is also modified by the presence of catalysts (Bartsch et al., 1988). Catalysts include bacterial enzymes and several nucleophilic anions (thiocyanates [SCN] and halides) (Crespi and Ramazzotti, 1991). The reaction of amines with nitrous anhydride can be considered as a nucleophilic attack by the amine on the nitrosyl nitrogen of nitrous anhydride. Several species, such as NO-SCN, NO-Cl, NO-I and NO-Br, are similarly reactive towards amines and consequently act as catalysts when present in the reaction system (Mirvish, 1975b; Leaf et al., 1989). Thus, thiocyanate- and halide-catalysed nitrosation of amines will in general compete favourably with the nitrous anhydride mechanism (Mirvish, 1975b).
The results of in vitro studies show that the catalysis order is SCN > I > Br > Cl > phosphate or carboxylate. Most of these catalysts (SCN−, I−, Cl−) are present in some physiological fluids (e.g., saliva, gastric juice) and are therefore biologically relevant with respect to endogenous nitrosation reactions (Mirvish, 1975b, 1991; Leaf et al., 1989; Addiscott and Benjamin, 2004). For example, thiocyanate occurs in saliva, especially that of smokers (which has a thiocyanate concentration of about 6 mmol/L), and gastric juice (thiocyanate concentration of 0.2-0.7 mmol/L) (Mirvish, 1975b; Licht and Deen, 1988; Krul et al., 2004). It is worth noting that nitrosamide formation is not catalysed by these catalysts (Licht and Deen, 1988).
It has also been reported that endogenous nitrosation can be catalysed by alcohols, aldehydes, haem and caffeine (Crespi and Ramazzotti, 1991). Caffeine increases acid secretion in the stomach, at least in humans, and hence might elevate the intragastric acid-catalysed nitrosation and enhance adenoma induction by amines plus sodium nitrite (Mirvish, 1975b). In contrast, there is evidence that haem (contained in red meat) can oxidize nitric oxide to various nitrogen oxides (hence nitrosating agents), with the subsequent formation of NOCs (Bingham et al., 1996; Cross et al., 2003; Mirvish et al., 2008). This may help to explain why colon cancer risk increased when the intakes of both nitrate in water and red meat were increased (Mirvish et al., 2008).
9.3.1.2 Cell-mediated nitrosation
It is now also recognized that other (non-gastric) pathways of endogenous nitrosation, including those catalysed by bacteria and mammalian cells, may exist. This non-gastric nitrosation may take place in many sites within the body (Brambilla and Martelli, 2005). Therefore, it is postulated that endogenous nitrosation can be stimulated by inflammatory and other pathological or pharmacological conditions producing a rise in gastric pH and thus allowing the proliferation of nitrate-reducing bacteria (Brambilla and Martelli, 2007).
Helicobacter pylori is a known risk factor for gastric cancer that has been designated as a Group 1 carcinogen by IARC (Vermeer et al., 2002; Shiotani et al., 2004). Infection with H. pylori has been identified as a major cause of chronic gastritis (a condition responsible for increased gastric juice pH, hence hypochlorhydria) and intestinal metaplasia, both of which are associated with an increased risk of gastric cancer (Vermeer et al., 2002; Kodama et al., 2003). There is evidence indicating that H. pylori may be indirectly involved in the formation of NOCs via the above two mechanisms (bacterial and mammalian cell-mediated nitrosation). First, H. pylori elicits an inflammatory response that results in NOC formation via the mammalian cell-catalysed pathway. Second, H. pylori infection causes chronic gastritis, leading to atrophy and hypochlorhydria (hypoacidity, leading to high gastric juice nitrite levels) and subsequent deficiency in vitamin C, an inhibitor of nitrosation (Sobala et al., 1991; Vermeer et al., 2002; Shiotani et al., 2004).
9.3.2 Inhibitors of (acid-catalysed) N-nitrosation
Many naturally occurring and synthetic compounds, including polyphenols, sulphur and miscellaneous compounds, vitamins and other complex mixtures, have been shown to inhibit the nitrosation reaction in in vitro studies (Bartsch et al., 1989, 1990). These compounds usually compete with nitrosatable compounds for the nitrosating agents that they reduce to nitrogen or nitric oxide (reviewed by Bartsch et al., 1988; Leaf et al., 1989). However, in the presence of oxygen, anions and certain metal salts, nitric oxide is readily oxidized to the potent nitrosating species and the nitrosating capacity is restored (Bartsch et al., 1988). An extensive review by Bartsch et al. (1988) describes these compounds and their mechanisms of action as well as their capability of inhibiting the endogenous formation of NOCs in experimental animals and humans. Among these compounds are many dietary substances, including vitamins C and E, and polyphenols (Crespi and Ramazzotti, 1991).
9.3.2.1 Vitamin C (ascorbate + dehydroascorbic acid)
Among many nitrosation inhibitors, most of the attention has focused on vitamin C, which is considered to be virtually non-toxic. Vitamin C has been shown to be an effective inhibitor of acid-catalysed NOC formation, in vivo and in vitro (Brambilla and Martelli, 2007).
In vivo, ascorbate has also been shown to be one of the most effective inhibitors of intragastric nitrosation. When it was administered to animals together with nitrosating agents and a variety of secondary amines, amino acids, alkylureas and nitrosatable drugs, the formation of NOCs and their toxic, mutagenic and carcinogenic effects were significantly reduced (reviewed by Bartsch et al., 1988).
This inhibition of NOC formation depends on the reduction of nitrite to nitric oxide by vitamin C, which competes with the amine or amide for the nitrite or, to be more precise, the nitrosating agents. This explains why vitamin C is called a nitrite scavenger; this property has been attributed to its relatively rapid reaction with nitrite, as opposed to the slower rates of reaction of nitrite with secondary amines (Mackerness et al., 1989).
Given that it is water soluble, ascorbate may not be an effective inhibitor of nitrosation in lipophilic media. It has recently been demonstrated that in closed aerobic systems (e.g., stomach), nitric oxide produced from the ascorbate-nitrite reaction can migrate to the lipid phase (e.g., gastric mucosa), where it is oxidized by molecular oxygen to nitrogen dioxide, which reacts with water to regenerate equimolar amounts of nitrous and nitric acids (Bartsch et al., 1988; Mirvish, 1991, 1994). Consequently, in the presence of lipids, vitamin C can promote nitrosation (Mirvish, 1986).
In contrast, Kyrtopoulos et al. (1991) reported in vivo inhibition of only 50-63%. Thus, vitamin C seems to be an efficient inhibitor of nitrosation reactions in vitro (Licht and Deen, 1988), but less so when the reaction vessel is the stomach. It is worth noting that large doses (1-2 g) of the vitamin are usually used in such in vitro inhibition experiments. Even if we consider the daily gastric secretion of vitamin C (which amounts to about 60 mg), the minimum daily requirement of vitamin C is only 60 mg/person (range 30-90 mg; Rathbone et al., 1989). Hence, much larger intakes may be needed to prevent intragastric nitrosation (L'hirondel and L'hirondel, 2002).
9.3.2.2 Vitamin E (tocopherol) and other compounds
Conversely to vitamin C, which is water soluble, α-tocopherol, the principal component of vitamin E, is highly lipophilic. There is evidence that free α-tocopherol reduces nitrite to nitric oxide, as does ascorbate, and then constitutes an excellent inhibitor of nitrosation in lipids and emulsions in water (Mirvish, 1986; Bartsch et al., 1988). This means that the vitamin in its usual commercial form (i.e., the acetate) must be hydrolysed in vivo to free α-tocopherol by esterases in order to inhibit the endogenous nitrosation (Mirvish, 1986; Bartsch et al., 1988). Given that vitamins C and E seem to be complementary, a combination of vitamins C and E would be especially useful for inhibiting NOC formation in lipid-water mixtures such as the gastric compartment or cell membranes (Mirvish, 1986).
Other compounds, including polyphenols (catechol, gallic acid, hydroquinones, tannic acid and tannins), sulphur compounds (cysteine, glutathione, sulphur dioxide) and miscellaneous compounds (alcohol, caffeine, carbohydrates, hydrazine, hydroxylamine, urea), have been reviewed by Bartsch et al. (1988) and found to inhibit endogenous nitrosation by scavenging nitrite and nitrosating agents, as do vitamins C and E.
Inhibition has also been observed with numerous foods and beverages: complex mixtures, such as betel nut extracts, tea, coffee, fruit juices, milk and milk products, radish juice, soya products and alcoholic beverages (Bartsch et al., 1988; Brambilla and Martelli, 2007).
9.3.3 In vitro and in vivo findings on endogenous nitrosation
Endogenous nitrosation has been demonstrated by 1) in vitro incubation of precursors under simulated salivary or gastric conditions; or 2) in vivo determination of NOCs in body fluids and excreta after administration of precursors (Walker, 1990; Gangolli et al., 1994).
Ohshima and Bartsch (1981) described the sensitive procedure of the N-nitrosoproline (NPRO) test. The detection and estimation of NPRO excreted in the urine (cumulative urinary excretion in excess of any external sources) have been widely used as a quantitative measure of in vivo nitrosation (presumed to occur largely in the stomach), because NPRO is claimed to be safe (i.e., non-carcinogenic) and is excreted almost entirely and virtually unchanged in (human and rat) urine (Licht and Deen, 1988; Gangolli et al., 1994; Mirvish, 1996).
Some associations were found between drinking water nitrate concentration and NPRO formation (Moller et al., 1989; Mirvish et al., 1992). Also, in most instances, higher exposures to NOCs were found in subjects at high risk of developing cancers of the stomach, oesophagus, oral cavity and urinary bladder (Bartsch et al., 1990; Gangolli et al., 1994).
Another important factor that determines endogenous nitrosation in human subjects is the timing of intakes (kinetics component of endogenous nitrosation). Mirvish et al. (1995) found that a nitrate dose yielded the most NPRO when it was given 1 hour before the meal containing proline. In that study, NPRO formation was 3-4 times higher when nitrate and proline were taken while fasting than when the proline was taken with a meal and was maximal when nitrate (500 mg) was given 1 hour before, rather than with or 2 hours before, a meal containing proline. This time of 1 hour reflects the 1-2 hours required for salivary nitrite to peak after a dose of nitrate is taken.
Ascorbate completely inhibited [15N]NPRO formation from [15N]nitrate in humans and ferrets, but did not affect the excretion of unlabelled NPRO (26 nmol/day), which was probably due to dietary NPRO or to in vivo nitrosation outside the stomach (Tannenbaum et al., 1991). In another study, volunteers were given 325 mg nitrate in drinking water 2-4 h after lunch and, 30 min later, took 550 mg proline and 1 to 6 doses of ascorbate in water. In this study, a dose of 466 mg ascorbate given 5 hours before, with, 0.5-1 hour after and 2 hours after the proline dose, reduced the NPRO excretion of 42 nmol/day in the absence of ascorbate by 44%, 77%, 39% and 0%, respectively (Mirvish, 1994).
Mirvish (1991) also reported similar results, although under somewhat different study conditions. In that experiment, volunteers ate a standard meal containing added proline 1 hour after taking nitrate. When 1 g ascorbate was given 2 hours before, with, 1 hour after or 2 hours after the test meal, net NPRO excretion was inhibited by 94%, 100%, 87% and 25%, respectively. To test whether the inhibition of in vivo nitrosation by vegetables/fruits is due solely to their ascorbate content, Helser et al. (1992) conducted the NPRO test, but instead of ascorbate, they gave 100 mL of vegetable or fruit juice to which ascorbate had been added, to give a total of 46 mg ascorbate. Carrot, strawberry, pineapple and green pepper juices (in increasing order of effectiveness) inhibited NPRO formation by 41-63%, compared with 24% when 46 mg ascorbate was given in 100 mL water (inhibitions are calculated after subtracting the blank NPRO). These results demonstrate that some vegetables/fruits contain compounds other than ascorbate that inhibit endogenous nitrosation. Hence, negative associations between vegetable/fruit consumption and cancer are probably not due solely to ascorbate, even if only the inhibition of NOC formation is involved. Ascorbate has also been shown to inhibit in vivo nitrosation due to nitric oxide (Mirvish, 1994).
The NPRO test is at best a reasonable indicator of the gastric formation of carcinogenic nitrosamines and perhaps of other NOCs (Bartsch et al., 1988; Gangolli et al., 1994). However, Licht and Deen (1988) showed that NPRO is not an accurate indicator of gastric nitrosation under physiological (low dose) conditions, even when corrections are made for dietary intake of NPRO. Therefore, NPRO studies seem useful only in suggesting trends (Licht and Deen, 1988). In fact, the NPRO test cannot accurately estimate the actual dose of NOCs, because NPRO is not metabolized, as is the case of the other NOCs; rather, it is excreted almost entirely in the urine.
Several experimental studies in humans demonstrated a direct relationship between nitrate intake and endogenous formation of NOCs. Indeed, in the context of NOC formation from normal dietary components, Vermeer et al. (1998) carried out an investigation in 25 human volunteers who ingested 3.65 mg nitrate/kg bw/day (0.84 mg/kg bw/day as nitrate-nitrogen) in drinking water or vegetables, in combination with a fish meal rich in amines as nitrosatable precursors. There was a significantly increased urinary excretion of NDMA (0.64-0.87 µg/24 h) by the human volunteers. Analyses of urine also revealed the presence of detectable amounts of N-piperazine and NPYR. Another study on human populations exposed to various nitrate levels in their drinking water provided further confirmatory evidence for the in vivo formation of NPYR (Van Maanen et al., 1998). In the two above studies, there was a significant correlation between 24-hour urinary excretion of volatile nitrosamines (NDMA and NPYR) and 24-hour urinary nitrate excretion (P = 0.02) (Van Maanen et al., 1998; Vermeer et al., 1998). However, there was no relationship between nitrate levels in drinking water and urinary excretion of nitrosamines in a Canadian population exposed to nitrate levels below 10 mg/L as nitrate-nitrogen (Levallois et al., 2000).
Vermeer et al. (1999) evaluated the effects of ascorbic acid and green tea on urinary excretion of carcinogenic NDMA and N-piperazine in 25 healthy female volunteers consuming a fish meal rich in amines as nitrosatable precursors in combination with nitrate-containing drinking water at 3.65 mg NO3¯/kg bw/day (0.84 mg/kg bw/day as NO3-N) for 7 consecutive days. Intake of 250 mg and 1000 mg ascorbic acid per day resulted in a significant decrease in urinary NDMA excretion during the last 4-7 days (P = 0.0001), but not during days 1-3 of the experiment. Also, consumption of four cups of green tea per day (equivalent to 2 g per day of tea) significantly decreased NDMA excretion during days 4-7 (P = 0.0035), but not during days 1-3. Surprisingly, consumption of eight cups of green tea per day (equivalent to 4 g per day of tea) significantly increased NDMA excretion during days 4-7 (P = 0.0001), but again not during days 1-3.
9.4 Mode of action
9.4.1 Non-cancer
9.4.1.1 Methaemoglobinaemia
The key events in the mode of action by which nitrate and nitrite are reported to cause methaemoglobinaemia in humans and experimental animals are as follows:
- Reduction of nitrate to nitrite: As described in Section 8.3, microorganisms in saliva and the gastrointestinal tract reduce exogenous nitrate to nitrite in humans and in most laboratory animals, except in rats, where this process is deficient. In addition, changes to a more neutral intestinal pH promote the growth of microorganisms and hence the reduction of nitrate to nitrite. In infants, the variable stomach pH (2-5) may permit the growth of nitrate-reducing bacteria (Zeman et al., 2002) and therefore increase the infant's risk of forming methaemoglobin.
- Oxidation of haemoglobin to methaemoglobin: The essential action in the formation of methaemoglobin is the oxidation of the ferrous ion of haemoglobin to the ferric ion, which can occur by the direct action of oxidants, the action of hydrogen donors in the presence of oxygen or auto-oxidation. In the presence of nitrite, oxidation is direct (Gupta et al., 1999). Methaemoglobin formation was evident in both humans (> 100 mg NO3¯/L; Section 9.1.1) and experimental animals (250 mg NO2¯/L; Section 9.2.2.1). Originally, it was reported that a higher proportion of the haemoglobin in infants converts to methaemoglobin more readily, contributing to their increased susceptibility. However, foetal haemoglobin has the same oxidation/reduction potential and auto-oxidation rate as adult haemoglobin, and thus this is not likely to contribute to increased infant susceptibility (Avery, 1999).
- Deficient methaemoglobin reduction: Normally, the methaemoglobin (Hb3+) that forms can be reduced to haemoglobin (Hb2+) by the following reaction: Hb3+ + reduced cytochrome b5 → Hb2+ + oxidized cytochrome b5, where reduced cytochrome b5 is generated by NADH-cytochrome b5-methaemoglobin reductase (Gupta et al., 1999). A comparison of NADPH-methaemoglobin reductase activities between rats and humans revealed that the activity is 10 times higher in blood from rat foetuses than in pregnant rat or human cord blood; the activity was 1.5 times higher in blood from pregnant women than in human cord blood (NAS, 1981). In addition, the development of the infant NADH-methaemoglobin reductase system is incomplete; infants begin making adult levels of this enzyme at around 6 months of age (Avery, 1999; Gupta et al., 1999; Knobeloch et al., 2000; Sanchez-Echaniz et al., 2001). Thus, relatively lower amounts and activity of NADPH-methaemoglobin reductase in human neonates likely contribute to their susceptibility to methaemoglobinaemia.
- Increased percentage of haemoglobin as methaemoglobin in blood: Under normal conditions, less than 2% of haemoglobin circulates in the blood as methaemoglobin (Fan et al., 1987). As methaemoglobin cannot bind oxygen, symptoms of methaemoglobinaemia appear in both humans (see Section 9.1) and experimental animals (Section 9.2) as the percentage of methaemoglobin increases (> 10% in the blood). Clinical methaemoglobinaemia is defined as greater than 2% methaemoglobin in blood. However, clinical symptoms are generally not present until the methaemoglobin level in blood reaches 3-15% of total haemoglobin (Avery, 1999; Zeman et al., 2002). Based on the proportion of methaemoglobin, alterations of various systems have been reported: at 10-20%, central cyanosis of limbs/trunk (blueness of skin); at 20-45%, central nervous system depression (headache, dizziness, fatigue and lethargy), dyspnoea and cyanosis; at 45-55%, coma, arrhythmias, shock, convulsions, cyanosis, dyspnoea, disorientation and tissue hypoxia; and above 60%, high risk of mortality (Knobeloch et al., 2000; Fewtrell, 2004).
- Production of nitric oxide: As an alternative mode of action, some studies report that endogenous formation of nitrite resulting from overproduction of nitric oxide by tissues inflamed as a result of bacterial infection may be a significant cause of infant methaemoglobinaemia, greater than or instead of that caused by ingested nitrate (Hegesh and Shiloah, 1982; Avery, 1999). Infants suffering from diarrhoea and methaemoglobinaemia (without exposure to nitrate-contaminated water) excrete up to 10 times more nitrate daily than they ingest through food and water (Hegesh and Shiloah, 1982; Avery, 1999). The proposed mode of action is that nitric oxide is produced by several tissues in response to bacterial infection and inflammation. Nitric oxide metabolism produces nitrite and increased expression of inducible nitric oxide synthase messenger RNA accompanied by stool and plasma nitrate/nitrite levels. This nitrite production may be sufficient to overwhelm the underdeveloped methaemoglobin-reducing system of infants, which results in elevated levels of methaemoglobin and subsequently clinical signs of methaemoglobinaemia at higher methaemoglobin levels. Methaemoglobinaemia is apparently a well-known side effect of nitric oxide therapy for acute respiratory distress syndrome and persistent pulmonary hypertension in newborns (Avery, 1999).
9.4.1.2 Thyroid effects
Disruption of thyroid hormones can lead to numerous adverse outcomes, including thyroid tumours and birth defects. However, humans do not get thyroid carcinomas as a result of decreased T3 and T4 levels because they are less susceptible to the effects of TSH on thyroid cell proliferation than are rodents (Crofton, 2008). Hence, we focus on the key events in the mode of action by which nitrate and nitrite are reported to cause thyroid effects and subsequently birth defects in humans and experimental animals. The key events are as follows:
- Inhibition of iodine uptake to thyroid: Ingested nitrate inhibits thyroid uptake of iodide circulating in the blood by binding to NIS on the surface of thyroid follicular cells (Greer et al., 2002). Organification is a complex, enzyme-dependent process whereby iodide is oxidized and bound to tyrosyl residues within thyroglobulin, ultimately forming the thyroid hormones T3 and T4. If sufficient inhibition of iodide uptake occurs, formation of thyroid hormones is depressed. The NIS transports iodide across membranes of some non-thyroidal tissues as well; for example, in the mammary gland during lactation, iodide can be transferred from the mother to the infant (Kirk, 2006). The kinetics for nitrate/nitrite inhibition of iodide uptake in humans and experimental animals have not been reported.
Other drinking water contaminants are also iodine uptake inhibitors. The relative potency of perchlorate to inhibit radioactive iodide uptake at the NIS in humans was found to be 15, 30 and 240 times that of thiocyanate, iodide, and nitrate, respectively on a molar concentration basis (Tonacchera et al., 2004). Importantly, Tonacchera et al., indicated a simple competitive interaction as the mode of action for these ions, rather than synergism or antagonism. Nitrite is not transported by the NIS (Eskandari et al., 1997) and therefore not relevant to the mode of action for thyroid toxicity. Based on these relative molar potencies, De Groef et al. (2006) calculated that nitrate and thiocyanate, acquired through drinking water or food, account for a much larger proportion of iodine uptake inhibition than perchlorate. However, only one study was available (Hunault et al., 2007) that reported thyroidal iodide uptake after nitrate exposure, and it reported no significant effects on thyroidal uptake in 10 human volunteers receiving sodium nitrate at a dose of 15 mg/kg bw (equivalent to 10.9 mg nitrate/kg bw) in 200 mL of drinking water for 28 days.
- Serum T3 and T4 changes: Depression of thyroid hormone formation, secondary to inhibition of thyroidal iodide uptake, results in decreased thyroid hormone secretion into the circulation. Lower concentrations of thyroid hormones in the serum can activate the feedback mechanism to the HPT, resulting in increased TSH secretion, which in turn leads to signalling the thyroid to produce more thyroid hormones. However, with inhibition of iodide uptake, the production of thyroid hormones may be insufficient. It is not known to what levels thyroid hormone synthesis must be reduced before serum thyroid hormone levels are impacted to the extent that adverse effects occur in either humans or experimental animals. What is known is that given the same dose of the antithyroid compound propylthiouracil, rats exhibit a significant reduction in circulating thyroid hormone levels sooner than humans; the serum half-life of T4 is 7-10 days in humans (Vulsma et al., 1989; Greer et al., 2002), but only a day in rats (Zoeller and Crofton, 2005). In addition, the adult human thyroid stores a large supply of thyroid hormones, maybe several months' worth (Greer et al., 2002). The human neonate has a serum half-life of T4 of approximately 3 days (Vulsma et al., 1989), and intrathyroidal stores of T4 are estimated to be less than 1 day's worth (reported in Zoeller and Crofton, 2005). The shorter thyroid hormone t1/2 in neonates and rats implies that they must produce much more TH, thus requiring more iodide uptake. Therefore, neonates and rats are more sensitive to uptake inhibitors than adult humans. In addition, rats have limited conversion of nitrate to nitrite and thus have more nitrate available to inhibit the NIS. Nevertheless, the ultimate adverse effect will be similar for humans and rats.
Although TSH is a well-accepted biomarker for hypothyroidism, a number of xenobiotics alter circulating thyroid hormone levels, but not TSH. The most commonly used biomarker of effect for exposure to thyroid-disrupting chemicals is serum total T4 concentration (De Vito et al., 1999; Zoeller et al., 2007). Thyroid hormones are evolutionarily conserved molecules present in all vertebrates (Heyland and Morez, 2005). However, species differences in serum total T4 levels and consequent adverse effects have not been reported.
In humans, very few studies have reported the measurement of thyroid hormone levels in plasma after nitrate exposure. The most relevant study reported a 4% increase in TSH concentrations and no changes in total T4 or free T3 levels in 324 children exposed to nitrate at 51-274 mg/L compared with 168 children exposed to nitrate in their drinking water at concentrations below 2 mg/L (Tajtakova et al., 2006; Radikova et al., 2008). In addition, Hunault et al. (2007) reported no significant effects on thyroid hormone plasma concentrations in 10 human volunteers receiving sodium nitrate in 200 mL of drinking water at a dose of 15 mg/kg bw/day (equivalent to 10.9 mg NO3¯/kg bw/day) for 28 days. However, as humans can store several months' worth of thyroid hormones, the Hunault et al. (2007) study may not be of sufficient duration to detect changes in thyroid hormone levels. In rats, exposure to potassium nitrate at 150 mg/L (equivalent to 92.1 mg NO3¯/L) in drinking water for 5 months reduced plasma T3 levels by 34% and T4 levels by 12% (reduction was dose dependent; refer to Section 9.2.3).
The set-point around which thyroid hormones are regulated is very individualistic, and differences in set-point are largely determined by genetics (Anderson et al., 2002, 2003; Hansen et al., 2004). The variance in serum T3, T4 and TSH levels in individuals is about half the range of population variance (Anderson et al., 2002). Studies have identified an elevated risk of cardiovascular disease in patients with elevated TSH levels and normal T4 levels; conversely studies have found thyroid-disrupting chemicals associated with decreases in T4 levels but no elevations in TSH levels (Miller et al., 2009). Therefore, a value within standard "normals" is not necessarily normal for the individual, and an elevated TSH level (which responds logarithmically to minor changes in T3 and T4 levels) should be interpreted as indicating that serum T3 and T4 levels are not normal for the individual (Anderson et al., 2002). Thus, identifying additional sensitive subpopulations and associations between thyroid disruptors and adverse outcomes is hindered by the ability to recognize risk in individuals who may have T4 levels in the normal population range but below their own normal individual range. Therefore, any exposure that would result in altered thyroid hormone homeostasis in a population should be evaluated further (Miller et al., 2009).
- Tissue T3 changes: Peripheral tissues contain deiodinases, which convert T4 to T3. The biological actions of thyroid hormones are driven by T3 binding to nuclear thyroid receptors, which then act as signal transducers and transcription factors to exert their diverse biological effects. Thyroid hormones regulate the transcription of many proteins and control neuronal migration, differentiation and apoptotic modelling (Kirk, 2006). The mechanisms by which thyroid hormones function through nuclear receptors to alter gene expression are highly conserved across species (studies reported in Miller et al., 2009).
Chronic stimulation of the thyroid gland by TSH can lead to proliferative changes in follicular cells, ultimately leading to hypertrophy, hyperplasia and hypothyroidism (Capen, 1997; Tonacchera et al., 2004; De Groef et al., 2006; Vanderpas, 2006). Adult experimental animals and humans are relatively resistant to adverse outcomes of impaired thyroid hormone production, as the HPT axis can compensate to a considerable extent for reduced thyroid hormone production. If nitrate/nitrite exposure is sufficiently high to overcome this compensation, persists for long enough to exhaust thyroid gland stores of thyroid hormone or is combined with exposure to other thyroid disrupting chemicals, combined with dietary iodide deficiencies, hypothyroidism or enlargement of thyroid will likely occur. In addition, pregnancy causes increased demand on the thyroid gland, and hypothyroidism is twice as common during pregnancy (Aoki et al., 2007).
In humans, exposure to nitrate in drinking water at concentrations at and above 50 mg/L resulted in increased thyroid volume and thyroperoxidase levels as well as increased incidence of goitre (refer to Section 9.1.2.1). In rats, exposure to sodium nitrate concentrations of 50 mg/L (equivalent to 36.45 mg NO3¯/L) and above for 30 weeks increased the weight of the thyroid (refer to Section 9.2.3).
- Altered development and birth defects: Moderate or even transient thyroid hormone insufficiency can cause specific developmental defects in rodents and humans. For example, small differences in point estimates of maternal T4 levels during the early foetal period are associated with adverse outcomes (e.g., reduced intelligence quotient scores), even though these deficits do not constitute clinical hypothyroidism (many references reported in Miller et al., 2009). Importantly, effects on the developing organism result from decreases in tissue levels of T4 or T3 independently of TSH level (Crofton, 2008). In addition to the degree of thyroid hormone insufficiency, the developmental timing of thyroid hormone insufficiency and the duration of the perturbation are important (Kirk, 2006; Miller et al., 2009).
Thyroid hormones are essential to neurological development, skeletal growth and normal function of the pulmonary system, metabolism, kidney, cardiovascular system and serum lipids (Kirk, 2006; De Escobar et al., 2008; Woodruff et al., 2008; Miller et al., 2009). Mild hypothyroidism leads to a general malaise, inertia, and reduced heart rate and body heat-producing capability, among other symptoms. In contrast, even transient disruption of thyroid hormone synthesis can induce persistent adverse effects on cognitive and sensory capabilities if it occurs during critically sensitive windows of foetal and postnatal development (Howdeshell, 2002; Kirk, 2006). Molecular signalling pathways by which thyroid hormones affect development, energy balance and metabolism are conserved in all taxonomic groups (Miller et al., 2009).
Formal dose-response studies have not been conducted to determine to what extent plasma thyroid hormone levels must decrease before brain development is impaired in either experimental animals or humans. However, there is a large body of literature correlating reductions in circulating thyroid hormone levels with cognitive deficits in humans, either in the offspring (in the absence of overt hypothyroidism in the child at birth or later) of females with decreased thyroid hormone levels or in adults who were diagnosed with congenital hypothyroidism as children (many references cited in Zoeller and Crofton, 2005).
Evidence of developmental and birth defects has been reported for nitrate concentrations above 45 mg/L in drinking water in humans (refer to Section 9.1.4), and a sodium nitrate concentration of 2000 mg/L (equivalent to 1458 mg NO3¯/L) in drinking water in animals from gestational day 13 to birth resulted in alteration of neurological parameters (refer to Section 9.2.7) however, further studies of the role of thyroid hormones and the validity of these endpoints is needed before strong conclusions can be made.
Cross-species extrapolation is hindered by lack of knowledge of the differences in the mode of action. Relevance analysis for other thyroid-disrupting chemicals (polychlorinated biphenyls, propylthiouracil and perchlorate) suggests that concordance between rodent and human modes of action depends on the life stage of exposure; there is a good degree of concordance for developmental neurotoxicity using altered thyroid hormone concentrations as a key event (Zoeller and Crofton, 2005). To increase confidence in the relevance of this mode of action, the following data gaps must be resolved: comparative data between serum and brain tissue levels of thyroid hormones, comparative studies on the effects of moderate and mild hypothyroxinaemia on nervous system development and clear characterization of the dose-response relationship between degree of thyroid hormone concentration change and adverse effects (Crofton, 2008).
High quality studies examining the effects of nitrate on thyroid function in vulnerable populations are clearly needed. Such studies ideally would be carried out in iodine-sufficient regions, would account for exposures to other NIS inhibitors, would measure both thyroid function and thyroid peroxidase antibody status and would use individual biomarkers for nitrate exposure (urine or saliva) instead of employing an ecologic study design.
9.4.2 Cancer effects
There is evidence that the possible carcinogenic effects of ingested nitrate/nitrite are directly dependent upon the endogenous formation of the genotoxic/carcinogenic NOCs, which in the case of nitrate must be preceded by its reduction to nitrite. The endogenous formation of NOCs is also called endogenous nitrosation. In fact, the nitrosating agents that arise from nitrite readily react with nitrosatable compounds, especially secondary amines and alkyl amides, to generate NOCs. Many NOCs are carcinogenic (IARC, 2010).
In general, the process by which ingested nitrate is involved in cancer can be summarized in four main key events, namely: 1) reduction of nitrate to nitrite; 2) endogenous nitrosation (discussed in details in section 9.3); 3) conversion of NOCs to highly reactive (alkylating) species and 4) alkylation of intracellular macromolecules (DNA, RNA and proteins), which is responsible for subsequent tumour formation. These key events are described below.
1. Reduction of nitrate to nitrite
Nitrate balance studies and analysis of body fluids demonstrated that, in the human body, the oral cavity is the main site of nitrate reduction to nitrite (Gangolli et al., 1994). Thus, there is strong evidence that in healthy humans, about 25% of ingested nitrate (including that from drinking water) is actively secreted and concentrated in the salivary glands by an anion transport system, of which about 20% is reduced to nitrite by the oral microflora (Spiegelhalder et al., 1976; Tannenbaum et al., 1976). Ultimately, about 5% (range 4-7% of the overall dose) of ingested nitrate is reduced to nitrite in saliva (Walker, 1990; Gangolli et al., 1994). As most saliva is swallowed, salivary nitrite constitutes the main source of gastric nitrite (Eisenbrand et al., 1980; Mirvish et al., 2000; McColl, 2007). It has been estimated that the majority of nitrite in the normal acidic stomach arises from the oral reduction of ingested nitrate (about 80%), as compared to that in nitrite-preserved meat and fish and other foods (Mirvish, 1983; Knight et al., 1987; Bos et al., 1988); for these reasons, gastric nitrite is considered to be the major source of nitrite exposure for humans (Eisenbrand et al., 1980; Forman et al., 1985).
There is evidence that the reduction of nitrate to nitrite is modulated by several factors, such as the extent of bacterial colonization of the mouth; the age of individuals; and the enterosalivary nitrate circulation-related factors, including salivary flow rate, redox potential in the mouth (optimal pH about 8) and the stomach, pH values in the stomach, absorption of nitrate in the small intestine, endogenous synthesis in the tissues and active transport from blood to the salivary gland (Eisenbrand et al., 1980; Duncan et al., 1995, 1997). All these factors contribute to a great variability in the reduction of nitrate to nitrite in individuals.
In healthy people, reduction of nitrate to nitrite is due to the action of different strains of nitroreductase-containing bacteria, and this reduction is concentrated at the rear of the dorsal region of the tongue. Doel et al. (2005) identified a total of 132 nitrate reductase-positive colony isolates from the oral cavity, including the saliva, from 10 subjects (4 females and 6 males) aged 29 years on average. According to Suzuki et al. (2005) and McColl (2007), these bacteria convert 10-30% of salivary nitrate to nitrite.
The microbial nitrate reductase activity in the oral cavity has been quantitatively characterized in several studies in vitro (Shapiro et al., 1991; Xu et al., 2001) and in vivo (Spiegelhalder et al., 1976; Bartholomew and Hill, 1984; Granli et al., 1989; Van Maanen et al., 1994). Indeed, marked interindividual and diurnal variations in the salivary nitrate to nitrite conversion were observed in vitro (Walker, 1990) and in vivo ((Bos et al., 1988; Xu et al., 2001; Doel et al., 2005). These interindividual variations seem to be particularly influenced by age. Thus, there is evidence that in healthy people, nitrite levels increase with age and are particularly high in young children and seniors (Eisenbrand et al., 1980; Forman et al., 1988; Siddiqi et al., 1992; Mirvish et al., 2000).
These interindividual variations are in addition to smaller intraindividual variations (Bos et al., 1988; Walker, 1990; Mirvish et al., 2000; Xu et al., 2001; Doel et al., 2005). In addition to the high nitrite levels in seniors, Mirvish et al. (2000) found that saliva nitrite levels rose at night, but that saliva nitrate and nitrite levels varied little from day to day.
In general, these increases in nitrite levels appeared to reflect the relative increase in the oral microflora. Indeed, Kang et al. (2006) reported that saliva of a young child and a senior showed higher bacterial diversity than that of young adults, and it was reported that bacteria which colonise the dorsum of the tongue convert approximately 30% of the nitrate to nitrite (Bos et al., 1988; Mirvish et al., 2000; Xu et al., 2001; Suzuki et al., 2005; McColl, 2007) reported maximum rates of nitrate reduction up to 30%.
Moreover, the nitrate reductase activity in the oral cavity appears to be influenced by seasonal conditions (i.e., temperature). Xu et al. (2001) found that the average nitrate reductase activity measured in June for 10 subjects (3.43 ± 1.75 μg NO3-N per person per minute) was significantly higher than that measured in November for 10 other subjects (1.54 ± 0.46 μg NO3-N per person per minute). The proportions of nitrite to total nitrate/nitrite in populations in Germany were 17.4%, as compared to 25.2% in people in Egypt where the temperature is much higher (Siddiqi et al., 1992).
2. Endogenous nitrosation
The possible process by which ingested nitrate and nitrite might be involved in cancer induction could be explained by the mechanism of endogenous nitrosation. Details on this process have been given in Section 9.3.
3. Conversion of N-nitroso compounds to alkylating species
There is ample evidence from studies in experimental animals that NOCs are carcinogenic because they generate potent electrophilic alkylating agents in the body, which are formed either by spontaneous decomposition, in the case of nitrosamides and related compounds, or by metabolic activation, in the case of nitrosamines (Archer, 1989):
NOCs → (biotransformation) → R-(CH3)n
Nitrosamides and related compounds (nitrosoureas, nitrosoguanidines, nitrosourethanes, nitrosocyanamides) (direct acting) are chemically reactive and very unstable in aqueous solvents, basic and neutral media, and even in physiological pH. In acid, they decompose to give rise to important quantities of nitrites (Mirvish, 1975b). Besides acid-based decomposition, there is also a non-enzymatic decomposition to reactive electrophilic alkylating intermediates (Montesano, 1976; Archer, 1989; Mirvish, 1991; Gangolli et al., 1994; Vermeer and Van Maanen, 2001). This decomposition has been reported to occur by base-catalysed hydrolysis and varies with pH and the structure of the acyl and alkyl residues (Montesano, 1976). The listed intermediates are highly unstable, with physiological half-lives for the most stable of them, the α-hydroxynitrosamines, of 1-10 seconds. Hence, nitrosamides are probably activated mostly in the organs where tumours develop (Mirvish, 1995) and are therefore known as direct-acting mutagens/carcinogens (Walker, 1990; Mirvish, 1991; Gangolli et al., 1994; Vermeer and Van Maanen, 2001).
In contrast, nitrosamines are chemically stable (even in physiological conditions), slowly decompose in light or in acid aqueous solutions (Brown, 1999) and are usually volatile, unless they possess other functional groups (Mirvish, 1995). They require metabolic activation in vivo in order to exert mutagenicity and carcinogenic effects. They generally persist in the body for longer periods than do the chemically reactive nitrosamides (Montesano, 1976; Archer, 1989; Mirvish, 1991; Gangolli et al., 1994). This difference explains why nitrosamides tend to induce tumours at or near the site of their application and organs with rapid turnover, whereas nitrosamines produce tumours in tissues remote from the site of administration (Montesano, 1976; Archer, 1989; Vermeer and Van Maanen, 2001). Another particularity of nitrosamines is the striking organotropism (specific to organs) of their effects, no matter the route of their administration (Mirvish, 1995; Vermeer and Van Maanen, 2001; Dietrich et al., 2005).
Early experiments (Druckrey et al., 1967; Magee and Barnes, 1967) on the pharmacokinetics and in vivo and in vitro metabolism of nitrosamines suggested two pathways for their biotransformation: α-hydroxylation and denitrosation (Archer, 1989). However, effects of nitrosamines are attributed to the α-hydroxylation pathway; the toxicological denitrosation was considered to make little contribution to the overall toxic effects of these compounds (IPCS, 2002).
4. DNA adduct formation
The reactive electrophilic alkylating species produced by chemical decomposition of nitrosamides and related compounds or by metabolic activation of nitrosamines subsequently react with cellular components such as DNA, RNA and proteins (Montesano, 1976; Archer, 1989; Crespi and Ramazzotti, 1991). Attention has focused on reactions with DNA, because this is generally considered to be the critical cellular target for carcinogens during tumour initiation (Montesano, 1976; Archer, 1989); thus, principal consideration is given here to interactions with this macromolecule.
The reactive species (i.e., alkyldiazonium cations) alkylate DNA bases, especially at the N7 (66.8%) and O6 (6.1%) positions of guanine and the O4 (trace) position of thymine (the numbers in parentheses are the relative proportions of the products as a percentage of the total products for methylation of DNA in rat liver by NDMA) (Archer, 1989; Mirvish, 1995). Moreover, the O6 position was shown to be of major importance in both the initiation of mutations and the cytotoxicity actions of alkylating agents, as it is the position involved in base pairing (Sedgwick, 1997).
Other sites of DNA alkylation that have been proposed as potentially miscoding are N3-alkyladenine, N3-alkylguanine and O4-alkylthymine (Montesano, 1976). The extent of alkylation at the various sites in DNA is dependent on the alkylating species: the methylcarbonium cations derived from NOCs are highly reactive and less selective and thus produce a wide spectrum of products (Montesano, 1976; Brown, 1999).
10.0 Classification and assessment
There is no clear evidence of carcinogenicity from nitrate or nitrite per se in humans. Consequently, sections 10.1 and 10.2 will consider non-cancer health effects from nitrate and nitrite, respectively. However, a cancer risk may exist under conditions of endogenous nitrosation of ingested nitrate and/or nitrite, which is assessed in section 10.3.
10.1 Nitrate
Methaemoglobinemia has long been considered to be the end-point of concern for humans from exposure to nitrate in drinking water. Scientific studies show cases of methaemoglobinemia occurring in bottle-fed infants, which are the vulnerable population for these effects. Recent evidence from animal and human studies suggests that effects on thyroid gland function are also an end-point of concern. Although numerous epidemiological studies have investigated the relationship between exposure to nitrate in drinking water and cancer occurrence, the weight of evidence does not clearly support an association between cancer and exposure to nitrates per se. This is consistent with the conclusions established by IARC (2010) that there is inadequate evidence in humans for the carcinogenicity of nitrate per se from exposure in food or in drinking water. However, current science suggests an association between cancer and exposure to nitrates in drinking water when conditions result in nitrosation within the human body (see section 10.3).
Scientific studies published since the 1950s show methaemoglobinemia as the end-point of concern for nitrate in humans. These studies found infantile methaemoglobinemia associated with the ingestion of nitrate in drinking water at levels exceeding 100 mg NO3¯/L (Walton et al., 1951; Shuval and Gruener, 1972; Fan and Steinberg, 1996; Zeeman et al., 2002). A review of the science (Fan and Steinberg, 1996) reported no increased incidence of infantile methaemoglobinemia from exposure to nitrate in drinking water at levels below 45 mg/L. However, most studies failed to account for confounding factors such as bacterial contamination of the drinking water. Such contamination may cause intestinal inflammation in infants, which increases endogenous conversion of nitrate to nitrite and leads to methaemoglobinemia (Avery, 1999).
Current evidence also suggests that exposure to nitrate in drinking water may alter human thyroid gland function. While studies found that exposure to nitrate concentrations greater than 50 mg/L are weakly associated with altered thyroid function, the evidence is limited, conflicting and based on studies with important methodological limitations (Van Maanen et al., 1994; Zaki et al., 2004; Eskiocak et al., 2005; Tajtakova et al., 2006; Gatseva and Argirova, 2008a; 2008b; Radikova et al., 2008). Mode of action data suggests that pregnant women and infants are the sensitive population due primarily to the importance of adequate thyroid hormone for normal neurodevelopment in the fetus and infant, but also due to increased thyroidal turnover in foetal and early life. However, the findings from the only study that examined the effects of drinking water nitrate on thyroid function in pregnant women were inconclusive (Gatseva and Argirova, 2008b). Decreased thyroid function has only been observed in school-aged children exposed to 50-264 mg/L of nitrate in drinking water in studies conducted in Bulgaria and Slovakia. Studies have seen an effect in school-age children, but no study has examined nitrate's effect on infant thyroid function. Although infants' thyroidal iodine turnover is lower than that of school-aged children, their average drinking water consumption is lower. The lack of appropriate scientific data does not allow for the calculation of a conversion factor from school-aged children to infants. However, levels protective for school-aged children are expected to be similarly protective for infants.
While no single key study is appropriate to establish a guideline for nitrate in drinking water, the current weight of evidence does not show adverse health effects (either methaemoglobinemia or thyroid effects) occurring below 45 mg/L for nitrate in drinking water in the populations studied. Infants are identified as the most sensitive populations for these health effects. Based on this evidence, a health-based value (HBV) of 45 mg/L is established for nitrate in drinking water.
10.2 Nitrite
Scientific studies published since the 1950s consistently show methaemoglobinemia in infants as the end-point of concern for nitrate or nitrite in humans. Based on its mode of action, nitrite is the toxic moiety of concern. Nitrite, either directly from drinking water or formed endogenously from nitrate exposure, binds haemoglobin to cause methaemoglobinemia. Hence, studies of nitrate exposure are important for assessing nitrite-induced methaemoglobinemia. The original study by Walton et al. (1951) found acute cases of clinical infantile methaemoglobinemia associated with the ingestion of nitrate in drinking water at levels exceeding 100 mg nitrate/L. A review of the science found no incidences of methaemoglobinemia at levels less than 45 mg/L for nitrate in drinking water for bottle-fed infants less than 6 months of age (Fan and Steinberg, 1996). The majority of studies that were published since Walton et al. (1951) looking at associations between infantile methaemoglobinemia and ingestion of nitrate in drinking water similarly report levels of nitrate exceeding 100 mg/L (Shuval and Gruener, 1972; Fan and Steinberg, 1996; Zeeman et al., 2002).
However, most studies of methaemoglobinemia failed to account for such confounding factors as bacterial contamination of the drinking water, which may cause intestinal inflammation in infants and increase endogenous conversion of nitrate to nitrite and subsequently methaemoglobinemia (Avery, 1999). Based on the above human data and on the mode of action for nitrite's toxicity, infants are the most sensitive subpopulation. Infants are more susceptible to methaemoglobinemia since 1) their stomach pH is less acidic, promoting the growth of bacteria that convert nitrate to nitrite, which binds to haemoglobin to cause methaemoglobinemia, and 2) the amount and activity of the enzyme which reduces methaemoglobin is deficient in infants until approximately 6 months of age. Thus a MAC for nitrite-induced infant effects will be protective of the general population.
There is no definitive evidence of the direct carcinogenicity of nitrite per se in experimental animals by different routes of exposure (WHO, 2007; IARC, 2010). In most of the studies in which mice or rats were exposed to sodium nitrite alone by gavage, in the diet, or in drinking water, the incidences of tumours were usually not significantly higher than controls. Current evidence indicates that nitrite may not act directly as a carcinogen in animals (WHO, 2007; IARC, 2010). Because of its mutagenicity in microbial systems, its possible role in the induction of stomach and oesophageal cancer in humans and its role in the induction of cancer in experimental animals (in the presence of amino compounds), nitrite could be considered to be a promoter of cancer. However, current science suggests an association between cancer and exposure to nitrites in drinking water when conditions result in nitrosation within the human body (see section 10.3).
The health-based value for nitrite-induced infantile methaemoglobinemia is derived based on 1) no incidences of methaemoglobinemia at levels less than 45 mg/L for nitrate in drinking water for bottle-fed infants less than 6 months of age, 2) converting 45 mg/L nitrate to corresponding molar concentration for nitrite, 3) multiplying by a factor of 0.1 to account for the estimated conversion rate of nitrate to nitrite in infants where nitrite is formed endogenously from nitrate at a rate of 5 to 10% and 4) multiplying by a source allocation factor for drinking water of 100% or 1, since a bottle-fed infants' primary exposure to nitrite is through consumption of formula reconstituted with nitrate or nitrite -containing drinking water. Since the HBV is based on the most sensitive subgroup of the population (bottle-fed infants less than six months of age), application of an uncertainty factor is not deemed necessary. The HBV for nitrite is calculated as follows:
Figure 1. The equation used for calculating the health based value for nitrite
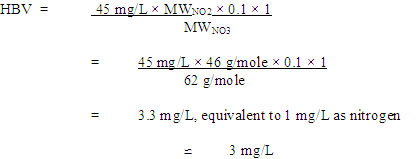
Figure 1 - Text Description
The HBV of 3 mg/L as NO2 (or 1 mg/L as NO2-N) will be protective against endogenous and exogenous formation of nitrite-induced methaemoglobinemia in bottle-fed infants and the general population.
10.3 Cancer risk related to endogenous nitrosation
Because of the biological plausibility of endogenous nitrosation of ingested nitrate and nitrite, there is a possibility that a cancer risk may exist. IARC (2010) has classified "ingested nitrate or nitrite under conditions that result in endogenous nitrosation" as probably carcinogenic to humans (Group 2A).
There is clear evidence of the carcinogenicity of the mixture of nitrite plus nitrosatable compounds in experimental animals via several routes of exposure, including ingestion of drinking water. When extremely high doses of both nitrite and nitrosatable precursors (amines or amides) were simultaneously administered orally, increased tumour incidence was seen (WHO, 2007). These types of tumours were usually characteristic of the preformed NOCs and therefore presumed to originate from the corresponding NOC endogenously formed.
Although there are several cancer bioassays in rodents available, it was difficult to derive a conclusion, because most of the studies used large doses of nitrosation precursors (nitrite and nitrosatable precursors), and different precursors at different concentrations in different species. Moreover, the designs of most of the studies were usually limited (e.g., group sizes were not as large as recommended by standard bioassays; maximal tolerated doses were not determined for the nitrosatable precursors or their combinations with nitrite; single dose levels used; limited histopathological examination performed).
There is ample evidence that the products of the endogenous nitrosation of nitrosatable compounds by nitrite are genotoxic both in vitro and in vivo (Brambilla and Martelli, 2007). Concurrent administration of nitrite and nitrosatable compounds to rodents induced genetic modifications, such as reduction of DNA synthesis and methylation of nucleic acids. Furthermore, the results of studies performed in the last four decades clearly indicate that the products formed by endogenous drug nitrosation may represent a genotoxic/carcinogenic risk to humans (Brambilla, 1985; Brambilla and Martelli, 2007).
10.3.1 Quantitative risk assessment
An important step in assessing the importance of endogenous nitrosation in the aetiology of cancer is the estimation of rates of formation of NOCs in the human stomach (Licht and Deen, 1988). The estimation of the risk of cancer arising from ingested nitrate/nitrite through the endogenous nitrosation process requires the quantification of the endogenous formation of NOCs, which in humans must be preceded by the conversion of nitrate into nitrite. Although there have been several bioassays of exposure to nitrite plus nitrosatable compounds in experimental animals, there are no reliable dose-response studies in which tumour induction has been observed to increase with the doses of nitrite and nitrosatable compounds administered concurrently. Nevertheless, those studies are all supportive of a positive association between exposure to nitrite plus amino compounds and cancer induction.
Several experiments in humans attempted to characterize endogenous nitrosation, but the accuracy of its quantification is still a matter of debate. However, the literature is consistent on the fact that cancer risk associated with endogenous nitrosamine formation is a function of four variables: 1) the amount of nitrite ingested or formed from nitrate, 2) the amount of nitrosatable substances ingested, 3) the rate of in vivo nitrosation and 4) the carcinogenic potency of the resulting nitrosamine. Considering the above, modelling techniques that would permit analysis of the complex relationship between exogenous and endogenously formed nitrate, nitrite and NOCs are currently seen as the best way to characterize endogenous nitrosation (NAS, 1981).
To assess to what extent a Dutch population might be subject to cancer risks associated with the ingestion of dietary nitrate, Zeilmaker et al. (2010) used an indirect methodology to quantify the in vivo gastric exposure to NDMA arising from the consumption of a fish plus vegetable meal. They conducted a dynamic in vitro gastrointestinal model to simulate NDMA formation in the stomach. The experimental results were combined with statistical modelling of Dutch food consumption data, resulting in predicted exposures to endogenously formed NDMA in the population. The exposure data were analysed by a probabilistic exposure model, resulting in the distribution of long-term average exposures in the population. From this study, the 95th percentile of the long-term exposure distribution was around 4 ng/kg bw in young children 1 year of age and 0.4 ng/kg bw in adults. Furthermore, the long-term exposure distribution was combined with a dose-response analysis (linearized multistage model, using the benchmark dose approach) of the liver cancer incidence data from rat studies with NDMA (Peto et al., 1991a, 1991b) to obtain a cancer risk distribution for the human population. They assumed that a linear dose-response (LVM-E4 model) would be the worst case. The 95th percentile of that distribution was estimated as the extra risk for 5-year-old children and for adults. From this study, it was concluded that the combined consumption of fish and nitrate-rich vegetables appears to lead to marginal increases of additional cancer risk.
This study did not use drinking water as the route of exposure; instead, it used estimations of nitrate intake from vegetables. Although vegetables are the primary source of nitrate when levels of nitrate in the drinking water are low, many vegetables (such as those used in the study of Zeilmaker et al., 2010) contain vitamin C or other inhibitors of endogenous nitrosation. Nitrate from these sources may then result in less endogenous formation of NOCs compared with nitrate in drinking water (IARC, 2010).
Two large research projects were conducted in the province of Quebec to assess the impact of intensive agricultural activities on groundwater sources in some rural regions. One of the two projects, led by the Université Laval, focused on public drinking water sources. The other, a joint study by the Ministère du Développement durable, de l'Environnement et des Parcs, the Ministère de l'Agriculture, des Pêcheries et de l'Alimentation, the Ministère de la Santé et des Services sociaux and the Institut National de Santé Publique, assessed private wells. Both research projects included a quantitative probabilistic risk assessment, conducted to estimate human excess cancer risk associated with the consumption of drinking water contaminated by nitrates (Phaneuf et al., 2004; Chébékoué, 2008).
10.3.1.1 Estimation of endogenous formation of nitrosamines: exposure model
The research projects (Phaneuf, 2004; Chébékoué, 2008) used a simple mathematical model from a peer-reviewed publication (Shephard et al., 1987) to estimate the amounts of nitrosamines endogenously formed in the human stomach after intake of drinking water with known nitrate concentrations. The model calculates the daily dose of a specific amine formed in vivo as proportional to the amount of ingested amine precursors and the square of the gastric concentration of ingested nitrite based, as suggested by the kinetics work done to date, using the following equation:
Figure 2. The equation used for calculating the daily dose of a specific nitrosamine (DDnitros

Figure 2 - Text Description
The daily dose of a specific nitrosamine (DDnitros) is calculated by first multiplying the square of the gastric nitrite concentration ([NO2-]2) by the total daily intake of the specific corresponding amine (DIam), then the nitrosatability rate constant (Kam), then 3600 seconds (1 hour measured in seconds), and finally by the molecular weight of the specific nitrosamine (MWnitros). The obtained value is then divided by the average body weight of an adult (estimated as 70 kilograms) to achieve the daily dose of the nitrosamine.
where:
- DD nitros
- daily dose of a specific nitrosamine (mg/kg bw/day);
- [NO 2¯]
- gastric nitrite concentration (mol/L), assumed to correspond to the entire amount of salivary nitrite arising from the reduction of the total nitrite from contaminated drinking water by the oral flora. This variable is squared because two molecules of nitrite ion are required to form one molecule of the nitrosating species N 2O 3;
- DIam
- total daily intake of amine (mol/day);
- Kam
- nitrosatability rate constant ((mol/L) -2·s -1), an indication of the relative ease of nitrosation of a specific amine;
- 3600
- 1 hour, measured in seconds; estimation of time during which concentrations of amine and nitrite precursors would remain constant through the oesophageal/cardia region;
- MW nitros
- molecular weight of the specific nitrosamine (mg/mol);
- bw
- average body weight of an adult, estimated as 70 kg.
In order to take into account the variability within the studied population, the probability distributions of the input parameters (i.e., gastric nitrite concentration, total daily intake of specific amine) were estimated by Monte Carlo analysis. Thereafter, the distribution of the amount of individual nitrosamine formed in the stomach, as shown by DDnitros, was computed from outputs of Monte Carlo simulations.
Figure 3. Estimation of gastric nitrite concentrations

Figure 3 - Text Description
The gastric nitrite concentration ([NO2-]) is calculated by first multiplying the drinking water nitrate concentration ([NO3-]) by the transformation rate of nitrate into nitrite (TR), then the daily water consumption (WC). The obtained value is then divided by the stomach volume (Vs) to achieve the gastric nitrite concentration.
where:
- [NO 2¯]
- gastric nitrite concentration (mol/L);
- [NO 3¯]
- nitrate concentration (mol/L). The concentrations were converted from mg NO 3-N/L, using a conversion factor of 4.429 (1/0.226; 0.226 mg NO 3-N/L corresponds to 1 mg/L as NO 3¯) and the molecular weight of nitrate (62 g/mol);
- TR
- transformation rate of nitrate into nitrite, using the maximal rate of 0.3; The literature suggests that this rate increases with age in healthy people (Eisenbrand et al., 1980; Forman, 1989; Siddiqi et al., 1992), and maximum rates reaching approximately 30% have been reported (Bos et al. 1988; Mirvish, 2000; Xu et al., 2001; Suzuki et al., 2005; McColl, 2007);
- WC
- daily water consumption (L); and
- Vs
- stomach volume (L), estimated to be 0.5 L. The volume of the stomach is actually around 1 L. However the esophageal/cardia region, where salivary nitrites first encounter acidic gastric juice, is known to escape the buffering effect of food and remains highly acidic even after meals. As well, the active secretion of the inhibitory ascorbic acid occurs downstream in the antral region. Consequently, this region is the main site allowing maximal luminal nitrosation (McColl, 2007).
Estimation of daily intake of amines
Distribution was fitted to this parameter of the model using mean and standard deviation values from their computed statistics. The daily intake of a specific dietary secondary amine was estimated by multiplying the ingestion rate of each food item containing it by the corresponding amine concentration (Shephard et al., 1987) and summing across all foods as follows:
Figure 4 - Text Description
The daily intake of a specific amine (DIam) is calculated by first summing across all foods (i, j,... n) the products of the corresponding amine concentration in each food item ([am]f) times the ingestion rate of each food item containing it (IRf). The sum obtained is then divided by the molecular weight of the corresponding amine (MWam) to achieve the daily intake of the amine.
where:
- DI am
- total daily intake of a specific amine (mol/day);
- [am] f
- amine concentration in a specific food item (mg/kg);
- IR f
- estimated ingestion rate of specific food item (kg/day), based on Canadian food consumption data (Chébékoué, 2008) and U.S. food database (Phaneuf et al., 2004);
- MW am
- molecular weight of the amine (mg/mol); and
- i, j, …, n
- specific food item.
10.3.1.2 Estimation of cancer risk
A non-threshold model was applied for the estimations of cancer risks, as it represents the worst-case dose-response at low doses. The model assumes that health risk is linearly related to both the carcinogenic potency and the daily endogenous formation of each specific nitrosamine (Shephard et al., 1987). Considering the above, the overall cancer risk distribution was estimated by calculating the cancer risk at each individual Monte Carlo exposure result underlying the exposure distribution:
Figure 5. The equation used for calculating the excess cancer risk (ER)

Figure 5 - Text Description
The excess cancer risk associated with the exposure to a specific nitrosamine formed in the stomach is calculated by multiplying the daily dose of the nitrosamine (DDnitros, as per equation [1] above) by the human cancer potency factor (CPFhuman).
where:
- ER
- excess cancer risk associated with exposure to a daily dose of a specific nitrosamine formed in the stomach after the ingestion of drinking water;
- DD nitros
- daily dose of nitrosamine (mg/kg bw/day), as per equation [1] above; and
- CPF human
- human cancer potency factor ((dose unit/day) -1). It is the excess cancer risk associated with exposure to 1 dose unit of a given nitrosamine per day.
Chébékoué (2008) used the scaled human cancer potency (qhuman), estimated by OEHHA (2005) from the upper 95% confidence bound on the linear coefficient q1 (q1*), for cancer risk estimations, which represents the most conservative dose-response model fitted. Phaneuf et al. (2004) used the non-scaled Integrated Risk Information System (IRIS) q1*. Because of the scaling factor, the OEHHA values (BW3/4 was used for interspecies dose comparison) were approximately 2-fold lower than the IRIS values (BW2/3 was used), providing a more conservative estimate.
The 95% upper bounds of the human cancer risks calculated for NDMA, N-nitrosodiethylamine (NDEA) and N-nitrosopyrrolidine (Phaneuf et al., 2004; Chébékoué, 2008) were less than 10−5. Estimates of the excess cancer risks arising from endogenous exposure to these nitrosamines in a human population for 70 years calculated in both these studies indicate that the excess cancer risk is unlikely to be significant.
10.3.2 Example of calculation for NDMA
Although available data are not sufficient for nitrosamines to estimate risks from their endogenous formation, the recent health risk assessment conducted for NDMA (Health Canada, 2011) can be used to calculate a point estimate of the ER. The unit risks were calculated on the basis of the TD05 values (i.e., the dose level that causes a 5% increase in tumour incidence over background) that were derived by fitting a multistage model to the data of the carcinogenicity studies of NDMA in rat by Peto et al. (1991a, 1991b). TD05 values are the doses at which the excess risk of biliary cistadenomas and liver carcinomas was increased by 5% over background. An experimental animal to human allometric scaling factor of (0.35/70)¼ was applied to the resulting unit risks in order to take into account the interspecies differences in susceptibility to NDMA (Health Canada, 2011).
The concentration of nitrite in the stomach is calculated using equation [2] from section 10.3.1.1:
Figure 6. The equation used for calculating the concentration of nitrite in the stomach ([NO2¯]))

Figure 6 - Text Description
The daily intake of DMA (DIDMA) is 1.91 × 10⁻⁴ moles per day. This value, as per of the above equation [3], can be calculated by first summing across all foods (i, j,... n) the products of the DMA concentration in each food item ([am]f) times the ingestion rate of each food item containing it (IRf), and dividing the result by the molecular weight of DMA (MWam). In this example, it is calculated by multiplying the 95th percentile of the distribution value of the daily intake of DMA (0.123 milligrams per kilograms bodyweight per day from Phaneuf et al., 2004) by the body weight of an adult (70 kilograms), and dividing the result by 45 × 104 milligrams per mole to achieve the DIDMA in mole per day.
where:
- [NO 3¯]
- drinking water nitrate concentration of 45 mg/L as nitrate, converted to moles/L (HBV, as defined in section 10.1);
- TR
- transformation rate from nitrate into nitrite of 30%; and
- WC
- water consumption; 1.5 L is the estimated daily volume of tap water consumed by an adult.
We can then calculate the daily intake of the amine, in this case DMA, using equation [3] from above:
Figure 7. The equation used for calculating the daily intake of dimethylamine (DMA) in mole per day.
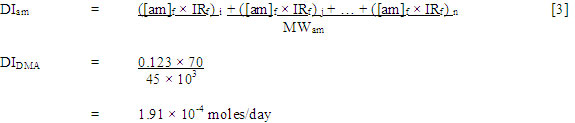
Figure 7 - Text Description
The daily dose of NDMA (DDNDMA) is 6.21 × 10⁻⁴ micrograms per kilogram body weight per day. This value, as per of the above equation [1], is calculated by first multiplying the square of 6.53 × 10⁻⁴ moles per litre, the previously calculated gastric nitrite concentration, by 1.91 × 10⁻⁴ moles per day, which is the total daily intake of NDMA, by the nitrosatability rate constant for NDMA of 0.002 moles per litre squared per second, then by 3600 seconds, and finally by the molecular weight of NDMA of 74 × 103 milligrams per mole. The obtained value is then divided by 70 kilograms to calculate the daily dose of NDMA.
where:
- ([am] f × IR f)
- the product of the amine concentration in a specific food item, multiplied by the estimated ingestion rate of specific food item, expressed in mg/day; this can also be calculated by multiplying the 95th percentile of the distribution value of the daily intake of DMA (0.123 mg/kg bw/day from Phaneuf et al., 2004) by the body weight of an adult (70 kg);
- MW DMA
- molecular weight of DMA (45 × 10 3 mg/mol); and
- i, j, ..., n
- specific food item.
The daily dose of endogenously formed NDMA is then calculated using equation [1]:
Figure 8. The equation used for calculating the daily dose of the endogenously formed NDMA
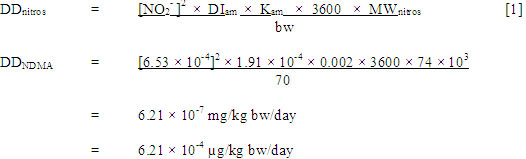
Figure 8 - Text Description
The excess cancer risk from NDMA is 6.5 × 10⁻⁶ (rounded). This value, as per of the above equation [4], is calculated by multiplying the previously calculated daily dose of NDMA of 6.21 × 10⁻⁴ microgram per kilogram body weight per day by NDMA’s human cancer potency factor of 1.04 × 10⁻² per microgram per kilogram body weight per day.
- [NO 2¯]
- gastric nitrite concentration (mol/L), calculated as 6.53 × 10 -4 moles/L;
- DI am
- total daily intake of amine (mol/day), calculated as 1.91 × 10 -4 moles/day;
- K am
- nitrosatability rate constant of 0.002 mol/L -2·s -1;
- 3600
- estimation of time during which concentrations of amine and nitrite precursors would remain constant through the oesophageal/cardia region; measured in seconds;
- MW nitros
- molecular weight of the specific nitrosamine (mg/mol), 74 × 10 3 for NDMA;
- bw
- average body weight of an adult, estimated as 70 kg.
Finally, the excess risk of cancer from the endogenous formation of NDMA from DMA is calculated as follows:
Figure 9. The equation used for calculating the excess cancer risk from NDMA (ERNDMA)

Figure 9 - Text Description
The excess cancer risk from NDMA is 6.5 × 10⁻⁶ (rounded). This value, as per of the above equation [4], is calculated by multiplying the previously calculated daily dose of NDMA of 6.21 × 10⁻⁴ microgram per kilogram body weight per day by NDMA’s human cancer potency factor of 1.04 × 10⁻² per microgram per kilogram body weight per day.
where:
- DD NDMA
- daily dose of endogenously formed NDMA calculated above (6.21 × 10 -4 µg/kg bw/day);
- CPF human
- 95% upper bound of the TD05 for liver carcinomas (1.04 × 10 -2 (µg/kg bw/day) -1) (Health Canada, 2011).
Based on exposure to nitrate in drinking water at a level equivalent to the HBV of 45 mg/L, the estimated lifetime excess cancer risk from the endogenous formation of NDMA is 6.5 × 10⁻⁶, which is in the range of risk considered to be essentially negligible.
Theoretically, ingestion of drinking water nitrate could increase the risk of cancer in humans to a level considered to be essentially negligible. Zeilmaker et al. (2010) reached the same conclusion for dietary nitrates, even after they took into account inhibition of endogenous nitrosation.
10.3.3 Risk characterization
The Quantitative Risk Assessment (QRA) described above incorporates several assumptions and inherent uncertainties. Despite the fact we used a number of worst case assumptions, the theoretical risk is still low. However, these numerical values should only be used as a rough estimate of the potential risk for the population exposed through drinking water.
NDMA was chosen as the model compound to be used in the QRA primarily because it represented the compound with the most available data to be used in the assessment. NDMA should not be considered to be representative of all NOCs.
Several other assumptions were made in order to conduct the QRA, including the assumption that NDMA is formed entirely from dimethylamine, through a direct relationship. The nitrosation of dimethylamine could be more complex, and several other nitrosated derivatives could be formed, limiting NDMA production. In addition, it has been demonstrated that some nitrosatable compounds can give rise to various different types of NOCs in the stomach, complicating the risk assessment (Mirvish, 1975a). The formation of C-nitroso compounds (most of which may be noncarcinogenic or weaker carcinogens than N-nitroso compounds) may compete with N-nitrosation for nitrite in the stomach. Another reaction which could compete with N-nitrosation is the formation of the unstable thiolnitrites (Crespi and Ramazzotti, 1991).
Despite these limitations, the model used for the purpose of this quantitative risk assessment makes it possible to identify some significant gaps in our knowledge regarding the factors that influence the most the nitrosamine formation: the rate of transformation of nitrate into nitrite and the exposure levels of amino compounds.
Nitrate exposure can be modified by endogenous synthesis. Although the majority of nitrate in the body arises from ingested nitrate, there is substantial endogenous synthesis of nitrate. This process is estimated to produce 1 mmol nitrate/day (equivalent to 62 mg of nitrate ions per day) in adults under normal conditions (Mensinga et al., 2003; WHO, 2007). This endogenous synthesis has complicated studies of the metabolism and pharmacokinetics of nitrate and nitrite, many of which can provide only qualitative or semi-quantitative data on their inter-conversion in vivo.
Other critical factors about which a gap exists are data on dietary concentrations of amino compounds (amine or amide substrates). Until there is more information on the dietary concentrations of amine or amide precursors, it will remain extremely difficult to assess the importance of the gastric formation of N-nitroso compounds in the etiology of cancer. There is also a need for accurate estimates of the rate of inhibition of the endogenous nitrosation. There currently exists a wide range of estimated values from different studies. A better characterization of the inhibition of the endogenous nitrosation may facilitate more accurate estimates of this parameter (Licht and Deen, 1988).
10.4 Comparison of cancer and non-cancer risk assessment
IARC (2010) has established a classification of nitrate in group 2A, stating "ingested nitrate or nitrite under conditions that result in endogenous nitrosation" is probably carcinogenic to humans. However, currently available scientific evidence from animal and human studies relating to endogenous nitrosation is insufficient as a basis for establishing a drinking water guideline based on cancer. However, it is possible to estimate the cancer risk related to a known nitrosamine, NDMA, formed through endogenous nitrosation at a specific level of exposure of nitrate in drinking water. Based on exposure to nitrate in drinking water at a level equivalent to the HBV of 45 mg/L, the estimated increased lifetime cancer risk above background for NDMA would be 6.5 × 10⁻⁶, which is within the range of risk considered by Health Canada to be essentially negligible (1 × 10⁻⁶ to 1 × 10⁻⁵).
10.5 International considerations
The U.S. EPA (1991) has established a maximum contaminant level (MCL) of 10 mg/L for nitrate-nitrogen or 45 mg/L for nitrate ion, based on acute clinical signs of cyanosis after nitrate exposure associated with methaemoglobinaemia in infants, and an MCL of 1 mg/L for nitrite-nitrogen or 3.3 mg/L for nitrite ion. It has also established a joint standard for the sum of the concentration of nitrate and nitrite at 10 mg/L as nitrogen. The combined standard does not replace the individual maximum contaminant levels for nitrate or nitrite, and therefore the maximum contribution from nitrite cannot exceed 1 mg/L as nitrite-nitrogen.
The Joint Food and Agriculture Organization of the United Nations (FAO)/WHO Expert Committee on Food Additives (JECFA) reconfirmed an ADI of 0-3.7 mg/kg bw for nitrate and an ADI of 0-0.07 mg/kg bw for nitrite (FAO/WHO, 2003a, 2003b). For nitrate, the ADI was based on a no-observed-effect level (NOEL) of 370 mg/kg bw/day as nitrate ion for growth depression, derived from long-term studies in rats and a subchronic study in dogs and using a safety factor of 100 (×10 for interspecies and ×10 for interindividual differences). Even though rats may not be a good model for humans, because of their low conversion of nitrate to nitrite in saliva, these studies were considered relevant for risk assessment based on a similar NOAEL found in dog and rodent toxicokinetics. JECFA also derived a "transposed" NOAEL for nitrate based on 1) a NOEL of 6.7 mg/kg bw/day for nitrite ion identified in a 2-year rat study in which heart and lung effects were observed at the next highest dose (Maekawa et al., 1982); 2) 5% conversion of nitrate to nitrite in saliva; and 3) an uncertainty factor of 50, resulting in an ADI of 0-3.2 mg/kg bw for nitrate; as this value did not differ substantially from the previous ADI, they did not change the ADI (FAO/WHO, 2003a). For nitrite, the ADI was derived based on the NOEL of 6.7 mg/kg bw/day for nitrite ion (Maekawa et al., 1982) and using a safety factor of 100. JECFA concluded that it would be appropriate to establish an acute reference dose for nitrite. EFSA (2008) found no new data that would require the revision of JECFA's ADI.
WHO (2007) established a drinking water guideline value of 50 mg/L as nitrate based on epidemiological evidence for methaemoglobinaemia in infants resulting from short term exposure, which is protective for bottle-fed infants and the rest of the population. Microbial contamination and subsequent gastrointestinal infection were noted as a significant risk for bottle-fed infants; as such, WHO recommends that water containing nitrate levels above 100 mg/L not be used for bottle-fed infants and making sure that the water is microbiologically safe. A drinking water guideline value of 3 mg/L as nitrite for short term exposure was established, also based on methaemoglobinaemia in infants derived from epidemiological data indicating that methaemoglobinaemia has been observed in infants exposed to doses of nitrite ranging from 0.4 to > 200 mg/kg bw, considering a body weight of 5 kg for an infant and a drinking water consumption of 0.75 L/day. WHO has also established a provisional drinking water guideline for long-term exposure to nitrite at 0.2 mg/L, based on a 60 kg adult, consuming 2 L/day with 10% allocation factor to the ADI of 0.07 mg/kg bw/day derived by JECFA (FAO/WHO, 2003a). This guideline is considered provisional owing to the uncertainty surrounding the susceptibility of humans compared with animals. For simultaneous exposure to nitrate and nitrite in drinking water, the sum of the ratios of the concentrations of each of its guideline values should not exceed one.
11.0 Rationale
Nitrate and nitrite are widespread in the environment. They can occur naturally or as a result of human activities, including agriculture and water treatment. The main route of exposure is from the ingestion of food; nitrite formed by the reduction of nitrate by oral bacteria represents approximately 80% of total exposure to nitrite.
11.1 Nitrate
Methaemoglobinemia has long been considered to be the end-point of concern for humans from exposure to nitrate in drinking water. Scientific studies show cases of methaemoglobinemia occurring in bottle-fed infants, which are the vulnerable population for these effects. Recent evidence from animal and human studies suggests that effects on thyroid gland function are also an end-point of concern. Studies have seen an effect in school-age children, but no study has looked at this health effect in infant, who would also be expected to be the most vulnerable population for this health effect. Current scientific evidence also suggests an association between cancer and exposure to nitrates in drinking water when conditions result in nitrosation within the human body. IARC has concluded that there is inadequate evidence in humans for the carcinogenicity of nitrate, but also classified ingested nitrates as probably carcinogenic to humans under conditions that result in endogenous nitrosation.
Scientific studies have consistently shown methaemoglobinemia as an end-point of concern for nitrate in humans, but only at concentrations greater than 45 mg/L in drinking water. However, these studies failed to account for confounding factors such as bacterial contamination of the drinking water. Infants are considered to be the most sensitive subpopulation for methaemoglobinemia.
Current evidence also suggests that exposure to nitrate in drinking water may alter human thyroid gland function. While studies found that exposure to nitrate concentrations greater than 50 mg/L are weakly associated with altered thyroid function, the evidence is limited, conflicting and based on studies with important methodological limitations. Infants are the most sensitive sub-population for this endpoint since the serum half-life and storage time of their thyroid hormones are much shorter. In addition, exposure to nitrate during pregnancy may affect thyroid hormone production, which could have some impact on foetal development.
Although no single study can be used to establish a guideline for nitrate in drinking water, available studies in humans show no adverse health effect (either methaemoglobinemia or thyroid effects) below 45 mg/L of nitrate in drinking water. For the purpose of this document, the human risk from cancer has been calculated based on the endogenous formation of a specific N-nitroso compound, NDMA, using a number of worst-case assumptions. The estimated lifetime excess cancer risk from the endogenous formation of NDMA associated with ingestion of drinking water containing 45 mg/L of nitrate is 6.5 × 10⁻⁶, which is in the range of risk considered by Health Canada to be essentially negligible (1 × 10⁻⁶ to 1 × 10⁻⁵).
The MAC for nitrate is established at 45 mg/L (equivalent to 10 mg/L measured as nitrate-nitrogen), to be protective of the health of the most sensitive subpopulation, bottle-fed infants. It is measurable and achievable by current treatment technologies (both municipal and residential scales). As part of its ongoing guideline review process, Health Canada will continue to monitor new research in this area and recommend any change to the guideline that it deems necessary. Monitoring of science will focus particularly on thyroid effects, including neurodevelopmental effects, in the most sensitive subpopulation.
11.2 Nitrite
Nitrite-induced methaemoglobinemia has been chosen as the endpoint of concern for nitrite in drinking water. Infants have been identified as the most sensitive sub-population for this endpoint since 1) their stomach pH is less acidic, promoting the growth of bacteria that convert nitrate to nitrite, which binds to haemoglobin to cause methaemoglobinemia, and 2) the amount and activity of the enzyme which reduces methaemoglobin is deficient in infants until approximately 6 months of age.
The guideline for nitrite in drinking water is established as maximum acceptable concentration of 3 mg/L (equivalent to 1 mg/L as nitrogen). The MAC is protective against endogenous and exogenous formation of nitrite-induced methaemoglobinemia in bottle-fed infants and the general population. As part of its ongoing guideline review process, Health Canada will continue to monitor new research in this area and recommend any change to the guideline that it deems necessary.